Embed Size (px)
Citation preview
Industrial Energy Efficiency Policy International practice and experience
analyzed for application in Egypt
2014

2
Industrial Energy Efficiency Policy International practice and experience
analyzed for application in Egypt
Prepared by
Copyright © 2014 United Nations Industrial Development Organization

3
Preface
This report presents the written deliveries of Ea Energy Analyses and Aura
Energi in the UNIDO technical assistance on Development of an industrial en-
ergy efficiency policy and strategy in Egypt1 and the amendments outlined in
the Inception Report, dated 1st March 2014.
The technical assistance project is just one of several sub-projects under the
UNIDO funded industrial energy efficiency (IEE) project which started in Janu-
ary 2013 and is expected to run for 5 years2. This larger project consists of 5
components. A team of Egyptian consultants were been assigned to carry out
Task 1.6 “IEE policy”, namely Logic Energy Consulting and Environics SAE. The
core of the assignment given to Ea Energy Analyses A/S and Aura Energi has
been to develop the methodology and framework for strategy and policy de-
velopment and to provide support to the Egyptian team.
UNIDO project
1: National program to define energy benchmarks and EE policy
– 1.1 Support in the adoption and dissemination of EMS
– 1.2 Structure in place for M&V of compliance with EMS
– 1.3 Industrial energy database and energy consumption benchmarks developed.
– 1.4 EMS practical guide development
– 1.5 Post-project action plan
– 1.6 IEE policy
2: Awareness raising on industrial energy efficiency and management in industry
3: technical capacity building on energy efficiency services
4: Access to finance for EE improvement projects
5: Implementation of energy management systems and system optimisation
Figure 1: Work components of the industrial energy efficiency project. This deliverable is part of 1.6..
The present report contains the first of three deliveries foreseen in the con-
tract, namely: “International practice and experience”. In following deliver-
ables “Strategy methodology and framework” and “Policy methodology and
framework” will be covered.
The assignment was carried out in the period February 2014 – July 2015 and is
based on review of a broad selection of relevant literature. A special effort has
been made to include recent literature (2012-2014). The majority of the litera-
ture has an European or perspective, however also many with a global cover-
1 SAP# 100349, described in the RFP 700000439, dated 25
th November 2013,
2 Project no. GF/EGY/12/001

4
age, and examples from Latin America (Assumpção, et al., 2013) (Fossa, et al.,
2013), Japan (Kimura, et al., 2014) (Shibata, 2013) and China (Levine, et al.,
2011) (Shi, et al., 2014) (Zhao, et al., 2013) and New Zealand (New Zealand
Ministry of Economic Development, 2011) has been used. Arab countries are
represented by (Elrefaei, et al., 2014) (GEF-UNDP, 2009) (Logic Energy and
Environics, 2014) (Secretariat of the Arab Ministerial Council for Electricity,
November 2010).
Mikael Togeby

5
Contents
Preface ........................................................................................................... 3
1 Executive summary ................................................................................ 7
Part I: Framework for industrial energy efficiency policy ............................. 11
2 Introduction to Part I ............................................................................ 12
3 Egyptian context ................................................................................... 13
3.1 Egypt’s challenge ........................................................................... 13
3.2 EE policy ........................................................................................ 15
3.3 Industrial energy efficiency instruments ........................................ 16
4 Energy efficiency in industry................................................................. 18
4.1 Characteristics of the industrial sector ........................................... 18
4.2 Financing an EE project .................................................................. 21
5 Key consideration in policy development ............................................. 23
5.1 Policy instrument type ................................................................... 23
5.2 Policy development process .......................................................... 27
Part II: Selected energy efficiency instruments ............................................ 36
6 Introduction to part II ........................................................................... 37
7 General information and campaigns .................................................... 40
7.1 Characteristics ............................................................................... 40
7.2 Examples ....................................................................................... 41
8 Energy audits ........................................................................................ 46
8.1 Characteristics ............................................................................... 46
8.2 Examples ....................................................................................... 49
9 Energy management systems ............................................................... 54
9.1 Characteristics ............................................................................... 54
9.2 Examples ....................................................................................... 57
10 Energy efficiency obligation ................................................................. 61
10.1 Characteristics ............................................................................... 61
10.2 Examples ....................................................................................... 63

6
10.3 Recommendations for Egypt .......................................................... 66
11 Electric motor systems ......................................................................... 67
11.1 Why motors systems? ................................................................... 67
11.2 Illustrative examples ...................................................................... 71
11.3 Recommendations for Egypt .......................................................... 79
Part III: References ....................................................................................... 83
12 Additional information ......................................................................... 84
12.1 Keeping updated ........................................................................... 84
12.2 References .................................................................................... 87
12.3 Useful links .................................................................................... 92
12.4 Abbreviations ................................................................................ 93
12.5 Acronyms ...................................................................................... 93

7
1 Executive summary
From 1998 to 2009, Egypt’s electricity consumption increased with 7% p.a.
This growth corresponds to a doubling of demand every ten years. Such a
growth is a challenge for any system, and exploiting profitable energy effi-
ciency projects can help alleviate the burden on the system. About 45% of
total final energy is consumed by industry (Blanc, 2012) and 33% of the elec-
tricity is consumed by industry. It is therefore highly relevant to aim to realise
the profitable savings opportunities within the industrial sector.
It is generally recognised, that even well run companies do not necessarily
realise energy efficiency (EE) opportunities even if these have a very short
payback time. The focus of the companies is – as it should be – on their core
business. This can be described as bounded rationality, where limited time is
used for finding solutions and simplified rules are based on former experi-
ences (in contrast to an ideal search for optimal solutions)1.
If EE can become an integrated element in the management of the business it
is more likely that opportunities will be exploited, e.g. in form of a systematic
energy management system (EMS). If professional assistance can be provided
from outside – such as mandatory energy audits – then awareness of the en-
ergy efficiency improvement potential is raised and can bring the companies
one step closer to realising the benefits.
In many countries the industrial sector represents a challenge for policy mak-
ers. It may be politically difficult to subject the industrial sector to energy effi-
ciency requirements, since the fear is that this might influence the com-
petiveness of the industry negatively. However, a well-planned and balanced
IEE policy can reduce total costs2 and can improve quality and productivity.
There is no ideal strategy or policies – they will always be political compro-
mises made in a given context at a given point in time. Nor is there a one-fits-
all policy that is effective in all contexts. The conceptual idea of an approach
may be transferable while the design details have to be modified in order to
achieve a satisfactory impact at a reasonable cost. The formulation of new
strategies and policies should be sensitive to national traditions and current
possibilities. Furthermore, an industrial energy efficiency (IEE) strategy and
1 See: (Nehler, et al.)
2 Here total costs refers to the cost of the IEE instruments and the end-users costs (investments and energy
costs).
Industry matters
Energy efficiency does
not happen automati-
cally
Context defines effec-
tiveness

8
the accompanying policy portfolio are just one element of a larger collection
of strategies and policies aimed to guide the development of a given society.
This report presents examples of international IEE policy practice and experi-
ence and suggests a methodology and framework suited for development of
an Egyptian IEE strategy and affiliated policies. When searching for best prac-
tise, the starting point of this report is to look for:
Significant impact (net impact)
Total costs test is positive (Total cost is below total benefits)
However, evaluation of IEE are few and not always consistent in methodology.
Therefore, in many cases the relevant information is not available and a more
qualitative assessment have been made.
Emphasis has in the collection of examples been on illustrating key elements
and not necessarily to describe all possible instruments and variations of
these.
A summary of the recommendations for the elaboration of an IEE policy port-
folio for Egypt are presented below. Some of the recommendations relate to
good governance in general while others relate to how to address EE in indus-
try.
The starting point for the analysis of which policy instruments to recommend
to Egypt is an understanding of the understanding of IEE:
Many IEE solutions are well proven technology and not technically difficult. The challenges are more an issue of awareness, capacity, and financing. E.g. with the right support from management, qualified en-gineers can come a long way in daily operation and when purchasing new equipment.
Energy prices reflecting true market costs (and environmental impact) are critical to creating EE interest. True market prices is understood as marginal (opportunity) costs.
Even in countries with high energy costs and high environmental con-cern the full potential for EE is not realised on its own accord. It is necessary to use policy instruments to drive forward an interest in and uptake of IEE.
All serious IEE instruments must be financed. If no commitment exist for operating, maintaining and evaluation the activity it is not likely to succeed.
The mind-set matters – Change management’s perception of IEE from “necessary evil” (aim for minimum required) to “opportunity” (aim:
Understanding IEE

9
maximum benefits) i.e. combine IEE with other development objec-tives such as security of supply, reducing strain on water resources, upgrading skills of labour force and increased productivity.
Stability – Consistent high level political attention to IEE is key to EE capacity building and signalling to industry that EE is and will be a se-rious matter. This should be matched by actions in form of relevant legislation and financing.
In developing an IEE policy portfolio the following observation scan be done:
A combination of several policy instruments – a policy portfolio – is typically more successful than an alone standing policy instrument.
Stakeholder consultation already in the early phases of strategy and policy formulation can be critical to success.
Dynamic policies – Monitoring and evaluation at regular intervals are necessary for developing and adjusting policies dynamically to the lat-est needs and challenges. Energy audits and EMS can for example provide valuable individual information not only to company man-agement but for future policy-making, e.g. about IEE potential.
EE can be a cost-effective solution – It is imperative that it is commu-nicated to industry that EE does not require subsidies – it makes eco-nomic sense in its own right seen from an industrial company per-spective as well as a societal perspective. Subsidies tends to attract free-riders: Companies getting subsidies to activities they would have done also without the subsidy. Also, with Egypt’s history of low en-ergy prices – subsidies should be avoided.
Get started now! – Political negotiations and organisational capacity building takes time. But there is no reason to wait until everything is in place. It is possible to harvest good progress by starting small and immediately by addressing energy intensive industries.
Market segmentation of the industrial sector is important. Industrial companies with large energy costs are likely to be more sensitive to EE. Large energy cost can be related to high energy intensity or large scale of operation. Companies with high energy costs should have first priority, when developing IEE activities. It can be a challenge to design economically efficient activities for industrial companies with a mod-est energy bill, e.g. below 100,000 USD/year.
The industrial sector is very heterogeneous in its energy use and a balanced approach offering both energy audits (external consultants) and energy management systems (company internal activity). And in particular EMS should be combined with an incentive to perform well, e.g. through certification and if relevant also linking tax rewards to ambition level for EE implementation.
Certain types of policy instruments require significant regulatory ca-pacity to verify compliance and uphold a reasonable level of compli-
How to develop a port-
folio?

10
ance and achieve real impact. Examples include minimum efficiency standards, market transformation, white certificates and voluntary agreements. ESCO can be relevant is special cases. However, in many situations the risk associated to IEE is limited and an ESCO solution may only add cost and complexity. Such activities can be very relevant in the long term but are probably not best suited as first steps to IEE in Egypt.
Based on the overview of international practise with IEE policy instruments,
we point at five candidates for instruments that should be considered rele-
vant for Egypt as first steps to increase IEE. The instruments must be adapted
to the local context to be effective. The five instruments are:
General information and campaigns. Using information to promote IEE is relevant and can support a growing concern for the topic and can help other instruments like energy audits and Energy manage-ment systems (EMS) to be effective.
Energy audit can help with concrete and detailed information about profitable project at the individual facility. Energy audits can be made mandatory for the largest energy users. Universities can offer audits to all types of companies.
EMS is a systematically approach to dealing with energy and IEE in all aspects for the production. The responsibility for effective EMS is on the industrial management. Tax reduction can be used to incentivise large energy users to use certified EMS.
Energy efficiency obligations on energy companies is a way to invent an actor that can finance and run activities to promote IEE. EU con-sider this as a recommended instrument, and Egypt could design obli-gations to fit their conditions. In Europe subsidies are often used by the obligated party, but that may not be relevant in Egypt.
Activities can also be developed around a specific technology, e.g. motor systems. Motor systems is the motor and the equipment that it is driving. A significant share of industrial electricity use (often more than half) is use in motors. The actual instruments to promote higher efficiency in motor systems may for a start include campaigns, label-ling and can be relevant in energy audits and EMS.
Other IEE policy instruments is also possible for Egypt. However, these five are
all good candidates and international practise can guide the design of instru-
ments.
Candidates for IEE in-
struments

11
Part I: Framework for industrial energy effi-ciency policy

12
2 Introduction to Part I
The aim of “Part I: Framework for industrial energy efficiency policy” is to
present international practice of developing IEE policies presenting the pros
and cons and lesson learned that may be of relevance to the Egyptian context.
The purpose is develop a perspective to be used when analysing the many
possible IEE instruments.
The Egyptian context: A short introduction to IEE in Egypt.
Energy efficiency in industry: EE in industry has other challenges and characteristics than, e.g. households. This chapter highlights the spe-cial nature of IEE.
Key consideration in EE policy development. What is the success crite-ria? How can industry be divided into segments? Why is evaluation important?
The chapter Key consideration will in a following deliverable be further devel-
oped into a report about strategy and policy methodology and framework.
In the report, we distinguish between policy instrument type and the design
features of a given policy instrument. For example, an audit program is an
instrument type and it can be designed in a variety of different ways.
The term "industry" is used for private and public production entities, exclud-
ing energy companies. Agriculture, fishery, and forestry are in principle in-
cluded but are not the primary targets. The term "industry" does not include
any private or public tertiary sector entities.
Definitions

13
3 Egyptian context
This chapter describes the main challenges of Egypt’s energy policy frame-
work and give a short introduction to current energy efficiency policies and
industrial energy efficiency instruments. The chapter is based on the baseline
report prepared by Egyptian experts, assigned to develop an IEE policy for
Egypt (Logic Energy and Environics, 2014) where no other reference is men-
tioned.
3.1 Egypt’s challenge
The Government of Egypt intends to continue the transition to market based
energy prices. In 2014 the supply of local natural gas have not been able to
follow the demand and the marginal natural gas demand are now paid at in-
ternational import prices.
This transition to international market prices is a politically difficult task and
measures to alleviate the strain placed on end-users are required. The Egyp-
tian situation is worsened by the prospects of expected increases in global
fuel prices, as for example illustrated in the scenario analyses presented in IEA
World Energy Outlook where fuel prices continues to increase in the period up
to 2040 (IEA, 2013). Energy efficiency (EE) can, if tailored carefully, lead to
greater consumer acceptance of and protection against price increases (see
Figure 2). EE can provide solutions faster than supply-side options. IEE can
contribute to making Egypt and the individual industrial companies more ro-
bust against the expected global increases in fuel prices and at the same time
contribute to more sustainable energy exploitation (i.e. limit energy demand
and exploit fossil fuels more efficiently).
Looking at the situation from the opposite perspective one may claim that the
foreseen price increases can be used as leverage for kick-starting an interest
in energy efficiency which also has other benefits to society and the industrial
companies involved (Cambell, et al., 2012). IEE can for example go hand in
hand with a development in direction of modernisation of industry and indus-
trial management, e.g. in the form of energy management systems. Increased
productivity and competitiveness can be positive side effects of IEE activities
(IEA, 2014).
Furthermore, countries such as Egypt with growing economy have an oppor-
tunity to pursue energy efficiency at only moderate additional cost, e.g. in
relation to developing new production lines.
Aspirations
Alleviate strain
Opportunities

14
Figure 2: Perspectives on EE.
Far from all profitable EE improvements are realised on their own accord –
not in Egypt nor elsewhere – and it is widely recognised that public interven-
tion is necessary if a larger share is to be realised. When industrial companies
do not realise profitable investment it is often because they have other priori-
ties, like product quality and production volume. Many companies do not
have capability (staff and management focus) needed to also focus on IEE.
Years of energy prices below marginal opportunity costs means that the Egyp-
tian industry has only had little incentive to optimise their energy consump-
tion. Industry focus has been on acquiring sufficient energy. There is therefore
little tradition for management to consider EE and most likely few industrial
companies have assigned persons with the responsibility for EE.
The total final energy consumption was 50 Mtoe (2008), and 42% of this was
used in industry. Industrial consumption have experience a growth of 4.1%
p.a. (2000/2001 to 2011/12). The three sub sectors steel, cement and fertiliz-
ers accounts for 55% of the industrial energy consumption.
Energy prices are controlled by the government and were fixed for long time
(e.g. 1992-2004). In recent years price increases has taken place and for en-
ergy intensive industry prices has reach production costs, but still not reached
opportunity costs (export price or cost for reduced import).
The current supply crises for natural gas in Egypt highlight that “all demand is
marginal demand” (any reduction en natural gas consumption would reduce
the last, most costly provision of gas). Electricity is primarily produced on
natural gas (more than 70% is based on natural gas). Natural gas is also used
EE practice
Energy consumption
Energy prices

15
e.g. for cement production – internationally, cement factories use coal and
waste.
Figure 3 shows the electricity price for industry in Egypt (2012). These prices
are very low compared to international market prices.
Figure 3. Electricity prices for high voltage consumers. 2012.
International comparison indicate that Egyptian industry has a lower energy
efficiency than what can be found in comparable countries. A study (Missaoui,
et al., 2012) indicated that the Egyptian industrial electricity price was only
25% of the price in Palestine, which in this study was used as a benchmark for
an international market price.
Energy pricing policies are not addressed in this report; it is treated as integral
to the supply-side. Never-the-less a sound price signal is critical to a well-
functioning, modern energy system. It includes market based pricing (mar-
ginal cost including environmental costs)1.
3.2 EE policy
The Council of Arab Electricity Ministers of the League of Arab States has
adapted the Arab EE Guideline in 2010. The guideline is inspired by the EU
1 Furthermore, policies aimed at load shifting or energy/fuel switching are not included, although also
relevant to Egypt. Correct dynamic pricing, especially for electricity, can be important due to the current supply constraints. Advanced tariffs may include time-of-use tariffs (fixed schedule), real-time pricing (e.g. hourly spot prices), or critical peak-pricing (fixed schedule combined with high or low prices that can be dispatched e.g. with a day’s notice).
0
1
2
3
4
5
6
7
Energy intensive industry Medium industry Other industry
US
cen
t/kW
h
Flat Off peak Peak

16
directive 2006/32/EC on energy end-use efficiency and energy service. The
guideline states that the “RE/EE Expert committee set up in accordance with
the decision of the Council of Arab Ministerial Council for Electricity No. 127,
and the committee's work groups shall be responsible for monitoring the im-
plementation of this guideline in coordination with regional and international
institutions and specialized research centers.”1
The National Energy Efficiency Plan 2012-2015, prepared by the Energy Effi-
ciency Unit for the Council of Ministers, approved by the Cabinet 11 August
2012, sets a target for 2025 of 5% cumulative electricity saving relative to the
annual average of the period 2008-2012 (Energy Efficiency Unit, 2012). How-
ever, IEE is limited to building energy audit capacity. The fact that the respon-
sibility for the energy sector development is split between two ministries –
Ministry of Electricity and Energy and Ministry of Petroleum – can present a
challenge in terms of formulating plans for primary and final energy. (Elrefaei,
et al., 2014)
“Taking action through industrial consumers can generate results with a rela-
tively small number of participants if the appropriate ones are targeted. For
instance in Egypt, where more than 40% of total energy is consumed by the
industrial sector, the energy intensive industries represent 1% of the number
of factories and consume 65% of the industry energy share. Clearly these few
consumers can significantly contribute to EE efforts. The most widespread
potential exists in co-generation, waste heat recovery, fuel switching and im-
proved process control.” (RCREEE, 2013) However, there is likely to be EE po-
tentials that are more easily realised.
3.3 Industrial energy efficiency instruments
Reform of the pricing system is underway. Apart from this only little public
activity is currently targeted to promote IEE. In the last decades several large
demonstration projects has focused on energy audits. These have been donor
based arrangements and have not been transposed to permanent activities.
Probably, low energy prices have hindered the success of these activities.
There is no designated EE agency “responsible for formulating, promoting,
and implementing EE policies. There is an EE unit at the Council of Ministers
1 Agree during their 26th Executive Bearue meeting that took place in Cairo on 23 November 2010 (decision
no. 95 /26/2010). See also: (Secretariat of the Arab Ministerial Council for Electricity, November 2010)

17
secretariat that is identified as the mandated entity for development and im-
plementing a” national EE action plan. (RCREEE, 2012)

18
4 Energy efficiency in industry
Seen from a policy-maker perspective the industrial sector is distinctly differ-
ent from other energy consuming sector of the economy, such as the residen-
tial sector or the tertiary sector.
4.1 Characteristics of the industrial sector
The industrial production set-up is frequently highly individual (e.g. opera-
tional control) although certain technical components appear in many produc-
tion systems (e.g. motors, pumps, compressed air, ventilation, cooling, and
boilers). Policies can be composed to target such standard components but
many EE decisions are best made locally because of the importance of system
perspective, control systems and maintenance, i.e. within the individual in-
dustrial company or branch organisation. This limits the possibilities for ge-
neric minimum EE requirements per produced unit since many of the really
significant EE improvement opportunities a specific to the individual company.
Policies aiming at helping the individual industrial companies identify EE op-
portunities are thus of high value.
Industrial companies are typically exposed to competition. In most cases the
primary competition factors of their products are price and quality. Many
companies are highly sensitive to changes in production cost: It can therefore
be difficult to introduce taxes on energy with the aim to stimulate EE interest
although taxes in general are considered to be a cost-effective policy instru-
ment. Especially companies that are both energy intensive and exposed to
competition from other countries are typically considered particularly vulner-
able to taxation regimes.
If, for example, 20% of the industrial companies represent 80% of the indus-
trial energy consumption then it is important that these are addressed ade-
quately in the IEE strategy. The same holds true for industry subsectors that
are experiencing growth: making sure their utilisation of energy is efficient
avoids unnecessary “lock-in” of future energy consumption1.
When designing EE policies it should be kept in mind that there is a great span
between small artisan companies to highly industrialised and automated
companies in terms of local employment, technology complexity, required
1 It is considered as lock-in, if e.g. a company invest in a new production line without considering the EE
options. For the life time of the production line it may be difficult to improve the efficiency.
Heterogeneous sector
Taxation possibility
Differentiated policies

19
skills, innovation, and management. In addition, some companies are part of a
larger conglomeration of companies – sometimes international – and there-
fore best addressed together.
IEE is not necessarily technically difficult. Although the individual technological
component may be high tech (e.g. a variable frequency inverter), installation
and operation is a standard job for an engineer. The overall challenges are
more an issue of awareness and capacity.
Tanaka (Review of policies and measures for energy efficiency in industry
sector, 2011) gives the following list of types of IEE projects:
Maintaining, refurbishing and retuning equipment to counter natural efficiency degradation and to reflect shift in process parameters
Retrofitting, replacing and retiring obsolete equipment, process lines and facilities to new and state of the art technologies
Using heat management to decrease heat loss and waste energy, e.g. by prober use of insulation or utilization of exhausted heat and mate-rials from one to another process
Improving process control, for better energy and materials efficiency and general process productivity
Streamlining process – eliminating processing steps and using new production concepts
Re-using and recycling products and materials
Increasing process productivity – decreasing product reject rates and increasing material yields
This description highlight the link to productivity. New production methods or
new production lines may improve EE significantly.
The following is required for an EE demand from the industrial sector and a
well-functioning IEE market1:
Awareness among the industry of the EE possibilities and of how to realise these.
1 Many taxonomies have been used over time. Another and more detailed taxonomy, developed recently
can be found in “A novel approach for barriers to industrial energy efficiency”; Andrea Trianni, Enrico Cagno, Ernst Worrell, and Giacomo Pugliese; Renewable and Sustainable Energy Reviews 19 (2013); Elsevier Publisher; December 2012. Here emphasis is placed on segregating barriers internal and external to the company. The types of barriers include 6 internal with 27 subcategories and 6 external with 17 subcateg o-ries.
Awareness
Examples of IEE
Creating an EE demand

20
Information on the current state of energy consumption and the EE potentials in typical industries or dominant technologies (motors, fans, pressurised air etc.)
Availability and access to EE expertise and skills (industrial compa-nies, key institutions, external experts and service providers including e.g. an understanding among investors and financiers of potential fi-nancial returns of EE).
Availability and access to EE technologies and solutions.
Perhaps a driver (in addition to the energy price signal) to create an interest among industries to take action well prior to the energy price increases.
In addition, there are barriers to IEE that can also be very important to ad-
dress, namely corporate and management cultures directly or indirectly re-
lated to energy efficiency. Examples include:
Focus on investment costs rather than considering the recurrent en-ergy costs arriving at life-cycle costs,
Focus on large investment opportunities rather than more modest in-vestments in improved day-to-day operation or systemic optimisation, and
The general skills and mandates of the work force and the training re-gime for updating and upgrading these.
Ideally, an industrial company should consider EE possibilities in
the day-to-day operation & maintenance (O&M),
when replacing existing equipment, and
when making a purchase decision regarding new production equip-ment or major product line modifications.
The key persons that influence these three activities will be the primary target
groups for policies aiming to promote EE and the policies must be designed to
target the time of decision-making (see Table 1Error! Reference source not
found.).
Company culture

21
Company activity Time of occurrence Primary target group
Operation & maintenance Steadily Staff
Retrofit (EE improvement of
existing equipment) Occasionally
Staff,
External consultants
or suppliers
Replacement of existing
equipment
Natural (at end-of-life /
breakdown)
Staff,
Management
Forced Management
Purchase of new production
equipment or major product
line modifications
Production expansion
or alteration
Management,
Cooperate manage-
ment
Table 1: Time of occurrence of company activities that influence EE levels and the primary groups making decisions regarding the company activities.
Experience from the Japanese energy management scheme underlines the
fact that the ability of a company to benefit from a policy promoting for ex-
ample establishment of an energy management system depends among other
things on the energy intensity of the company and the organisational capacity.
Figure 4: Categorisation of companies by salience of energy use (here: energy cost share of total costs) and organisational capacity (Kimura, et al., 2014).
4.2 Financing an EE project
Industrial companies have limited capital for investment and typically require
repeated loans for investment in their production. Since EE is not their core
business they are often hesitant to take up loans for investment in EE pro-
jects. The reason is that any loan/debt and any asset including those of the EE
project will figure in their balance sheet and will be scrutinised by a potential
investor. Taking a loan for an EE project might mean that the company cannot
take a loan for a core production investment.
It should be noted that experience shows that about 80% industrial compa-
nies only consider the payback period when deciding on investment in EE and
An industrial company
perspective

22
not profitability indicators such as internal rate of return (Jochem, 2014).
Their focus is in other words on the upfront investment cost instead of the full
cost and benefit – including life time of investments.
Many IEE investments can be considered as part of daily operation, e.g. when
replacing a broken component (e.g. a motor). However, in some cases specific
financing is required. There are three core types of investors available to in-
dustrial companies to acquire financing for EE projects: Bank loans, green
loans, and equity loans. An industrial company is not likely to be able to ob-
tain the main share of the investment from a bank for EE projects relying on
new technologies or unproven concepts unless their balance sheet is large
and robust. In these cases green funds and equity funds are more likely to be
interested.
Mainstream Non-mainstream Invention
EE technology Proven tech-
nologies New technologies
Unproven
concepts
Risk perceived by investors Low risk =>
low return Known risks
High risk =
potentially
high return
Type of investor most likely
to finance the main share of
the investment
Bank Green loan Equity
Typical maximum share that
a normal bank will provide
of the total required in-
vestment
60-90% 50-80% None or
minor
Table 2: Financing options by type of EE project. (Dorine Putman-Devilee, 2014)
An IEE strategy therefore frequently contains elements to alleviate barriers to
financing of EE projects. However, Egypt may focus on promoting well-proven
mainstream technologies. This reduces the need for special financing mecha-
nisms.
An investor perspective

23
5 Key consideration in policy development
The aim of any energy strategy is to provide sufficient energy to facilitate the
intended economic activity – in other words to ensure sufficient, reliable,
robust, cost-effective, and clean energy.
There is no ideal strategy nor policies. They will always be political compro-
mises made in a given context at a given point in time. A policy that may be
effective in one context is not necessarily effective in another, nor the most
cost-effective. The conceptual idea of an approach may be transferable while
the design details have to be modified in order to achieve a satisfactory im-
pact at a reasonable cost.
The formulation of new strategies and policies should be sensitive to national
traditions and current possibilities. Furthermore, the industrial energy effi-
ciency (IEE) strategy and policy portfolio are just one element of a larger col-
lection of strategies and policies aimed to guide the development of Egypt
(see Figure 5Error! Reference source not found.).
Figure 5: The IEE strategy and policy portfolio is just one of several other.
In this chapter a methodology and framework for designing and implementing
efficient EE policies are discussed.
5.1 Policy instrument type
Seen from the end-user perspective there are three classic types of policies,
Egyptian society
Industrial sector
Energy sector
Energy efficiency
Industrial energy efficiency
Policy A
Policy B
Policy …
IEE policy portfolio
Visions and development strategies
Types of policies

24
namely informative, economic, and normative1.
Figure 6: The three classic policy instrument types.
Examples and pros and cons are shown in Table 3Error! Reference source not
found.. Please note that although the energy price itself is not counted as part
of the economic instruments it is key to achieving EE.
1 Many classification systems exist for EE instruments. E.g. (Review of policies and measures for energy
efficiency in industry sector, 2011) uses 1) Prescriptive policies (e.g. regulation, voluntary agreements), 2) Economic policies and 3) Supportive policies (e.g. energy audits, capacity building and technical informa-tion. Institute for Industrial Productivity (Reinaud, et al., 2011) uses a pyramid of: 1) Effort-defining policies (in the top of the pyramid with mandatory targets, negotiated agreements and minimum energy norms), 2 Supporting measures (in the middle with financial incentives/disincentives, energy management and audits and equipment standards) and 3) Implementation Toolbox (in the base, with Energy management proto-cols, technology lists, networking, workshops).
Informative
Normative Economic

25
Instrument type
Example Pros Cons
Economic
Taxes
Generally considered efficient: All decisions taken by end-users. Revenue to state. Do not have to be renego-tiated very often.
Often difficult to get accepted, e.g. by industry.
Subsidies to EE in-vestments
Good attention.
Only temporary funding? High level of free riders? Too high cost for docu-mentation? Cost for state
Informative
General information and campaigns (bro-chures, internet tools)
Low costs. Easy to implement. Can support other instru-ments
Often little impact. Often slow impact.
Labelling (buildings, equipment, appli-ances, vehicles)
Can be a forerunner for minimum efficiency stan-dards
Often little impact.
Tailored information (audits, energy man-agement systems, EE networks)
Takes into account the special needs and situa-tion of the end-users. Enables the end-users to make EE decisions.
Relatively costly. Does not automatically lead to EE implementation
Normative
Minimal efficiency standard (building codes, appliance standards)
Creates a push. Suited for standardised use of appliances. Can be very cost-effictive.
Difficult in industry. Compliance verification.
Hybrid Voluntary agree-ments
End-user commitment to reaching agreed targets.
Not suited for smaller entities.
Hybrid with RD&D
Technology procure-ment
Creates a market push and a pull at the same time. Can be very cost-effective.
Requires strong coordi-nated by neutral entity.
Table 3: Strengths and weaknesses of different types of policy instruments.
The informative policies leave a high degree of freedom and the underlying
assumption is that if the end-user has the right and sufficient information they
will make an energy efficient choice. The dilemma is that even if end-users
respond as intended the uptake may not happen as quickly as needed.
Economic and normative instrument can on the other hand create such as
push. Economic policies assume that the end-user is motivated by economic
signals and implement measures that are cost-effective from the end-user’s
perspective. However, in fact the price responsiveness (i.e. price elasticity) of
the different end-users varies and other non-economic factors may be more
important the end-users.
The challenge of normative policies is to ensure compliance. If the norms i.e.
the requirements, are perceived a too strict by the end-users, then compli-

26
ance is likely to fall. In some contexts normative instruments are acceptable
(i.e. crime) while in others they are less popular. For IEE normative instru-
ments can have a limited scope because of the varied use of equipment. One
pump may be used for a few hours per year (and a high efficiency pump may
not be economical), while another pump may run all year. Important when
considering normative instruments is to assess the possibilities for checking
compliance and issuing penalties in case of non-compliance. If compliance
cannot be verified at a reasonable cost or at all, then a normative instrument
is not suited. Penalties must be high enough to be deterring – otherwise you
will end up with end-users just paying the penalties and no EE improvements
will take place.
Voluntary agreements can said to be a hybrid of the three classic policies since
it typically entails that the end-users voluntarily commit to carry out certain
EE activities or reach a certain EE improvement level in return for economic
rewards and information. The inferred threat is that if the companies do not
enter an agreement voluntarily then the government will use other and
harsher policy instruments to achieve its goals.
Technology procurement is a hybrid between RD&D policies and the other
four policies and, for example, the Swedish Energy Authority has used tech-
nology procurement with success. The technology procurement programme is
a bidding process to stimulate and accelerate the development of new tech-
nologies. Technology procurement aims to develop new products, systems or
processes and initiate a market shift towards new energy efficient technolo-
gies. The programme defines new buyer requirements, which are established
by a group of purchasers (see below) who are more demanding than products
currently on the market. These new buyer requirements then help to acceler-
ate the introduction, adoption and use of new technologies into the wider
marketplace (Reinaud, et al., 2011).
The choice of policy instruments depends on:
The urgency for achieving results – How large a share of the target group needs to react as intended and how soon?
The readiness of the entire system for the policy – Do all the market elements exist and is the political system ready to launch, monitor, and enforce the policy?
The environment of political acceptance – What is politically possible within the current political context and traditions?
Policy choice
27
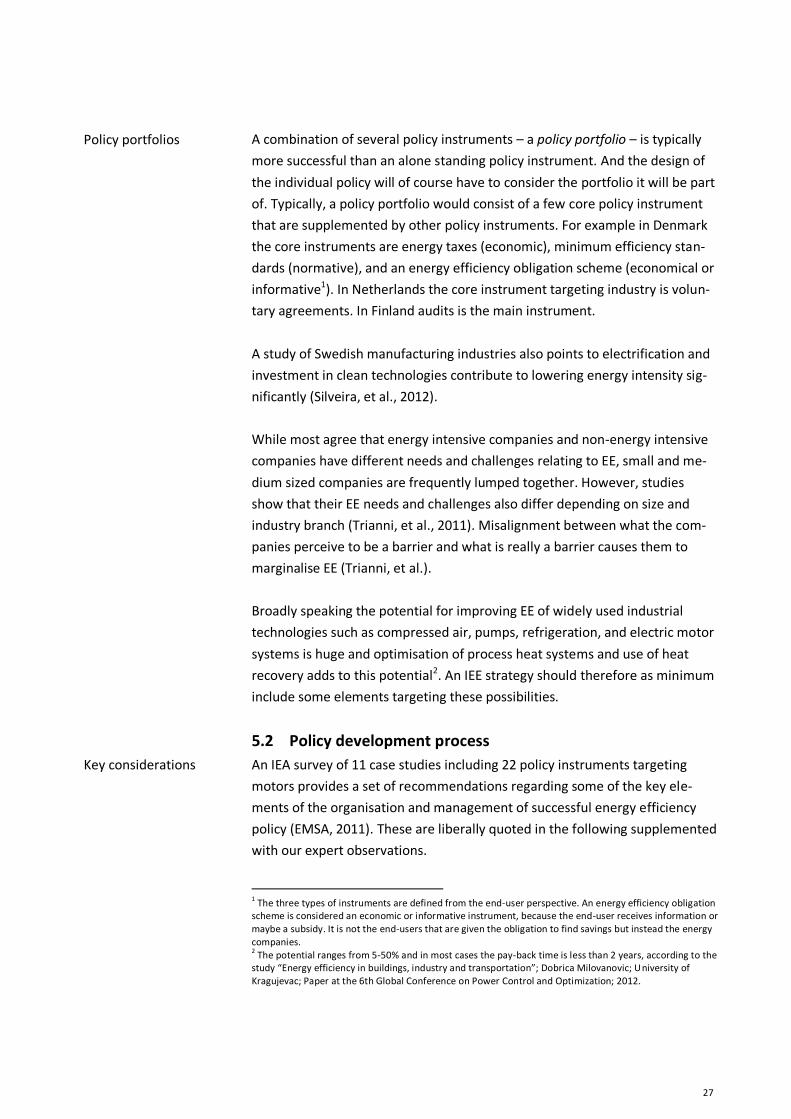
A combination of several policy instruments – a policy portfolio – is typically
more successful than an alone standing policy instrument. And the design of
the individual policy will of course have to consider the portfolio it will be part
of. Typically, a policy portfolio would consist of a few core policy instrument
that are supplemented by other policy instruments. For example in Denmark
the core instruments are energy taxes (economic), minimum efficiency stan-
dards (normative), and an energy efficiency obligation scheme (economical or
informative1). In Netherlands the core instrument targeting industry is volun-
tary agreements. In Finland audits is the main instrument.
A study of Swedish manufacturing industries also points to electrification and
investment in clean technologies contribute to lowering energy intensity sig-
nificantly (Silveira, et al., 2012).
While most agree that energy intensive companies and non-energy intensive
companies have different needs and challenges relating to EE, small and me-
dium sized companies are frequently lumped together. However, studies
show that their EE needs and challenges also differ depending on size and
industry branch (Trianni, et al., 2011). Misalignment between what the com-
panies perceive to be a barrier and what is really a barrier causes them to
marginalise EE (Trianni, et al.).
Broadly speaking the potential for improving EE of widely used industrial
technologies such as compressed air, pumps, refrigeration, and electric motor
systems is huge and optimisation of process heat systems and use of heat
recovery adds to this potential2. An IEE strategy should therefore as minimum
include some elements targeting these possibilities.
5.2 Policy development process
An IEA survey of 11 case studies including 22 policy instruments targeting
motors provides a set of recommendations regarding some of the key ele-
ments of the organisation and management of successful energy efficiency
policy (EMSA, 2011). These are liberally quoted in the following supplemented
with our expert observations.
1 The three types of instruments are defined from the end-user perspective. An energy efficiency obligation
scheme is considered an economic or informative instrument, because the end-user receives information or maybe a subsidy. It is not the end-users that are given the obligation to find savings but instead the energy companies. 2 The potential ranges from 5-50% and in most cases the pay-back time is less than 2 years, according to the
study “Energy efficiency in buildings, industry and transportation”; Dobrica Milovanovic; University of Kragujevac; Paper at the 6th Global Conference on Power Control and Optimization; 2012.
Policy portfolios
Key considerations

28
In order to design IEE relevant instruments the gap between the current situa-
tion and the vision and development goal for the future situation must be
understood. What does the gap consist of? What changes are required? What
are the potential barriers? How can these barriers be overcome or reduced?
What are the critical elements that must go well to ensure significant impact
and success? These elements must be given special attention.
It is important to remember to distinguish gap seen from a societal perspec-
tive and the gap as perceived by the industrial companies – individually and as
economic sector.
Figure 7: The gap between the current situation and the vision for the future situation differs depending on whether seen from a societal perspective or the perspective of the individual industrial company.
The gap analysis can be carried out loosely without too much data detail.
The level of ambition for the policies has to be defined. How high will should
the aim be to start with? Is a soft start followed by gradual increases in the
level of ambition preferable to a “full-on” start? This is sought illustrated in
Figure 8Error! Reference source not found..
SocietySociety
Company
GAP
GAP
Vision of future situation
Company
Current reality
Gap assessment
Level of ambition

29
Figure 8: The choice of ambition level.
If a country, for example, is considering introducing an energy management
policy, a minimum option could be to establish the ISO 50001 (see chapter 9
for definition). At a more moderate ambition level, the standard could be
supplemented with a subsidy scheme for the 200 most energy intensive com-
panies. At the high ambition level, use of energy management system could
be made mandatory in the most energy intensive companies. This variation is
shown on the vertical axis. The ambition level can also be varied with time
(horizontal axis) – for example starting with the establishment of a standard
and then moving on to a voluntary agreement with key industries which then
after a number of years is replaced with an energy management system obli-
gation for a major part of the largest industries.
EU energy efficiency target
EU has a target for energy efficiency for 2020, namely a 20% reduction in the
primary energy consumption relative to a 2007 model forecast for 2020. Accord-
ing to the new energy efficiency directive, that was agreed upon in June 2012,
the target is that primary energy consumption must be no more than 1,474 Mtoe
or that final energy consumption must be no more than 1,078 Mtoe by 2020. This
is an absolute target for EU as a whole. There are no binding targets for EU
Member States. (Ea Energy Analyses and the Swedish Energy Authority, 2013)
Interesting is that:
The EU EE goal in reality is an absolute goal. This is easy to meet with
low economic growth and similarly difficult to meet if the economic
growth is high.
It is only an EU wide goal. When it became clear that the goal would not
be met EU decided to require new EE instruments in all Member States,
mainly the energy efficiency obligation scheme (Article 7 of the EU En-
ergy Efficiency Directive).

30
A successful policy can be characterised by the following:
A cost/benefit ratio below one –from a socio-economic perspective (in form of the total economy test)
There has been a match between targets, resources, and impact.
Has a significant impact
Has a good reputation and can thus pave the way for new policies.
Key issues to be addressed during policy planning are:
What are the aims of the policy and the intended duration;
What can be learnt from other policies with similar objectives;
How the policy will be managed;
Who is the main target group(s);
How the success of the policy will be evaluated;
How the achievements of the policy will be measured;
What financial and human resources will be required to deliver the program;
Are there any capacity constraints that will limit the effectiveness of the program, e.g. skilled staff, laboratory expertise, etc.;
What other resources will be needed, e.g. information, promotion, materials, guidelines, etc.;
Which external organisations need to be involved in planning or deliv-ering the program and what role will they have;
How will a communications strategy be developed and implemented;
Is coordination or alignment with other policies considered (link/synergy/interference).
The communication should not only focus on the time of launch of the policy
but also successive communication throughout the policy period.
The industrial sector is very heterogeneous and therefore some of policies
targeting industry must to a certain extent be tailored to the individual com-
pany in order to be successful. It may be relevant to segment the target group
in to smaller segment and tailor certain components of the policy to fit each.
The policy design should also address the fact that within the individual com-
pany there are different types of decision-makers and cultures within the
What characterises a
success?
Policy planning
Tailoring

31
company. For example management commitment is crucial to capital invest-
ments in EE.
The industrial companies can be split into three segments depending on their
readiness, willingness, and ability to partake in the EE market:
Frontrunners: Companies with special profiles or competences that can kick-start the market;
Followers: The bulk of the companies;
Laggers: Companies that for various reasons is to be expected to lag behind in the EE market.
The core of the IEE policies should target the bulk of the companies but spe-
cial policy variations can be tailored to each of the other two segments as well
as those companies that are especially exposed or vulnerable:
Frontrunners can be created by offering rewarding conditions for early action. This could for example be time-limited advantageous fi-nancial support, exemption from certain taxes, special promotion of their products, etc.
Those lagging behind could be penalised but often a certain segment of the target group is more or less formally exempted from forced ac-tion – this could for example be the case with artisans.
Leniency towards those companies that are especially exposed or vul-nerable or extra support to these companies.
The appropriate focus of the IEE policies will depend on which company activi-
ties are being targeted. Table 4Error! Reference source not found. illustrate
the link between the company activities and appropriate policy focus and lists
a few examples.

32
Company activity Focus of policies Examples
Operation & mainte-nance
Awareness
Information
Expertise/skills
Success stories
Upgrading skills
Exchange of experience e.g. through prof networks
Retrofit (EE improve-ment of existing equipment)
Technical and economical pos-sibilities
Audits
Natural replacement of existing equipment
As above +
EE technologies and solutions
Capital
EMS
Energy management standards
Availability of EE solutions
Subsidy New purchases
Forced replacement of existing equipment
As above +
Driver
EMS
Fiscal rewards/penalties
Table 4: The appropriate focus of the IEE policies depends on which company activities are being targeted.
Policies addressing industrial energy efficiency should run for several years in
order to maximize impact. This is due to slow turn-over of motor systems
technologies, and the time necessary to develop relationships, reach all rele-
vant stakeholders, and gain recognition. Brand recognition is an important
part of raising awareness and promotional activities, but this takes time to
establish.
Policy management should be neutral and independently financed to be rec-
ognised as an unbiased source of information.
Information provided by the policy needs to be considered credible and au-
thoritative to maximise the probability that it will be acted upon.
Public recognition whereby the government clearly and repeatedly signals it
commitment to EE can greatly influence the impact of the EE policies.
It is of great importance to integrate market actors to achieve the greatest
possible policy impact and encourage further developments. Establishing rela-
tionships with and between government agencies, producers of motor sys-
tems and sales companies, experts, installers, service companies and energy
consultants is central to most successful programs. Trade associations, cham-
bers of commerce and industry organisations can also be useful partners. For
direct contact to motor system users it is often helpful to work with regional
contacts or local energy utilities.
Policy duration
Policy management and
recognition
Partnerships

33
The identification of clear and measurable target outcomes from the outset,
and supporting these with an evaluation strategy is a vital part of program
design and management.
A policy needs to be continuously managed and not only designed and im-
plemented. Regular monitoring provides feedback on progress with imple-
mentation and enables the early detection of any problems or issues that
require addressing. Publicly reporting policy results is also important to in-
crease policy recognition among the target group, policy makers and funders.
The monitoring and preliminary data collection for the final evaluation should
be designed streamlined to minimize transaction costs (e.g. through online
reporting) and aligned with other reporting requirements that the target
group might be subject to (e.g. environmental impact, production, or income).
Policy evaluation is more extensive than the day-to-day monitoring and typi-
cally takes place near the end of the program period or after the policy period
with the objective to assess whether the policy has been successful. Evalua-
tion results can provide the basis for decisions regarding extension or expan-
sion the policy. The evaluation is given greater credibility when performed by
an independent party.
The key policy evaluation questions are:
To which extent are the policy objectives justified in relation to the needs and problems identified?
To which extent have the policy objectives been achieved?
What has been the cost of achieving the objectives and have the ob-jectives been achieved at lowest/reasonable cost?
Any mandatory requirements (e.g. agreements and labelling) require monitor-
ing and verification of compliance. If compliance cannot be monitored at rea-
sonable cost and effort then mandatory requirements are better replaced by
voluntary or promotional measures. Furthermore, programs with mandatory
requirements should include activities to educate stakeholders of their re-
sponsibilities and ensure that there is a sound technical basis underpinning
the requirements.
Monitoring and evalua-
tion
Compliance and en-
forcement

34
The enforcement actions and penalties should be scaled in proportion to the
severity of the offence of lack of compliance. The entity charged with supervi-
sion of compliance must be given appropriate powers of authority.
In some instances it is necessary to mobilise energy savings quickly for exam-
ple to avoid black-outs.
The California 20/20 rebate program first introduced during the power crisis
in 2001 is an example of a market driven policy intended to achieve immedi-
ate impact. The aim was to avoid brown-outs1. The concept consisted the
electric utilities rewarding consumers that could reduce their monthly con-
sumption during the period of the four summer months by 20% compared to
the previous year with a 20% reduction in unit electricity price. Care should be
taken to assure that the design of the program encourages reductions that
would not otherwise have taken place and that the size of the economic re-
ward does not undermine the program cost-effectiveness (i.e. cost per net
energy impact achieved).
Recommendations regarding urgent policy measures (Pasquier, 2011) include:
Assign a neutral, non-political group to lead the effort to avoid politi-cal disputes and finger-pointing.
Keep the end-users informed about the impact of their response and that the end is in sight – if possible using quantitative indicators.
Beware that multiple crisis can lead to crisis fatigue and lack of end-user response.
Use the crisis as an opportunity to prepare the ground for long-term EE, to set-up data collection, and to implement elements that facili-tate better interaction between supply and demand.
The current political debate as well as other factors internally or externally
(e.g. upcoming elections or sudden changes in the global energy market) will
influence what policies are finally politically approved. Furthermore, proposed
policies are often adjusted in the political negotiation process where com-
promises are frequently necessary. The resulting changes can be in the choice
of policy types but also the more detailed design of the individual policy in-
strument.
1 The term black-out refers to the total loss of power to an area and is the most severe form of power
outage that can occur and may last from a few minutes to weeks. The term rolling black-outs is used to describe a deliberate outage of certain areas. A brown-out is the term used for a drop in voltage in an electrical power supply. The term brown-out comes from the dimming experienced by lighting when the voltage sags.
Communicating urgency
Compromises

35
It can therefore be a useful exercise to reflect on what the critical policies in
the portfolio are if a significant impact is to be achieved and where compro-
mises can be permitted.
Broad political settlements on the overall IEE strategy will make the strategy
more robust to changes in government and political power.
It should also be noted that the importance of the government signalling its
ambition to pursue an EE development path is critical to the success of any EE
strategy and policies.

36
Part II: Selected energy efficiency instruments

37
6 Introduction to part II
The ambition of “Part II: Selected energy efficiency instruments” is to present
limited but relevant examples of approaches and instruments that can be
implemented in Egypt in the next few years. It is important that the Egyptian
IEE strategy and the associated policy portfolio to be developed are robust
and realistic while achieving a noticeable impact.
The international examples and the suggestions presented are based on the
assumption that industrial energy efficiency improvement will be considered
as a tool for alleviating the difficult transition to market based energy prices
but also as buffer against the expected global increases in fuel prices. Natu-
rally, also other development objectives such as for example job creation,
security of supply, and environmental protection will influence the appropri-
ate choice of policy portfolio. These are however not discussed. Load shifting
and fuel switching examples are also not included although these are highly
relevant topics for Egypt. The basic policy design principles are nevertheless
the same.
Figure 9. The selected five IEE policy instruments. The location of the instruments in the triangle is decided from the perspective of the end-user companies.
I part II, chapter 7-11 present the key characteristics of five selected policy
types followed by concrete examples. The idea is to add more details for these
instruments.
General information and campaigns (chapter 7): Information is often used as policy instrument in combination with other activities. Infor-mation and campaigns are typically uncontroversial and rather soft in-struments. Impact are often moderate, but information can support
Five IEE instruments

38
other activities and prepare the ground for new activities (including new policy instruments).
Energy audits (chapter 8): Energy audits can be described as high quality information that is targeted and adapted to the individual in-dustrial company.
Energy management systems (chapter 9): While energy audits are de-livered by external experts, energy management systems are mainly driven by company staff. This can improve the timing of the activities and broaden the scope. EE can be pursued where most relevant for the company.
Energy efficiency obligation (chapter 10): This chapter focuses on how to create an actor to promote energy efficiency. The obligated party, e.g. an energy company, may use information, energy audits or subsi-dies to fulfil the obligation.
Electric motor systems (chapter 11): This chapter illustrates how technology can be used as focus for a policy intervention. The actual policy instrument related to motor system could be a combination of information, minimum efficiency standard – and tools to highlight the system perspective in analyses of motor systems.
Figure 10: Policy angles applied in this report.
In Error! Reference source not found. a qualitative rating of the five policy
instrument is indicated.

39
Information Audits EMS EEO Motors
Relevant as a first
generation policy in-
strument in Egypt
XXX XX XXX XX XX
Expected impact in
Egypt X XX XX XXX X
Expected result of total
economy test X XXX XXX XX XX
Low need for financing
of policy instrument,
e.g. by the state
XXX X X X X
Table 5. Qualitative rating of the five selected policy instruments
Many other instruments could have been selected. However, seen in an Egyp-
tian perspective we find that more complex instruments, like voluntary
agreements and Energy Service Companies, ESCO, can be relevant, but not
from the start. After years with active IEE policy and where institutions have
matured, such instruments can also be relevant.
An ESCO may finance, implement and guarantee an EE project. Many variation
exists. See (JRC, 2014) for a status in 27 EU countries and 15 non EU countries.
ESCO can be relevant in specific situations – also in Egypt. However, if an EE
project is simple and require only little risk, then the extra cost of contracting
and the sharing of the benefits with the ESCO may not be needed (WEC,
2008).
“Voluntary agreement” (also referred to as “negotiated agreements” or “Tar-
get setting agreements”) covers a variety of designs. On one end of the scale
we find agreements without sanctions and on the other end of the scale
agreements that include an element of sanctioning or penalty if performance
is below the agreed target. In many cases a financial incentive exist for enter-
ing a voluntary agreement, e.g. a tax reduction (as in the case of Denmark and
Sweden). See (UNIDO, 2008), (JRC, 2010), (Persson, et al., 2005), (Dalkmann,
et al., 2005) and (Goldberg, et al., 2014) for more information and voluntary
agreements.
What is not covered?

40
7 General information and campaigns
Informative policy instruments includes
general information and campaign;
labelling (could be part of 11: Electric motor systems)
Information tailored to the individual industrial company (see chap-ters 8: Energy audits, 9: Energy management systems, 10: Energy effi-ciency obligation).
In this chapter we address the first category.
7.1 Characteristics
The aims of general information and campaign measures are to create aware-
ness of the need for energy efficiency and the possibilities for achieving en-
ergy efficiency and to provide access to related information and know-how.
General information spans from printed leaflets and online information (e.g.
webinars) to professional network sessions and tools for self-assessment.
Campaigns may range from advertisements in professional media, promotion
campaigns to competitions and awards.
Low involvement High involvement
General information
Leaflets
Success stories
Guidebooks
Online information
Tools
Network
Help lines
Campaigns Broad media campaigns Competitions
Awards
Table 6: The degree of involvement of the target group varies for the different types of initia-tives.
What characterises general information and campaigns is that they are aimed
at more or less defined target groups rather than the individual end-user or
company. Assessment of impact can therefore only with great difficulty if at
all be linked to changes in energy consumption. Evaluator must therefore be
content with assessment of indicators such as number of leaflets distributed,
number of calls, number of participants, opinions of user or participants re-
garding usefulness etc. Surveys and focus groups can be used to collect opin-
ions of users.
Aim
Ranges
Target groups and im-
pact assessment

41
As a consequence, general information and campaign measures are rarely
used alone but are used to underpin other policy measures. An the reverse –
Success stories from for example implementation of an energy management
system in a specific company can be used in connection with general informa-
tion and campaigns to bring the core messages to life.
7.2 Examples
General information
The range of general information spans from broad generic information to
targeted activities about certain topics.
An example of targeted information activity about certain topics is the Irish
Large Industry Energy Network (LIEN). LIEN relies on the mutual exchange of
experiences among industrial company staff supplemented with topical talks
or studies on technological solutions and practises. The underlying under-
standing is that staff frequently consult peers when looking for information
and place a greater deal of trust in their experience than a random technology
supplier. LIEN is an initiative by the Sustainable Energy Authority of Ireland
and is part of a package of initiatives targeting the larger industries (+1 million
EUR1) that also includes a voluntary agreement program with an energy man-
agement standard (see Figure 11). Participants in LIEN or the voluntary
agreement program may participate in so-called Special Working Groups
(SWGs). Those participating may decide which areas of expertise the groups
will focus on thus ensuring that it is of particular interest and relevance to the
participants.
A Danish variation of information and experience sharing in amore ad-hoc
form is the so-called “ERFA-træf” (an abbreviation of “experience gathering”).
The objective of these meetings is to gather professionals to discuss a com-
mon professional interest with the aim to develop through sharing experi-
ences and knowledge. In relation to EE they have been taken the form of af-
ter-work meetings with e.g. talks on motor efficiency.
Other current examples include the German Local Energy efficiency Networks
(www.leen-systeme.de) launched by the German Federal Ministry for the
Environment and the Industrial Energy efficiency Network Forum, Southeast
1 9.7 million EGP, assuming 9.7 EGP/EUR.
Combinations
Irish Large Industry En-
ergy Network

42
America (www.industrialee.org) launched by the American Council for an En-
ergy Efficient Economy (ACEEE).
Figure 11: The Irish LIEN is one of three initiatives tailored to the larger industries (http://www.seai.ie/Your_Business/Large_Energy_Users/LIEN/).
Figure 12: The Irish Special Working Group initiative (http://www.seai.ie/Your_Business/Large_Energy_Users/LIEN/).

43
Partnerships can help programs by providing technical expertise, program
design and implementation guidance, and expanding program outreach and
implementation channels. In USA, For example state energy offices can also
complement and support ratepayer-funded programs through training, en-
ergy assessments, certification, and recognition awards. State energy offices
use their established partnerships with other relevant stakeholders such as
the Manufacturing Extension Partnership (MEP), DoE’s Industrial Assessment
Center (IAC) Database and resources provided by the EPA’s ENERGY STAR for
Industry program to inform thousands of investments in state and utility IEE
programs. (Hedman, et al., 2014)
Campaigns
Campaigns range from advertisements in professional media and promotion
campaigns to competitions and awards. They may be used more or less inten-
sive depending on the need for attention among the target group.
The Japanese Ministry of Environment began the Cool Biz campaign in sum-
mer 2005 as a means to help reduce electric consumption by limiting use of
air conditioning in certain months. Central government ministries were to set
air conditioner temperatures at 28°C March-September. Inspired by japan, the
South Korean Ministry of Environment, the British Trades Union Congress, and
the UN to name a few were inspired to promote their own Cool Biz cam-
paigns. Such campaigns can in addition to the immediate impact also result in
structural impacts of a more lasting character.
Partnerships can help
Japanese Cool Biz

44
Cool Biz
“… Since the United Nations must lead by example, we took the challenge seriously. This past 1
August, at our headquarters in New York, we began the “Cool UN” initiative, in which we
turned up the thermostats five degrees Fahrenheit. During the weekends, the air conditioning
systems were switched off completely. To cope with the anticipated warmth, we encouraged
staff and delegations to wear lighter clothing, including national dress for those coming from
warmer climates.
This practical step to reduce emissions and increase staff awareness of climate change was the
ultimate win-win-win. We achieved a reduction in emissions equivalent to 3,000 tonnes of
carbon dioxide. We saved money. And thanks to the lighter side of “Cool UN”, the relaxed dress
code, we generated quite a bit of conversation – about climate change and about the customs
and cultures underpinning our staff members' various forms of national dress. In short, the
initiative was an all-round winner, and we plan to conduct a similar exercise in winter, this time
in reverse, by turning down the thermostats by five degrees Fahrenheit. …”
Source: UN Secretary-General's message on receiving the "Cool Biz" Award, delivered by Konrad
Osterwalder, Rector, United Nations University, 7 October 2008.
ABB has developed calculation tools for estimating the energy savings that
become available when applying speed control to certain flow machines. Us-
ing PumpSave and FanSave tools, AC drive control in pumps and fans can be
compared against traditional flow control methods in terms of energy usage1.
Isover has calculation tool for insulation of industrial processes and general
heating, ventilation and air conditioning2.
The European Industrial Insulation Foundation offers a standardised approach
to inspection of insulation improvement possibilities in the form of training
and certification of insulation-auditors in combination with a calculation tool
aimed at detecting insulation possibilities3.
According to a survey carried out for the foundation even energy-intensive
industries overlook the benefits from industrial insulation. One of the reasons
for this is according to the foundation that split incentives (see Figure 13).
“The additional investment needed for good insulation (in comparison with
current insulation levels) tends to be controlled by the maintenance manager.
The savings that are realised by this create decreased costs in the energy
budget, which tends to be controlled by a different department. To bring
1 See: www.abb.com/product/ap/seitp322/24b03100d005c31ac1256e040043f4c1.aspx?country=US
2 See: www.isover-technical-insulation.com/Calculation-softwares/TechCalc-Presentation
3 See: www.eiif.org/?TIPCHECK%20information/30.
Assessment tools

45
these two together requires a decision on a higher management level, where
unfortunately even less awareness of the technology and potential benefits of
insulation exists.” (Gürtler, et al., 2014)
Figure 13: Split responsibilities (Gürtler, et al., 2014).
46
8 Energy audits
Energy audits are an informative policy instrument tailored to the individual
industrial company. An energy audit is an examination of the energy con-
sumption at a facility. The outcome is a formal report that shows the main
areas where energy efficiency can be improved, suggests energy efficiency
improvement measures, and estimates the likely costs and savings. The audit
may be of the entire facility or specific systems or processes. The audit is typi-
cally carried out by experts external to the company (as opposed to energy
management systems which are more integrated in the company).
8.1 Characteristics
Energy audits bring external expertise to the individual company and carries
out an assessment of the company’s current energy situation and options for
improving energy efficiency. The aim is thus to “lend” know-how and tools to
the individual company for the time necessary to make an assessment
thereby answering the first question of concern of the company: Can we save
energy and at what effort and cost?
Energy audits are can be a stand-alone policy that for example precedes other
policies. Frequently, audits are a key supporting component of industrial en-
ergy efficiency policies such as voluntary agreements.
The actual audit and the experts offering audits may vary. The audit may be a
simple “walk-through” requiring 1-2 hours or it may be a detailed assessment
that can take days and include detailed measurements, e.g. of the electricity
consumption of individual compressors. This can document the actual loading
and can highlight in-adequate control. The more detailed the choice of audit
type, the more important it becomes that the auditor is familiar with the
unique characteristics and requirements of the production systems of the
particular branch. On the other end of the scale, very simple audits can be
carried out by less specialised auditor whose main expertise is familiarity with
more generic areas where energy is typically wasted (e.g. leaking pipes for
compressed air, lighting and ventilation).
Irrespective of the degree of detail, it is important that the quality of the work
is high. Once a poor reputation is gained it is close to impossible to remedy.
A 2011 survey of 8 audit policies without supporting policies used 8 parame-
ters to describe their characteristics (Price, et al., 2011):
Aim
Ranges

47
Audit costs – The customer may carry the entire cost or financial sup-port may be offered to varying degree – full coverage, upper limit in terms of fixed value or fixed percentage or both. Financial support may also be provided under certain conditions for example upon re-alisation of those measures that have a payback time of less than one year. And the support may vary depending on type of company (turn-over, employees, branch, location, etc.).
Standardised guidebooks, templates and tools for auditors – To mini-mise work load per audit but also in order to standardise the ap-proach and thereby improve the quality. Furthermore, a coherent and consistent approach permits aggregation of audit data for impact as-sessment and learning insights. Tools may also be produced in coop-eration with producers of energy efficiency solutions.
Auditor training – To build capacity and thus support the development of audit businesses. Training can be voluntary, recommended or man-datory.
Auditor certification – To ensure a certain level of quality in the audit services offered. Can be combined with public listing of approved auditors and branding of these. Certification can be issued to indi-viduals as well as companies.
Database of energy audit results – To allow easy access for auditors and perhaps also industrial companies and other interested parties in the improvement possibilities. It can also help ensure learning insights and assessment of aggregated impact.
Availability of case studies – To show realistic success stories (what-is-in-it-for-me) that can inspire others to follow
Post-audit follow up – To assess impact of the audit but also as a re-minder for those that have not implemented any of the recom-mended improvements and to hear if additional assistance is needed. The best timing may vary depending on the type of companies in question but could for example be half a year after the audit or indi-vidually agreed with each company.
An overview of the findings can be seen in Table 7.

48
Table 7: Availability of key components in the selected stand-alone energy auditing programs. (Price, et al., 2011)
It is possible to increase the interest in EE project by recognising and quantify-
ing non-energy benefits of already implemented EE projects. Non-energy
benefits, such as improved productivity or quality gains, can be as high as or
even higher than the energy cost saving benefits achieve. Some co-benefits,
such as water savings, are relatively easy to quantify, while others, such as
safety improvements are more complex to assess. (Hedman, et al., 2014)
Audits can be promoted more or less aggressively. It can be left to the discre-
tion of the industrial companies to ask for an audit but the likelihood of a
great interest is very low. If audits are offered on a commercial basis, the au-
dit companies have an incentive to contact potential clients. If audits are pro-
vided by a non-profit entity, then a target for how many audits must be car-
ried out might be necessary to ensure sufficient progress. An option could also
be to form an outreaching team that seek up the industrial clients.
The walk-through audits or stand-alone audits (i.e. without any additional
supporting policies) are typically directed at small and medium sized compa-
nies while the more extensive audits and audits coupled with requirements
are typically aimed at large and energy-intensive companies (Price, et al.,
2011).
Small and medium sized companies typically show limited interest in energy
audits or do not have the financial resources to afford a professional energy
audit due to limited management capacity and a pressure for economic sur-
Demand for audits
Target groups and im-
pact assessment

49
vival. An audit policy combined with some kind of financial support can help
alleviate these barriers.
In the case of audits the target group and individual company is known and
the audits establish the energy profile and potential for savings. Evaluators of
audits as a policy instrument can therefore rely on this information for impact
assessments. However, the fact that a given company now knows what the
possibilities are does not necessarily mean that they will act upon this infor-
mation. Perhaps the company will actually use the audit information but not
until they have time to do so which could be several years after the audit.
The timing of the audit does rarely coincide the time when investment deci-
sions are being made, and is not integrated in day-to-day operation and man-
agement of the company. It is possible to reduce this problem to some extent,
for example, by requiring an audit to be carried out prior to approval of an
application for an investment loan.
Energy audits should not be regarded as a once only event. Production proc-
esses change over time and with it the energy consumption pattern. Further-
more, new more energy efficient technologies and processes continue to ap-
pear on the market and provide new opportunities for optimisation.
In order to use the audit as leverage for actual implementation of some of the
identified cost-effective energy efficiency improvements the cost of the audit
that the company has to pay is frequently reimbursed if certain improvements
are actually implemented within a given timeframe.
In addition to providing the audited company with data on its energy situation
the audits can also provide valuable data on a national scale if certain data are
compiled for use in formulation of future Egyptian policies.
8.2 Examples
Finland has had audits schemes since 1993 and consider them to be very suc-
cessful. MOTIVA1, the Finnish Energy Agency, has facilitated training of audi-
tors and provided a format for performing audits. MOTIVA approves audits
upon which usually 30-40% of the audit cost is paid by government. Target
groups are industry and tertiary sector.
1 Motiva operates as an affiliated Government agency (an in-house unit), and its functions will be devel-
oped as such. The company’s entire share stock is in Finnish state ownership. http://www.motiva.fi/en
Added benefit
Finnish audits

50
Since 1976 Industrial Assessment Centres, IAC, has been active in the USA.
These centres are located at universities across the US, and are funded by the
United States Department of Energy to spread ideas relating to industrial en-
ergy conservation. The centres conduct research into energy conservation
techniques for industrial applications and perform energy audits or assess-
ments at manufacturers near the particular centre. Today, there are 24 active
Industrial Assessment Centres in the United States1. The IAC program has
achieved of over 4.5 billion USD of implemented energy cost savings via
14,000 audits.
The unique feature of IAC is that they combine support to industry in form of
free energy audit – and at the same time increase the EE skills for student and
candidates. Compared to other audit schemes the cost of IAC is moderate.
In relation to the IAC activities a database of the results of more than 16,000
audit has been compiled. The database is publicly available2 and permits
search by type of facility assessed (size, industry, energy usage, products, lo-
cation), resulting recommendations (description, energy savings, implementa-
tion costs, and payback), and the IAC that carried out the audit.
As part of implementing the 2012 EU energy efficiency directive, Denmark is
currently setting up new requirements about energy audits in all companies
with more 250 employees. Companies within trade and services with an en-
ergy consumption below 100 MWh are exempted. The companies must from
2015 have executed a detailed energy audit and this must be updated every
four years.
If the companies have an EMS (like ISO 50001) that already includes an energy
audit, they do not need additional activity.
The French energy auditing program (“Aide à la Décision”) tours around
France with 3-day training sessions for auditors. The content changes depend-
ing on which sector the auditors to be trained will focus on in their work but
the basic structure of the training includes (Despretz, 2002):
Presentation of ADEME scheme and the auditing program;
Introductions to energy auditing model specifications;
1 http://energy.gov/eere/amo/industrial-assessment-centers-iacs and http://iac.rutgers.edu/case_studies/
2 http://iac.rutgers.edu/database/
Industrial Assessment
Centres
New Danish audit re-
quirements
French capacity building

51
Description of the most encountered errors and omissions;
Presentation and training of auditing software and tools;
Demonstration of two real case studies by trainees.
A survey, carried out by Institute for Resource efficiency and Energy Strategies
and Fraunhofer Institute, of 366 German companies (energy-intensive, less
energy-intensive, and service sector) analysed 7,984 implemented EE meas-
ures. The survey distinguished between organisational level EE measures and
technical level EE measures. The organisational measures included (Roser, et
al., 2014):
Low-investment measures are measures that can directly increase en-ergy efficiency through little investment:
“Insulation: the insulation of pipes, fittings and devices. These
types of measures have a high energy saving potential.
Free cooling: the difference between outdoor and indoor
temperature can be used to cool rooms with almost no en-
ergy consumption. Sometimes existing equipment can be
used, sometimes a little investment is necessary to automate
this process.
Leakage detection: a regular control detects and quantifies
leaks so they can be eliminated. This is particularly relevant to
the efficient running of technical equipment but it is often
overlooked.”
Setting adjustment is another measure to optimise control systems with almost no investment. Examples include:
“Automatic and manual switch-off of unused equipment: in
many companies, electrical devices and appliances are not
switched off when not in use; they remain in an active or pas-
sive standby mode. This might be office equipment, technical
equipment, lighting, or heating etc. In some cases, there is
even a consumption of energy when the device has been
switched off (off-mode electricity) and they have to be dis-
connected from the grid before electricity consumption
ceases.
Pressure reduction: the adjustment of the operating pressure
for compressed air and vacuum systems can improve effi-
ciency. Compressed air is the most expensive energy carrier
and is used in nearly every field of production.
Temperature adjustment: In many cases the temperature is
higher in heated areas or lower in air-conditioned areas than
necessary (e.g. in server rooms) and an adjustment can sig-
nificantly contribute to energy efficiency.”
Start simple

52
Management measure examples:
“Energy control/energy management: exact consumption re-
cording and billing of energy consumption can raise aware-
ness of the responsibility of employees and is therefore an es-
sential prerequisite for achieving energy efficiency goals in a
company. Major electricity consumers can be detected and
improvements made to increase energy efficiency.
Procurement guidelines of energy-related equipment: new
machines and systems should be assessed according to their
energy consumption.
Staff training: the every-day actions of employees might have
an energy saving potential that should be considered. Em-
ployees should be trained in careful handling of equipment
and general awareness of energy issues and specific demon-
strations may lead to more energy efficient behaviour.”
Of the 7,984 implemented EE measures 1,584 were organisational level
measures and the rest cross-cutting technologies (i.e. not process specific).
Analysis showed that each of the three categories of organisational measures
contributed significantly to EE (see Figure 14) and the payback time was less
than three years in average.
Figure 14: Energy saving potential relative to the total energy demand of each company (N=872) (Roser, et al., 2014)
Energy efficiency improvement measures may also bring other benefits in
addition to the energy savings. Such “non-energy benefits” can have higher
value than the energy savings and can function as important leverage for
company interest.
Non-energy benefits
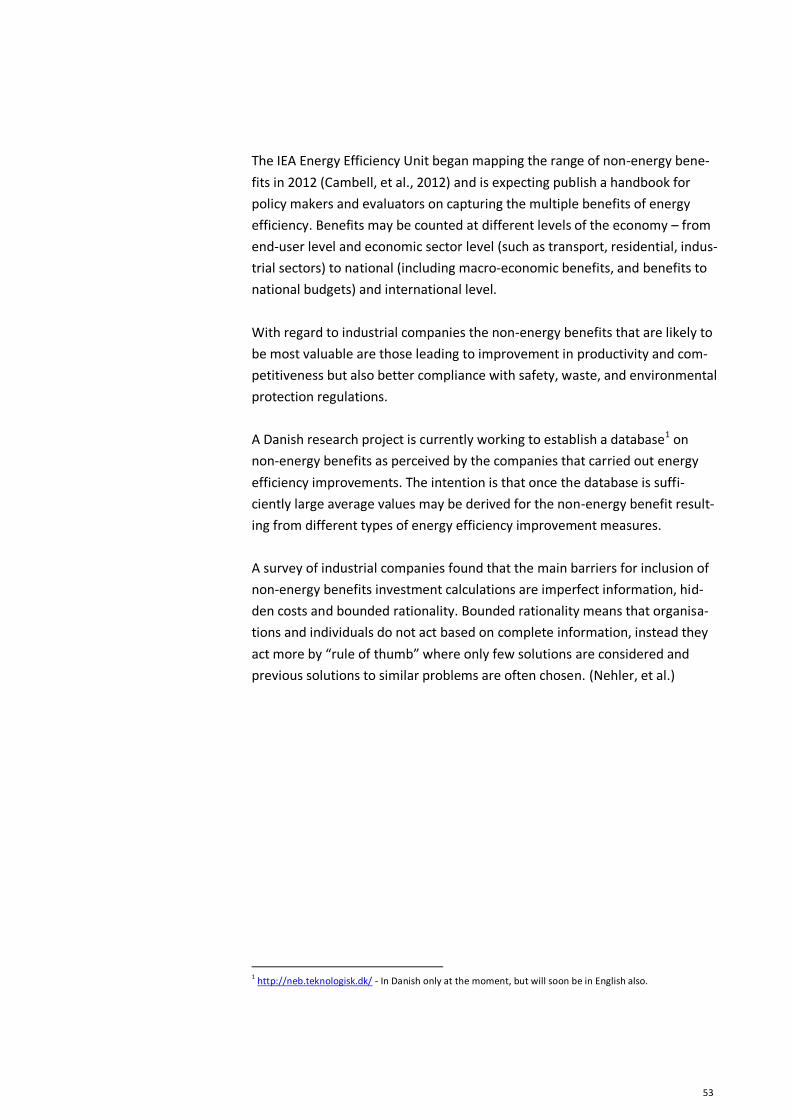
53
The IEA Energy Efficiency Unit began mapping the range of non-energy bene-
fits in 2012 (Cambell, et al., 2012) and is expecting publish a handbook for
policy makers and evaluators on capturing the multiple benefits of energy
efficiency. Benefits may be counted at different levels of the economy – from
end-user level and economic sector level (such as transport, residential, indus-
trial sectors) to national (including macro‐economic benefits, and benefits to
national budgets) and international level.
With regard to industrial companies the non-energy benefits that are likely to
be most valuable are those leading to improvement in productivity and com-
petitiveness but also better compliance with safety, waste, and environmental
protection regulations.
A Danish research project is currently working to establish a database1 on
non-energy benefits as perceived by the companies that carried out energy
efficiency improvements. The intention is that once the database is suffi-
ciently large average values may be derived for the non-energy benefit result-
ing from different types of energy efficiency improvement measures.
A survey of industrial companies found that the main barriers for inclusion of
non-energy benefits investment calculations are imperfect information, hid-
den costs and bounded rationality. Bounded rationality means that organisa-
tions and individuals do not act based on complete information, instead they
act more by “rule of thumb” where only few solutions are considered and
previous solutions to similar problems are often chosen. (Nehler, et al.)
1 http://neb.teknologisk.dk/ - In Danish only at the moment, but will soon be in English also.

54
9 Energy management systems
Energy management systems are just like energy audits an informative policy
instrument tailored to the individual industrial company. The energy man-
agement system is however not carried out by experts external to the com-
pany but are fully integrated in the company operation.
9.1 Characteristics
Energy management systems (EMS) – like ISO 50001 – have been developed
to be the companies’ own tool for running the production, like similar systems
for quality management (ISO 9001), environmental management (14001), or
social responsibility (ISO 26000). The core function of these systems is to de-
fine a systematically way of setting goals and implementing the activity.
Energy management is thus a continuous focus on optimising energy con-
sumption (see Figure 15). It is likely that significant savings can be achieved in
any company to start with without investment in EE equipment.
Figure 15: Gradual energy cost reduction through energy management. (Kahlenborn, 2012)
Companies may adopt energy management systems at their own free will
simply as a way to achieve the goals. They may also choose such a system so
they can document the activity and the results to customers (e.g. quality) or
interest groups (e.g. environment).
The different systems may be combined. ISO 50001 is data driven and focuses
on energy performance, while ISO 14001 provides a more qualitative looks at
all significant environmental impacts of an organisation. Both standards can
Aim

55
be implemented individually or they can be integrated with each other, or
with any other ISO management system standards, such as ISO 9001.
If energy is an organisation’s most significant environmental impact, ISO
50001 might be more appropriate than ISO 14001. Many organisations will
manage energy successfully via ISO 14001, but especially in organisations
where energy is a significant cost, ISO 50001 provides a more specific frame-
work that enables organisations to apply a sharper focus to energy efficiency1.
There is a crucial difference between EMS and many other policy instruments.
The EMS is an internal system managed by the company, while e.g. a free
energy audit in many cases will be run by external consultants. The difference
may be very important. With an effective EMS all opportunities can be cap-
tured. E.g. it the EE opportunities are often significant in relation to invest-
ment in new equipment, while external systems like energy audit often come
at a random time and not necessarily timed in relation to such opportunities.
A systematic approach to energy management can be applied by any indus-
trial company. However, using a commonly agreed approach such as the ISO
50001 permits certification and setting standards for what is systematically
carried out and which EE improvements implemented.
EMS is not only promoted by public authorities. There are also other potential
drivers for large scale EMS adoption. The most frequent is energy utilities. But
industrial associations may also take the initiative in order to support peer-to-
peer cooperation. Another perhaps growing trend is for large corporation
such as Ford, 3M, IKEA, and Walmart to try to influence the companies in their
supply chains e.g. through preferential purchasing strategies placing require-
ments on their supply chain. And finally, financial institutions may encourage
EMS in relation to provision of funds.
1 Quoted from Wikipedia. See the following links for ISO 50001 guide books:
www.umweltbundesamt.de/publikationen/energy-management-systems-in-practice
www.gut-cert.de/info-energiemanagement0.html?&L=1&lang=enhttp://ul-dqsusa.com/wp-content/docs/ISO%2050001PractitionersGuideandScorecard2011Sample.pdf
www.hkeia.org/iso50001/eguidebook/ISO50001%20guide_ENG%2019Aug%28Final%29.pdf
ecenter.ee.doe.gov/EM/SPM/Pages/Home.aspx
www.nsai.ie/NSAI/files/bd/bd0f95ec-74d0-4c04-a990-76f3343a6f7d.pdf www.bsr.org/reports/bsr-energy-management-handbook.pdf
EMS as policy instru-
ment

56
Delivery
models
Examples of drivers for players to
develop EMS programs
Drivers for EMS adoption
by companies
Supply chains
(large coop-
erations)
Enhance company’s reputation;
EMS can be used by all industrial play-
ers, large and small;
Government support allowing compa-
nies to meet their EE obligations by
engaging their value chain.
Buying-power of the large
company;
Cost savings;
Possible implementation
support.
Utilities and
energy ser-
vice provid-
ers
Improve the utility’s relations;
Strategy to improve reliability and
availability of energy supply at lower
cost than supply resources;
Regulatory requirements for EE.
Sustainable source of
financing;
Technical assistance.
Financial
institutions
Increase number of deals and project
finance;
Help assess the risks and returns of EE
projects;
Reduce investment risks;
Improve and enhance customer rela-
tions.
Lower loan transaction
costs;
Blending technical assis-
tance with financial
products.
Industry
associations
Provide valuable service to member
companies.
Sharing information;
Implementation support.
Government
agencies
Strengthen economic development
while reducing strain on resources;
Strengthen international competitive-
ness.
Table 8: Delivery models for EMS implementation (inspired by (Reinaud, et al., 2014))
For example, in the United States Pacific Northwest, the largest industry trade
organisation, the Northwest Food Processing Association (NWFPA), intro-
duced a voluntary collaborative EMS framework to its the 100+ members
(Reinaud, et al., 2014). Partnering with an energy service provider, the North-
west Energy Efficiency Alliance (NEEA), this collaborative framework convenes
company leadership and action around common energy reduction goals. Ag-
gregating energy saving efforts through NWFPA allows an entire industry – as
opposed to individual enterprises – to apply resources toward a unified en-
ergy reduction goal – sharing in the risk, efficiency and energy savings poten-
tial and adoption of EMS as an ongoing business practice. In 2009, NWFPA
member enterprises set an industry wide energy intensity reduction goal of
25% in 10 years, and 50% in 20 years. NWFPA was the first U.S. industry wide
association to commit to this goal, and signed a pledge with the U.S. Depart-
ment of Energy.

57
Companies can decide to use their own energy management system. Compa-
nies with a limited energy consumption may use an informal system with little
paper work and informal procedures.
A certified version of ISO 50001 or a similar system has the advantage that it is
well defined and can have elements that document the activities – also for
stakeholders outside the company.
The ISO 50001 can be implemented at many levels of details. However, the
nature of a formal management system can be attractive for larger companies
and companies with large energy consumption.
EMS can be combined with other instruments. E.g. a subsidy or a tax rebate
may require that a formal EMS is used.
9.2 Examples
Several cases exist where EMS has been part of a public IEE policy. This has
been the case in e.g. Sweden (Martínez, et al., 2013), Ireland and Denmark
(Goldberg, et al., 2012).
In Sweden, the program for improving energy efficiency in energy intensive
industries was introduced in 2005 as part of a voluntary agreement between
industry and government. The program aims to increase energy efficiency in
energy intensive industries with a focus on electricity consumption. Energy-
intensive companies in the manufacturing industry can be granted tax exemp-
tion on their electricity consumption (0.55 €/MWh) if they take action to im-
prove their energy efficiency, including using a certified EMS, e.g. ISO 50001.
Table 9 shows examples of how energy management policies have been struc-
tured in selected countries.
Ranges
Target groups and im-
pact assessment
Combination

58
Table 9: Examples of energy management policies and how they are structured. (Reinaud, et al., 2014)
As with all mandatory requirements it is important to consider the risk of
compliance without EE impact, as experience from Japan shows. Japan has a
mandatory energy management systems for industrial companies with an
energy consumption of more than 1.5 million litres of crude oil equivalents
per year (approximately 12,000 companies) that includes a target of 1% im-
provement in energy intensity per year. Other requirements include appoint-
ment of energy managers, compliance with qualitative and quantitative stan-
dards of “judgement for rational use of energy in factories”, annual reporting
on consumption plus annual submission of a medium- and long-term plan for
investment. The latter does not include EE improvements that do not necessi-
tate investment.
However, the requirements focus on reporting rather than implementation,
with the result that in spite of more than 90% compliance with documenta-
tion requirements the number of companies actually implementing EE im-
provements as a direct consequence of the energy management system is
much lower. The formulation of the requirements are such that they do not
encourage actual integration of energy management in the company opera-
tion. As a consequence the scheme is of no or little extra value to large en-
ergy-intensive companies while smaller companies lack the organisational
capacity to incorporate energy management into the overall management and
operation of the company. (Kimura, et al., 2014)
Inspection of documents are warned several months ahead of inspection visit
leaving the companies ample time to get the paper work done. There has
Paper work or actual EE
improvements

59
been examples, of smaller companies hiring a consultant to prepare the pa-
perwork without energy management becoming part of the day-to-day opera-
tion because they found the regulation and preparation of manuals too com-
plicated.
Several of the surveyed companies indicated that having a formal target re-
sulted in higher attention among management towards EE potentials. Since
the target was a joint target for a company with several location or franchises
it was necessary to compile information on the energy consumption from
each location – something which helped create an awareness at management
level of energy costs. However, another lesson learned from Japan is that a
target formulated as percent reduction of energy intensity is of limited use,
since it is only partially within the control of the companies. For example, in
times of low economic activity and declining sales production volumes will
reduce and the energy intensity increase. A change in energy intensity is in
other words not clearly indicative of the implemented EE efforts. (Kimura, et
al., 2014)
Figure 16: The four steps – Plan-Do-Check-Act – of energy management (Natural Resources Canada1).
In 2011, Université de Genève, Switzerland, launched an accredited education
course in energy management2 with the aim to increase the capacity for en-
ergy management and harmonise skills. The course comprises six modules
(170 hours of teaching, 260 hours of homework):
1. Energy and management: basic notions and issues at stake.
1 http://www.nrcan.gc.ca/energy/efficiency/industry/iso/5385
2 More information can be found at http://www.albasim.ch/en/solutions/managenergy/overview-
managenergy.
Target setting
Swiss EMS education

60
2. Managing projects and driving change.
3. Assessing energy performance and defining an action plan.
4. Strategic and financial approaches of energy efficiency projects.
5. “Learning by doing”.
6. End of studies work.
The target group is working adults with at least 3 years of professional experi-
ence, a university degree, or a high school degree. Energy/technology aca-
demics or professionals are responsible for the teaching related to en-
ergy/technology aspects while business school professors teach management
aspects. Completing the course the participants will receive a Certificate of
Advanced Studies corresponding to 15 ECTS1 points (Cooremans, 2014).
1 An ECTS credit point represents a certain amount of work. At Université de Genève one credit corresponds
to 25-30 hours of academic work for a student. Typically, one full-time year corresponds to 60 ECTS-credits.

61
10 Energy efficiency obligation
A voluntary agreement system sets, as we saw in chapter Error! Reference
source not found., a target for EE that has to be achieved within a certain
time limit. The target is set together with and for the agreement companies
(typical industrial companies). An alternative way to creating a push for the
uptake of EE is to place an obligation on the energy providers to find EE im-
provement opportunities among end-users. This is referred to as an energy
efficiency obligation system (EEO). In US the term Energy efficiency resource
acquisition is also used.
The energy savings target and how to recover the cost of the effort are de-
termined by the regulator while it is left open for the obligated party to de-
cide where to find the savings. The characteristics of an EEO system is de-
scribed in the following together with illustrative examples.
EU has in the Energy Efficiency Directive (EED)1 of December 2012 pointed out
EEO as a central policy instrument for the member countries to meet the
common 2020 EE target. Member countries are encouraged to implement
EEO, but alternative instruments are also allowed, but must accepted by the
commission.
10.1 Characteristics
Energy efficiency is not the core business of industrial companies. Therefore it
is far from all cost-effective improvements that are realised even if the com-
panies are aware of the importance and benefits of energy efficiency. An ex-
ternal force driving implementation forward can therefore be useful to soci-
ety. An EEO system can create exactly such a driving force.
The idea is simply that an obligation is put on an actor, typically an energy
company, and that the obligated party is allowed to recover their cost of the
activity. The obligated party may do energy audits or pay subsidies, or may
interact with other executive parties, e.g. suppliers or engineering companies.
In a guide to the EU Member States (European Commission, 2013) the EU
Commission gives this instruction regarding the design of an EEO:
1 EU Energy efficiency directive. Directive 2012/27/EU of the European Parliament and of the Council of 25
October 2012 on energy efficiency, amending Directives 2009/125/EC and 2010/30/EU and repealing Directives 2004/8/EC and 2006/32/EC. Inter-institutional File: 2011/0172 (COD)
Aim is to create a driving
force

62
1. Establish the total quantity of energy savings that has to be achieved and its spread over the obligation period;
2. Establish which sectors and individual actions are to be targeted so that the required amount of energy savings is achieved;
3. Decide whether to use EEOs or alternative policy measures, and, while designing the schemes or measures, ensure that certain criteria are met;
4. Establish how energy savings from individual actions are to be calcu-lated;
5. Ensure control, verification, monitoring and transparency of the scheme or alternative policy measures; and
6. Report and publish the results.
Figure 17: Key actors in an energy efficiency obligation scheme.
EEO’s can cover all or some sectors energy vectors. In some cases transport is
excluded. Even if EE from all sectors are allowed rules about reporting and
documentation may hinder industry to be main area.
In some cases the obligated parties may trade realised savings. This can take
place bilaterally or with an exchange where bids and prices are published.
Financing is typically done by allowing the energy company to collect costs
though tariffs. Tariffs can be based on the full cost used for EEO, or a fixed
cost may be collected.
It can be specified if only technical projects or if behaviour savings also can be
included.
It can be relevant to do evaluation of EEO, e.g. to document the level of net
savings. This can be done by surveys (e.g. interviews) or with statistical analy-
ses. The level of free riders cannot accurately be defined for the individual
Ranges
Impact assessment

63
project, because it include an evaluation of what would have happed without
the intervention. This can for an analyses with many observations.
10.2 Examples
EEOs and the related tradable white certificates have been used for years in
Denmark, France, Italy and United Kingdom. From 2013, an EEO have been in
place in Poland. Luxembourg and other EU member states are preparing EEOs
from 2015. The existing EEOs illustrate the diversity of possible designs. E.g.
among the four examples the Danish EEO is the strongest in relation to energy
efficiency in industry. This is in contrast to the examples from France, Italy,
and UK where households and the public sector dominate.
Energy distribution companies have been involved in energy savings at the
end-user level since the early 1990s. Traditionally, their savings effort was
limited to advice their own customers. This work was formalised with the first
EEO operating from 2006 onwards. The EEO was based on a voluntary agree-
ment within a legislative framework with the distributors of electricity, natural
gas, district heating. The private heating oil companies committed to the obli-
gation voluntarily. With the introduction of the EEO the savings effort was
significantly restructured and the energy distribution companies were able to
realise energy savings across the country and within all forms of energy. The
change meant increased competition in providing competent advice to the
attractive industrial customers.
From 2011 onwards first-year savings are weighted with a simple priority fac-
tor (with values 0.5, 1 or 1.5), which to some extend reflects the lifetime of
savings, gross energy consumption associated with the realised savings cost,
and expected CO2 impact of savings – especially in regards to whether the
savings are realised inside or outside the EU ETS area. Negotiation for the
upcoming period (2013-2020) of the Danish EEO is still ongoing.
The target development of the Danish EEO can be seen in Table 10 while the
design parameters of the current Danish EEO can be found in Figure 18.
Danish EEO

64
Figure 18: Development in the Danish EEO target. First years saving. The value for 2005 (0.6 PJ) shows savings from the previous system and is estimated based on reporting from utilities.
According to the EU EED the energy savings achieved by each obligated party,
or each sub-category of obligated party, shall be published once a year. The
EU EED emphasises that a measurement, control and verification system must
be put into place to ensure that at least a statistically significant proportion
and representative sample of the energy efficiency improvement measures
put in place by the obligated parties is verified. Furthermore, this verification
must be conducted independently of the obligated parties.
The Danish EEO fulfils the EU EED requirements within the area of control,
verification and documentation. Independent random sampling tests are con-
ducted each year and independent evaluations of the EEO are carried out
routinely. With regards to penalties applicable in case of non-compliance the
Danish design is insufficient. The only consequence of deliberate or involun-
tary faults or omissions discovered in the annual random sampling control is
that the overall energy sector must provide extra savings the following year
equivalent of the savings that was deemed faulty. As the risk of being caught
is small, this system gives incentives for over reporting of savings.

65
Design parameter Denmark
Policy Objectives To decrease total primary energy consumption by 7.6 %
in 2020 compared to 2010.
Legal Authority Voluntary agreements by obligated parties and the Dan-
ish Energy Agency within a legislative framework.
Fuel Coverage Electricity, natural gas, district heating, and heating oil.
The transport is not included.
Sector and Facility Cover-
age
Residential, public & private business and industry end-
users.
Energy Saving Target 2.95 PJ/year for 2006-2009 (0.7% of total final consump-
tion); 6.1 PJ/year for 2010-2012 (1.2% of total final con-
sumption) 10.7 PJ/year for 2013‐2014 and 12.2 PJ/year
for 2015‐2020. The target is in first year savings.
Sub-targets and Portfolio
Requirements
None.
Obligated Parties Distributors of electricity, natural gas, district heating
(regulated monopolies), and heating oil.
Measurement, Verifica-
tion, and Reporting
Distributors verify and report savings; can be calculated
or deemed savings. Yearly random sample control.
Compliance Regime Energy savings must be well documented and they must
be verifiable by an independent party if chosen for con-
trol
Penalty None
Performance Incentives Yearly benchmark of savings and costs for obligated
parties
Eligible Energy Savings Distributors must engage third parties to achieve energy
savings outside own distribution area or energy type
except for transport
Eligible Energy Efficiency
Measures
Many types, including energy audits, subsidies for effi-
cient appliances, equipment and retrofitting; also small
scale renewables
Trading of Energy Savings Energy savings, when realised, may only be traded
among obligated energy distributors
Funding Cost recovery through tariffs
Table 10: Design parameters of the Danish EEO scheme.
The obligated parties in Denmark have monopoly status and the cost incurred
as a result of their EEO activity is financed over the energy bill. Only the total
costs are reported by the obligated parties and in essence the Danish Energy
Agency and the Danish Energy Regulatory Authority do not know what the
money is spent on. Nor are the energy consumer informed of how much they
contribute to energy savings financed over the energy bill. The system is de-
signed in this way in order to minimise administration cost.

66
Within the Danish system there is probably a certain amount of self-discipline
and potential shaming effect if caught. It can, however, be argued that the
system does not sufficiently encourage cost-minimisation and that credibility
currently rests on the generally low corruption level in the country; that the
obligated party have experience in providing energy savings for end-users and
therefore have highly skilled employees; and that the obligated parties sup-
ports and agrees with the target. If these circumstances are not in place the
credibility of a cost recovery system with a minimum of control might not be
appropriate.
More information on EEO can be found in (Regulatory Assistance Project,
2012), (Staniaszek, et al., 2012), (Bertoldi, 2010), (Betz, et al., 2013),
(Bundgaard, 2013), (DECC, 2012), (Di Santo, et al., 2011), (Giraudet, et al.,
2012), (Greaume, et al., 2011), (IEA, 2013), (JRC, 2010), (Lees, 2012), (OFGEM,
2013), (Regulatory Assistance Project, 2012), (Rosenow, 2012), (Rosenow,
2013), (Scheuer, 2013), (Swanson, 2012), (Togeby, et al., 2007) and (Togeby,
et al., 2012).
10.3 Recommendations for Egypt
If Egypt choses to use EEO as a policy instrument, it could be focused only on
industry or other sectors could be included. For industry the obligated parties
may not be allowed to use subsidies, but only energy audits and individual
advice. The use of subsidies could be relevant in a later stage, when interna-
tional market prices for energy has been reached.

67
11 Electric motor systems
In this chapter we apply a different angle of perspective on policy-making. We
take our starting point in the technology that represents by far the largest
share of energy consumption within industry, namely electric driven motor
systems. What is needed to increase the energy efficiency of the use of mo-
tors? Again examples have been selected with the aim to illustrate varies ini-
tiatives to address this end-use.
11.1 Why motors systems?
Motors are ubiquitous – they are used in all industries – and they hold a great
potential for energy efficiency improvement in terms of design, system con-
text, and operation.
According to IEA, electric motor systems account for 64% of manufacturing
electricity use in industrial facilities worldwide and they are the largest single
electricity end-use accounting for more than 40% of global electricity con-
sumption. Around 25% of their electricity consumption could be saved cost-
effectively, “reducing total global electricity demand by about 10%.” (IEA,
2011 and Rao, 2013)
It is for example estimated that in Ecuador 73% of all electricity consumed in
industry is consumed by motor systems (Fossa, et al., 2013) and in Brazil in-
dustrial motor systems alone represent 62% of electricity consumption and
28% of all electricity consumption in Brazil (Assumpção, et al., 2013).
Production processes and equipment change over time and inefficiencies
compound and reoccur (Rao, et al., 2013). Therefore, even countries that
have pursued industrial energy efficiency for many years can continue to har-
vest cost-effective savings in motor systems. Two such countries are the
Netherlands and Denmark. Research and pilot projects in the Netherlands
show that system optimisation and best-available-technologies can deliver 20-
30% electricity reduction within motor system for industrial heating, cooling,
and ventilation systems and industrial production (van Werkhoven, et al.,
2013). In Denmark, about 70% of the electricity consumed in Danish factories
is for motor-driven systems and several studies estimate potential saving lev-
els to 5-30%. (Hvenegaard, 2009)
A huge potential

68
Figure 19: Estimated global electricity consumption by motors (based on (Waide, et al., 2011), page 40).
Motor systems can be complex systems and its efficiency depends on various
factors which include: motor efficiency; motor controls (such as soft-starters
and variable speed drives); the distribution network that feeds the motor
(attention to power factor and distribution losses); system oversizing (proper
equipment sizing); the transmission and mechanical components (optimized
transmission systems); maintenance practices (careful maintenance of the
entire drive power system) and the match between the load and the motor
(good load management practice). (Fossa, et al., 2013)
Figure 20: General configuration of a motor system showing the component that influence system efficiency (Fossa, et al., 2013).
The term “electric motor systems” may include:
The motor itself,
Motors
Losses in transmission
and distribution
Light
Electricityconsumption
Electricity production
Medium (0.75-375 kW)
Electronics
Standby and other
Electrolysis
Heat
Large (> 375 kW)
Small (< 0.75 kW)
Pumps
Fans
Mechanical movement
Compressors
Motor systems
Definition

69
The equipment driven by the motor (pumps, fans, compressors, etc.) including interconnections and variable speed drives, and
The “eventual application of power (a water heating piping system, an air ventilation ducting system, a cooling system with its cold water network and the cooling tower, a compressed air pipe system and the storage tank, a conveyor belt installation, an elevator for people and goods, etc.) as well as electric equipment between the grid and the motor (such as uninterruptible power supply, transformers, power factor compensation etc.)”. (Waide, et al., 2011)
Furthermore, motors may be a separate piece of equipment or fully embed-
ded in other equipment. Table 11 provides an overview of the main types of
motors and their typical characteristics.
Small Medium Large
Range > 0.75 kW 0.75-375 kW >375 kW
Stock 2,000 million (90%) 230 million (10%) 0.6 million (0.03%)
Electricity consumption
9% 68% 23%
Typical ap-plication
Fully integrated in appliances, small pumps, small fans
Pumps, fans, com-pressors, conveyors, and industrial han-dling and processing applications
Industrial and infra-structural applica-tions
Operation voltage
Often operate at mains voltage or less (> 240 Volt)
Low voltage i.e. 200-1,000 Volt
High voltage i.e. 1,000-20,000 Volt
Phase etc.
Often single phase induction, shaded pole, or shunt-wound motors,
Polyphase, typically asynchronous AC induction motors, 2,4,6 or 8 poles,
Polyphase, synchro-nous,
Production Custom made to fit another product
Large series, stan-dard dimensions
Custom-designed, assembled on site
Table 11: Main types of motors and their typical characteristics (inspired by (Waide, et al., 2011)).
As a consequence, the EE measures related to motors systems span from sim-
ple to more advanced, and some improvements can be achieved without capi-
tal investment.
Minimum energy performance requirements can help remove the least en-
ergy efficient products on the market. One of the important instruments tar-
geting among other motors is thus the EU minimum energy performance
EU MEPS

70
standards (MEPS)1 which ensure a certain minimum efficiency of the new
products sold in the EU and motors are since June 2011 also encompassed.
The MEPS for motors are in Europe and Asia described by use of IEC/EN stan-
dards set by the International Electrotechnical Commission (IEC)2. USA, Can-
ada, and other countries related to the US have a similar system named
NEMA.
The EU MEPS for new motor purchases is as follows:
From 16 June 2011: IE2 for motors with an output of 0.75-375 kW.
From 1 January 2015: IE3, or IE2 fitted with variable speed drive for motors with an output of 7.5-375 kW (i.e. 0.75-7.4 remains IE2).
From 1 January 2017 = IE3, or IE2 fitted with variable speed drive for motors with an output of 0.75-375 kW.
A 3-pole, 50 Hz motor with an output of for example 0.75 kW must have an
efficiency of 79.6% in class IE2 and 82.5% in class IE3.
A tendency among management to focus on up-front investment rather than
life-cycle-cost (figure) overlooks the fact that the initial investment is only a
very small part of the total life-cycle-cost.
Other barriers to efficiency include a tendency to focus on individual compo-
nents rather than systems and a disconnect/split incentive between manage-
ment staff and technical operators.
There are two simple indicators of inefficient motor systems (Brunner, et al.,
2013):
1. The age of the motor system stock – If the motor system stock is old it shows lack of renewal and technical enhancements; and
2. How well the motor system size fits the task – If the motor systems are oversized it results in low efficiencies due to only partial loads.
An inspection of 17 industrial parks and 4,142 electric motor systems in Swit-
zerland showed that more than 56% are older than the 10-20 year operating
life expectancy and on average about double the expected age. The analysis
1 COMMISSION REGULATION (EC) No 640/2009 of 22 July 2009 implementing Directive 2005/32/EC of the
European Parliament and of the Council with regard to ecodesign requirements for electric motors. 2 IEC 60034 standards contain recommended electrical practices developed by the participating IEC coun-
tries. Mechanical dimensions and tolerances of motors are specified by the IEC 600 72 and EN50347 stan-dards. Metric units (SI units) apply.
What is the challenge?

71
found that the oldest motor had been running for 64 years! (Brunner, et al.,
2014)
Figure 21: Actual motor age surveyed in Swiss industrial companies compared to expected life-time. The red line shows the expected lifetime of motors according to Anibal de Almeida et al, EUP Lot 11 Motors, ISR- University of Coimbra, 2008. (Brunner, et al., 2014)
In growing industries, there is an opportunity to secure energy efficiency at
little extra cost and hassle provided that decisions are influenced at the right
moment. However, it is a challenge that motor retailers have an economic
incentive to promote larger motors thus leading to a risk of oversizing relative
to the actual needs of a given company.
11.2 Illustrative examples
A strategy comprising energy audits and energy management supplemented
with a focus on motor systems would target a large portion of the industrial
energy consumption and would, if successful, have a significant impact. This
fact is recognised worldwide and is reflected in the national industrial energy
efficiency strategies of several countries as well as several international coop-
eration for a including UNIDO. Some example of international cooperation are
provided below followed by examples of national strategies/policies.
International cooperation
The Electric Motor Systems Annex (EMSA1) is an annex under the IEA Imple-
menting Agreement for a cooperation program on energy efficient end-use
equipment2 (4E). The aim of EMSA is to raise worldwide awareness of the
efficiency potential of motor systems and provide guidance and tools to ex-
1 http://www.motorsystems.org/.
2 http://www.iea-4e.org/about-4e.
EMSA

72
ploit this. More specifically EMSA work addresses international standards,
policies, testing, and capacity building. EMSA was created in 2009, renewed in
2012, and will run until 2014. The current participants are Australia, Austria,
Denmark, Netherlands, Switzerland, and USA.
EMSA works for globally harmonized and robust technical standards for the
classification and testing of motors and variable frequency drives through
representation in standards working groups, and for implementing motor
system management as part of the energy management system standard ISO
50001.
The Danish Technology Institute has developed a motor system assessment
tool1 for EMSA. This tool is unique in how it is applying a system approach to
energy efficiency. Not only is the motor performance calculated, but also the
transmission, drive and load itself are calculated and optimised.
Best practices and factsheets will be produced that are suitable to inform both
a technical and non-technical public. (van Werkhoven, et al., 2013)
Figure 22: EMSA works on different levels (Brunner, et al., 2013).
The European Motor Challenge program2 is promoted by the European Com-
mission and offers assistance to companies in improving their electric motor
driven systems through national contact points in each EU Member State. It
was launched in 2003, inspired by an earlier program in USA.
1 Can be downloaded at http://www.motorsystems.org/motor-systems-tool.
2 Main page: http://re.jrc.ec.europa.eu/energyefficiency/motorchallenge/index.htm; Evaluation:
http://re.jrc.ec.europa.eu/energyefficiency/motorchallenge/pdf/The%20European%20Motor%20Challenge%20Programme_Evaluation%202003-2009.pdf
Motor challenge

73
Companies that use motor driven systems can request “Partner” status while
companies that supply motor driven systems and services can become “En-
dorsers”. Endorsers get public acknowledgement for their efforts to support
the Motor Challenge program.
As a partner, a company commits to the following:
Carry out an inventory of company’s motor driven systems.
Assess possible energy efficiency improvements.
Formulate an action plan that defines the scope and nature of the company’s commitment to energy efficiency. (After which the Com-mission approves the action plan and grants Partner status to the company.)
Execute the action plan and submit annual progress reports to the European Commission.
The partner company commits to undertaking specific measures to reduce
energy consumption but the partner company decides which production sites,
and which types of systems are covered by the commitment. In return, the
company receives advice and technical assistance. Guides and materials are
accessible via the Motor Challenge website. An example is the database for
motor systems, EuroDEEM1, which contains data on high efficiency electric
motors.
The partner company is also rewarded by recognition by the European Com-
mission in the form of:
Plaques on the company building or production plant;
Press releases;
Exclusive use of the Motor Challenge logo;
Inclusion in the partnership catalogue;
Participation in the Motor Challenge awards.
Overall the Motor Challenge is a relatively “soft” instrument aimed at creating
awareness and visibility.
1 http://re.jrc.ec.europa.eu/energyefficiency/motorchallenge/index.htm

74
National policies
China became the largest energy user in the world in 2009 and the largest
energy related CO2 emitter in 2007. Industry accounts for about 70% of these
(Shi, et al., 2014). The Top 1,000 program and its successor the Top 10,000
program are the key policies aimed at reducing the energy intensity of the
Chinese industrial sector. The Top 10,000 presented in the 12th Five-Year-Plan
(2011-2015) covers more than 15,000 industries and 2,000 buildings and 160
transport entities – in total representing about 2/3 of China’s total energy
consumption. The target is 7,327 PJ reduction in energy consumption.
The program components are benchmarking, audits, technical retrofit projects
and incentives/penalties. The financial incentives for implementation of EE
projects under the 12th Five-Year-Plan were increased from 200 RMB to 240
RMB (27 EUR) per ton carbon saved per year for East China and from 250 RMB
to 300 RMB (33 EUR) for Central and west China and the minimum project size
to qualify was reduced from 10,000 ton standard coal equivalent (293 TJ) to
5,000 (147 TJ). The projects must be within coal-fired industrial boiler retro-
fits, district cogeneration, waste heat and pressure utilisation, oil conservation
and substitution, or energy efficiency improvement of motor systems. (Shi, et
al., 2014), while energy audits, training and capacity building for auditors,
energy management do not receive financial support.
China’s 10 Key Projects for EE1, launched in connection with the 11th Five-
Year-Plan, include a motor system program since the sales of small and me-
dium sized three-phase asynchronous motor grew more than 14% in 2011.
The program continues in 12th and 13th Five-Year-Plan (Zhao, et al., 2013).
China has about 3,000 motor manufacturers and motor manufacturers are
small and sporadically dispersed with weak product development capability
and low overall EE. High efficiency motors only make up 3% of the Chinese
market and most are exported.(China motor efficiency upgrading program
2013-2015; Ministry of Industry and Information Technology of the People’s
Republic of China, EEMODS October 2013).
1 The “10 Key Projects” for EE improvement focus on 1) coal-fired industrial boiler (kiln) retrofits, 2) district
cogeneration, 3) waste heat and pressure utilisation, 4) oil conservation and substitution, 5) motors energy efficiency, 6) energy system optimisation, 7) building energy conservation, 8) green lighting, 9) government agency energy conservation, and 10) energy saving monitoring and testing and technology service system building. (Levine, et al., 2011)
China

75
Minimum energy performance standards are in China combined with recom-
mended efficiencies, which will become mandatory within a short time hori-
zon e.g. 4-5 years. (Zhao, et al., 2013)
The Dutch motor strategy consists of three core initiatives – Voluntary agree-
ment program for energy management systems, participation in IEA 4E Elec-
tric Motor Systems Annex (EMSA) and electric motor systems knowledge net-
work (van Werkhoven, et al., 2013) – supplemented by the “Green Deal” pro-
gram.
The first generation of voluntary agreements were signed in 1992 with the
Ministry of Economic Affairs and the agreement was to reduce annual energy
use per unit produced by 2%. The current and third generation of voluntary
agreements (VA3) were signed in 2008 and will run until end 2014. The ambi-
tion is to achieve 30% EE improvement over the period 2005-2020. The Dutch
Ministry of Economic Affairs has similar agreements with industrial companies
subject to the EU ETS. VA3 signatories must implement three activities: Make
an EE plan every four years, monitor production levels and energy use annu-
ally, and implement an energy management system. Activities are organised
for the VA3 signatories such as thematic workshops, pilot projects, energy
audits, and technology road maps.
In the past years, special attention is given to motor system efficiencies. Mo-
tor measures have been added to the list of technologies subject to a tax re-
lief program which rewards companies that invest in EE and sustainable en-
ergy – the net profit on their investment in EE equipment can amount up to
11%. The VA3 signatories can also apply for an “Energy Investment Allow-
ance” support to cover the costs of an action plan for electric motors pro-
vided, that these are implemented.
A random sample check of the VA3 companies is carried out annually to as-
sess compliance but also the level of activity. The 2012 sample check showed
that a weak point is a weak or non-existent management review of operation
leading to low involvement and lack of monitoring of the actual effectiveness
of the implementation EE measures.
The Netherlands also participate in several cooperation such as the EMSA
work for globally harmonised and robust technical standards for the classifica-
tion and testing of motors and variable frequency drives through representa-
tion in standards working groups, and for implementing motor systems man-
The Netherlands

76
agement as part of the energy management systems standard ISO 500011.
(van Werkhoven, et al., 2013)
In addition to these three core policies the Dutch government has also
launched a project – “The Green Deal Efficient Motor Systems” to achieve
tangible energy savings and CO2 reduction through the use of efficient motor
systems in industrial companies (van Werkhoven, 2014). The “Green Deal
Efficient Electric Motor Systems” is one of more than 100 projects within the
Dutch Green Deal program, aimed at sustainable development. Green Deal
projects are initiated by market actors, non-governmental organisations,
whilst the Ministry of Economic Affairs delivers facilitating services and helps
in removing existing barriers in regulation, market circumstances and such.
The “Green Deal Efficient Electric Motor Systems” was formulated by the Fed-
eration of Suppliers of Electric Motors, Drives, and Automation (FEDA) and
Uneto-VNI, the trade association of installation and electromechanical main-
tenance companies, and the Dutch National Office of Entrepreneurs. It runs
from 2012 to 2015 and there are currently additional 28 producers & retailers
of motor systems, producers and retailers of pump systems, and installers and
maintenance companies have signed on as partners2.
The goal is to establish a standardised, systematic, step-by-step audit method
for retrofitting motor systems applying best available technologies and life
cycle costing principles which shall be proven through real-life application at
35 industrial users. By doing so it also creates case examples that can inspire
other companies to follow. The activities also include exploration of financing
options and knowledge transfer and training.
An important feature of the program is the involvement of motor suppliers
and service companies. Furthermore, they learn to apply a new business
model based on efficient systems while the industrial case companies save
energy and familiarize themselves with the benefits of efficient motor sys-
tems. (Brunner, et al., 2014)
1 ISO 50001 Energy Management was launched in 2011 and seeks to establish routines for continual con-
sideration of energy issues in the management (investment) and operation & maintenance (O&M) culture of the individual company. It provides a framework of requirements for organisations to: Develop a policy for more efficient use of energy, fix targets and objectives to meet the policy, use data to better understand and make decisions about energy use, measure the results, review how well the policy works, and continu-ally improve energy management. http://www.iso.org/iso/home/standards/management-standards/iso50001.htm. 2 http://greendealaandrijfsystemen.nl/

77
Swiss Agency for Efficient Energy Use launched a financial incentive program
on 1 November 2010 that will run until 31 October 2014. It is called the Effi-
ciency for Electric Motor Systems (EASY1) and the goal of the program is to
retrofit existing motor systems in mid-size industrial and infrastructure plants
as well as large buildings with 10-50 GWh/year electricity consumption. The
program budget is 1.22 million EUR (1 million CHF) from public funding.
EASY operates with four levels of subsidy depending on the steps in the im-
plementation process (see Figure 23). Step 1 is an assessment of the EE poten-
tial and the subsidy covers 100% of the assessment cost. Step 2 consists of
compiling an overview of the motors in the company. For each motor 6 crite-
ria are used to assess whether the motor should be tested i.e. proceed to step
3. This work is subsidized with 25-75%. The subsidy for step 2 is paid in three
instalments – 25% in step 2 25% after completion of step 3 and 25% after
completion of step 4. Thus if only step 2 is completed the subsidy is 25%. Step
3 is on-site testing of selected or all motor systems in place and 50% subsidy is
possible. The fourth and final step is the actual implementation of EE im-
provements. Here a 10% subsidy is offered. (Werle, et al., 2013)
Figure 23: The four steps of the EASY program and the respective subsidy levels (Werle, et al., 2013).
However, the Swiss government is aware of the fact that although subsidies
might help to open doors it does not remove all barriers to EE. Another initia-
tive to further EE includes an education program for energy management at
University of Geneva, available as of January 2013. Furthermore, the Swiss
government plans to introduce a voluntary agreement program for energy
intensive companies i.e. companies whose electricity costs constitute more
1 www.topmotors.ch/easy.
Switzerland

78
than 5% of total costs. Companies that sign on will in return get their feed-in
tariff payment refunded.
Typical EE measures, which have been implemented at participating compa-
nies, are (Werle, et al., 2013):
Higher-level control system for compressed air and cooling systems,
Reduction of volume, nominal pressure and speed in air ducts and wa-ter pipes,
Downsizing of motors based on actual measured requirements,
Improve starting conditions to reduce maximum required torque,
Replacement of old motors with new (down-sized) IE3 motors,
Installation of variable speed drives in motors with variable load con-ditions,
New, smaller components (e.g. pumps, fans, compressors) for an op-timised system,
Better transmission (synchronous belts) or direct drive,
Optimization of operating hours depending on production require-ments (e.g. necessary operation during the night, weekend, etc.).
The Japanese Top Runner program1 was launched in 1999 with the ambition
to push product development and sales towards more EE products. The Top
Runner program operates with two types of standards (Shibata, 2013):
Minimum energy performance standard (MEPS) which requires prod-uct manufacturers to achieve prescribed minimum efficiencies in each product. Sale of products not meeting the standard is prohibited.
Class-average standards (CAS) which are the average efficiency of a manufactured product, allowing each manufacturer to select the level of efficiency for each model so that the overall average is achieved. CAS allows manufactures to meet the standard by the sales-weighted average energy efficiency, which brings the benefit that manufactur-ers can provide a variety of product line-up to meet the consumers’ needs (both low and high efficiency), while guaranteeing the total en-ergy efficiency of the market.
The standard is set at the level of the most efficient product that exists in the
market at the time of standard setting.
1 http://www.eccj.or.jp/top_runner/
Japan

79
Energy performance standards for three-phase motors were agreed in De-
cember 2011 and the “requirements regarding product coverage, standard,
and target year were specified in 2013”. The standard was set at the level
equal to IE3 standard1. Manufacturers and importers are required that sales-
weighted average efficiency of their products in each category should exceed
the standard by the target fiscal year 2015. By implementing the standards,
the sales weighted average efficiency is expected improve from 81.1% in 2010
to 87.1% in 2015. (Shibata, 2013)
One of the reasons for the success of the Top Runner program is a high en-
forcement/compliance. The Japanese business culture (and social culture)
places great emphasis on being the best and not losing face e.g. in case of
non-compliance. The fact that it is at all possible to agree on standards can be
attributed the cooperation among stakeholders in setting standards and that
the maturity of the technologies in question allows competition on EE im-
provements. On the other hand, lessons learned are that excess focus on EE
can result in other product features being counterproductive (e.g. growth in
size of room air conditioner, reduced lifetime of gas boilers due to corrosion
from condensation caused by the lowering of exhaust gas temperature)
(Shibata, 2013).
11.3 Recommendations for Egypt
An Egyptian motor policy for industry should aim to:
Speeding up elimination of inefficient motor systems,
Promoting uptake of energy efficiency motor systems, and
Strengthening motor system management.
Many of the barriers to motor system efficiency will be common to those of
other countries but the most effective way to overcome these barriers could
differ due to differences in industrial practices and the special features of
Egyptian society. A sound first step to formulating a motor policy for Egypt
could therefore be to describe the current motor situation in Egypt. This
“mapping” could for example be conducted as a focus group discussion with
representatives of industries, branch organisations, universities, suppli-
1 Commission Regulation (EC) No 640/2009 of 22 July 2009 implementing Directive 2005/32/EC of the
European Parliament and of the Council with regard to eco-design requirements for electric motors, http://eur-lex.europa.eu/LexUriServ/LexUriServ.do?uri=OJ:L:2009:191:0026:0034:EN:PDF
Mapping the motor
situation

80
ers/importers, Egyptian motor/equipment producers. A focus group discus-
sion is a small-group discussion guided by a facilitator1.
Topics for discussion could include:
What is the current state of motor stock and system operation and maintenance practices including the logics behind the practices?
What characterises the Egyptian motor market including available product ranges, efficiency levels, prices, services, and preferences for second-hand equipment?
What are the prevalent company management practices in particular regarding responsibility, investment decisions, and upgrading of staff qualifications?
What are the major concerns of industrial companies by segment?
What role do the branch organisations have?
What mandatory requirements are currently placed on the industrial companies (e.g. environmental requirements regarding reporting of waste, financial information for tax purposes, reporting statistical data)?
What is the awareness of company energy consumption levels and degree energy efficiency among various levels of management and staff?
As time progresses and audits are carried out and energy management sys-
tems are implemented in some companies as a consequence of the current
UNIDO initiative these can feed back to the understanding of the motor situa-
tion in Egypt and related topics. A deliberate and structured collection of ex-
periences gained through the audits and energy management systems would
be highly beneficial to any future EE initiatives and adjustment of existing
initiatives.
A motor policy could contain elements for all company sizes but be tailored to
the size specific needs.
1 Focus group discussions are often used to learn more about opinions on a designated topic, and then to
guide future action. A focus group is different from regular group in three ways: 1) The group has a specific discussion topic (a focus). The group's task is to stay on it, and not wander all over the place. 2) The group has a facilitator whose task it is to keep the group on course. 3) The group's composition and the group discussion are carefully planned to create a non-threatening environment, in which people are free to talk openly. The participants are actively encouraged to express their own opinions and respond to other mem-bers, as well as to questions posed by the leader. Because focus groups are structured and directed, but also expressive, they can yield a lot of information in a relatively short time
Success inspires success

81
It will be important to build success stories from the beginning to help lever-
age interest. These should not be limited to written materials. A higher impact
can be expected if successful companies are given the opportunity to present
their own experiences to their peers (“show-and-tell”).
There are here-and-now possibilities for improving energy efficiency with no
capital investment. Targeting these could open the door for more substantial
alterations. And they could ensure some progress towards energy efficiency
while more laborious initiatives such as mandatory requirements are devel-
oped, politically approved, and launched.
Experience from other countries show that alliances with branch associations
are an effective way forward. These associations may help blue stamp the
policy initiatives but also function well as a gate for access to member compa-
nies. Working together has mutual benefits and provides branding opportuni-
ties. The association would be seen to be doing something for its members,
and the policy initiatives could be tailored to the specific needs of the branch
in question and be combined with other business concerns such as environ-
mental requirements.
Voluntary agreements is a more flexible alternative to mandatory motor re-
quirements although the voluntary agreements also contain commitments
and possible penalties. If voluntary agreements are to be used it might be
relevant to operate with 2-3 types of agreements – one for branch associa-
tions, one for energy intensive industries, and one for state-owned compa-
nies.
Experiences from all over the world show that there is a long way from the
best of intentions to action no matter how cost-effective a solution is. A “Mo-
bile motor diagnostic team” that proactively seeks up industrial companies
and offers their diagnostic services/assistance could stimulate company inter-
est and actual implementation of motor related EE improvements.
Manuals and tools necessary for assessing the current situation and potential
improvements have already been prepared by others and presumably only
minor adaptations to Egyptian context if any are necessary.
Financial incentives of some kind will most likely be needed at least initially to
spark an interest. Such incentives can take many forms and care should be
taken to develop incentives well suited for Egypt. Examples include:
Start small
Alliances
Voluntary agreements
Mobile diagnostic team
Financial incentives

82
Income tax based incentives such as preferential income tax (e.g. 10% of investment value can be deducted and exempted from tax payable in the year of investment and can be carried over the next five years if income tax amount is lower1);
Reduction of energy taxes or environmental taxes;
Special loans – For example interest free loans for EE equipment in-vestment or low interest loans with the interest rate depending on the equipment efficiency levels or comprehensiveness of alterations;
Subsidies – That vary depending on investments, equipment efficiency levels and/or achieved energy efficiency improvements. The need for A time limit can help improve impact per spent EUR and spur on a rapid response;
In addition to tax measures, public financing, and international funds the tra-
ditional funding sources for companies include commercial banks, lending
institutions, venture capital firms, equity funds, strategic partnerships (e.g.
utilities and engineering firms), leasing companies; and equipment manufac-
turers.
Finally, a motor policy should contain elements so that all key actors are tar-
geted – policy makers, research & education institutions, producers, import-
ers, retailers, service companies (including audit experts), and industrial com-
panies (managers, facility engineers).
1 Zhao (2013)
Target all key actors

83
Part III: References
84
12 Additional information
12.1 Keeping updated
Today several international fora for collaboration and sharing experiences on
energy efficiency related matters exist. Some of the most relevant for Egypt
are listed below.
Energy efficiency
The Regional Centre for Renewable Energy and Energy Efficiency (RCREEE) is
an independent non-profit regional organisation, established in 2010, which
aims to enable and increase the adoption of renewable energy and energy
efficiency practices in the Arab region. Current member states are: Algeria,
Bahrain, Djibouti, Egypt, Iraq, Jordan, Lebanon, Libya, Morocco, Palestine,
Sudan, Syria, Tunisia, and Yemen. RCREEE is financed through its member
state contributions, government grants provided by Germany through the
German Development Cooperation (GIZ), Denmark through the Danish Inter-
national Development Agency (DANIDA), and Egypt through the New and
Renewable Energy Authority (NREA). RCREEE is also financed through se-
lected fee-for-service contracts. Work areas included research and analysis,
capacity development, and technical assistance. http://www.rcreee.org/
American Council for an Energy-Efficient Economy (ACEEE), founded in 1980,
is a non-profit, organisation that acts as a catalyst to advance energy effi-
ciency policies, programs, technologies, investments, and behaviours. ACEEE
focuses on energy policy (federal, state, and local), research (including pro-
grams on buildings and equipment, utilities, industry, agriculture, transporta-
tion, behaviour, and economic analysis), and outreach (including conferences,
publications, and the Ally Program). http://aceee.org/
European Council for an Energy Efficient Economy (ECEEE), founded in 1993, is
a membership-based non-profit association, that generates and provides evi-
dence-based knowledge and analysis of policies, and we facilitate co-
operation and networking through our Summer Studies, workshops, and so-
cial media. http://www.eceee.org/
ECEEE also organises biannual conference on matter relating to industrial en-
ergy efficiency, http://www.eceee.org/industry
RDCREEE
ACEEE
ECEEE

85
The Institute for Industrial Productivity (IIP), established in 2010, is an inde-
pendent non-profit organisation whose aim is to accelerate the uptake of
industrial energy efficiency practices by partnering with both industry and
governments. IIP work focuses on the countries and sectors that drive indus-
trial demand and offer major opportunities for improvement – such as in the
cement, iron and steel, and chemicals sectors in China, India, and USA. IIP has
created an industrial efficiency policy database (IEPD) that provides informa-
tion on industrial energy efficiency and greenhouse gas mitigation policies,
currently containing policies from 14 countries: Australia, Canada, Germany,
Russia, South Africa, Thailand, Sweden, Finland, the United Kingdom, Japan,
India, the Netherlands, the United States and China.
http://iepd.iipnetwork.org/
Energy efficient motor systems
Energy Efficiency in Motor Driven Systems (EEMODS) conference, first organ-
ised in 1996, is an annual conference. In relation to each conference a maga-
zine is published. http://www.eemods2013.org/Default.asp
Electric Motor Systems Annex (EMSA) is an annex under the IEA Implementing
Agreement for a cooperation program on energy efficient end-use equip-
ment1 (4E). EMSA was created in 2009 and addresses international standards,
policies, testing, and capacity building, http://www.motorsystems.org/
Standards and labelling
CLASP, founded in 1999, develops and shares practical and transforming pol-
icy and market solutions in collaboration with global experts and local stake-
holders. CLASP is a leading international resource and voice for energy effi-
ciency standards and labels for appliances, lighting, and equipment. CLASP has
worked in over 50 countries on 6 continents pursuing every aspect of appli-
ance energy efficiency, from helping structure new policies to evaluating exist-
ing programs. http://www.clasponline.org/
The International Organisation for Standardisation (ISO), was created in 1947,
and develops and publishes international voluntary standards. ISO has pub-
lished more than 19,500 International Standards covering almost all aspects of
technology and business from food safety to computers, and agriculture to
healthcare. ISO member count 162 countries including Egypt (represented by
1 http://www.iea-4e.org/about-4e.
IIP
EEMODS
EMSA
CLASP
ISO

86
Egyptian Organisation for Standardisation and Quality Control).
http://www.iso.org/iso/home.html
Energy efficiency policy development
The Latin American and the Caribbean Network for Energy Efficiency (Red-
LacEE), created in 2011, is a public/private non-profit organisation that con-
tributes to develop energy efficiency in the region, facilitating exchange and
dissemination of technical, legal, and regulatory information among institu-
tions and interested professionals in the region. http://red-lac-ee.org/
RedLacEE is based in the offices of the Permanent Secretariat of the Latin
American Energy Association (OLADE) in Ecuador.
OLADE was created in 1973 to protect the natural resources in the region and
further technical cooperation on policies for sustainable development. OLADE
is the political and technical support organisation by means of which its Mem-
ber States undertake common efforts to achieve regional and sub-regional
energy integration.
United Nations Industrial Development Organisation (UNIDO), created in
1966, is an autonomous body under United Nations. UNIDO aims to promote
and accelerate inclusive and sustainable industrial development in developing
countries and economies in transition. UNDIO work focuses on poverty reduc-
tion through productive activities, trade capacity-building, and energy and
environment, including assistance to resource-efficient and low-carbon indus-
trial production. http://www.unido.org/ Publication themes include industrial
energy efficiency http://www.unido.org/en/resources/publications/energy-
and-environment/industrial-energy-efficiency.html
Evaluation of energy efficiency policies and programs
North American International Energy Program Evaluation Conference (IEPEC)
is a conference first held in 1984 and again in 1985. Since then conferences
are held biannually and as of 2010 a European conference has been added in
alternate years. Due to the broader scope of evaluation and especially the
focus on policies, the name has recently changed to International Energy Poli-
cies & Programmes Evaluation Conference (IEPPEC). The purpose of the con-
ferences is to provide a forum for the presentation, critique, and discussion of
objective evaluations of energy policies and programs. http://www.iepec.org/
RedLacEE
UNIDO
IEPEC / IEPPEC
87
12.2 References
Assumpção, A.H., et al. 2013. Methodology for implementation of energy
efficiency actions in Brazilian industrial sector. EEMODS 2013 conference
proceedings. 2013, s. Paper 080.
Backlund, Sandra, et al. 2012. Extending the energy efficiency gap. Energy
Policy 51 (2012). September 2012.
Bertoldi, P. 2010. Energy supplier obligations and white certificate schemes:
Comparative analysis of experiences in the European Union. s.l. : European
Commission, Institute for Energy Joint Research Centre, 2010.
Betz, R., et al. 2013. Trading in energy efficiency in Australia: What are the
lessons learnt so far? ECEEE Summer Study proceedings. 2013.
Blanc, Frédéric. 2012. Energy Efficiency: Trends and Perspectives in the
Southern Mediterranean. s.l. : MEDRO Technical Report No. 21, 2012.
Brunner, Conrad U. og Werle, Rita. 2013. Market transformation program for
electric motor systems – Global progress report and outlook. EEMODS 2013
conference proceedings. 2013, s. Paper 086.
Brunner, Conrad, et al. 2014. How to achieve efficiency through the right mix
of policies? Guidelines for electric motor policy implementation. ECEEE
Industrial Summer Study proceedings. 2014.
Bundgaard, S.S. 2013. Evaluation of the Energy Efficiency Obligation in
Denmark. ECEEE Summer study Proceedings. 2013.
Cambell, Nina og Ryan, Lisa. 2012. Spreading the net: The multiple benefits of
energy efficiency improvements. IEA Insight Series. 2012.
Chausovsky, Alex. 2013. Example of changes in global sales can be found in
Industrial motors and drives markets. World Pumps. April 2013.
Cooremans, Catherine. 2014. CAS in energy management: an innovative
continuing education program as a tool to market transformation. Paper at
ECEEE 2014 Industrial Summer Sutdy. 2014.
Dalkmann, H., et al. 2005. Review of Voluntary Approaches in the European
Union - Feasibility Study on Demonstration of Voluntary Approaches for
Industrial Environmental Management in China. s.l. : Wuppertal Institute,
2005.
DECC. 2012. Final Stage Impact Assessment for the Green Deal and Energy
Company Obligation. 2012.
Despretz, Hubert. 2002. SAVE II Project AUDIT II: Country report France. 2002.
Di Santo, D., et al. 2011. The white certificate scheme: the Italian experience
and proposals for improvement. ECEEE Summer Study proceedings. 2011.
Dorine Putman-Devilee, ASN Bank Netherlands. 2014. Help! The bank
doesn’t understand me. ECEEE Industrial Summer Study. June 2014.

88
Ea Energy Analyses and the Swedish Energy Authority. 2013. A Nordic view
on EU energy efficiency targets. 2013.
Elrefaei, Hatem og Khalifa, Arwa A. 2014. A critical review on the National
Energy efficiency Plan of Egypt. Journal of Natural resources and
Development. 04, 2014.
EMSA. 2011. Motor policy guide – Part 1: Assessment of existing policies. s.l. :
IEA 4E EMSA, 2011.
Energy Efficiency Unit. 2012. Energy Efficiency Plan in the Electricity Sector
2012-2015. s.l. : Secretariat for the Council of Ministers, 2012.
European Commission. 2013. Guidance note on Directive 2012/27/EU on
energy efficiency, amending Direc-tives 2009/125/EC and 2010/30/EC, and
repealing Directives 2004/8/EC and 2006/32/EC – Article 7: Energy efficiency
obligation schemes. SWD(2013) 451 final of 6 November, 2013. s.l. : EU, 2013.
Fossa, Alberto José, et al. 2013. Implementing standardized energy
management systems compatible with ISO 50001 – Case study of UNIDO’s
EnMS Program in Latin America; Alberto José Fossa, International Copper
Association, Bettina Schreck, UNIDO, Edmilson Moutinho dos Santos,. 2013, s.
Paper 029.
GEF-UNDP. 2009. Energy efficiency policy in Egypts and its prospects - Energy
improvement and greenhouse gas reduction. 2009.
Giraudet, L.-G., Bodineau, L. og Finon, D. 2012. The costs and benefits of
white certificates schemes. Energy efficiency. 2012.
Goldberg, A. og Reinaud, J. 2012. Promoting Energy Management Systems
through Energy Efficiency Programmes, Incentives and Support – Lessons
Learnt from Evaluations in Denmark, Ireland and Sweden. IEPIC conference.
2012.
Goldberg, A., Taylor, R.P. og Hedman, B. 2014. Attracting industrial
companies through effective design of energy efficiency programs. ECEEE
Industrial Summer Study proceedings. 2014.
González, Adriana J., Castrillón, Rosaura og Quispe, Enrique C. Energy
efficiency improvement in the cement industry through energy management.
IEEE 2012 conference proceedings.
Greaume, F. og Borde, C. 2011. The French Energy Savings Certificates
Scheme. s.l. : ADEME – Agency for Environment and Energy Management,
2011.
Gürtler, Andreas og Badia, Neus Barres. 2014. TIPCHECK: an innovative
European energy audit standard for industrial installations. ECEEE 2014
Industrial Summer Study proceedings. 2014.

89
Hedman, Bruce, Goldberg, Amelie og Taylor, Robert P. 2014. Toys in the
sandbox: Attracting industrial companies through effective design of energy
efficiency programs. ECEEE Industrial Summer Study proceedings. 2014, 1-074.
Hvenegaard, Claus. 2009. Small changes - Big savings! EEMODS 2009
conference proceedings. 2009.
IEA. 2012. Energy efficiency policy – Worldwide implementation now. 2012.
—. 2012. Energy management programmes for industry. s.l. : IEA Policy
Pathway Series, 2012.
—. 2013. Energy provider-delivered energy efficiency. A global stocktaking
based on case studies. s.l. : International Energy Agency, 2013.
—. 2014. Industrial productivity & competitiveness impacts of energy
efficiency. 2014.
—. 2012. Joint public-private approaches for energy efficiency finance. s.l. : IEA
Policy Pathway Series, 2012.
—. 2013. World Energy Outlook. 2013.
Jochem, Eberhard. 2014. Energy efficiency policy as a multi-level governance
task. s.l. : ECEEE Industrial Summer Study, 2014.
JRC. 2014. ESCO Market report 2013. s.l. : Joint Research Centre, Institute for
Energy and Transport, European Commission, 2014.
—. 2010. Financing Energy Efficiency: Forging the Link between Financing and
Project Implementation. s.l. : European Commission, Institute for Energy Joint
Research Centre, 2010.
—. 2010. Voluntary agreements in the field of energy efficiency and emission
reduction; Review and analysis of experince in Member States of the
European Union. 2010.
Kahlenborn, W. 2012. Energy management systems in practice, ISO 5001: A
guide for companies and organisations. BMU and UBA. 2012.
Kimura, Osamu og Noda, Fuyuhiko. 2014. Does regulationof energy
management systems work? A case study of the Energy Conservation Law in
Japan. ECEEE Industrial Summer Study proceedings. 2014.
Lees, E. 2012. Energy efficiency obligations – the EU experience. ECEEE briefing
for DG Energy on EU energy efficiency obligations on energy companies and
their importance in meeting climate change and energy security challenges.
s.l. : Eoin Lees Energy, UK, 2012.
Levine, Mark D., et al. 2011. Assessment of China’s Energy-Saving and
Emission-Reduction - Accomplishments and Opportunities During the 11th
Five Year Plan. Energy Policy. Volume 39, Issue 4, April 2011, Pages 2165-
2178, 2011.
Logic Energy and Environics. 2014. Industrial energy efficiency in Egypt -
Activity 1 report. 2014.

90
Martínez, S. og Silveira, S. 2013. Energy efficiency and CO2 emissions in
Swedish manufacturing industries. Energy Efficiency. 2013, s. 117–133.
McKane, A., Price, L. og Rue du CAn, S.d.l. 2008. Policies for promoting
industrial Energy Efficiency in developing Countries and transition economies.
s.l. : UNIDO, 2008.
Milovanovic, Dobrica. 2012. Energy efficiency in buildings, industry and
transportation. Energy efficiency in buildings, industry and transportation”;
Dobrica Mi6th Global Conference on Power Control and Optimization. 2012.
Missaoui, Rafik, Hassine, Hassen Ben og Mourtada, Adel. 2012. Energy
efficiency indicators in the Southern and Eastern Mediterranean countries. s.l. :
Plan Bleu, 2012.
Nehler, Therese, et al. Including non-energy benefits in investment
calculations in industry - empirical findings from Sweden. ECEEE Industrial
Summer Study proceedings.
New Zealand Ministry of Economic Development. 2011. Developing our
energy potential; New Zealand energy strategy 2011-2021 and the New
Zealand energy efficiency and conservation strategy 2011-2016. s.l. : New
Zealand Ministry of Economic Development, 2011.
OFGEM. 2013. The final report of the Carbon Emissions Reduction Target
(CERT) 2008-2012. 2013.
Pasquier, S. B. 2011. Saving electricity in a hurry. s.l. : IEA, 2011.
Persson, A. og Gudbjerg, E. 2005. Do voluntary agreements deliver?
Experiences from Denmark and expectations for Sweden. ECEEE 2005
conference proceedings. 2005.
Price, Lynn og Lu, Hongyou. 2011. Industrial energy auditing and
assessments: a survey of programs around the world. ECEEE 2011 conference
proceedings. 2011, s. Paper 3-049.
Rao, Pra-kash, Hasanbeigi, Ali og McKane, Aimee. 2013. A framework to
survey the energy efficiency of installed motor systems. EEMODS 2013
conference proceedings. 2013, s. Paper 102.
RCREEE. 2013. Arab Future Energy Index (AFEX) 2013 – Energy efficiency. s.l. :
RCREEE, 2013.
—. 2012. Energy efficiency country profile – Egypt 2012. s.l. : RCREEE, 2012.
—. 2012. Renewable energy country profile – Egypt 2012. s.l. : RCREEE, 2012.
RECREEE. 2010. Provision of technical support/services for an economical,
technological and environmental impact assessment of national regulations
and incentives for renewable energy and energy efficiency. 2010.
Regulatory Assistance Project. 2012. Best Practices in Designing and
Implementing Energy Efficiency Obligation Schemes. s.l. : IEA DSM Programme
Annex XXII, 2012.

91
Reinaud, J. og Goldberg, A. 2011. Ten Key Messages for Effective Policy
Packages. Sharing best practices in Industrial Energy efficiency policies.
Institure for Industrial Productivity. 2011.
Reinaud, Julia og Goldberg, Amelie. 2014. The more the merrier: leveraging
diverse players to deploy energy management systems in industry. ECEEE
Industrial Summer Study proceedings. 2014.
Review of policies and measures for energy efficiency in industry sector.
Tanaka, K. 2011. 2011, Energy Policy.
Rogers, Patricia J., et al. 2000. program theory in evaluation: Challenges and
opportunities. s.l. : Jossey-Bass Publsihers, 2000. ISBN: 0-7879-5432-2.
Rosenow, J. 2013. The Green Deal and the Energy Company Obligation – will
it work? . White Certificate Workshop, Varese. 2013.
Rosenow, J. 2012. Energy Savings Obligations in the UK – A History of Change.
Energy Policy. 2012, Årg. 49.
Roser, Annette, et al. 2014. Organisational energy-efficient measures in
industry – a neglected energy saving potential. ECEEE Industrial Summer Study
proceedings. 2014, 5-075.
Scheuer, S. 2013. EU Energy Efficiency Directive (2012/27/EU). Guidebook for
Strong Implementation. s.l. : The Coalition for Energy Savings, 2013.
Secretariat of the Arab Ministerial Council for Electricity. November 2010.
The Arab guideline for improving electricity efficiency and rationalizing its
consumption at the end user. November 2010.
Shi, Jun, et al. 2014. Energy assessments under the Top 10,000 progra - a case
study for a steel mill in China. ECEEE2014 Industrial Summer Study
proceedings. 2014.
Shibata, Yoshiaki. 2013. The status quo of electric motor energy standard
setting and "Top Runner” experience in Japan. EEMODS 2013 conference
proceedings. 2013, s. Paper 103.
Silveira, Semida og Martínez, Clara Inés Pardo. 2012. Energy efficiency and
CO2 emissions in Swedish manufacturing industries. Energy Efficiency 2013.
April 2012.
Staniaszek, Dan og Lees, Eoin. 2012. Determining Energy Savings for Energy
Effi-ciency Obligation Schemes. s.l. : European Council for an Energy efficienct
Economy and the Regulatory Assistance Project, 2012.
Swanson, S. 2012. Regulatory Mechanisms to Enable Energy Provider
Delivered Energy Efficiency. s.l. : IEA, The Regulatory Assistance Project, 2012.
Togeby, M., Dyhr-Mikkelsen, K. og James-Smith, E. 2007. Design of White
Certificates – Comparing UK, Italy, France and Denmark. s.l. : Ea Energy
Analyses, 2007.

92
Togeby, M., et al. 2012. A Danish case: portfolio evaluation and its impact on
energy efficiency policy. Energy Efficiency. 2012, Årg. 5.
Trianni, Andrea og Cagno, Enrico. 2011. Dealing with barriers to energy
efficiency and SMEs: Some empirical evidences. Energy 37 (2012). November
2011.
Trianni, Andrea, et al. 2012. A novel approach for barriers to industrial energy
efficiency. Renewable and Sustainable Energy Reviews 19 (2013). 2012.
Trianni, Andrea, et al. Empirical investigation of energy efficiency barriers in
Italian manufacturing SMEs. Energy 49 (2013).
UN-Energy Energy Efficiency Cluster. 2009. Policies and measures to realise
industrial energy efficiency and mitigate climate change. 2009.
UNIDO. 2010. Global industrial energy efficiency benchmarking - An energy
policy tool; Working paper. 2010.
—. 2011. Industrial Development Report 2011 – Industrial energy efficiency for
sustainable wealth creation. 2011.
—. 2008. Policies for promoting industrial energy efficiency in developing
countries and transition economies. 2008.
van Werkhoven, Maarten. 2014. Engaging Dutch industry in in implementing
efficient motor systems with the Green Deal program. Paper at ECEEE 2014
Industrial Summer Study. 2014.
van Werkhoven, Maarten, et al. 2013. Implementing efficient electric motor
systems and ISO 50001: Opportunities for a 3 way approach in the
Netherlands. EEMODS 2013 conference proceedings. 2013, s. Paper 041.
Waide, Paul og Brunner, Conrad U. 2011. Energy efficiency policy
opportunities for electric motor-driven systems. s.l. : IEA Energy Series, 2011.
WEC. 2008. Energy Efficiency Policies around the World: Review and
Evaluation. s.l. : World Energy Council, 2008.
Werle, Rita, Brunner, Conrad U. og Tieben, Rolf. 2013. "Easy" program for
electric motor systems efficiency in Switzerland. EEMODS 2013 conference
proceedings. 2013, s. Paper 085.
Zhao, Yuejin, Zhao, Kai og Wang, Gen. 2013. Present situation of China’s
motor manufacturing industry and energy effi-ciency standard for motor
systems. EEMODS 2013 conference proceedings. 2013, s. Paper 074.
12.3 Useful links
IEA policies and measures database (http://www.iea.org/policiesandmeasures/energyefficiency/)
IEA Policy Pathways series; IEA and the Institute for industrial produc-
tivity; http://www.iea.org/publications/policypathwaysseries/

93
World Energy Council; Energy Efficiency Policies Database; http://www.wec-policies.enerdata.eu/
Global, Super-efficient equipment and appliance deployment (SEAD) http://www.superefficient.org/
US Office of EE and RE http://energy.gov/eere/efficiency/advanced-manufacturing
US Department of Energy, Office of EE and RE; http://energy.gov/eere/efficiency/advanced-manufacturing
EU-MURE database on energy efficiency policies; http://www.measures-odyssee-mure.eu/
EU national energy efficiency action plans submitted by the EU Mem-ber States, no. 1 and 2.; http://ec.europa.eu/energy/efficiency/end-use_en.htm
European Motor challenge www.motor-challenge.eu
European Industrial Insulation Foundation http://www.eiif.org/
European GreenLight program www.eu-greenlight.org
Chinese top ten program http://iepd.iipnetwork.org/policy/ten-key-projects-programme
French http://www.guide-topten.com/ = http://www.guidetopten.fr/
UK http://www.top10energyefficiency.org.uk/
12.4 Abbreviations
CAS – Class average standards
EE – Energy efficiency
EEO – Energy efficiency obligation
EMS and EnMS – Energy management system
EU EED – EU Energy Efficiency Directive
IEE – Industrial energy efficiency
RD&D – Research, development, and demonstration
VA – Voluntary agreements
MEPS – Minimum energy performance standard
12.5 Acronyms
ACEEE – American Council for an Energy Efficient Economy
ECEEE – European Council for an Energy Efficient Economy
EEMODS – Energy Efficiency in Motor Driven Systems
EMSA – Electric Motor Systems Annex
GoE – Government of Egypt

94
IEA – International Energy Agency
RCREEE – Regional Center for Renewable Energy and Energy efficiency
UN – United Nations

95
Appendix: Historical development of the Dan-ish IEE policy
Countries are different. The importance of industry is different and the politi-
cal priorities are different. The Netherlands has been especially successful in
using voluntary agreements, Finland are strong in energy audits and Denmark
has been a forerunner in energy efficiency obligations. The differences is also
based on the trajectory in each country. Positive results can encourage further
development along the same lines.
In the following is presented the subjective history on the long development
of Danish IEE policy – based on the authors’ active participation in the proc-
ess.
From the first oil crisis and forward there has been a broad support about the
energy policy in the Parliament. There has been lots of discussion, but most
policy decisions has been made with a broad majority with parties from left to
right.
An important focus of energy efficiency in Denmark has been on the residen-
tial sector, e.g. with high taxes (in the order of 100%) of energy. In the table
below is summarised important milestones in relation to IEE.
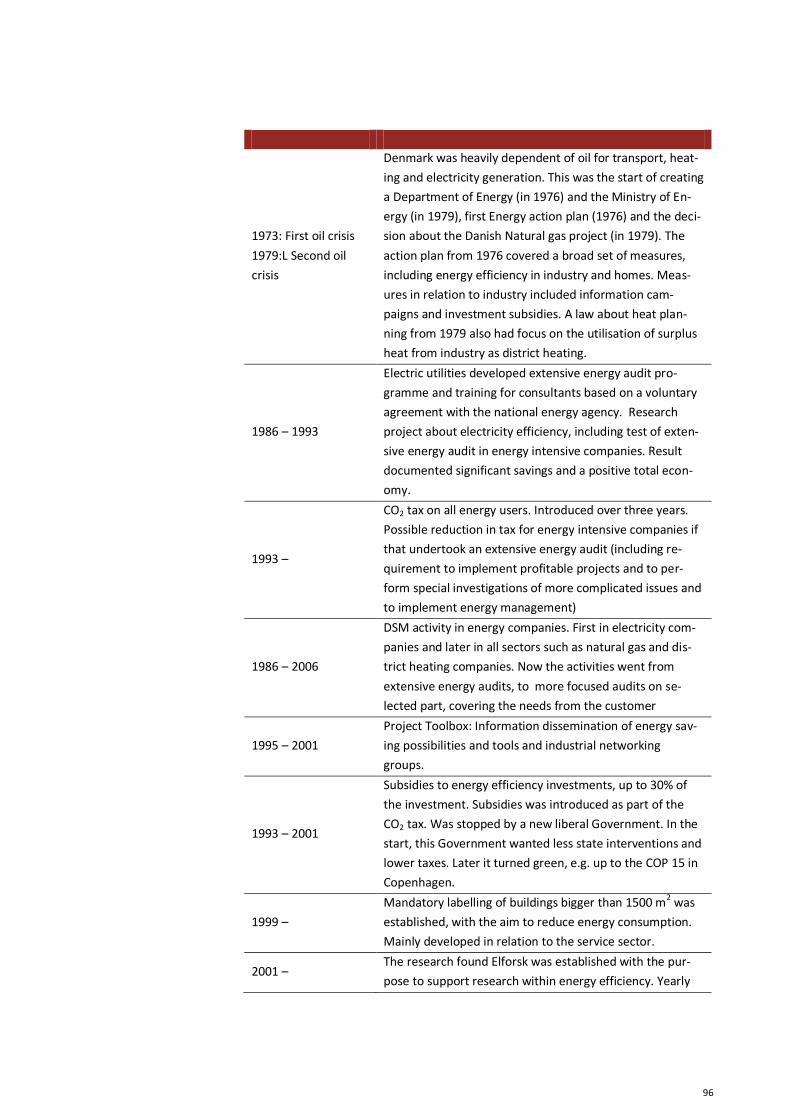
96
1973: First oil crisis
1979:L Second oil
crisis
Denmark was heavily dependent of oil for transport, heat-
ing and electricity generation. This was the start of creating
a Department of Energy (in 1976) and the Ministry of En-
ergy (in 1979), first Energy action plan (1976) and the deci-
sion about the Danish Natural gas project (in 1979). The
action plan from 1976 covered a broad set of measures,
including energy efficiency in industry and homes. Meas-
ures in relation to industry included information cam-
paigns and investment subsidies. A law about heat plan-
ning from 1979 also had focus on the utilisation of surplus
heat from industry as district heating.
1986 – 1993
Electric utilities developed extensive energy audit pro-
gramme and training for consultants based on a voluntary
agreement with the national energy agency. Research
project about electricity efficiency, including test of exten-
sive energy audit in energy intensive companies. Result
documented significant savings and a positive total econ-
omy.
1993 –
CO2 tax on all energy users. Introduced over three years.
Possible reduction in tax for energy intensive companies if
that undertook an extensive energy audit (including re-
quirement to implement profitable projects and to per-
form special investigations of more complicated issues and
to implement energy management)
1986 – 2006
DSM activity in energy companies. First in electricity com-
panies and later in all sectors such as natural gas and dis-
trict heating companies. Now the activities went from
extensive energy audits, to more focused audits on se-
lected part, covering the needs from the customer
1995 – 2001
Project Toolbox: Information dissemination of energy sav-
ing possibilities and tools and industrial networking
groups.
1993 – 2001
Subsidies to energy efficiency investments, up to 30% of
the investment. Subsidies was introduced as part of the
CO2 tax. Was stopped by a new liberal Government. In the
start, this Government wanted less state interventions and
lower taxes. Later it turned green, e.g. up to the COP 15 in
Copenhagen.
1999 –
Mandatory labelling of buildings bigger than 1500 m2 was
established, with the aim to reduce energy consumption.
Mainly developed in relation to the service sector.
2001 – The research found Elforsk was established with the pur-
pose to support research within energy efficiency. Yearly

97
calls for new projects.
2005 –
EU Emissions Trading System (EU ETS) for CO2 introduced.
New phases started in 2008 and 2013. It is a Cap & trade
system, effectively functioning as a European wide CO2 tax
for users with boilers over 20 MW. Short periods with high
CO2 price – long periods with low price and minimum im-
pacts.
2006 –
Transformation of energy companies EE activities. In-
creased focus on realise projects (instead, of recom-
mended projects): Energy efficiency obligation (EEO). The
obligation increased in 2010, 2013 and 2015. Competition
across energy types and geography. Extensive energy au-
dits are now rare. However, subsidies are used commonly.
Large portion of saving is in industry as they are the
cheapest seen from the utility and society side.
2012 EU recommend EEO to all Member states in the energy
efficiency directive
2014 Several taxes on energy is reduced for industry due to the
economic crisis.
The interest for energy policy and EE in Denmark has been more or less con-
stant since the first oil crisis. The motivation has been driven by security of
supply (e.g. oil crisis, Russian/Ukrainian natural gas crisis), environment (e.g.
greenhouses effect) and economy (e.g. trade balance).
Figure 24 illustrate the overall development for energy intensity for Danish
industry. A development in direction of less energy intensive industrial sectors
have been part of the development.

98
Figure 24. Energy and electricity intensities in Danish industry. (Danish Energy Agency, 2012)