Embed Size (px)
Citation preview
Industrial DevelopmentAgencies
in New York State
Industrial DevelopmentAgencies
in New York State
DIVISION OF LOCAL GOVERNMENT SERVICES & ECONOMIC DEVELOPMENT
BACKGROUND, ISSUES AND RECOMMENDATIONS
ALAN G. HEVESI
MAY 2006
O F F I C E O F T H E N E W Y O R K S T A T E C O M P T R O L L E R
DIVISION OF LOCAL GOVERNMENT SERVICES & ECONOMIC DEVELOPMENT / Industrial Development Agencies in New York State 1
Table of Contents
Executive Summary .................................................................................................................. 3
OSC Reform Proposals ............................................................................................................. 6
Mission and Powers of IDAs .................................................................................................... 7
Tax Exemptions and PILOTs................................................................................................... 8
Bonds ........................................................................................................................................ 9
Straight Lease Projects ............................................................................................................. 9
Retail Projects ..........................................................................................................................10
Civic Facilities .......................................................................................................................... 11
IDA Reporting Requirements ................................................................................................. 11
OSC Actions to Address Reporting Issues ..............................................................................12
Evaluations of IDA Operations ...............................................................................................14
Recent Statutory Changes .......................................................................................................16
OSC Recommendations to Address Accountability Issues ....................................................17
Financial and Statistical Summary of IDA Activities for 2004 ................................................18
Appendices ..............................................................................................................................22

Industrial Development Agencies in New York State / OFFICE OF THE STATE COMPTROLLER2
DIVISION OF LOCAL GOVERNMENT SERVICES & ECONOMIC DEVELOPMENT / Industrial Development Agencies in New York State 3
This report supplies context for the current policy discussion on Industrial Development Agencies (IDAs), details major process and accountability issues, describes efforts by the Offi ce of the State Comptroller (OSC) to improve reporting quality and provides a summary of statistical and fi nancial information from 2004 IDA annual reports.
In 1969, legislation was enacted providing for the creation of IDAs to facilitate economic development in specifi c localities, and delineating their powers and status as public benefi t corporations. The number of IDAs has fl uctuated over time, and presently there are 115 active IDAs, with one in each of the State’s counties, as well as a number of cities, towns and villages.
To improve economic conditions in their respective areas, IDAs generally attempt to attract, retain and expand businesses within their jurisdictions through the provision of fi nancial incentives to private entities. IDAs are legally empowered to buy, sell or lease property and to provide tax exempt fi nancing for approved projects. Real property owned or controlled by IDAs is exempt from property and mortgage recording taxes, and the value of these exemptions can be passed through to assisted businesses. Moreover, purchases related to IDA projects can be exempt from State and local sales taxes.
While IDA properties are tax exempt, businesses occupying IDA-owned properties typically make payments-in-lieu-of-taxes (PILOTs) that are shared with the affected local tax jurisdictions (i.e., local governments) within their area.
Each IDA is legally required to annually submit a fi nancial statement to OSC that includes data related to the number of jobs created or retained and amount of all tax exemptions provided. These reports must also be fi led with the Department of Economic Development (DED) and the governing body of the sponsoring municipality.
Unfortunately, a number of studies have shown that inconsistent and inaccurate reporting has limited the utility of the data available through these annual reports. For example, nearly 3,500 projects receive IDA-related benefi ts, but unfortunately, many are not providing IDAs with the data they need to complete their State reporting requirements. To address this problem, OSC initiated several measures designed to improve the quality of the reports submitted by IDAs. Specifi cally, OSC sent out a description of common reporting errors, as well as a report to each IDA of where problems had been found in its previous year’s submission. Additionally, OSC enhanced its review procedures, improved its audit presence and increased the amount of training it provided to IDAs.
As a result of these oversight and training efforts, the completeness and consistency of IDA reporting for 2004 showed a marked improvement over previous years. For example, for 2002, IDAs reported current job data for only 58 percent of their projects; this has been increased to 88 percent in reports for 2004. Nonetheless, of the 3,474 projects reported in 2004, 521 (15 percent) did not provide complete job data. Thus, there is still a need for more complete and accurate reporting.
The overall effectiveness of IDA programs has been the subject of a number of studies, reports and audits. Despite the enactment of reforms in the late 1980s and early 1990s, issues regarding IDA operations, accountability and transparency persist. In addition, a number of policy concerns have been raised. Following is a summary of these major issues:
EXECUTIVE SUMMARY
Industrial Development Agencies in New York State / OFFICE OF THE STATE COMPTROLLER4
• A lack of objective selection and evaluation data and criteria – The criteria by which IDAs evaluate potential projects are not always clear and/or consistently used, and IDAs do not always seem to make an attempt to evaluate the potential success of proposed projects.
o A 1999 OSC audit of IDAs in Erie County identifi ed numerous discrepancies regarding project eligibility, reporting requirements and tax exemption requirements.1
o A 2004 audit of the Niagara County IDA credited both its decision to devote a substantial amount of fi scal and staff resources to a project with an uncertain outcome and its poor fi nancial management practices with the IDA’s debilitated fi nancial condition.2
o A 2004 audit of fi ve Capital Region IDAs noted inconsistencies in the type and amount of data required of applicants and found that four of the fi ve IDAs did not develop formal project evaluation criteria (e.g., job targets, wage levels, etc.), and that none of the IDAs kept documentation that indicated how the claims of project applicants were verifi ed.3
o A 2006 audit of six IDAs found that all but one failed to develop and employ formal project evaluation criteria.4
• PILOTs – Various studies and audits have recommended that IDAs consistently apply uniform tax exemption policies and maintain a schedule of all PILOT payments due, any late/unpaid amounts and the share going to each taxing jurisdiction.5 A 2005 OSC audit of Yonkers found that considerable taxpayer revenue was likely lost as a result of the ineffective tracking of PILOT payments.6 Another 2005 audit found that 30 percent of the PILOT bills examined were not prepared according to the terms of their respective PILOT agreements, with under-billings totaling over $51,000 and over-billings more than $38,000. If these errors had remained uncorrected for the life of the PILOT agreements, under-billings would have totaled $520,000 and over-billings $151,000. Causes for these errors included unclear terms in the PILOT agreements, poor communication with assessing bodies and lack of monitoring.7
• Types of projects – IDAs have extensive latitude to determine the types of projects that are eligible for assistance. By either stated policy or practice, some IDAs favor industrial and manufacturing projects over commercial and service proposals, but others use a case-by-case approach, often placing a heavy emphasis on the perceived local advantage of the project. While originally conceived as agencies to spur industrial and manufacturing development, IDAs increasingly provide assistance to a wide variety of projects, including offi ce buildings, retail, education facilities, transportation, sports arenas and assisted living centers. For example, while current statute generally prohibits IDAs from assisting retail projects, several broad exceptions severely dilute such prohibition.
1 A Report of Industrial Development Agency Activity in Erie County 99-P-1, Offi ce of the State Comptroller (March 1999).2 Niagara County Industrial Development Agency Financial Condition, Offi ce of the State Comptroller (2004-M-21).3 Industrial Development Agencies’ Project Evaluation Criteria and Monitoring Efforts, Offi ce of the State Comptroller (2004-MR-3).4 Industrial Development Agencies’ Project Approval, Evaluation and Monitoring Efforts, Offi ce of the State Comptroller (2005-MS-2).5 Fiscal Policy Institute. June 15, 2005.6 City of Yonkers Financial Operations, Offi ce of the State Comptroller (2005M-35)7 Industrial Development Agency Payment in Lieu of Taxation Billing Accuracy, Offi ce of the State Comptroller (2005-MR-12).
DIVISION OF LOCAL GOVERNMENT SERVICES & ECONOMIC DEVELOPMENT / Industrial Development Agencies in New York State 5
• Pirating – IDAs are statutorily prohibited from using fi nancial assistance to lure companies from one area of the State to another (intrastate piracy). However, there are a number of exceptions that accompany this restriction, which can be applied in the fi rst instance at the discretion of individual IDAs. The effectiveness of this prohibition is therefore limited at best – so much so that many observers fi nd the prohibition to be virtually without effect.8
• Underperforming projects – “Clawback” provisions in IDA contracts can allow an IDA to recapture previously granted benefi ts, end the granting of additional benefi ts and/or proportionally increase the amount of PILOTs due if the agreed upon job creation is not forthcoming or if the developer violates other parts of the project agreement. These provisions also provide pressure to project owners to meet performance measures and provide related information to their IDA. Many IDAs have adopted these provisions, but others have not. Moreover, even where they exist, these provisions are often not applied consistently. In several audits OSC has questioned why sanctions, such as clawbacks, were not applied to projects falling below performance standards.9 A 2006 audit of six IDAs found that four of the six had recapture policies that were never utilized.10
8 A Kingdom All their Own: New York’s Industrial Development Agencies, State Senator Franz S. Leichter (1992).9 Most recently, Industrial Development Agencies’ Project Evaluation Criteria and Monitoring Efforts, Offi ce of the State Comptroller (2004- MR-3).
10 Industrial Development Agencies’ Project Approval, Evaluation and Monitoring Efforts, Offi ce of the State Comptroller (2005-MS-2).
Industrial Development Agencies in New York State / OFFICE OF THE STATE COMPTROLLER6
OSC REFORM PROPOSALS
Focusing on accountability and transparency, the Offi ce of the State Comptroller has identifi ed a number of steps that could advance the quality of IDA operations and accountability, and has prepared draft legislation that would implement them. Following are the major points of the Comptroller’s IDA reform agenda:
• Improve IDA reporting: Require each IDA to publish a “report card” annually, in a format prescribed by OSC, with detailed information on individual projects, such as job performance data, tax expenditures granted and the amount of PILOTs actually paid compared to scheduled payments.
• Require developers to furnish information to IDAs: Require the State’s Department of Economic Development (DED), in consultation with OSC, to develop a uniform project agreement to be used by all IDAs, which must contain provisions that compel project operators to provide job data or lose benefi ts.
• Require the use of objective project evaluation and selection criteria: Require IDAs to adopt policies with specifi c project selection criteria necessary to complete a cogent cost/benefi t analysis of each project application (similar to the current requirement for a “uniform tax exemption policy”).
• Standardize IDA project applications: Require DED, in consultation with OSC, to develop a uniform application to be used by all IDAs for the purpose of receiving, reviewing and approving requests for fi nancial assistance. Such application would require information thought necessary to make a sound decision regarding the award of benefi ts; IDAs would be empowered to require additional information from applicants.
• Require “Clawback”/Recapture Provisions: Require the inclusion of recapture provisions in project agreements to allow IDAs to recoup previously granted benefi ts if job creation/retention goals or other terms of the agreements are not met.
• Revise Civic Facilities Provisions: Increase the cap on three categories of civic facility projects: (i) dormitories for educational facilities; (ii) facilities defi ned in article 28 of the Public Health Law, relative to hospitals; and (iii) housing facilities for senior citizens. The current project cap of $20 million would be increased to $50 million, but there would be a provision added to prohibit splitting a project into smaller components or artifi cially dividing a project in avoidance of the cap. The section of law covering civic facilities would also be made permanent, rather than expiring after a specifi ed term.
DIVISION OF LOCAL GOVERNMENT SERVICES & ECONOMIC DEVELOPMENT / Industrial Development Agencies in New York State 7
MISSION AND POWERS OF IDAS
Industrial Development Agencies (IDAs) are public benefi t corporations originally authorized by the Industrial Development Agency Act of 196911 and governed by the provisions of Article 18-A of the General Municipal Law. Since that time, 177 IDAs have been legislatively authorized and 115 remain active today.12
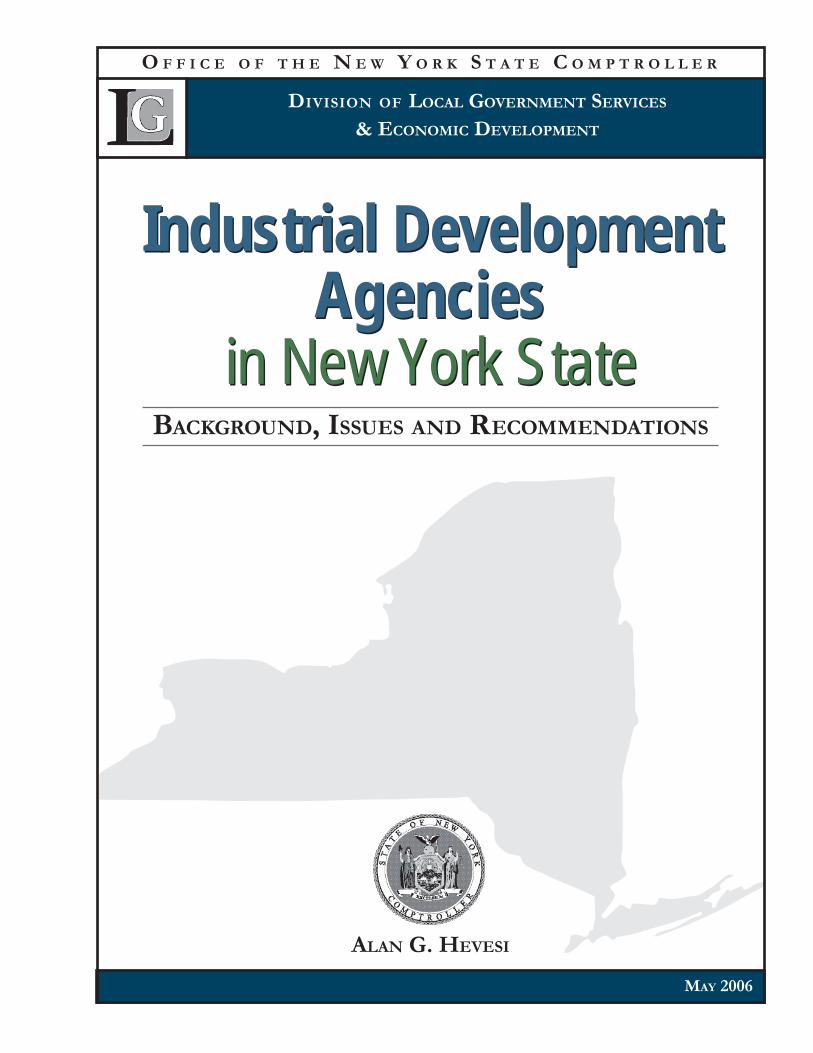
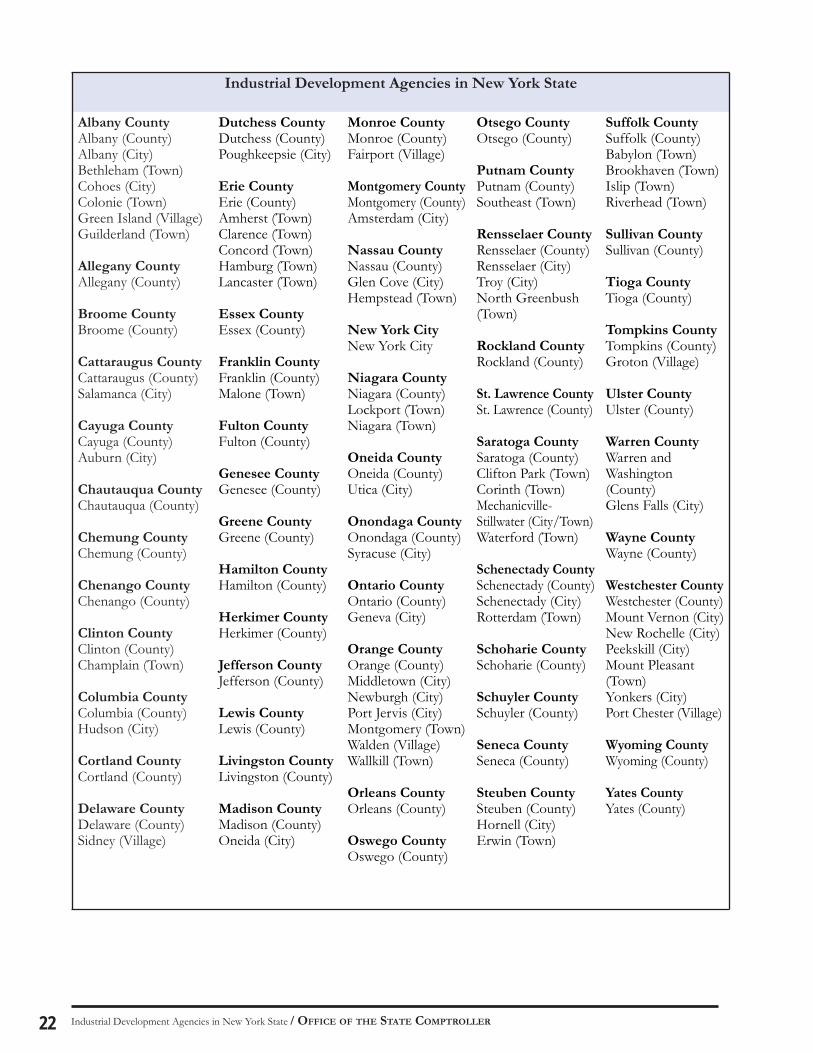
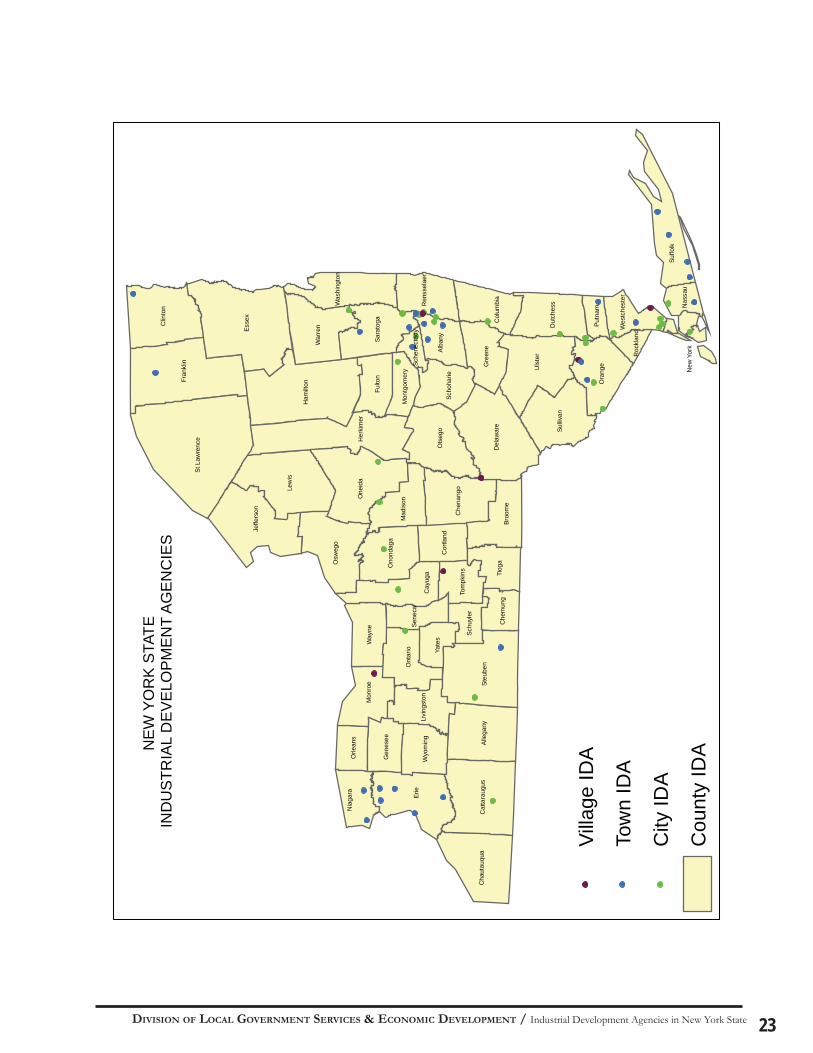
The distribution of IDAs throughout the State is far from uniform. Although each county of the State is served by an IDA, some counties contain as many as seven IDAs, while Warren and Washington counties share a single one. A table and a map at the end of this report show all of the IDAs within each county as of March 2006.
According to the authorizing statute, the purpose of an IDA is to promote, develop, encourage and assist in acquiring, constructing, improving, maintaining or equipping certain facilities, thereby advancing the job opportunities, health, general prosperity and the economic welfare of the people of New York. Each IDA is an independent public benefi t corporation established by a special act of the State Legislature at the request of a sponsoring municipality, and each is expected to act in the interest of that particular local government and its residents.
Although administrative arrangements vary considerably, an IDA is generally governed by a board consisting of three to seven members. The Industrial Development Agency Act stipulates that, except as may be provided by a special act, board members must be appointed by the governing board of each sponsoring municipality, and may include local government representatives, employees and offi cials, as well as members of school boards, organized labor, and business groups. There is, however, no requirement that such affected entities be proportionally represented on IDA boards.
IDAs are required to hold a public hearing before approving any project for which fi nancial assistance of more than $100,000 is proposed to be provided, but there is no requirement that IDA board members attend or respond to any questions or objections raised at such a hearing.
IDAs can offer several benefi ts to private companies as inducements for them to relocate to, expand in or remain in their jurisdictions. Statute provides the following:
• IDAs have been legally empowered to acquire, own and dispose of property.• IDAs are able to directly issue debt. • Real property owed by IDAs is exempt from property taxes and mortgage recording taxes.13
• Purchases made in support of approved projects are eligible for exemption from State and local sales taxes.
However, IDAs do not have taxation powers and thus typically maintain their operations by charging various fees to the businesses that participate in their projects.
11 Two exceptions to this are the City of Troy and City of Auburn IDAs, which were created prior to the 1969 Act in the Public Authorities Law.
12 Occasionally, exact enumeration is problematic because of disputes over whether certain IDAs have met minimum activity re-quirements and therefore continue in existence. Statute specifi es that an IDA shall cease to exist whenever all of the bonds or notes they have issued have been redeemed or cancelled.
13 More specifi cally, §874 of the General Municipal Law provides that property acquired by an IDA or under the supervision, control or jurisdiction of an IDA be exempt from taxation.
Industrial Development Agencies in New York State / OFFICE OF THE STATE COMPTROLLER8
TAX EXEMPTIONS AND PILOTS
Real property owned by an IDA is entitled to an exemption from real property taxes. These exemptions are passed through to assisted businesses. In most cases, a portion of the property taxes forgone is recaptured via payments-in-lieu-of-taxes (PILOTs) made by recipients of IDA benefi ts to affected taxing jurisdictions (i.e. local governments). PILOT agreements are required to be in writing and to specify the amount due annually to each affected taxing jurisdiction, which are responsible for PILOT collection. Notably, however, because the revenue received through the use of PILOTs is typically less than the real property taxes abated, they represent only partial compensation to the local governments involved. Over 23,000 real property tax exemptions valued at $47.5 billion were given for industrial, commercial and public service properties in 2003, and about 4,800 exemptions valued at $18 billion (38 percent of the total) were granted in conjunction with IDA activities.14
IDAs have a substantial degree of discretion over how PILOT agreements are negotiated, and the criteria used to determine PILOTs differs among IDAs. Such inconsistencies, according to critics, can cause IDAs to compete against each other for business. In addition, due to unclear PILOT agreements negotiated by IDAs, poor communication with assessing bodies and a lack of monitoring, projects often fail to pay the full amount of PILOTs and thus deprive taxing jurisdictions of needed revenues.15
As a result of State legislation passed in 1993 amending section 874 of the General Municipal Law, each IDA is required to establish a “uniform tax exemption policy with input from affected tax jurisdictions … and shall provide guidelines for the claiming of real property, mortgage recording, and sales tax exemptions.” The guidelines must include: the period of exemptions; percentage of exemptions; types of projects for which exemptions can be claimed; procedures for payments-in-lieu-of-taxes and circumstances under which real property appraisals are required.
In adopting this policy, statute requires IDAs to “consider such issues as: the extent to which a project will create or retain permanent, private sector jobs; the estimated value of any tax exemptions to be provided; whether affected tax jurisdictions shall be reimbursed by the project occupant if a project does not fulfi ll the purposes for which an exemption was provided; the impact of a proposed project on existing and proposed businesses and economic development projects in the vicinity.”
Although they are required to adopt a uniform tax exemption policy, IDAs are allowed to deviate from that policy. In these cases, an IDA must explain in writing why there is a need for deviation and notify the affected taxing jurisdictions. While approval by these local governments is not required, the IDA is obliged to review and respond to any issues raised by them.
Despite these requirements, problems persist. For example, a 1999 OSC audit of IDA activities in Erie County found that one IDA had not adopted a uniform tax exemption policy, and that other IDAs had policies that either did not contain all of the required elements or did not address the circumstances under which the IDA could or should deviate from the policy.
14 Summary of Exemptions by Property Group, New York State Offi ce of Real Property Services (2003 Assessment Rolls – Group F).15 Industrial Development Agency Payment in Lieu of Taxation Billing Accuracy, Offi ce of the State Comptroller (2005-MR-12).
DIVISION OF LOCAL GOVERNMENT SERVICES & ECONOMIC DEVELOPMENT / Industrial Development Agencies in New York State 9
BONDS
IDA bonds are obligations of the IDAs themselves and not of any sponsoring municipality or the State. Typically, an IDA uses proceeds from bonds it issues to purchase land or make improvements to support a private developer’s approved project. By separate agreement, the private developer subsequently leases the facilities from the IDA, who then conveys the property back to the developer at the end of the bond term for a nominal fee.
When IDAs were fi rst created, subject to applicable standards, interest on all bonds they issued was exempt from both federal and State income taxes (allowing them to be sold at lower interest rates than taxable bonds). Federal tax changes enacted in the 1970s, 1980s and 1990s have further limited the interest exemption for IDA bonds. Additionally, the Tax Equity and Fiscal Responsibility Act of 1982 (TEFRA), intended to curb losses to federal revenues caused by the widespread use of tax-exempt borrowing, imposed a cap on the total amount of tax-free bonds that can be issued for private activities such as economic development.
Today, only certain types of bonds (not all of which can be issued by IDAs) are still permitted to be issued on a tax-exempt basis. These include borrowing for manufacturing, residential rental projects, solid waste and water projects, public utilities and others. The total amount of tax-exempt bonds issued by entities within the State for these purposes is subject to a cap annually imposed by the federal government. This “volume cap” is based on a per capita formula prescribed in the federal Internal Revenue Code; New York’s 2006 cap is $1.54 billion. The State Legislature allocates amounts under this cap each year by providing certain amounts for State agencies, local issuers and a statewide reserve, which may be used under certain circumstances by State and/or local issuers. The State Budget Director and the Commissioner of Economic Development both have roles in allocating this cap among specifi c projects. Of the $1.54 billion in volume cap given to New York in 2006, approximately one-third, or $513.5 million, has been allocated for use by IDAs.16
STRAIGHT LEASE PROJECTS
In a “straight lease” transaction, an IDA takes title to the land, improvements or real property, thereby making it exempt from certain taxes, and then leases it back to a developer for a nominal fee. Bonding is unnecessary, either because no fi nancing is needed or because the developer has secured fi nancing elsewhere.
Although many IDA agreements still involve bonding to acquire or improve property, straight lease projects have come into more frequent use following the federal tax changes that curtailed the use of tax-exempt private activity bonds. In fact, 42 percent of the more than 3,400 IDA projects are currently classifi ed as being straight lease, rather than bond projects, an increase of 76 percent from 2001.
16 Lately, the amount and utilization of the portion of the State’s volume cap allocated for use by IDAs has ranged from about $479 million (114 percent used) in 2003 to $513 million (138 percent used) in 2005.
Industrial Development Agencies in New York State / OFFICE OF THE STATE COMPTROLLER10
RETAIL PROJECTS
IDAs are also generally prohibited from providing fi nancial assistance for retail projects (defi ned as projects where facilities or property that are primarily used in making retail sales to customers who personally visit such facilities constitute more than one-third of the total project cost). This defi nition covers retail stores, as well as other operations such as hotels, motels, legal and medical offi ces.
Retail ventures are treated differently because they usually do not increase the level of regional jobs or economic activity and can damage local competitors or put them out of business. For example, a chain store opening up in a community generally will not increase the overall demand for retail goods and may lure shoppers away from already established (often smaller and independently-owned) stores, potentially putting them out of business. Providing tax expenditure benefi ts for these “jobs-neutral” types of economic activity generally results in a net fi nancial loss for the community.
Although assistance for retail projects is generally prohibited, statute allows for a number of exceptions to the rule. The exceptions include “tourism destination projects,”17 projects operated by not-for-profi t corporations, as well as other projects located in highly distressed areas. Moreover, fi nancial assistance may also be provided to retail projects where “(i) the project occupant would, but for the assistance provided by the agency, locate the related jobs outside the state, or (ii) the predominant purpose of the project would be to make available goods or services which would not, but for the project, be reasonably accessible to the residents of the city, town or village within which the proposed project would be located because of a lack of reasonably accessible retail trade facilities offering such goods or services….” Thus, these exceptions, all of which are applied at the discretion of local IDA boards, can make the retail prohibition ineffective.
Since the application of these exceptions is determined at the discretion of each IDA, these criteria are sometimes subject to expansive interpretations. For example, OSC’s audit of IDAs in Erie County cited two instances in which motels were provided assistance under the IDA’s determination that they could be considered a “tourism destination” because of their proximity to an airport, local mall and Thruway exit.18
In another example, the Amherst IDA agreed to provide $1 million in tax breaks to an orthopedics practice for a new offi ce and surgery center in the Amherst area. The project came under scrutiny not only because it would relocate doctors and staff from Buffalo and Tonawanda, but also because critics charged that it violated statutory provisions that forbid the granting of IDA assistance to retail projects.
The current provisions governing IDA retail project assistance expires on July 1, 2006.
17 “Tourism destination” is defi ned for this purpose as a location or facility that is likely to attract a signifi cant number of visitors from outside the “economic development region,” as established by §230 of the Economic Development Law, in which the project is located.
18 Industrial Development Agency Activity in Erie County, Offi ce of the State Comptroller (99-P-1).
DIVISION OF LOCAL GOVERNMENT SERVICES & ECONOMIC DEVELOPMENT / Industrial Development Agencies in New York State 11
CIVIC FACILITIES
In 1986, legislation intended to attract and retain nonprofi t organizations authorized IDAs to provide fi nancial assistance for the construction of “civic facilities” for not-for-profi t corporations. A civic facility was then defi ned as “a facility owned or occupied by a not-for-profi t corporation organized and existing under the laws of this State, but not including convention centers, housing facilities or medical facilities which are predominately used for the delivery of medical services.” Additionally, a cap on the amount of fi nancing an IDA could provide to civic facility projects was set at 25 percent of the average of the IDA’s total bond issuances over the preceding three calendar years.
In 1988, the cap was removed entirely and in 1993 several other types of projects (e.g., dormitories for educational institutions, water/sewer systems, and public facilities for use by a municipality in the performance of its governmental functions) were specifi cally excluded from the defi nition of civic facilities. By 1997, some of these excluded project types, such as housing and medical facility projects, were reinserted in the defi nition of civic facilities but made subject to a static cap of $15 million for the total cost of such project. In 1999, the cap was increased to the current amount of $20 million.
The current provision that authorizes IDAs to fi nance civic facilities expires on July 1, 2006.
IDA REPORTING REQUIREMENTS
Current IDA reporting requirements and oversight roles are a result of reforms in the late 1980s and early 1990s that were enacted to improve the accountability of IDAs. Legislation enacted in 1989 added section 859 of the General Municipal Law, which required every IDA to fi le an annual fi nancial statement with each of the following: the State Comptroller, the Commissioner of Economic Development and the governing board of the municipality for whose benefi t the IDA was created. It specifi cally required that these statements include data concerning assistance provided and jobs created/retained for each project and provided for the Comptroller to prescribe their format. Additionally, each IDA was required to have its annual fi nancial statement independently audited within 90 days of the end of its fi scal year, and to fi le the audited statement within the subsequent 30 days.
Moreover, the Commissioner of Economic Development was required to annually issue a report that summarized IDA activities statewide over the preceding year and that included information regarding: signifi cant trends in IDA operations and fi nancing; departures from acceptable practices; compilations of the types of bonds and notes outstanding and straight lease transactions and an estimate of the total number of jobs created/retained by IDA projects. Unfortunately, the reports issued by the Commissioner typically summarized data from the annual fi nancial reports at the highest aggregate level and included no substantive programmatic review of IDA activities.
Legislation enacted in 1993 (Chapter 356 of the Laws of 1993) was intended to make IDAs more accountable to sponsoring municipalities and the public and to address other concerns without unduly limiting IDA fl exibility. In particular, this legislation required each IDA to adopt a uniform tax exemption policy and contains provisions for the State Comptroller to determine if each IDA has fi led a substantially complete fi nancial statement.
Industrial Development Agencies in New York State / OFFICE OF THE STATE COMPTROLLER12
As a matter of process, if an IDA does not fi le an audited statement, or if the Comptroller determines that it is not substantially complete, the Comptroller is required to send a series of up to four notifi cations to the IDA and/or sponsoring municipality. Ultimately, if the required statements are not fi led or deemed substantially complete, the statute precludes the IDA from prospectively offering fi nancial assistance that provides exemptions from State taxes until such time as the required statement is fi led.
From 1995 to 2004, 11 IDAs had their ability to offer new State tax exemptions suspended as a result of this statute.19 In most cases, the IDAs quickly came back into compliance and regained their authority to offer State tax exemptions.
While the number of IDAs actually losing their authority to provide State tax exemptions may appear low, many more IDAs have been notifi ed by OSC about defi ciencies in their reports. For example, initial reviews of reports for 2004 resulted in notifi cations to 23 IDAs regarding their failure to include CPA audits, bond schedules or other supplemental information (e.g., tax exemptions).
Notably, while 40 IDAs were late in submitting their 2004 annual fi nancial reports, OSC was able to help many of these IDAs understand and meet the reporting requirements before any loss of their authority to provide exemptions was required.
OSC ACTIONS TO ADDRESS REPORTING ISSUES
Due to defi ciencies in IDA reporting, OSC has taken the following initiatives:
Provided a supplemental information packet, which highlighted areas of past misreporting, to each IDA in 2004 to help them understand and correct common reporting errors;
• Applied additional resources to the review of annual reports, revamping procedures and increasing follow-up to resolve discrepancies;
• Increased training for IDA offi cials related to annual reporting requirements;
• Developed and distributed the Accounting and Reporting Manual for IDAs in 2005 to replace the Uniform System of Accounts for IDAs which had last been updated in 1991; and
• Increased the number and type of audits related to IDAs (from an annual average of one or less between 2000 and 2004 to fi ve in 2005).
Despite reform legislation and the adoption of additional reporting guidelines, unreliable data is still included in annual reports – especially in the supplemental schedule containing data on tax exemptions and jobs. Although the completeness and consistency of IDA reports has improved, IDAs still need to increase their efforts to report complete and accurate data.
•
19 City of Watervliet; City of Dunkirk; Town of West Turin; Town of Yorktown; Town of East Greenbush; City of Oneida; Town of Riverhead; City of Cohoes; City of Albany. To date, the only IDA to have lost its ability to offer State tax exemptions in 2006 is that of the Town of North Greenbush.
DIVISION OF LOCAL GOVERNMENT SERVICES & ECONOMIC DEVELOPMENT / Industrial Development Agencies in New York State 13
OSC’s review of 2004 IDA reports identifi ed a number of problem areas with respect to the quality and accuracy of the data IDAs report in their supplemental schedules, including: improper reporting of tax exemptions and PILOTs; improper reporting of new tax revenue (if no exemptions were granted); failure to report on all active projects each year; failure to provide required job data and new project information being submitted without the required project code assignment. Following are a number of issue areas:
• Tax Exemptions – With respect to the reporting of tax exemptions, it is clear that IDAs have different interpretations regarding the calculation of exemptions. Simple mathematical miscalculations or inattention may also be the cause of erroneous reporting of “total exemptions.” The amount reported in total exemptions should equal the sum of all sales tax, real property tax and mortgage recording tax exemptions.
• PILOTs – Similar problems exist with the reporting of PILOTs. Edit checks indicate that often the “total PILOTs” fi eld does not add up to the sum of its parts (local PILOT, county PILOT, school PILOT, etc.). Again, this may be explained by simple mathematical miscalculation or inattention to detail.
• Project Codes – New projects are still being reported without the necessary project code assigned. IDAs have been given detailed instructions on the parameters for assigning project codes and yet in some cases they still fail to assign them. This is not conducive to tracking individual project-related activity across agencies.
• Missing Data – Some reports contain data categories without any information reported. This problem most often prevails in the reporting of current job data – a recurring problem. Obtaining this information is crucially important to evaluating the benefi t of IDA activities in the State over time.
OSC has also developed additional tools to assist IDAs in meeting their reporting requirements, including:
A list of common reporting errors (including issues specifi c to the individual IDA) with tips on how to avoid them. This document includes example calculations.
A list of projects (specifi c to the individual IDA) for which no current exemption and/or job data exists. This provides the IDA with an opportunity to advise OSC if the projects in question no longer require reporting because project bonds or notes have been paid off or the straight lease has ended.
An improved Schedule of Supplemental Information to ease and improve reporting.
As OSC devotes more resources to the review of IDA reports, it is likely that additional reporting discrepancies, and areas for improvement, will be identifi ed.
•
•
•
Industrial Development Agencies in New York State / OFFICE OF THE STATE COMPTROLLER14
EVALUATIONS OF IDA OPERATIONS
IDA proponents argue that the fi nancing and tax incentives provided by IDAs encourage fi rms to relocate to, remain in or expand in New York State, and are therefore benefi cial to employment, the economy and the tax base. Unfortunately, due to problems in the reliability of job and other reporting data, it is often diffi cult to assess the veracity of these assertions. Indeed, most studies have found that these claims simply cannot be independently evaluated. Overall, evidence about the success of IDA operations has been mixed.
A 1992 study by the Fiscal Policy Institute concluded that “the benefi ts of IDAs are questionable while the costs of IDAs, in terms of forgone tax revenue, are clear and substantial.”20 Another 1992 examination of the State’s IDAs found that: IDAs routinely provide support to projects that would have been completed without such assistance; existing relationships between developers and IDAs often determine which projects are granted assistance; politically connected contractors, consultants, attorneys, and IDA board members similarly benefi t from and determine which applications for IDA assistance are approved; piracy is commonplace; and IDAs, whose fees are based on a percentage of project-related bond issues, are induced to support large projects.21
Conversely, a 1993 study largely dismissed questions about the credibility of applicant’s threats to leave an area, posited that IDAs have mostly been successful and asserted that a comprehensive economic development strategy for NYS must emphasize both job creation and job retention.22
Similarly, in 1995 the NYS Economic Development Council (then representing 41 IDAs) used the amount of IDA activity (i.e. bonds issued) as an indication of the amount of economic development benefi t created by IDAs. Moreover, the Council speculated that increased State oversight of IDAs could lead to centralized decision-making regarding potential projects, and thus make the project selection process more vulnerable to political manipulation.23
A 1996 analysis of all projects approved by IDAs in 1994 and 1995 found that while most of the projects approved involved the relocation, expansion or improvement of existing New York businesses, the cost of selective support of some businesses, who must be subsidized by others paying comparatively higher taxes, goes unconsidered. To help ameliorate this trend, this report recommended that new IDAs be created only at the county level and that IDAs be required to obtain permission from an applicant’s local IDA before offering assistance to a business in another area of the State.24
A 1997 State review of the annual fi nancial reports of IDAs reasoned that shortcomings in the quality and reporting of IDA data is largely the result of differences in the amount of fi nancial and administrative resources of IDAs; thus, larger and more active IDAs are more likely to be better able to collect and report comprehensive data.25
20 New York State’s Industrial Development Agencies: Boon or Boondoggle? Fiscal Policy Institute (1992).21 A Kingdom All their Own: New York’s Industrial Development Agencies, State Senator Franz S. Leichter (1992).22 Economic Development: How Industrial Development Agencies Have Helped Generate Jobs and Tax Revenues for New York State and its
Localities, Public Policy Institute of New York State, Inc. (April 1993).23 The Effect of 1993 Reforms on Industrial Development Agencies, Testimony presented to the Assembly Standing Committee on Local
Government by the New York State Economic Development Council (October 27, 1995).24 Working Toward Taxpayer-Friendly Industrial Development Agencies: A Report on IDA Activities 1994-1995, Assembly Local
Governments Committee (June 1996).25 Analysis of Industrial Development Agency Annual Financial Reports for 1996, New York State Department of Economic
Development (November 1997).
DIVISION OF LOCAL GOVERNMENT SERVICES & ECONOMIC DEVELOPMENT / Industrial Development Agencies in New York State 15
A 1998 study by the Center for Governmental Research (CGR) set out to specifi cally measure the impact of IDAs on job creation and retention, the value of tax exemptions and the value of PILOT agreements.26
CGR had been contracted by Empire State Development Corporation (ESDC) to conduct an evaluation mandated by the 1993 reform legislation. CGR was not able to fulfi ll its mandate regarding measuring job creation and retention because of missing or non-comparable data issues they identifi ed with regard to the Department of Labor’s unemployment insurance records and IDA annual reports. Inconsistencies in sales tax data reported to Taxation and Finance (necessary to help estimate revenue forgone) were also cited. In its report, CGR stated that it was “unable to measure job creativity and retention because the data was gathered in such disparate ways that their numbers are ultimately unreliable when aggregated.”
Although the original IDA legislation included a provision that was intended to prevent the intrastate movement of jobs, many IDA projects have had the effect of luring businesses to move from one location within the State to another – a practice often referred to as job “pirating.” The problem is that when incentives are used in a manner that only produces relocation, there is no net benefi t to the State in terms of job creation. This tension between a single local government’s perceived interests (as represented by an IDA) versus those of the region or the State as a whole poses a challenge in terms of the most effective allocation of tax expenditures, since “pirating” of jobs from one intrastate location to another could be ameliorated by a regional approach to economic development.
Under section 862 of the General Municipal Law, IDAs are generally prohibited from offering assistance to projects that would merely relocate businesses within the State. However, the law also allows for two exceptions, which apply if an IDA board determines that:
“on the basis of the application before it that the project is reasonably necessary to discourage the project occupant from removing such other plant or facility to a location outside the state or is reasonably necessary to preserve the competitive position of the project occupant in its respective industry.”
Unfortunately, a 1996 report from the Assembly’s Local Governments Committee found that, despite the anti-pirating provision, pirating still accounted for a signifi cant part of IDA activity. The lack of a mechanism to enforce the law with regard to this restriction was cited as a contributing factor.27 As a result, instances of alleged job pirating have given rise to several court cases. For example, the Court of Appeals, in a case involving a project moving jobs from the City of Buffalo to the Town of Amherst held that pirating had occurred.28
26 Evaluation of New York State Industrial Development Agencies, Center for Governmental Research, Inc. (April 1998). 27 Working Toward Taxpayer-Friendly Industrial Development Agencies: A Report on IDA Activities 1994-1995, Assembly Local Government
Committee (June 1996).28 Main Seneca Corp., et al. v. Town of Amherst Indus. Dev. Agency, 100 N.Y.2d 246. In this case, the Court of Appeals addressed the
issue of whether the Amherst IDA had violated the anti-pirating provision by relocating an accounting fi rm from the City of Buffalo to the Town of Amherst. Ultimately, the Court concluded that the statute was violated. Central to the Court’s ruling was an analysis of the term “area” as used in the statute, concluding that, under the facts presented, the IDA’s actions resulted in the removal of the accounting fi rm from one “area” of the State to another. In reaching its conclusion, the Court expressly declined to defi ne the term “area” to mean “municipality” or “area of economic impact” (such as western New York). It did note, how-ever, that the overall purpose of the statute was to assist New York communities compete with communities outside of the State and the purpose of the anti-raiding provision was to “prevent economic raiding within the State.”
Industrial Development Agencies in New York State / OFFICE OF THE STATE COMPTROLLER16
RECENT STATUTORY CHANGES
Recently, several legislative initiatives affecting IDAs have been enacted. The Public Authorities Accountability Act of 2005 (Chapter 766 of the Laws of 2005) will have an appreciable affect on local public authorities, including IDAs. The following are among the new requirements of this law:
• Governance – Board members of State and local authorities, including IDAs, must: directly oversee the board’s offi cers/senior management; review/monitor fi nancial and management controls; establish compensation and attendance policies; adopt a code of ethics; establish personnel policies that include protection for “whistleblowers” and guidance regarding travel, procurement, the disposition of real and personal property; and adopt a defense/indemnifi cation policy. Board members are also prohibited from serving as an authority’s chief executive offi cer (CEO), executive director, chief fi nancial offi cer (CFO) or comptroller. In addition, except for board members who serve by virtue of holding a civil offi ce of the State, starting with appointments made after January 13, 2006, the majority of remaining board members must be “independent” members as defi ned in the new law. 29 Board members, offi cers and employees of local public authorities must fi le annual fi nancial disclosure statements with the county board of ethics in which the authority has its primary offi ce. Board members must also participate in “State approved” training regarding their legal, fi duciary, fi nancial and ethical responsibilities.
• Reporting – Existing annual reporting requirements that had previously applied only to public authorities created under the Public Authorities Law were expanded and made applicable generally to State and local authorities. The annual report must include, among other things, items related to: debt issued by the authority; compensation provided to offi cers, employees and directors; projects undertaken; disposal of real property; codes of ethics; internal controls and fi nancial data. This information must be submitted to the chairperson of the legislative body of the municipality. To the extent practicable, the authority must make accessible to the public, via its offi cial website, documentation concerning its mission, current activities, most recent annual fi nancial reports, current year budget and most recent independent audit report. The Act creates an Authority Budget Offi ce (ABO) and grants it a number of powers and duties relative to the oversight of IDAs such as: the review and analysis of their operations, practices and annual reports; the maintenance of a comprehensive inventory of authorities and their annual reports; assistance to public authorities to improve their management practices and the procedures by which their activities and fi nancial practices are disclosed to the public; and the provision of additional information and analysis as may be reasonably requested by the Legislature and the State Comptroller. Beginning on July 1, 2007 and annually thereafter, the ABO must issue reports regarding its fi ndings and analysis.
29 For this purpose, an independent member is one who (1) is not, and the past two years has not, been employed by the author-ity or an affi liate in an executive capacity, (2) is not and in past two years has not been employed by an entity that received remuneration valued at more than $15,000 for goods or services provided to the authority or received any other form of fi nancial assistance valued at more than $15,000 from the authority, (3) is not a relative of an executive offi cer or employee in an executive position of the authority or an affi liate and (4) is not and in past two years has not been a registered lobbyist and paid by a client to infl uence the management decisions, contract awards, rate determinations or any other similar actions of the authority or an affi liate (Public Authorities Law §2825[2]).
DIVISION OF LOCAL GOVERNMENT SERVICES & ECONOMIC DEVELOPMENT / Industrial Development Agencies in New York State 17
• Audit Standards – For fi scal years ending on or after December 31, 2007, local authorities will be required to submit independent audit reports to their respective local governments. There are also new provisions designed to ensure the independence of the audit services procured by local authorities.
• Disposition of Property – Among a number of new provisions relating to the disposition of real and personal property, authorities are required to (1) annually publish lists of property disposed of during the report period; (2) establish and annually review and approve guidelines concerning the disposal of property, fi le these guidelines with the State Comptroller and post on their websites and (3) use public bidding to dispose of real property unless provisions allowing for an exception to that rule are met.
Chapter 1 of the Laws of 2005 makes lobbying on procurement contracts, including those of municipalities and IDAs located in local governments with populations in excess of 50,000, subject to regulation by and reporting to the State Lobbying Commission. Among other things, the new law requires IDAs to include certain provisions relative to the new lobbying restrictions in their bid specifi cations and to designate contact persons for each contract. It also defi nes a restricted period during which individuals or entities may only contact the designated IDA procurement offi cial. Contacts within the restricted period must be recorded and included in a “procurement record” of the IDA for the contract.
Chapter 55 of the Laws of 2005 funded the Commission on Public Authority Reform as part of the 2005 enacted State budget. The Commission is expected to evaluate the operations of State and local authorities; develop principles and policies of effective governance and fi nancial disclosure and recommend if certain authorities should be eliminated, dissolved or consolidated. The Commission’s report is expected to be released in 2006.
OSC RECOMMENDATIONS TO ADDRESS ACCOUNTABILITY ISSUES
The State Comptroller is considering a number of proposals to address accountability and transparency issues in IDA operations:
• Improve IDA reporting: Require each IDA to publish a “report card” annually, in a format prescribed by OSC, with detailed information on individual projects, such as job performance data, tax expenditures granted and the amount of PILOTs actually paid compared to scheduled payments.
• Require developers to furnish information to IDAs: Require the State’s Department of Economic Development (DED), in consultation with OSC, to develop a uniform project agreement to be used by all IDAs which must contain provisions that compel project operators to provide job data or lose benefi ts.
• Require the use of objective project evaluation and selection criteria: Require IDAs to adopt policies with specifi c project selection criteria necessary to complete a cogent cost/benefi t analysis of each project application (similar to the current requirement for a “uniform tax exemption policy”).
Industrial Development Agencies in New York State / OFFICE OF THE STATE COMPTROLLER18
• Standardize IDA project applications: Require the State’s Department of Economic Development (DED), in consultation with OSC, to develop a uniform application to be used by all IDAs for the purpose of receiving, reviewing and approving requests for fi nancial assistance. Such application would require information thought necessary to make a sound decision regarding the award of benefi ts; IDAs would be empowered to require additional information from applicants.
• Require “Clawback”/Recapture Provisions: Require the inclusion of recapture provisions in project agreements to allow IDAs to recoup previously granted benefi ts if job creation/retention goals or other terms of the agreements are not met.
• Revise Civic Facilities Provisions: Increase the cap on three categories of civic facility projects: (i) dormitories for educational facilities; (ii) facilities defi ned in article 28 of the Public Health Law, relative to hospitals; and (iii) housing facilities for senior citizens. The current project cap of $20 million would be increased to $50 million, but there would be a provision added to prohibit splitting a project into smaller components or artifi cially dividing a project in avoidance of the cap. The section of law covering civic facilities would also be made permanent, rather than expiring after a specifi ed term.
FINANCIAL AND STATISTICAL SUMMARY OF IDA ACTIVITIES FOR 2004
Historically, data from IDA annual fi nancial reports have generally been unreliable due to inconsistent and inaccurate reporting. As summarized earlier in this report, OSC recently initiated or renewed efforts in several areas to improve the quality of IDA reporting to OSC. As a result of these efforts, the completeness and consistency of IDA reporting for 2004 showed a marked improvement over previous years.
For fi scal year 2002, IDAs reported current job data for only 58 percent of their projects; this increased to 88 percent in reports for 2004. Edit exceptions decreased from 2,038 (2002) to 0 (2004) for data related to tax exemptions, PILOTs and new taxes. Nonetheless, of the 3,474 projects reported in 2004, 521 (15 percent) did not provide complete job data. Thus, there is still a need for more complete and accurate reporting.
The most common area in need of improvement involves real property tax exemptions. Some IDAs are reporting net exemptions (after subtracting PILOT payments) instead of the required total exemptions, or the amount of taxes that a project would have been subject to if it existed without IDA involvement. This amount is determined by multiplying the assessed value of the project real property by the tax rate for each taxing entity (school district, county, town, etc.).
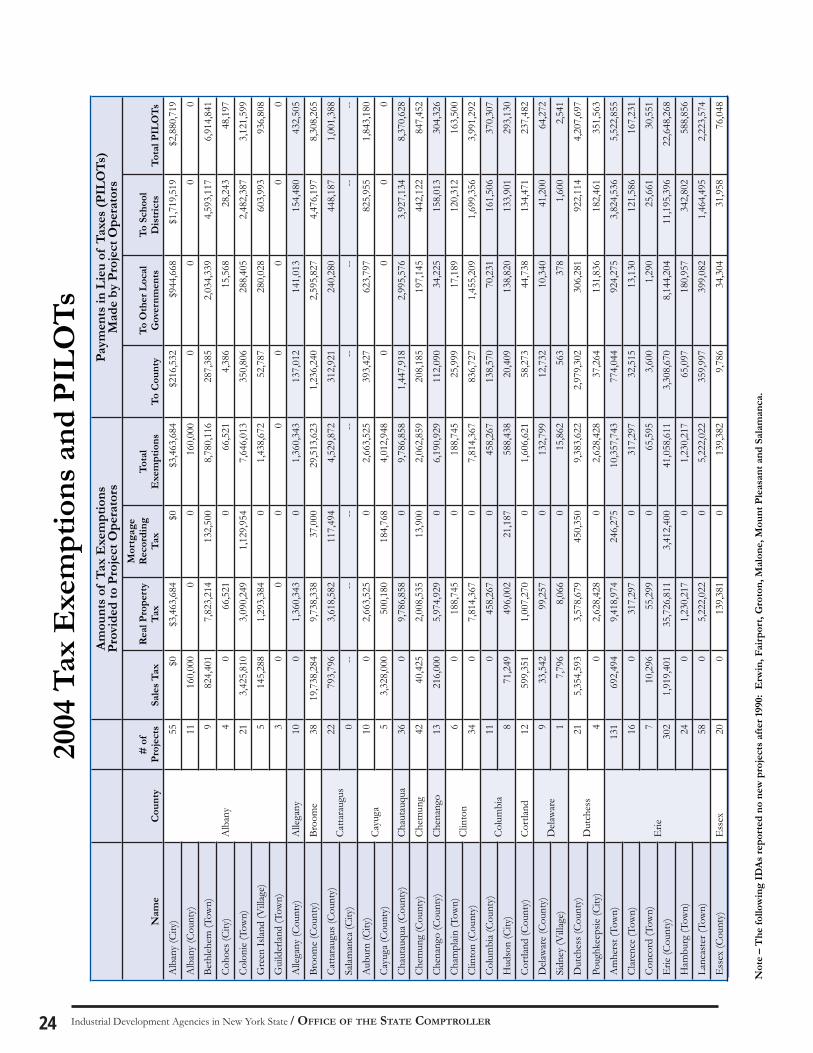
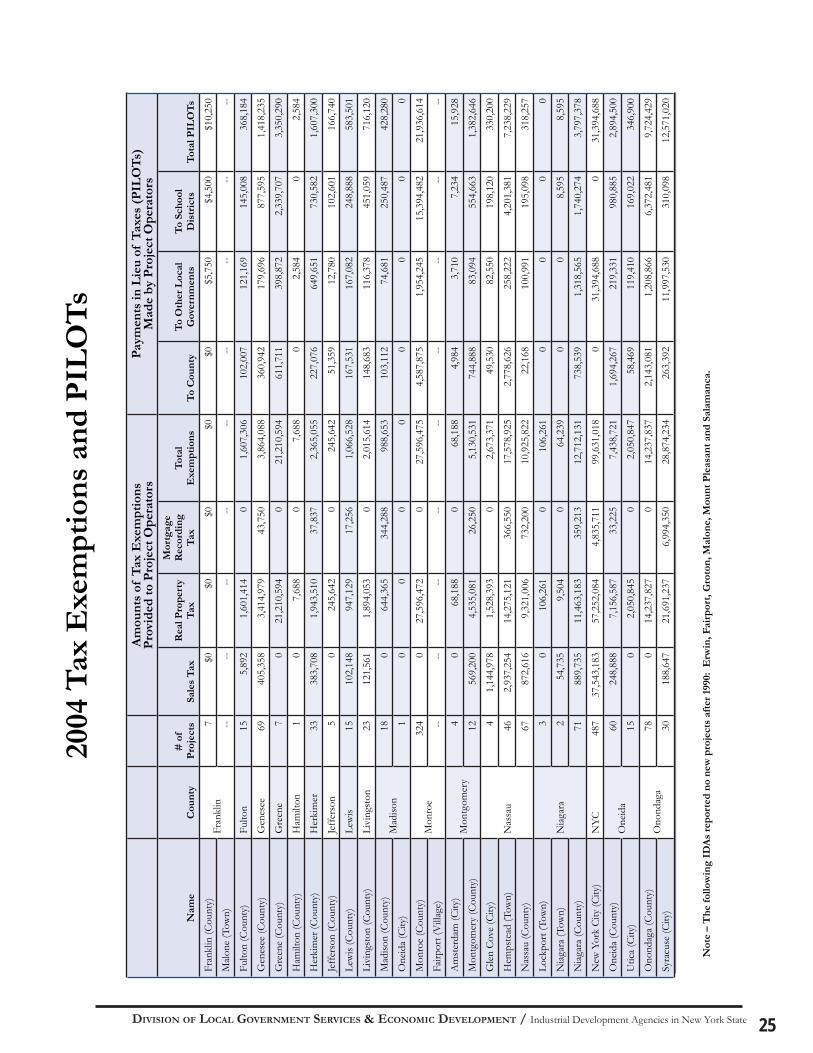
An appendix to this report provides a summary of statistical and fi nancial information from the 2004 IDA annual reports that refl ect improved reporting completeness and consistency. Multiple year analysis is not provided, however, as the data from previous years is not suffi ciently reliable to show meaningful trends.
DIVISION OF LOCAL GOVERNMENT SERVICES & ECONOMIC DEVELOPMENT / Industrial Development Agencies in New York State 19
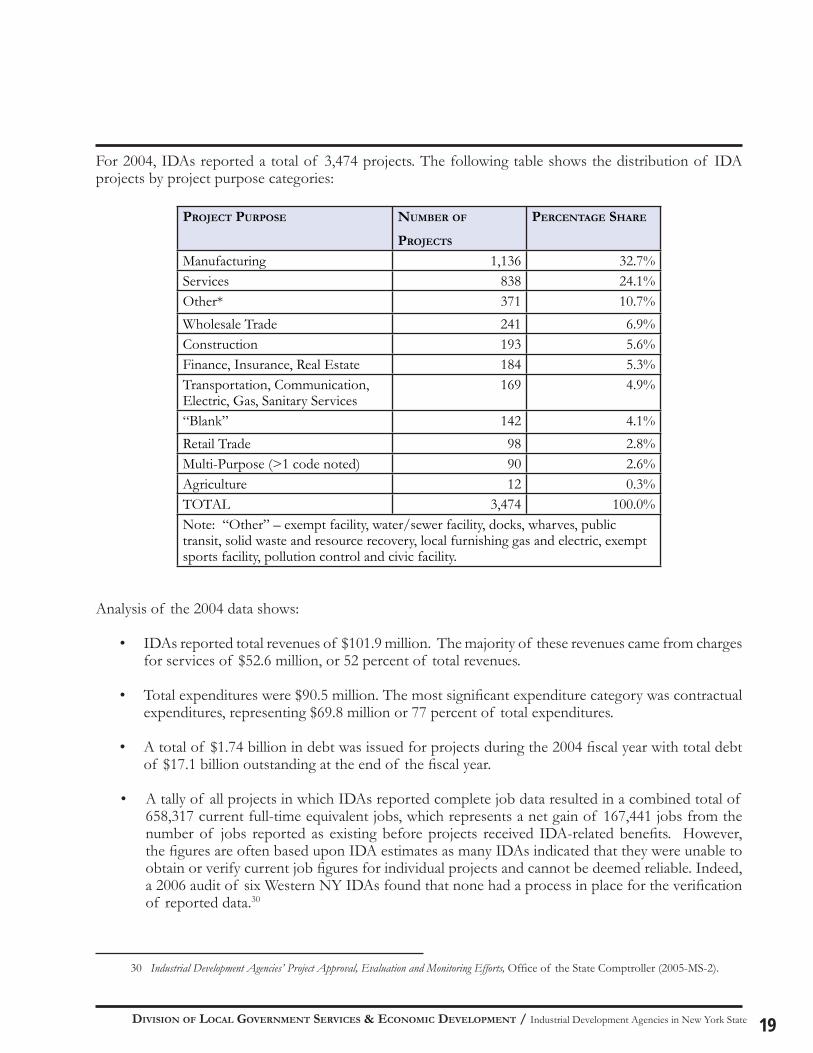
For 2004, IDAs reported a total of 3,474 projects. The following table shows the distribution of IDA projects by project purpose categories:
PROJECT PURPOSE NUMBER OF
PROJECTS
PERCENTAGE SHARE
Manufacturing 1,136 32.7%Services 838 24.1%Other* 371 10.7%Wholesale Trade 241 6.9%Construction 193 5.6%Finance, Insurance, Real Estate 184 5.3%Transportation, Communication, Electric, Gas, Sanitary Services
169 4.9%
“Blank” 142 4.1%Retail Trade 98 2.8%Multi-Purpose (>1 code noted) 90 2.6%Agriculture 12 0.3%TOTAL 3,474 100.0%Note: “Other” – exempt facility, water/sewer facility, docks, wharves, public transit, solid waste and resource recovery, local furnishing gas and electric, exempt sports facility, pollution control and civic facility.
Analysis of the 2004 data shows:
• IDAs reported total revenues of $101.9 million. The majority of these revenues came from charges for services of $52.6 million, or 52 percent of total revenues.
• Total expenditures were $90.5 million. The most signifi cant expenditure category was contractual expenditures, representing $69.8 million or 77 percent of total expenditures.
• A total of $1.74 billion in debt was issued for projects during the 2004 fi scal year with total debt of $17.1 billion outstanding at the end of the fi scal year.
• A tally of all projects in which IDAs reported complete job data resulted in a combined total of 658,317 current full-time equivalent jobs, which represents a net gain of 167,441 jobs from the number of jobs reported as existing before projects received IDA-related benefi ts. However, the fi gures are often based upon IDA estimates as many IDAs indicated that they were unable to obtain or verify current job fi gures for individual projects and cannot be deemed reliable. Indeed, a 2006 audit of six Western NY IDAs found that none had a process in place for the verifi cation of reported data.30
30 Industrial Development Agencies’ Project Approval, Evaluation and Monitoring Efforts, Offi ce of the State Comptroller (2005-MS-2).
Industrial Development Agencies in New York State / OFFICE OF THE STATE COMPTROLLER20
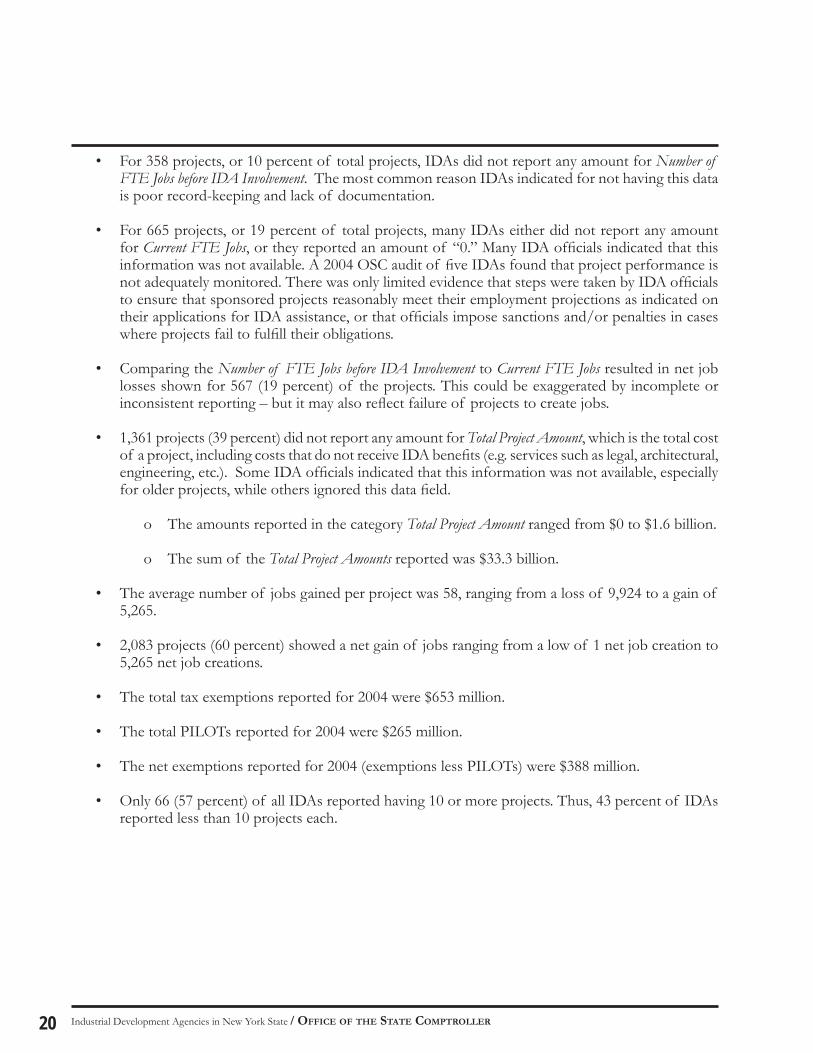
• For 358 projects, or 10 percent of total projects, IDAs did not report any amount for Number of FTE Jobs before IDA Involvement. The most common reason IDAs indicated for not having this data is poor record-keeping and lack of documentation.
• For 665 projects, or 19 percent of total projects, many IDAs either did not report any amount for Current FTE Jobs, or they reported an amount of “0.” Many IDA offi cials indicated that this information was not available. A 2004 OSC audit of fi ve IDAs found that project performance is not adequately monitored. There was only limited evidence that steps were taken by IDA offi cials to ensure that sponsored projects reasonably meet their employment projections as indicated on their applications for IDA assistance, or that offi cials impose sanctions and/or penalties in cases where projects fail to fulfi ll their obligations.
• Comparing the Number of FTE Jobs before IDA Involvement to Current FTE Jobs resulted in net job losses shown for 567 (19 percent) of the projects. This could be exaggerated by incomplete or inconsistent reporting – but it may also refl ect failure of projects to create jobs.
• 1,361 projects (39 percent) did not report any amount for Total Project Amount, which is the total cost of a project, including costs that do not receive IDA benefi ts (e.g. services such as legal, architectural, engineering, etc.). Some IDA offi cials indicated that this information was not available, especially for older projects, while others ignored this data fi eld.
o The amounts reported in the category Total Project Amount ranged from $0 to $1.6 billion.
o The sum of the Total Project Amounts reported was $33.3 billion.
• The average number of jobs gained per project was 58, ranging from a loss of 9,924 to a gain of 5,265.
• 2,083 projects (60 percent) showed a net gain of jobs ranging from a low of 1 net job creation to 5,265 net job creations.
• The total tax exemptions reported for 2004 were $653 million.
• The total PILOTs reported for 2004 were $265 million.
• The net exemptions reported for 2004 (exemptions less PILOTs) were $388 million.
• Only 66 (57 percent) of all IDAs reported having 10 or more projects. Thus, 43 percent of IDAs reported less than 10 projects each.
DIVISION OF LOCAL GOVERNMENT SERVICES & ECONOMIC DEVELOPMENT / Industrial Development Agencies in New York State 21
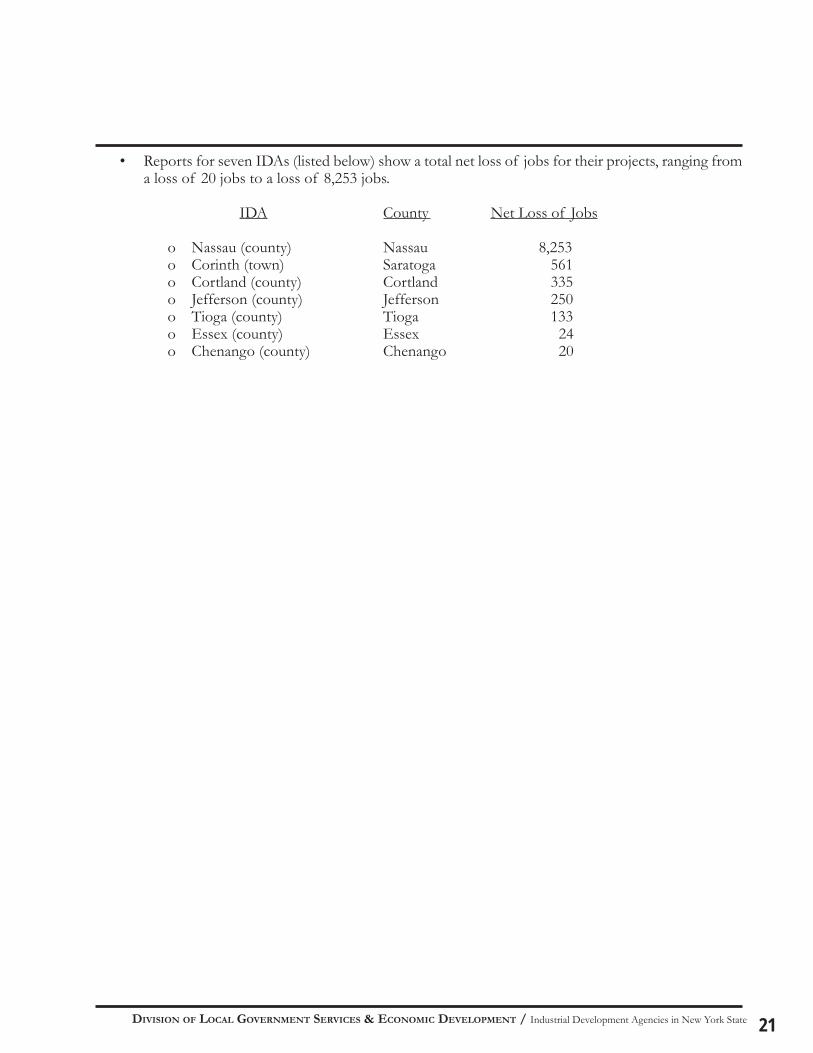
• Reports for seven IDAs (listed below) show a total net loss of jobs for their projects, ranging from a loss of 20 jobs to a loss of 8,253 jobs.
IDA County Net Loss of Jobs
o Nassau (county) Nassau 8,253o Corinth (town) Saratoga 561o Cortland (county) Cortland 335o Jefferson (county) Jefferson 250o Tioga (county) Tioga 133 o Essex (county) Essex 24o Chenango (county) Chenango 20
Industrial Development Agencies in New York State / OFFICE OF THE STATE COMPTROLLER22
Industrial Development Agencies in New York State
Albany CountyAlbany (County)Albany (City)Bethleham (Town)Cohoes (City)Colonie (Town)Green Island (Village)Guilderland (Town)
Allegany CountyAllegany (County)
Broome CountyBroome (County)
Cattaraugus CountyCattaraugus (County)Salamanca (City)
Cayuga CountyCayuga (County)Auburn (City)
Chautauqua CountyChautauqua (County)
Chemung CountyChemung (County)
Chenango CountyChenango (County)
Clinton CountyClinton (County)Champlain (Town)
Columbia CountyColumbia (County)Hudson (City)
Cortland CountyCortland (County)
Delaware CountyDelaware (County)Sidney (Village)
Dutchess CountyDutchess (County)Poughkeepsie (City)
Erie CountyErie (County)Amherst (Town)Clarence (Town)Concord (Town)Hamburg (Town)Lancaster (Town)
Essex CountyEssex (County)
Franklin CountyFranklin (County)Malone (Town)
Fulton CountyFulton (County)
Genesee CountyGenesee (County)
Greene CountyGreene (County)
Hamilton CountyHamilton (County)
Herkimer CountyHerkimer (County)
Jefferson CountyJefferson (County)
Lewis CountyLewis (County)
Livingston CountyLivingston (County)
Madison CountyMadison (County)Oneida (City)
Monroe CountyMonroe (County)Fairport (Village)
Montgomery CountyMontgomery (County)Amsterdam (City)
Nassau CountyNassau (County)Glen Cove (City)Hempstead (Town)
New York CityNew York City
Niagara CountyNiagara (County)Lockport (Town)Niagara (Town)
Oneida CountyOneida (County)Utica (City)
Onondaga CountyOnondaga (County)Syracuse (City)
Ontario CountyOntario (County)Geneva (City)
Orange CountyOrange (County)Middletown (City)Newburgh (City)Port Jervis (City)Montgomery (Town)Walden (Village)Wallkill (Town)
Orleans CountyOrleans (County)
Oswego CountyOswego (County)
Otsego CountyOtsego (County)
Putnam CountyPutnam (County)Southeast (Town)
Rensselaer CountyRensselaer (County)Rensselaer (City)Troy (City)North Greenbush (Town)
Rockland CountyRockland (County)
St. Lawrence CountySt. Lawrence (County)
Saratoga CountySaratoga (County)Clifton Park (Town)Corinth (Town)Mechanicville-Stillwater (City/Town)Waterford (Town)
Schenectady CountySchenectady (County)Schenectady (City)Rotterdam (Town)
Schoharie CountySchoharie (County)
Schuyler CountySchuyler (County)
Seneca CountySeneca (County)
Steuben CountySteuben (County)Hornell (City)Erwin (Town)
Suffolk CountySuffolk (County)Babylon (Town)Brookhaven (Town)Islip (Town)Riverhead (Town)
Sullivan CountySullivan (County)
Tioga CountyTioga (County)
Tompkins CountyTompkins (County)Groton (Village)
Ulster CountyUlster (County)
Warren CountyWarren and Washington (County)Glens Falls (City)
Wayne CountyWayne (County)
Westchester CountyWestchester (County)Mount Vernon (City)New Rochelle (City)Peekskill (City)Mount Pleasant (Town)Yonkers (City)Port Chester (Village)
Wyoming CountyWyoming (County)
Yates CountyYates (County)
DIVISION OF LOCAL GOVERNMENT SERVICES & ECONOMIC DEVELOPMENT / Industrial Development Agencies in New York State 23
Cha
utau
qua
Cat
tara
ugus
Alle
gany
Steu
ben
Wyo
min
g
Gen
esee
Orle
ans
Nia
gara
Mon
roe
Livi
ngst
on
Ont
ario Ya
tes
Schu
yler
Tiog
aC
hem
ung
Tom
pkin
s
Sene
ca
Way
ne
Cay
uga
Ono
ndag
a
Osw
ego
Cor
tland
Broo
me
Che
nang
o
Del
awar
e
Ots
ego
Her
kim
erO
neid
a
Lew
is
Jeffe
rson
StLa
wre
nce
Fran
klin
Clin
ton
Esse
x
Ham
ilton
War
ren
Was
hing
ton
Sara
toga
Fulto
n
Mon
tgom
ery
Sche
nect
ady
Ren
ssel
aer
Alba
nySc
hoha
rie
Gre
ene
Col
umbi
a
Uls
ter
Sulli
van
Dut
ches
s
Ora
nge
Putn
am
Wes
tche
ster
Roc
klan
d
Suffo
lk
Nas
sau
New
York
Mad
ison
Erie
Villa
geID
A
Tow
nID
A
City
IDA
Cou
nty
IDAN
EW
YO
RK
STA
TEIN
DU
STR
IAL
DE
VE
LOP
ME
NT
AG
EN
CIE
S
Industrial Development Agencies in New York State / OFFICE OF THE STATE COMPTROLLER24
2004
Tax
Exe
mp
tion
s an
d P
ILO
Ts
Not
e –
Th
e fo
llow
ing
IDA
s re
por
ted
no
new
pro
ject
s af
ter
1990
: E
rwin
, Fai
rpor
t, G
roto
n, M
alon
e, M
oun
t P
leas
ant
and
Sal
aman
ca.
Am
oun
ts o
f T
ax E
xem
pti
ons
Pro
vid
ed t
o P
roje
ct O
per
ator
sP
aym
ents
in L
ieu
of
Tax
es (
PIL
OT
s)
Mad
e b
y P
roje
ct O
per
ator
s
Nam
eC
oun
ty#
of
Pro
ject
sSa
les
Tax
Rea
l Pro
per
ty
Tax
Mor
tgag
e R
ecor
din
g T
axT
otal
E
xem
pti
ons
To
Cou
nty
To
Oth
er L
ocal
G
over
nm
ents
To
Sch
ool
Dis
tric
tsT
otal
PIL
OT
s
Alb
any
(City
)
Alb
any
55$0
$3
,463
,684
$0
$3
,463
,684
$2
16,5
32
$944
,668
$1
,719
,519
$2
,880
,719
Alb
any
(Cou
nty)
11
160,
000
00
160,
000
00
00
Beth
lehem
(Tow
n)9
824,
401
7,82
3,21
413
2,50
08,
780,
116
287,
385
2,03
4,33
94,
593,
117
6,91
4,84
1
Coho
es (C
ity)
40
66,5
210
66,5
214,
386
15,5
6828
,243
48,1
97
Colo
nie
(Tow
n)21
3,42
5,81
03,
090,
249
1,12
9,95
47,
646,
013
350,
806
288,
405
2,48
2,38
73,
121,
599
Gre
en Is
land
(Vill
age)
514
5,28
81,
293,
384
01,
438,
672
52,7
8728
0,02
860
3,99
393
6,80
8
Gui
lder
land
(Tow
n)3
00
00
00
00
Alle
gany
(Cou
nty)
Alle
gany
100
1,36
0,34
30
1,36
0,34
313
7,01
214
1,01
315
4,48
043
2,50
5
Broo
me
(Cou
nty)
Broo
me
3819
,738
,284
9,73
8,33
837
,000
29,5
13,6
231,
236,
240
2,59
5,82
74,
476,
197
8,30
8,26
5
Catta
raug
us (C
ount
y)Ca
ttara
ugus
2279
3,79
63,
618,
582
117,
494
4,52
9,87
231
2,92
124
0,28
044
8,18
71,
001,
388
Salam
anca
(City
)0
----
----
----
----
Aub
urn
(City
)Ca
yuga
100
2,66
3,52
50
2,66
3,52
539
3,42
762
3,79
782
5,95
51,
843,
180
Cayu
ga (C
ount
y)5
3,32
8,00
050
0,18
018
4,76
84,
012,
948
00
00
Chau
tauq
ua (C
ount
y)Ch
auta
uqua
360
9,78
6,85
80
9,78
6,85
81,
447,
918
2,99
5,57
63,
927,
134
8,37
0,62
8
Chem
ung
(Cou
nty)
Chem
ung
4240
,425
2,00
8,53
513
,900
2,06
2,85
920
8,18
519
7,14
544
2,12
284
7,45
2
Chen
ango
(Cou
nty)
Ch
enan
go13
216,
000
5,97
4,92
90
6,19
0,92
911
2,09
034
,225
158,
013
304,
326
Cham
plain
(Tow
n)Cl
into
n6
018
8,74
50
188,
745
25,9
9917
,189
120,
312
163,
500
Clin
ton
(Cou
nty)
34
07,
814,
367
07,
814,
367
836,
727
1,45
5,20
91,
699,
356
3,99
1,29
2
Colu
mbi
a (C
ount
y)Co
lum
bia
110
458,
267
045
8,26
713
8,57
070
,231
161,
506
370,
307
Hud
son
(City
)8
71,2
4949
6,00
221
,187
588,
438
20,4
0913
8,82
013
3,90
129
3,13
0
Cortl
and
(Cou
nty)
Cortl
and
1259
9,35
11,
007,
270
01,
606,
621
58,2
7344
,738
134,
471
237,
482
Dela
war
e (C
ount
y)D
elaw
are
933
,542
99,2
570
132,
799
12,7
3210
,340
41,2
0064
,272
Sidn
ey (V
illag
e)1
7,79
68,
066
015
,862
563
378
1,60
02,
541
Dut
ches
s (Co
unty
) D
utch
ess
215,
354,
593
3,57
8,67
945
0,35
09,
383,
622
2,97
9,30
230
6,28
192
2,11
44,
207,
697
Poug
hkee
psie
(City
)4
02,
628,
428
02,
628,
428
37,2
6413
1,83
618
2,46
135
1,56
3
Am
hers
t (To
wn)
Erie
131
692,
494
9,41
8,97
424
6,27
510
,357
,743
774,
044
924,
275
3,82
4,53
65,
522,
855
Clar
ence
(Tow
n)16
031
7,29
70
317,
297
32,5
1513
,130
121,
586
167,
231
Conc
ord
(Tow
n)7
10,2
9655
,299
065
,595
3,60
01,
290
25,6
6130
,551
Erie
(Cou
nty)
30
21,
919,
401
35,7
26,8
113,
412,
400
41,0
58,6
113,
308,
670
8,14
4,20
411
,195
,396
22,6
48,2
68
Ham
burg
(Tow
n)24
01,
230,
217
01,
230,
217
65,0
9718
0,95
734
2,80
258
8,85
6
Lanc
aste
r (To
wn)
580
5,22
2,02
20
5,22
2,02
235
9,99
739
9,08
21,
464,
495
2,22
3,57
4
Ess
ex (C
ount
y)
Ess
ex20
013
9,38
10
139,
382
9,78
634
,304
31,9
5876
,048
DIVISION OF LOCAL GOVERNMENT SERVICES & ECONOMIC DEVELOPMENT / Industrial Development Agencies in New York State 25
2004
Tax
Exe
mp
tion
s an
d P
ILO
Ts
Not
e –
Th
e fo
llow
ing
IDA
s re
por
ted
no
new
pro
ject
s af
ter
1990
: E
rwin
, Fai
rpor
t, G
roto
n, M
alon
e, M
oun
t P
leas
ant
and
Sal
aman
ca.
Am
oun
ts o
f T
ax E
xem
pti
ons
Pro
vid
ed t
o P
roje
ct O
per
ator
sP
aym
ents
in L
ieu
of
Tax
es (
PIL
OT
s)
Mad
e b
y P
roje
ct O
per
ator
s
Nam
eC
oun
ty#
of
Pro
ject
sSa
les
Tax
Rea
l Pro
per
ty
Tax
Mor
tgag
e R
ecor
din
g T
axT
otal
E
xem
pti
ons
To
Cou
nty
To
Oth
er L
ocal
G
over
nm
ents
To
Sch
ool
Dis
tric
tsT
otal
PIL
OT
s
Fran
klin
(Cou
nty)
Fr
ankl
in7
$0
$0
$0
$0
$0
$5,7
50
$4,5
00
$10,
250
Malo
ne (T
own)
----
----
----
----
--
Fulto
n (C
ount
y)
Fulto
n15
5,89
21,
601,
414
01,
607,
306
102,
007
121,
169
145,
008
368,
184
Gen
esee
(Cou
nty)
G
enes
ee69
405,
358
3,41
4,97
943
,750
3,86
4,08
836
0,94
217
9,69
687
7,59
51,
418,
235
Gre
ene
(Cou
nty)
G
reen
e7
021
,210
,594
021
,210
,594
611,
711
398,
872
2,33
9,70
73,
350,
290
Ham
ilton
(Cou
nty)
H
amilt
on1
07,
688
07,
688
02,
584
02,
584
Her
kim
er (C
ount
y)H
erki
mer
3338
3,70
81,
943,
510
37,8
372,
365,
055
227,
076
649,
651
730,
582
1,60
7,30
0
Jeffe
rson
(Cou
nty)
Jeffe
rson
50
245,
642
024
5,64
251
,359
12,7
8010
2,60
116
6,74
0
Lew
is (C
ount
y)
Lew
is15
102,
148
947,
129
17,2
561,
066,
528
167,
531
167,
082
248,
888
583,
501
Livi
ngst
on (C
ount
y)
Livi
ngst
on23
121,
561
1,89
4,05
30
2,01
5,61
414
8,68
311
6,37
845
1,05
971
6,12
0
Mad
ison
(Cou
nty)
M
adiso
n18
064
4,36
534
4,28
898
8,65
310
3,11
274
,681
250,
487
428,
280
One
ida
(City
)1
00
00
00
00
Mon
roe
(Cou
nty)
Mon
roe
324
027
,596
,472
027
,596
,475
4,58
7,87
51,
954,
245
15,3
94,4
8221
,936
,614
Fairp
ort (
Vill
age)
----
----
----
----
--
Am
ster
dam
(City
)M
ontg
omer
y4
068
,188
068
,188
4,98
43,
710
7,23
415
,928
Mon
tgom
ery
(Cou
nty)
12
569,
200
4,53
5,08
126
,250
5,13
0,53
174
4,88
883
,094
554,
663
1,38
2,64
6
Glen
Cov
e (C
ity)
Nas
sau
41,
144,
978
1,52
8,39
30
2,67
3,37
149
,530
82,5
5019
8,12
033
0,20
0
Hem
pste
ad (T
own)
462,
937,
254
14,2
75,1
2136
6,55
017
,578
,925
2,77
8,62
625
8,22
24,
201,
381
7,23
8,22
9
Nas
sau
(Cou
nty)
67
872,
616
9,32
1,00
673
2,20
010
,925
,822
22,1
6810
0,99
119
5,09
831
8,25
7
Lock
port
(Tow
n)
Niag
ara
30
106,
261
010
6,26
10
00
0
Niag
ara
(Tow
n)
254
,735
9,50
40
64,2
390
08,
595
8,59
5
Niag
ara
(Cou
nty)
71
889,
735
11,4
63,1
8335
9,21
312
,712
,131
738,
539
1,31
8,56
51,
740,
274
3,79
7,37
8
New
Yor
k Ci
ty (C
ity)
NYC
487
37,5
43,1
8357
,252
,084
4,83
5,71
199
,631
,018
031
,394
,688
031
,394
,688
One
ida
(Cou
nty)
O
neid
a60
248,
888
7,15
6,58
733
,225
7,43
8,72
11,
694,
267
219,
331
980,
885
2,89
4,50
0
Utic
a (C
ity)
150
2,05
0,84
50
2,05
0,84
758
,469
119,
410
169,
022
346,
900
Ono
ndag
a (C
ount
y)
Ono
ndag
a78
014
,237
,827
014
,237
,837
2,14
3,08
11,
208,
866
6,37
2,48
19,
724,
429
Syra
cuse
(City
)30
188,
647
21,6
91,2
376,
994,
350
28,8
74,2
3426
3,39
211
,997
,530
310,
098
12,5
71,0
20
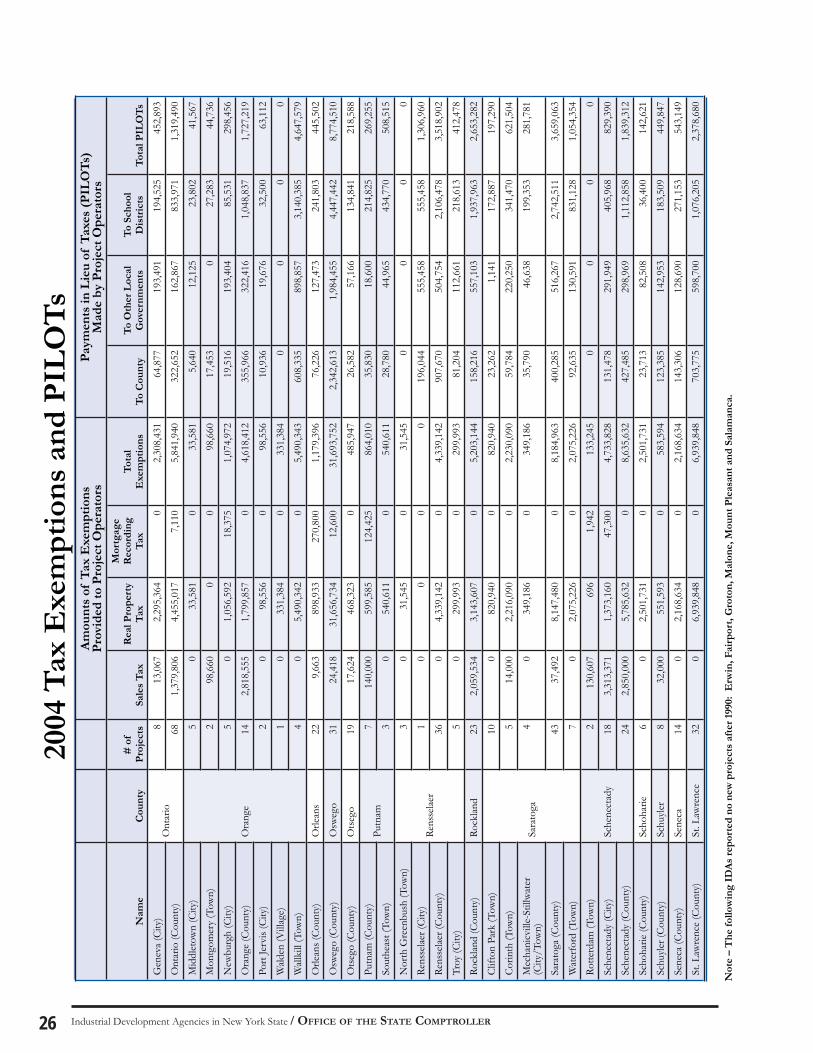
Industrial Development Agencies in New York State / OFFICE OF THE STATE COMPTROLLER26
2004
Tax
Exe
mp
tion
s an
d P
ILO
Ts
Not
e –
Th
e fo
llow
ing
IDA
s re
por
ted
no
new
pro
ject
s af
ter
1990
: E
rwin
, Fai
rpor
t, G
roto
n, M
alon
e, M
oun
t P
leas
ant
and
Sal
aman
ca.
Am
oun
ts o
f T
ax E
xem
pti
ons
Pro
vid
ed t
o P
roje
ct O
per
ator
sP
aym
ents
in L
ieu
of
Tax
es (
PIL
OT
s)
Mad
e b
y P
roje
ct O
per
ator
s
Nam
eC
oun
ty#
of
Pro
ject
sSa
les
Tax
Rea
l Pro
per
ty
Tax
Mor
tgag
e R
ecor
din
g T
axT
otal
E
xem
pti
ons
To
Cou
nty
To
Oth
er L
ocal
G
over
nm
ents
To
Sch
ool
Dis
tric
tsT
otal
PIL
OT
s
Gen
eva
(City
)O
ntar
io8
13,0
672,
295,
364
02,
308,
431
64,8
7719
3,49
119
4,52
545
2,89
3
Ont
ario
(Cou
nty)
68
1,37
9,80
64,
455,
017
7,11
05,
841,
940
322,
652
162,
867
833,
971
1,31
9,49
0
Mid
dlet
own
(City
)
Ora
nge
50
33,5
810
33,5
815,
640
12,1
2523
,802
41,5
67
Mon
tgom
ery
(Tow
n)
298
,660
00
98,6
6017
,453
027
,283
44,7
36
New
burg
h (C
ity)
50
1,05
6,59
218
,375
1,07
4,97
219
,516
193,
404
85,5
3129
8,45
6
Ora
nge
(Cou
nty)
14
2,81
8,55
51,
799,
857
04,
618,
412
355,
966
322,
416
1,04
8,83
71,
727,
219
Port
Jerv
is (C
ity)
20
98,5
560
98,5
5610
,936
19,6
7632
,500
63,1
12
Wald
en (V
illag
e)1
033
1,38
40
331,
384
00
00
Wall
kill
(Tow
n)4
05,
490,
342
05,
490,
343
608,
335
898,
857
3,14
0,38
54,
647,
579
Orle
ans (
Coun
ty)
Orle
ans
229,
663
898,
933
270,
800
1,17
9,39
676
,226
127,
473
241,
803
445,
502
Osw
ego
(Cou
nty)
O
sweg
o31
24,4
1831
,656
,734
12,6
0031
,693
,752
2,34
2,61
31,
984,
455
4,44
7,44
28,
774,
510
Ots
ego
(Cou
nty)
O
tseg
o19
17,6
2446
8,32
30
485,
947
26,5
8257
,166
134,
841
218,
588
Putn
am (C
ount
y)
Putn
am7
140,
000
599,
585
124,
425
864,
010
35,8
3018
,600
214,
825
269,
255
Sout
heas
t (To
wn)
30
540,
611
054
0,61
128
,780
44,9
6543
4,77
050
8,51
5
Nor
th G
reen
bush
(Tow
n)
Rens
selae
r
30
31,5
450
31,5
450
00
0
Rens
selae
r (Ci
ty)
10
00
019
6,04
455
5,45
855
5,45
81,
306,
960
Rens
selae
r (Co
unty
) 36
04,
339,
142
04,
339,
142
907,
670
504,
754
2,10
6,47
83,
518,
902
Troy
(City
)5
029
9,99
30
299,
993
81,2
0411
2,66
121
8,61
341
2,47
8
Rock
land
(Cou
nty)
Ro
cklan
d23
2,05
9,53
43,
143,
607
05,
203,
144
158,
216
557,
103
1,93
7,96
32,
653,
282
Clift
on P
ark
(Tow
n)
Sara
toga
100
820,
940
082
0,94
023
,262
1,14
117
2,88
719
7,29
0
Corin
th (T
own)
514
,000
2,21
6,09
00
2,23
0,09
059
,784
220,
250
341,
470
621,
504
Mec
hani
cvill
e-St
illw
ater
(C
ity/T
own)
40
349,
186
034
9,18
635
,790
46,6
3819
9,35
328
1,78
1
Sara
toga
(Cou
nty)
4337
,492
8,14
7,48
00
8,18
4,96
340
0,28
551
6,26
72,
742,
511
3,65
9,06
3
Wat
erfo
rd (T
own)
7
02,
075,
226
02,
075,
226
92,6
3513
0,59
183
1,12
81,
054,
354
Rotte
rdam
(Tow
n)
Sche
nect
ady
213
0,60
769
61,
942
133,
245
00
00
Sche
nect
ady
(City
) 18
3,31
3,37
11,
373,
160
47,3
004,
733,
828
131,
478
291,
949
405,
968
829,
390
Sche
nect
ady
(Cou
nty)
24
2,85
0,00
05,
785,
632
08,
635,
632
427,
485
298,
969
1,11
2,85
81,
839,
312
Scho
harie
(Cou
nty)
Sc
hoha
rie6
02,
501,
731
02,
501,
731
23,7
1382
,508
36,4
0014
2,62
1
Schu
yler (
Coun
ty)
Schu
yler
832
,000
551,
593
058
3,59
412
3,38
514
2,95
318
3,50
944
9,84
7
Sene
ca (C
ount
y)
Sene
ca14
02,
168,
634
02,
168,
634
143,
306
128,
690
271,
153
543,
149
St. L
awre
nce
(Cou
nty)
St
. Law
renc
e32
06,
939,
848
06,
939,
848
703,
775
598,
700
1,07
6,20
52,
378,
680
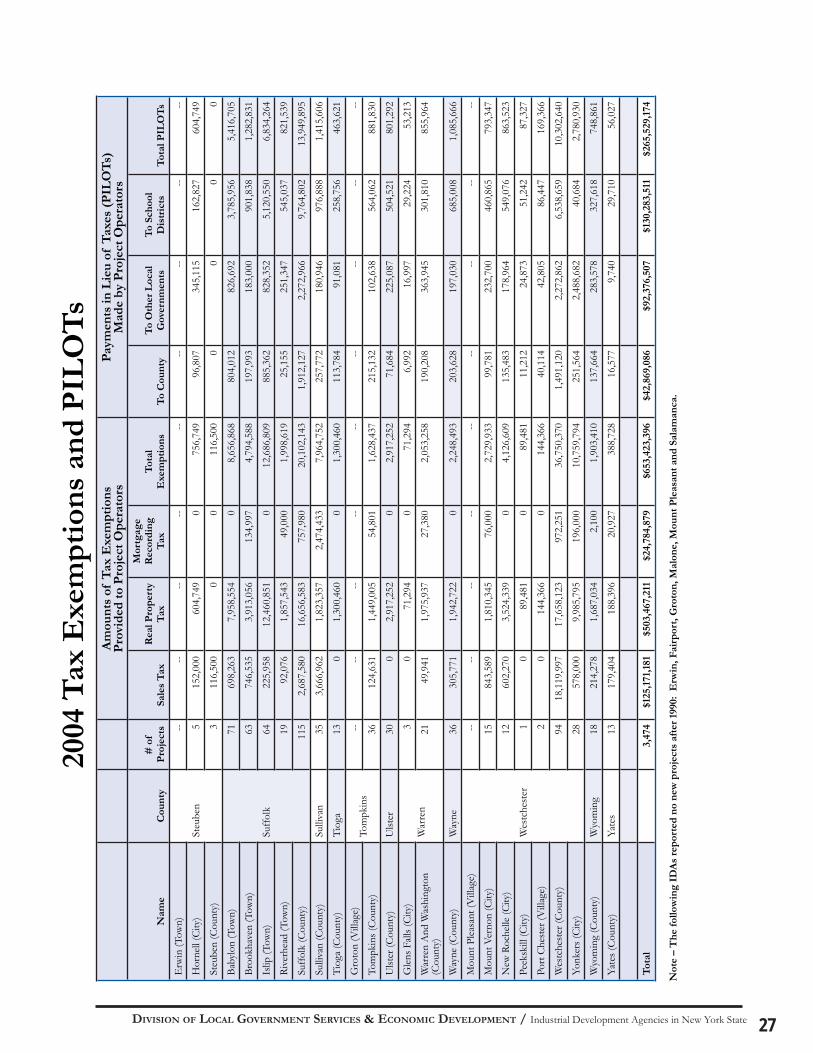
DIVISION OF LOCAL GOVERNMENT SERVICES & ECONOMIC DEVELOPMENT / Industrial Development Agencies in New York State 27
2004
Tax
Exe
mp
tion
s an
d P
ILO
Ts
Not
e –
Th
e fo
llow
ing
IDA
s re
por
ted
no
new
pro
ject
s af
ter
1990
: E
rwin
, Fai
rpor
t, G
roto
n, M
alon
e, M
oun
t P
leas
ant
and
Sal
aman
ca.
Am
oun
ts o
f T
ax E
xem
pti
ons
Pro
vid
ed t
o P
roje
ct O
per
ator
sP
aym
ents
in L
ieu
of
Tax
es (
PIL
OT
s)
Mad
e b
y P
roje
ct O
per
ator
s
Nam
eC
oun
ty#
of
Pro
ject
sSa
les
Tax
Rea
l Pro
per
ty
Tax
Mor
tgag
e R
ecor
din
g T
axT
otal
E
xem
pti
ons
To
Cou
nty
To
Oth
er L
ocal
G
over
nm
ents
To
Sch
ool
Dis
tric
tsT
otal
PIL
OT
s
Erw
in (T
own)
Steu
ben
----
----
----
----
--
Hor
nell
(City
)5
152,
000
604,
749
075
6,74
996
,807
345,
115
162,
827
604,
749
Steu
ben
(Cou
nty)
311
6,50
00
011
6,50
00
00
0
Baby
lon
(Tow
n)
Suffo
lk
7169
8,26
37,
958,
554
08,
656,
868
804,
012
826,
692
3,78
5,95
65,
416,
705
Broo
khav
en (T
own)
6374
6,53
53,
913,
056
134,
997
4,79
4,58
819
7,99
318
3,00
090
1,83
81,
282,
831
Islip
(Tow
n)64
225,
958
12,4
60,8
510
12,6
86,8
0988
5,36
282
8,35
25,
120,
550
6,83
4,26
4
Rive
rhea
d (T
own)
1992
,076
1,85
7,54
349
,000
1,99
8,61
925
,155
251,
347
545,
037
821,
539
Suffo
lk (C
ount
y)
115
2,68
7,58
016
,656
,583
757,
980
20,1
02,1
431,
912,
127
2,27
2,96
69,
764,
802
13,9
49,8
95
Sulli
van
(Cou
nty)
Su
lliva
n35
3,66
6,96
21,
823,
357
2,47
4,43
37,
964,
752
257,
772
180,
946
976,
888
1,41
5,60
6
Tiog
a (C
ount
y)
Tiog
a13
01,
300,
460
01,
300,
460
113,
784
91,0
8125
8,75
646
3,62
1
Gro
ton
(Vill
age)
Tom
pkin
s--
----
----
----
----
Tom
pkin
s (Co
unty
) 36
124,
631
1,44
9,00
554
,801
1,62
8,43
721
5,13
210
2,63
856
4,06
288
1,83
0
Ulst
er (C
ount
y)
Ulst
er30
02,
917,
252
02,
917,
252
71,6
8422
5,08
750
4,52
180
1,29
2
Glen
s Fall
s (Ci
ty)
War
ren
30
71,2
940
71,2
946,
992
16,9
9729
,224
53,2
13
War
ren
And
Was
hing
ton
(Cou
nty)
21
49,9
411,
975,
937
27,3
802,
053,
258
190,
208
363,
945
301,
810
855,
964
Way
ne (C
ount
y)
Way
ne36
305,
771
1,94
2,72
20
2,24
8,49
320
3,62
819
7,03
068
5,00
81,
085,
666
Mou
nt P
leasa
nt (V
illag
e)
Wes
tche
ster
----
----
----
----
--
Mou
nt V
erno
n (C
ity)
1584
3,58
91,
810,
345
76,0
002,
729,
933
99,7
8123
2,70
046
0,86
579
3,34
7
New
Roc
helle
(City
)12
602,
270
3,52
4,33
90
4,12
6,60
913
5,48
317
8,96
454
9,07
686
3,52
3
Peek
skill
(City
)1
089
,481
089
,481
11,2
1224
,873
51,2
4287
,327
Port
Ches
ter (
Vill
age)
20
144,
366
014
4,36
640
,114
42,8
0586
,447
169,
366
Wes
tche
ster
(Cou
nty)
94
18,1
19,9
9717
,658
,123
972,
251
36,7
50,3
701,
491,
120
2,27
2,86
26,
538,
659
10,3
02,6
40
Yonk
ers (
City
)28
578,
000
9,98
5,79
519
6,00
010
,759
,794
251,
564
2,48
8,68
240
,684
2,78
0,93
0
Wyo
min
g (C
ount
y)W
yom
ing
1821
4,27
81,
687,
034
2,10
01,
903,
410
137,
664
283,
578
327,
618
748,
861
Yate
s (Co
unty
) Ya
tes
1317
9,40
418
8,39
620
,927
388,
728
16,5
779,
740
29,7
1056
,027
Tot
al3,
474
$125
,171
,181
$503
,467
,211
$24,
784,
879
$653
,423
,396
$42,
869,
086
$92,
376,
507
$130
,283
,511
$265
,529
,174
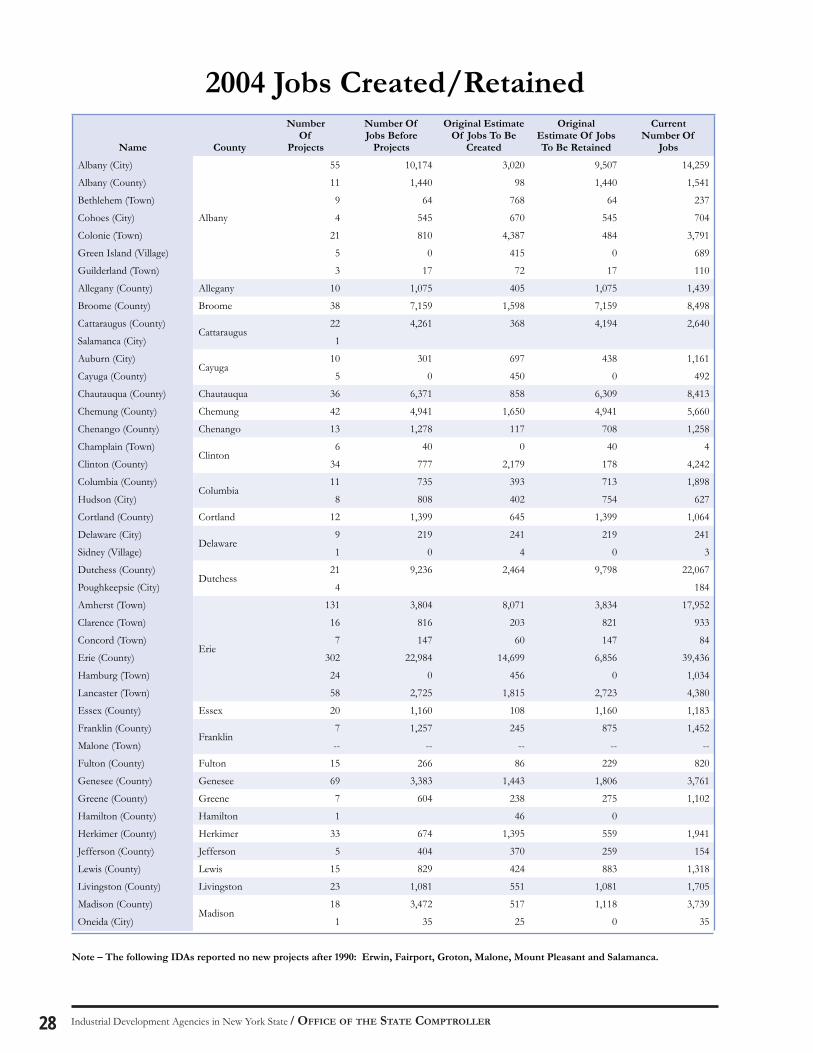
Industrial Development Agencies in New York State / OFFICE OF THE STATE COMPTROLLER28
2004 Jobs Created/Retained
Name County
NumberOf
Projects
Number OfJobs Before
Projects
Original EstimateOf Jobs To Be
Created
OriginalEstimate Of JobsTo Be Retained
CurrentNumber Of
Jobs
Albany (City)
Albany
55 10,174 3,020 9,507 14,259
Albany (County) 11 1,440 98 1,440 1,541
Bethlehem (Town) 9 64 768 64 237
Cohoes (City) 4 545 670 545 704
Colonie (Town) 21 810 4,387 484 3,791
Green Island (Village) 5 0 415 0 689
Guilderland (Town) 3 17 72 17 110
Allegany (County) Allegany 10 1,075 405 1,075 1,439
Broome (County) Broome 38 7,159 1,598 7,159 8,498
Cattaraugus (County)Cattaraugus
22 4,261 368 4,194 2,640
Salamanca (City) 1
Auburn (City)Cayuga
10 301 697 438 1,161
Cayuga (County) 5 0 450 0 492
Chautauqua (County) Chautauqua 36 6,371 858 6,309 8,413
Chemung (County) Chemung 42 4,941 1,650 4,941 5,660
Chenango (County) Chenango 13 1,278 117 708 1,258
Champlain (Town)Clinton
6 40 0 40 4
Clinton (County) 34 777 2,179 178 4,242
Columbia (County)Columbia
11 735 393 713 1,898
Hudson (City) 8 808 402 754 627
Cortland (County) Cortland 12 1,399 645 1,399 1,064
Delaware (City)Delaware
9 219 241 219 241
Sidney (Village) 1 0 4 0 3
Dutchess (County)Dutchess
21 9,236 2,464 9,798 22,067
Poughkeepsie (City) 4 184
Amherst (Town)
Erie
131 3,804 8,071 3,834 17,952
Clarence (Town) 16 816 203 821 933
Concord (Town) 7 147 60 147 84
Erie (County) 302 22,984 14,699 6,856 39,436
Hamburg (Town) 24 0 456 0 1,034
Lancaster (Town) 58 2,725 1,815 2,723 4,380
Essex (County) Essex 20 1,160 108 1,160 1,183
Franklin (County) Franklin
7 1,257 245 875 1,452
Malone (Town) -- -- -- -- --
Fulton (County) Fulton 15 266 86 229 820
Genesee (County) Genesee 69 3,383 1,443 1,806 3,761
Greene (County) Greene 7 604 238 275 1,102
Hamilton (County) Hamilton 1 46 0
Herkimer (County) Herkimer 33 674 1,395 559 1,941
Jefferson (County) Jefferson 5 404 370 259 154
Lewis (County) Lewis 15 829 424 883 1,318
Livingston (County) Livingston 23 1,081 551 1,081 1,705
Madison (County) Madison
18 3,472 517 1,118 3,739
Oneida (City) 1 35 25 0 35
Note – The following IDAs reported no new projects after 1990: Erwin, Fairport, Groton, Malone, Mount Pleasant and Salamanca.
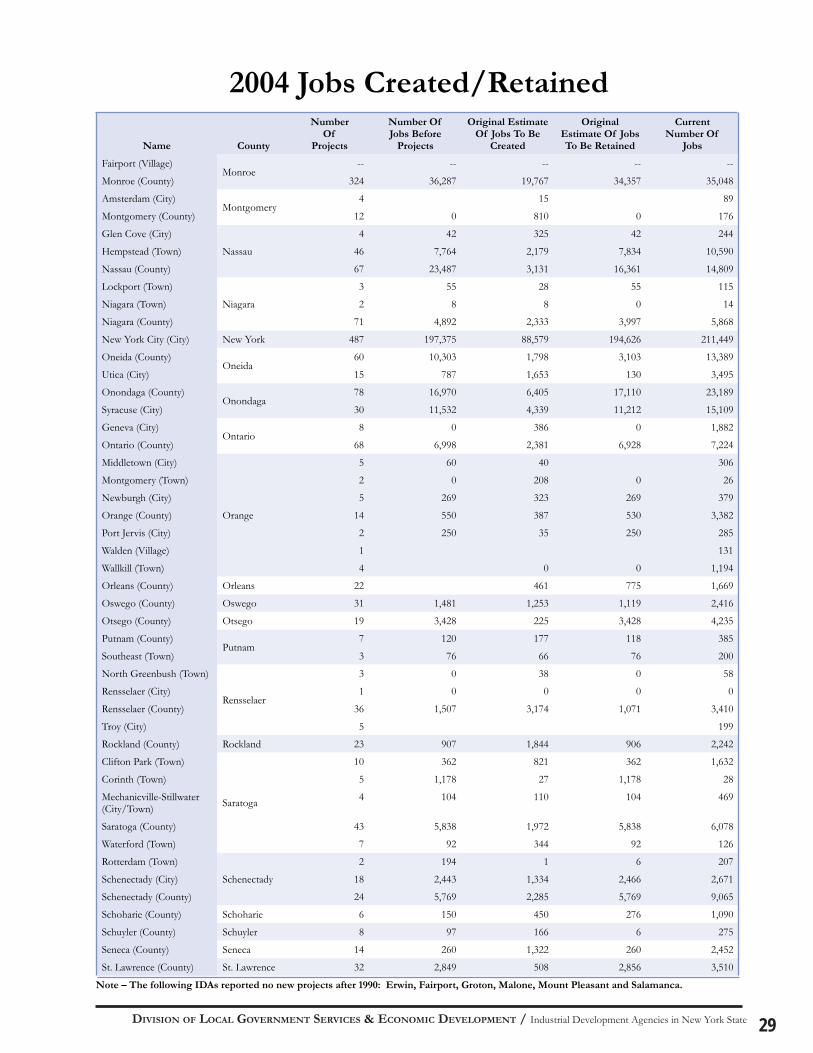
DIVISION OF LOCAL GOVERNMENT SERVICES & ECONOMIC DEVELOPMENT / Industrial Development Agencies in New York State 29
2004 Jobs Created/Retained
Name County
NumberOf
Projects
Number OfJobs Before
Projects
Original EstimateOf Jobs To Be
Created
OriginalEstimate Of JobsTo Be Retained
CurrentNumber Of
Jobs
Fairport (Village)Monroe
-- -- -- -- --
Monroe (County) 324 36,287 19,767 34,357 35,048
Amsterdam (City)Montgomery
4 15 89
Montgomery (County) 12 0 810 0 176
Glen Cove (City)
Nassau
4 42 325 42 244
Hempstead (Town) 46 7,764 2,179 7,834 10,590
Nassau (County) 67 23,487 3,131 16,361 14,809
Lockport (Town)
Niagara
3 55 28 55 115
Niagara (Town) 2 8 8 0 14
Niagara (County) 71 4,892 2,333 3,997 5,868
New York City (City) New York 487 197,375 88,579 194,626 211,449
Oneida (County) Oneida
60 10,303 1,798 3,103 13,389
Utica (City) 15 787 1,653 130 3,495
Onondaga (County) Onondaga
78 16,970 6,405 17,110 23,189
Syracuse (City) 30 11,532 4,339 11,212 15,109
Geneva (City)Ontario
8 0 386 0 1,882
Ontario (County) 68 6,998 2,381 6,928 7,224
Middletown (City)
Orange
5 60 40 306
Montgomery (Town) 2 0 208 0 26
Newburgh (City) 5 269 323 269 379
Orange (County) 14 550 387 530 3,382
Port Jervis (City) 2 250 35 250 285
Walden (Village) 1 131
Wallkill (Town) 4 0 0 1,194
Orleans (County) Orleans 22 461 775 1,669
Oswego (County) Oswego 31 1,481 1,253 1,119 2,416
Otsego (County) Otsego 19 3,428 225 3,428 4,235
Putnam (County) Putnam
7 120 177 118 385
Southeast (Town) 3 76 66 76 200
North Greenbush (Town)
Rensselaer
3 0 38 0 58
Rensselaer (City) 1 0 0 0 0
Rensselaer (County) 36 1,507 3,174 1,071 3,410
Troy (City) 5 199
Rockland (County) Rockland 23 907 1,844 906 2,242
Clifton Park (Town)
Saratoga
10 362 821 362 1,632
Corinth (Town) 5 1,178 27 1,178 28
Mechanicville-Stillwater (City/Town)
4 104 110 104 469
Saratoga (County) 43 5,838 1,972 5,838 6,078
Waterford (Town) 7 92 344 92 126
Rotterdam (Town)
Schenectady
2 194 1 6 207
Schenectady (City) 18 2,443 1,334 2,466 2,671
Schenectady (County) 24 5,769 2,285 5,769 9,065
Schoharie (County) Schoharie 6 150 450 276 1,090
Schuyler (County) Schuyler 8 97 166 6 275
Seneca (County) Seneca 14 260 1,322 260 2,452
St. Lawrence (County) St. Lawrence 32 2,849 508 2,856 3,510
Note – The following IDAs reported no new projects after 1990: Erwin, Fairport, Groton, Malone, Mount Pleasant and Salamanca.
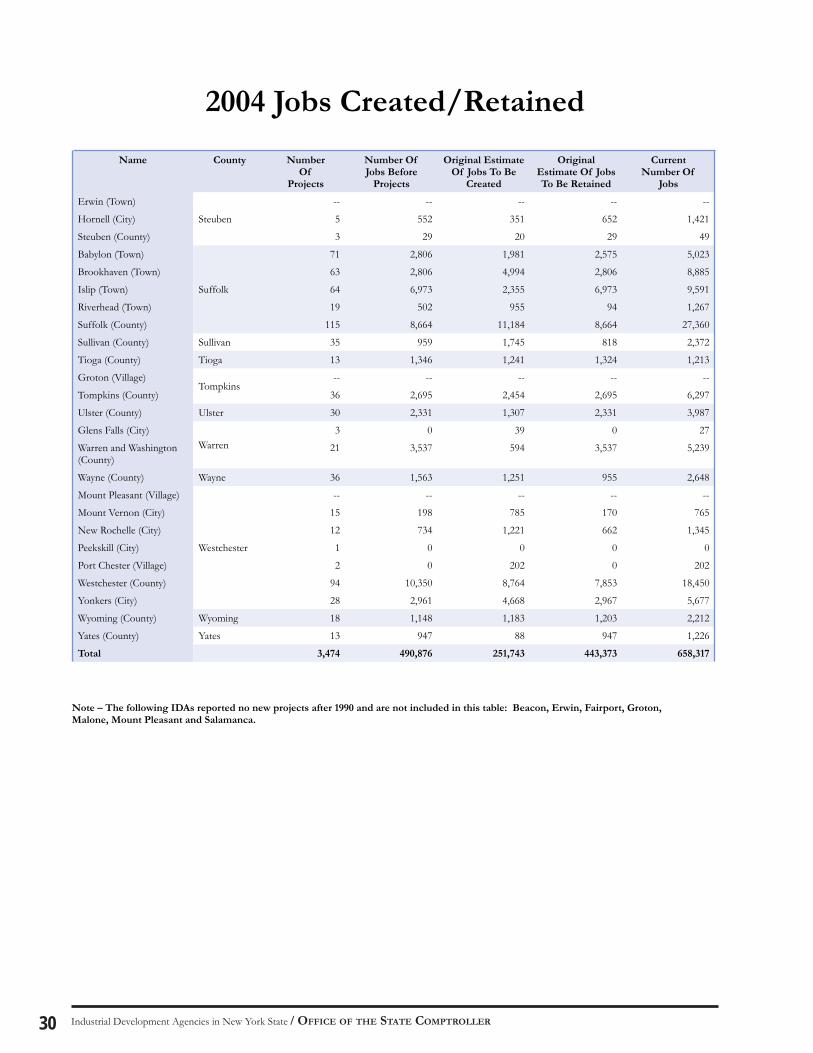
Industrial Development Agencies in New York State / OFFICE OF THE STATE COMPTROLLER30
2004 Jobs Created/Retained
Name County NumberOf
Projects
Number OfJobs Before
Projects
Original EstimateOf Jobs To Be
Created
OriginalEstimate Of JobsTo Be Retained
CurrentNumber Of
Jobs
Erwin (Town)
Steuben
-- -- -- -- --
Hornell (City) 5 552 351 652 1,421
Steuben (County) 3 29 20 29 49
Babylon (Town)
Suffolk
71 2,806 1,981 2,575 5,023
Brookhaven (Town) 63 2,806 4,994 2,806 8,885
Islip (Town) 64 6,973 2,355 6,973 9,591
Riverhead (Town) 19 502 955 94 1,267
Suffolk (County) 115 8,664 11,184 8,664 27,360
Sullivan (County) Sullivan 35 959 1,745 818 2,372
Tioga (County) Tioga 13 1,346 1,241 1,324 1,213
Groton (Village)Tompkins
-- -- -- -- --
Tompkins (County) 36 2,695 2,454 2,695 6,297
Ulster (County) Ulster 30 2,331 1,307 2,331 3,987
Glens Falls (City)Warren
3 0 39 0 27
Warren and Washington (County)
21 3,537 594 3,537 5,239
Wayne (County) Wayne 36 1,563 1,251 955 2,648
Mount Pleasant (Village)
Westchester
-- -- -- -- --
Mount Vernon (City) 15 198 785 170 765
New Rochelle (City) 12 734 1,221 662 1,345
Peekskill (City) 1 0 0 0 0
Port Chester (Village) 2 0 202 0 202
Westchester (County) 94 10,350 8,764 7,853 18,450
Yonkers (City) 28 2,961 4,668 2,967 5,677
Wyoming (County) Wyoming 18 1,148 1,183 1,203 2,212
Yates (County) Yates 13 947 88 947 1,226
Total 3,474 490,876 251,743 443,373 658,317
Note – The following IDAs reported no new projects after 1990 and are not included in this table: Beacon, Erwin, Fairport, Groton, Malone, Mount Pleasant and Salamanca.
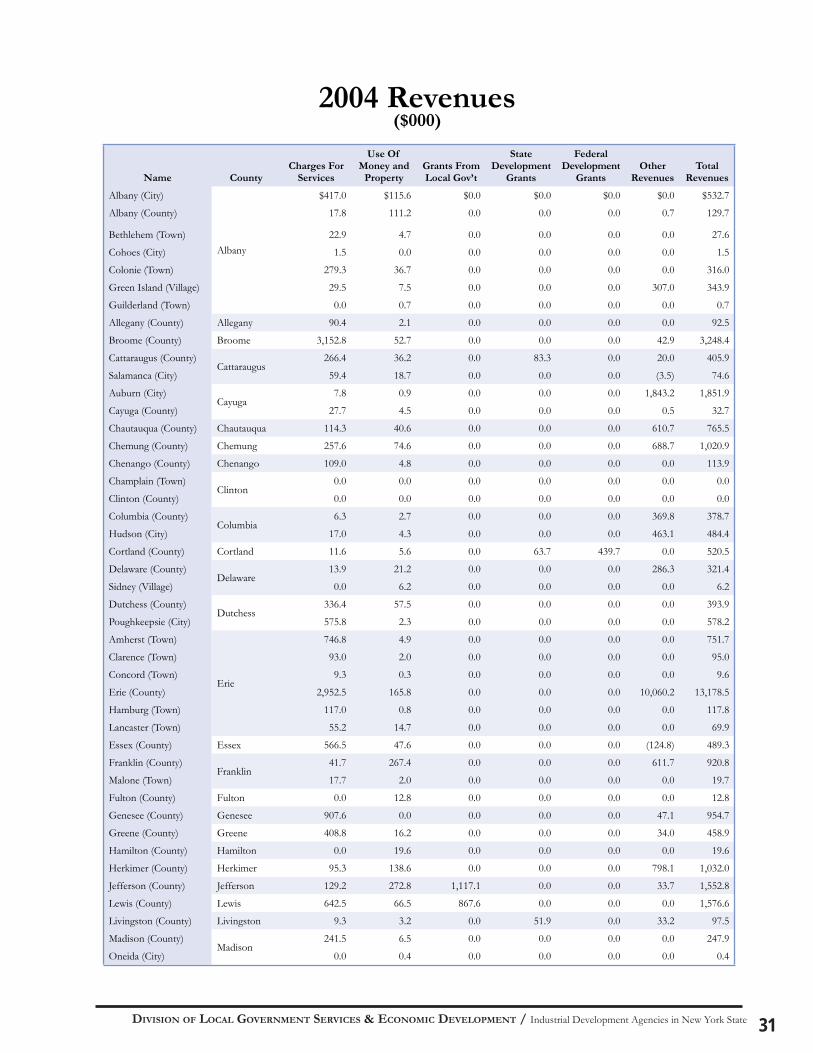
DIVISION OF LOCAL GOVERNMENT SERVICES & ECONOMIC DEVELOPMENT / Industrial Development Agencies in New York State 31
Name CountyCharges For
Services
Use OfMoney and
PropertyGrants From Local Gov’t
StateDevelopment
Grants
FederalDevelopment
GrantsOther
RevenuesTotal
Revenues
Albany (City)
Albany
$417.0 $115.6 $0.0 $0.0 $0.0 $0.0 $532.7
Albany (County) 17.8 111.2 0.0 0.0 0.0 0.7 129.7
Bethlehem (Town) 22.9 4.7 0.0 0.0 0.0 0.0 27.6
Cohoes (City) 1.5 0.0 0.0 0.0 0.0 0.0 1.5
Colonie (Town) 279.3 36.7 0.0 0.0 0.0 0.0 316.0
Green Island (Village) 29.5 7.5 0.0 0.0 0.0 307.0 343.9
Guilderland (Town) 0.0 0.7 0.0 0.0 0.0 0.0 0.7
Allegany (County) Allegany 90.4 2.1 0.0 0.0 0.0 0.0 92.5
Broome (County) Broome 3,152.8 52.7 0.0 0.0 0.0 42.9 3,248.4
Cattaraugus (County)Cattaraugus
266.4 36.2 0.0 83.3 0.0 20.0 405.9
Salamanca (City) 59.4 18.7 0.0 0.0 0.0 (3.5) 74.6
Auburn (City)Cayuga
7.8 0.9 0.0 0.0 0.0 1,843.2 1,851.9
Cayuga (County) 27.7 4.5 0.0 0.0 0.0 0.5 32.7
Chautauqua (County) Chautauqua 114.3 40.6 0.0 0.0 0.0 610.7 765.5
Chemung (County) Chemung 257.6 74.6 0.0 0.0 0.0 688.7 1,020.9
Chenango (County) Chenango 109.0 4.8 0.0 0.0 0.0 0.0 113.9
Champlain (Town)Clinton
0.0 0.0 0.0 0.0 0.0 0.0 0.0
Clinton (County) 0.0 0.0 0.0 0.0 0.0 0.0 0.0
Columbia (County)Columbia
6.3 2.7 0.0 0.0 0.0 369.8 378.7
Hudson (City) 17.0 4.3 0.0 0.0 0.0 463.1 484.4
Cortland (County) Cortland 11.6 5.6 0.0 63.7 439.7 0.0 520.5
Delaware (County)Delaware
13.9 21.2 0.0 0.0 0.0 286.3 321.4
Sidney (Village) 0.0 6.2 0.0 0.0 0.0 0.0 6.2
Dutchess (County)Dutchess
336.4 57.5 0.0 0.0 0.0 0.0 393.9
Poughkeepsie (City) 575.8 2.3 0.0 0.0 0.0 0.0 578.2
Amherst (Town)
Erie
746.8 4.9 0.0 0.0 0.0 0.0 751.7
Clarence (Town) 93.0 2.0 0.0 0.0 0.0 0.0 95.0
Concord (Town) 9.3 0.3 0.0 0.0 0.0 0.0 9.6
Erie (County) 2,952.5 165.8 0.0 0.0 0.0 10,060.2 13,178.5
Hamburg (Town) 117.0 0.8 0.0 0.0 0.0 0.0 117.8
Lancaster (Town) 55.2 14.7 0.0 0.0 0.0 0.0 69.9
Essex (County) Essex 566.5 47.6 0.0 0.0 0.0 (124.8) 489.3
Franklin (County)Franklin
41.7 267.4 0.0 0.0 0.0 611.7 920.8
Malone (Town) 17.7 2.0 0.0 0.0 0.0 0.0 19.7
Fulton (County) Fulton 0.0 12.8 0.0 0.0 0.0 0.0 12.8
Genesee (County) Genesee 907.6 0.0 0.0 0.0 0.0 47.1 954.7
Greene (County) Greene 408.8 16.2 0.0 0.0 0.0 34.0 458.9
Hamilton (County) Hamilton 0.0 19.6 0.0 0.0 0.0 0.0 19.6
Herkimer (County) Herkimer 95.3 138.6 0.0 0.0 0.0 798.1 1,032.0
Jefferson (County) Jefferson 129.2 272.8 1,117.1 0.0 0.0 33.7 1,552.8
Lewis (County) Lewis 642.5 66.5 867.6 0.0 0.0 0.0 1,576.6
Livingston (County) Livingston 9.3 3.2 0.0 51.9 0.0 33.2 97.5
Madison (County)Madison
241.5 6.5 0.0 0.0 0.0 0.0 247.9
Oneida (City) 0.0 0.4 0.0 0.0 0.0 0.0 0.4
2004 Revenues($000)
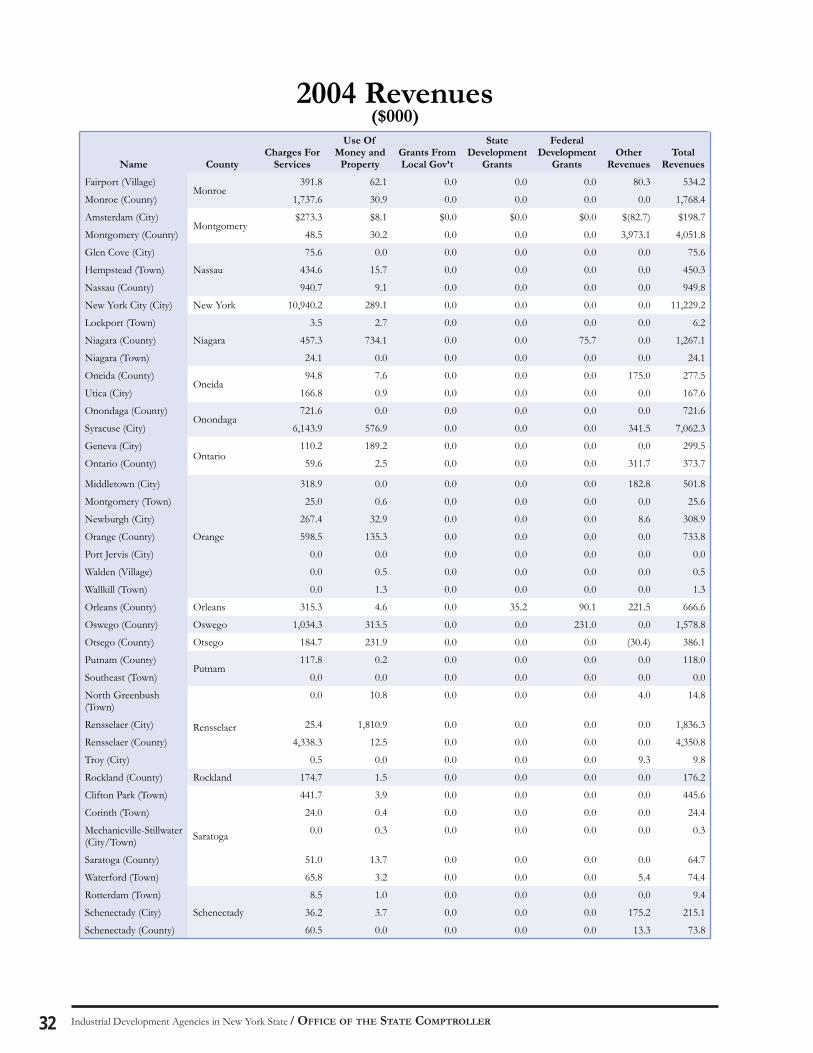
Industrial Development Agencies in New York State / OFFICE OF THE STATE COMPTROLLER32
Name CountyCharges For
Services
Use OfMoney and
PropertyGrants From Local Gov’t
StateDevelopment
Grants
FederalDevelopment
GrantsOther
RevenuesTotal
Revenues
Fairport (Village)Monroe
391.8 62.1 0.0 0.0 0.0 80.3 534.2
Monroe (County) 1,737.6 30.9 0.0 0.0 0.0 0.0 1,768.4
Amsterdam (City)Montgomery
$273.3 $8.1 $0.0 $0.0 $0.0 $(82.7) $198.7
Montgomery (County) 48.5 30.2 0.0 0.0 0.0 3,973.1 4,051.8
Glen Cove (City)
Nassau
75.6 0.0 0.0 0.0 0.0 0.0 75.6
Hempstead (Town) 434.6 15.7 0.0 0.0 0.0 0.0 450.3
Nassau (County) 940.7 9.1 0.0 0.0 0.0 0.0 949.8
New York City (City) New York 10,940.2 289.1 0.0 0.0 0.0 0.0 11,229.2
Lockport (Town)
Niagara
3.5 2.7 0.0 0.0 0.0 0.0 6.2
Niagara (County) 457.3 734.1 0.0 0.0 75.7 0.0 1,267.1
Niagara (Town) 24.1 0.0 0.0 0.0 0.0 0.0 24.1
Oneida (County)Oneida
94.8 7.6 0.0 0.0 0.0 175.0 277.5
Utica (City) 166.8 0.9 0.0 0.0 0.0 0.0 167.6
Onondaga (County)Onondaga
721.6 0.0 0.0 0.0 0.0 0.0 721.6
Syracuse (City) 6,143.9 576.9 0.0 0.0 0.0 341.5 7,062.3
Geneva (City)Ontario
110.2 189.2 0.0 0.0 0.0 0.0 299.5
Ontario (County) 59.6 2.5 0.0 0.0 0.0 311.7 373.7
Middletown (City)
Orange
318.9 0.0 0.0 0.0 0.0 182.8 501.8
Montgomery (Town) 25.0 0.6 0.0 0.0 0.0 0.0 25.6
Newburgh (City) 267.4 32.9 0.0 0.0 0.0 8.6 308.9
Orange (County) 598.5 135.3 0.0 0.0 0.0 0.0 733.8
Port Jervis (City) 0.0 0.0 0.0 0.0 0.0 0.0 0.0
Walden (Village) 0.0 0.5 0.0 0.0 0.0 0.0 0.5
Wallkill (Town) 0.0 1.3 0.0 0.0 0.0 0.0 1.3
Orleans (County) Orleans 315.3 4.6 0.0 35.2 90.1 221.5 666.6
Oswego (County) Oswego 1,034.3 313.5 0.0 0.0 231.0 0.0 1,578.8
Otsego (County) Otsego 184.7 231.9 0.0 0.0 0.0 (30.4) 386.1
Putnam (County)Putnam
117.8 0.2 0.0 0.0 0.0 0.0 118.0
Southeast (Town) 0.0 0.0 0.0 0.0 0.0 0.0 0.0
North Greenbush (Town)
Rensselaer
0.0 10.8 0.0 0.0 0.0 4.0 14.8
Rensselaer (City) 25.4 1,810.9 0.0 0.0 0.0 0.0 1,836.3
Rensselaer (County) 4,338.3 12.5 0.0 0.0 0.0 0.0 4,350.8
Troy (City) 0.5 0.0 0.0 0.0 0.0 9.3 9.8
Rockland (County) Rockland 174.7 1.5 0.0 0.0 0.0 0.0 176.2
Clifton Park (Town)
Saratoga
441.7 3.9 0.0 0.0 0.0 0.0 445.6
Corinth (Town) 24.0 0.4 0.0 0.0 0.0 0.0 24.4
Mechanicville-Stillwater (City/Town)
0.0 0.3 0.0 0.0 0.0 0.0 0.3
Saratoga (County) 51.0 13.7 0.0 0.0 0.0 0.0 64.7
Waterford (Town) 65.8 3.2 0.0 0.0 0.0 5.4 74.4
Rotterdam (Town)
Schenectady
8.5 1.0 0.0 0.0 0.0 0.0 9.4
Schenectady (City) 36.2 3.7 0.0 0.0 0.0 175.2 215.1
Schenectady (County) 60.5 0.0 0.0 0.0 0.0 13.3 73.8
2004 Revenues($000)
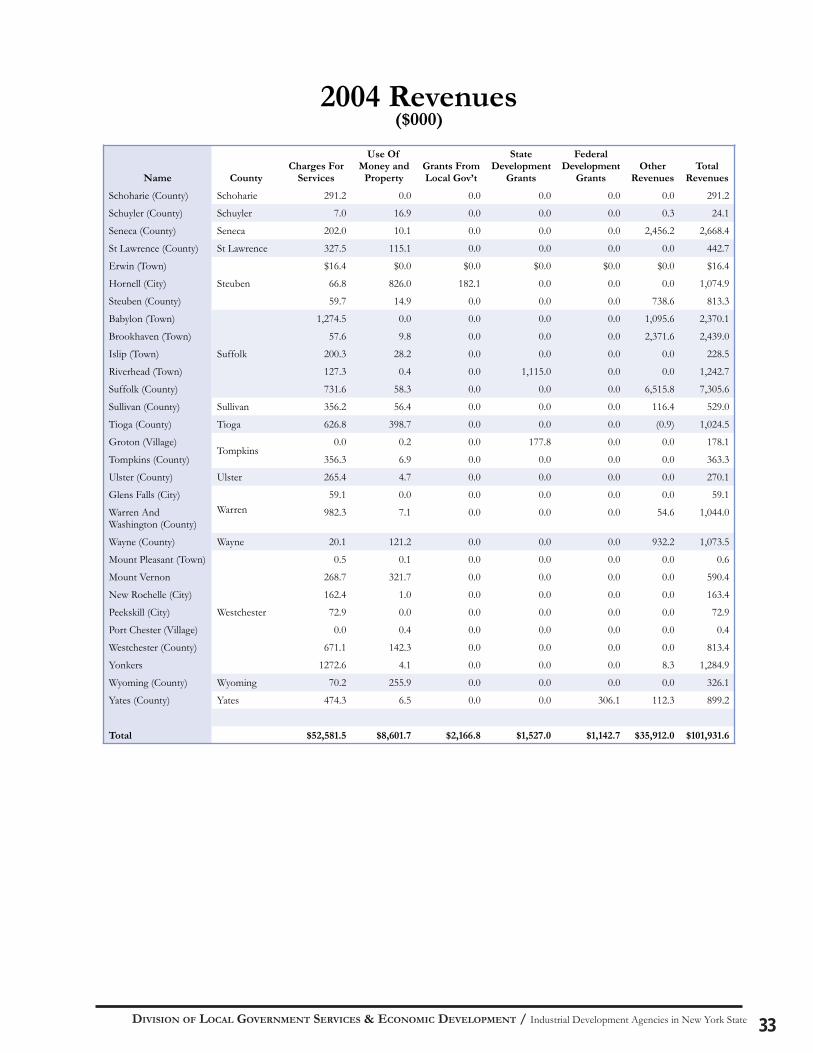
DIVISION OF LOCAL GOVERNMENT SERVICES & ECONOMIC DEVELOPMENT / Industrial Development Agencies in New York State 33
2004 Revenues($000)
Name CountyCharges For
Services
Use OfMoney and
PropertyGrants From Local Gov’t
StateDevelopment
Grants
FederalDevelopment
GrantsOther
RevenuesTotal
Revenues
Schoharie (County) Schoharie 291.2 0.0 0.0 0.0 0.0 0.0 291.2
Schuyler (County) Schuyler 7.0 16.9 0.0 0.0 0.0 0.3 24.1
Seneca (County) Seneca 202.0 10.1 0.0 0.0 0.0 2,456.2 2,668.4
St Lawrence (County) St Lawrence 327.5 115.1 0.0 0.0 0.0 0.0 442.7
Erwin (Town)
Steuben
$16.4 $0.0 $0.0 $0.0 $0.0 $0.0 $16.4
Hornell (City) 66.8 826.0 182.1 0.0 0.0 0.0 1,074.9
Steuben (County) 59.7 14.9 0.0 0.0 0.0 738.6 813.3
Babylon (Town)
Suffolk
1,274.5 0.0 0.0 0.0 0.0 1,095.6 2,370.1
Brookhaven (Town) 57.6 9.8 0.0 0.0 0.0 2,371.6 2,439.0
Islip (Town) 200.3 28.2 0.0 0.0 0.0 0.0 228.5
Riverhead (Town) 127.3 0.4 0.0 1,115.0 0.0 0.0 1,242.7
Suffolk (County) 731.6 58.3 0.0 0.0 0.0 6,515.8 7,305.6
Sullivan (County) Sullivan 356.2 56.4 0.0 0.0 0.0 116.4 529.0
Tioga (County) Tioga 626.8 398.7 0.0 0.0 0.0 (0.9) 1,024.5
Groton (Village)Tompkins
0.0 0.2 0.0 177.8 0.0 0.0 178.1
Tompkins (County) 356.3 6.9 0.0 0.0 0.0 0.0 363.3
Ulster (County) Ulster 265.4 4.7 0.0 0.0 0.0 0.0 270.1
Glens Falls (City)Warren
59.1 0.0 0.0 0.0 0.0 0.0 59.1
Warren And Washington (County)
982.3 7.1 0.0 0.0 0.0 54.6 1,044.0
Wayne (County) Wayne 20.1 121.2 0.0 0.0 0.0 932.2 1,073.5
Mount Pleasant (Town)
Westchester
0.5 0.1 0.0 0.0 0.0 0.0 0.6
Mount Vernon 268.7 321.7 0.0 0.0 0.0 0.0 590.4
New Rochelle (City) 162.4 1.0 0.0 0.0 0.0 0.0 163.4
Peekskill (City) 72.9 0.0 0.0 0.0 0.0 0.0 72.9
Port Chester (Village) 0.0 0.4 0.0 0.0 0.0 0.0 0.4
Westchester (County) 671.1 142.3 0.0 0.0 0.0 0.0 813.4
Yonkers 1272.6 4.1 0.0 0.0 0.0 8.3 1,284.9
Wyoming (County) Wyoming 70.2 255.9 0.0 0.0 0.0 0.0 326.1
Yates (County) Yates 474.3 6.5 0.0 0.0 306.1 112.3 899.2
Total $52,581.5 $8,601.7 $2,166.8 $1,527.0 $1,142.7 $35,912.0 $101,931.6
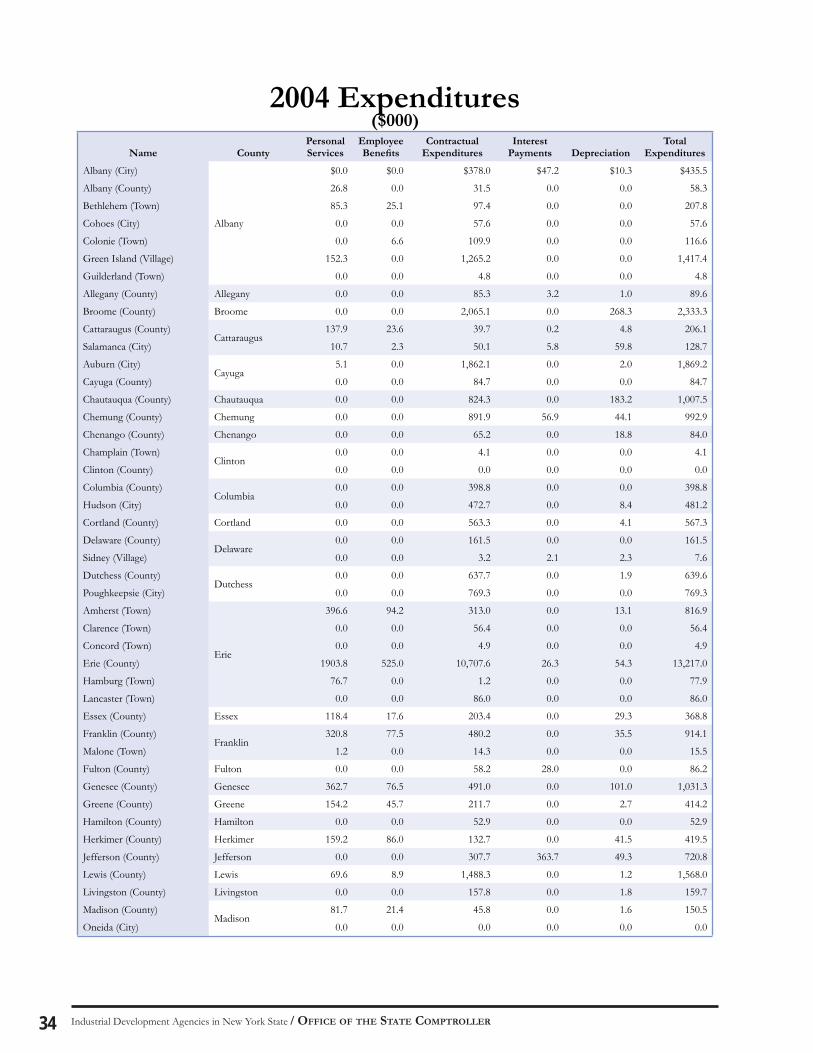
Industrial Development Agencies in New York State / OFFICE OF THE STATE COMPTROLLER34
Name CountyPersonalServices
EmployeeBenefi ts
ContractualExpenditures
InterestPayments Depreciation
TotalExpenditures
Albany (City)
Albany
$0.0 $0.0 $378.0 $47.2 $10.3 $435.5
Albany (County) 26.8 0.0 31.5 0.0 0.0 58.3
Bethlehem (Town) 85.3 25.1 97.4 0.0 0.0 207.8
Cohoes (City) 0.0 0.0 57.6 0.0 0.0 57.6
Colonie (Town) 0.0 6.6 109.9 0.0 0.0 116.6
Green Island (Village) 152.3 0.0 1,265.2 0.0 0.0 1,417.4
Guilderland (Town) 0.0 0.0 4.8 0.0 0.0 4.8
Allegany (County) Allegany 0.0 0.0 85.3 3.2 1.0 89.6
Broome (County) Broome 0.0 0.0 2,065.1 0.0 268.3 2,333.3
Cattaraugus (County)Cattaraugus
137.9 23.6 39.7 0.2 4.8 206.1
Salamanca (City) 10.7 2.3 50.1 5.8 59.8 128.7
Auburn (City)Cayuga
5.1 0.0 1,862.1 0.0 2.0 1,869.2
Cayuga (County) 0.0 0.0 84.7 0.0 0.0 84.7
Chautauqua (County) Chautauqua 0.0 0.0 824.3 0.0 183.2 1,007.5
Chemung (County) Chemung 0.0 0.0 891.9 56.9 44.1 992.9
Chenango (County) Chenango 0.0 0.0 65.2 0.0 18.8 84.0
Champlain (Town)Clinton
0.0 0.0 4.1 0.0 0.0 4.1
Clinton (County) 0.0 0.0 0.0 0.0 0.0 0.0
Columbia (County)Columbia
0.0 0.0 398.8 0.0 0.0 398.8
Hudson (City) 0.0 0.0 472.7 0.0 8.4 481.2
Cortland (County) Cortland 0.0 0.0 563.3 0.0 4.1 567.3
Delaware (County)Delaware
0.0 0.0 161.5 0.0 0.0 161.5
Sidney (Village) 0.0 0.0 3.2 2.1 2.3 7.6
Dutchess (County)Dutchess
0.0 0.0 637.7 0.0 1.9 639.6
Poughkeepsie (City) 0.0 0.0 769.3 0.0 0.0 769.3
Amherst (Town)
Erie
396.6 94.2 313.0 0.0 13.1 816.9
Clarence (Town) 0.0 0.0 56.4 0.0 0.0 56.4
Concord (Town) 0.0 0.0 4.9 0.0 0.0 4.9
Erie (County) 1903.8 525.0 10,707.6 26.3 54.3 13,217.0
Hamburg (Town) 76.7 0.0 1.2 0.0 0.0 77.9
Lancaster (Town) 0.0 0.0 86.0 0.0 0.0 86.0
Essex (County) Essex 118.4 17.6 203.4 0.0 29.3 368.8
Franklin (County)Franklin
320.8 77.5 480.2 0.0 35.5 914.1
Malone (Town) 1.2 0.0 14.3 0.0 0.0 15.5
Fulton (County) Fulton 0.0 0.0 58.2 28.0 0.0 86.2
Genesee (County) Genesee 362.7 76.5 491.0 0.0 101.0 1,031.3
Greene (County) Greene 154.2 45.7 211.7 0.0 2.7 414.2
Hamilton (County) Hamilton 0.0 0.0 52.9 0.0 0.0 52.9
Herkimer (County) Herkimer 159.2 86.0 132.7 0.0 41.5 419.5
Jefferson (County) Jefferson 0.0 0.0 307.7 363.7 49.3 720.8
Lewis (County) Lewis 69.6 8.9 1,488.3 0.0 1.2 1,568.0
Livingston (County) Livingston 0.0 0.0 157.8 0.0 1.8 159.7
Madison (County)Madison
81.7 21.4 45.8 0.0 1.6 150.5
Oneida (City) 0.0 0.0 0.0 0.0 0.0 0.0
2004 Expenditures($000)
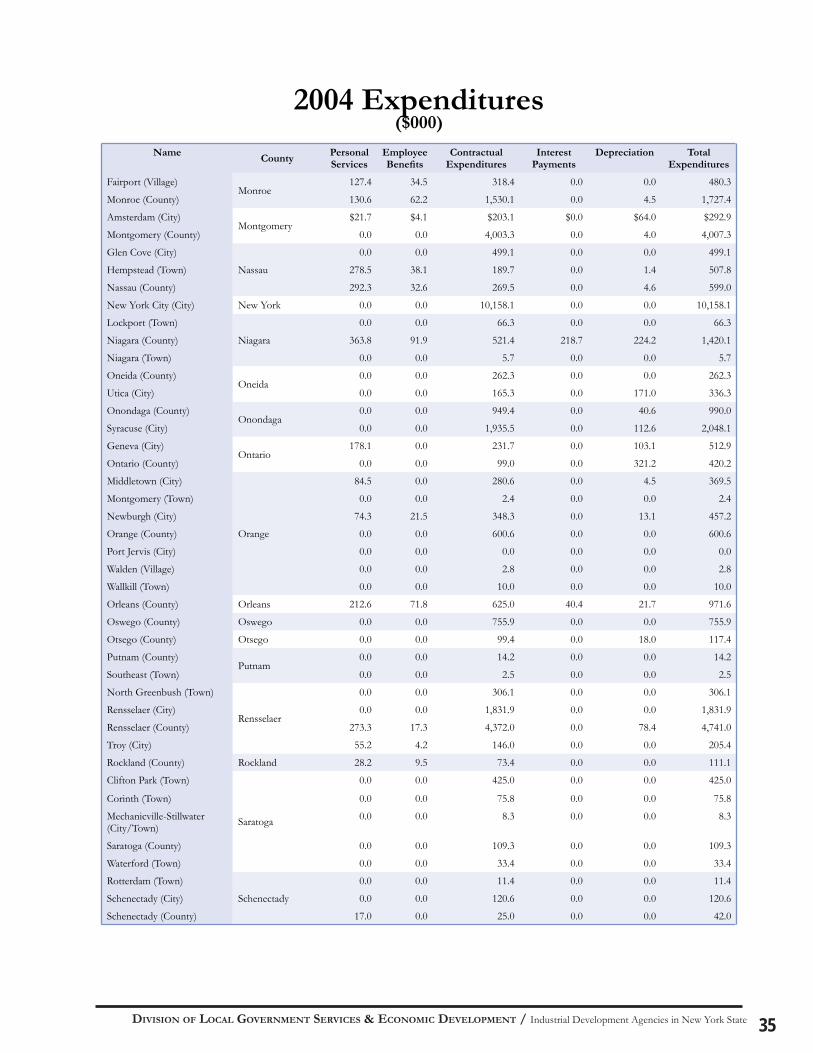
DIVISION OF LOCAL GOVERNMENT SERVICES & ECONOMIC DEVELOPMENT / Industrial Development Agencies in New York State 35
2004 Expenditures($000)
NameCounty
PersonalServices
EmployeeBenefi ts
ContractualExpenditures
InterestPayments
Depreciation TotalExpenditures
Fairport (Village)Monroe
127.4 34.5 318.4 0.0 0.0 480.3
Monroe (County) 130.6 62.2 1,530.1 0.0 4.5 1,727.4
Amsterdam (City)Montgomery
$21.7 $4.1 $203.1 $0.0 $64.0 $292.9
Montgomery (County) 0.0 0.0 4,003.3 0.0 4.0 4,007.3
Glen Cove (City)
Nassau
0.0 0.0 499.1 0.0 0.0 499.1
Hempstead (Town) 278.5 38.1 189.7 0.0 1.4 507.8
Nassau (County) 292.3 32.6 269.5 0.0 4.6 599.0
New York City (City) New York 0.0 0.0 10,158.1 0.0 0.0 10,158.1
Lockport (Town)
Niagara
0.0 0.0 66.3 0.0 0.0 66.3
Niagara (County) 363.8 91.9 521.4 218.7 224.2 1,420.1
Niagara (Town) 0.0 0.0 5.7 0.0 0.0 5.7
Oneida (County)Oneida
0.0 0.0 262.3 0.0 0.0 262.3
Utica (City) 0.0 0.0 165.3 0.0 171.0 336.3
Onondaga (County)Onondaga
0.0 0.0 949.4 0.0 40.6 990.0
Syracuse (City) 0.0 0.0 1,935.5 0.0 112.6 2,048.1
Geneva (City)Ontario
178.1 0.0 231.7 0.0 103.1 512.9
Ontario (County) 0.0 0.0 99.0 0.0 321.2 420.2
Middletown (City)
Orange
84.5 0.0 280.6 0.0 4.5 369.5
Montgomery (Town) 0.0 0.0 2.4 0.0 0.0 2.4
Newburgh (City) 74.3 21.5 348.3 0.0 13.1 457.2
Orange (County) 0.0 0.0 600.6 0.0 0.0 600.6
Port Jervis (City) 0.0 0.0 0.0 0.0 0.0 0.0
Walden (Village) 0.0 0.0 2.8 0.0 0.0 2.8
Wallkill (Town) 0.0 0.0 10.0 0.0 0.0 10.0
Orleans (County) Orleans 212.6 71.8 625.0 40.4 21.7 971.6
Oswego (County) Oswego 0.0 0.0 755.9 0.0 0.0 755.9
Otsego (County) Otsego 0.0 0.0 99.4 0.0 18.0 117.4
Putnam (County)Putnam
0.0 0.0 14.2 0.0 0.0 14.2
Southeast (Town) 0.0 0.0 2.5 0.0 0.0 2.5
North Greenbush (Town)
Rensselaer
0.0 0.0 306.1 0.0 0.0 306.1
Rensselaer (City) 0.0 0.0 1,831.9 0.0 0.0 1,831.9
Rensselaer (County) 273.3 17.3 4,372.0 0.0 78.4 4,741.0
Troy (City) 55.2 4.2 146.0 0.0 0.0 205.4
Rockland (County) Rockland 28.2 9.5 73.4 0.0 0.0 111.1
Clifton Park (Town)
Saratoga
0.0 0.0 425.0 0.0 0.0 425.0
Corinth (Town) 0.0 0.0 75.8 0.0 0.0 75.8
Mechanicville-Stillwater (City/Town)
0.0 0.0 8.3 0.0 0.0 8.3
Saratoga (County) 0.0 0.0 109.3 0.0 0.0 109.3
Waterford (Town) 0.0 0.0 33.4 0.0 0.0 33.4
Rotterdam (Town)
Schenectady
0.0 0.0 11.4 0.0 0.0 11.4
Schenectady (City) 0.0 0.0 120.6 0.0 0.0 120.6
Schenectady (County) 17.0 0.0 25.0 0.0 0.0 42.0
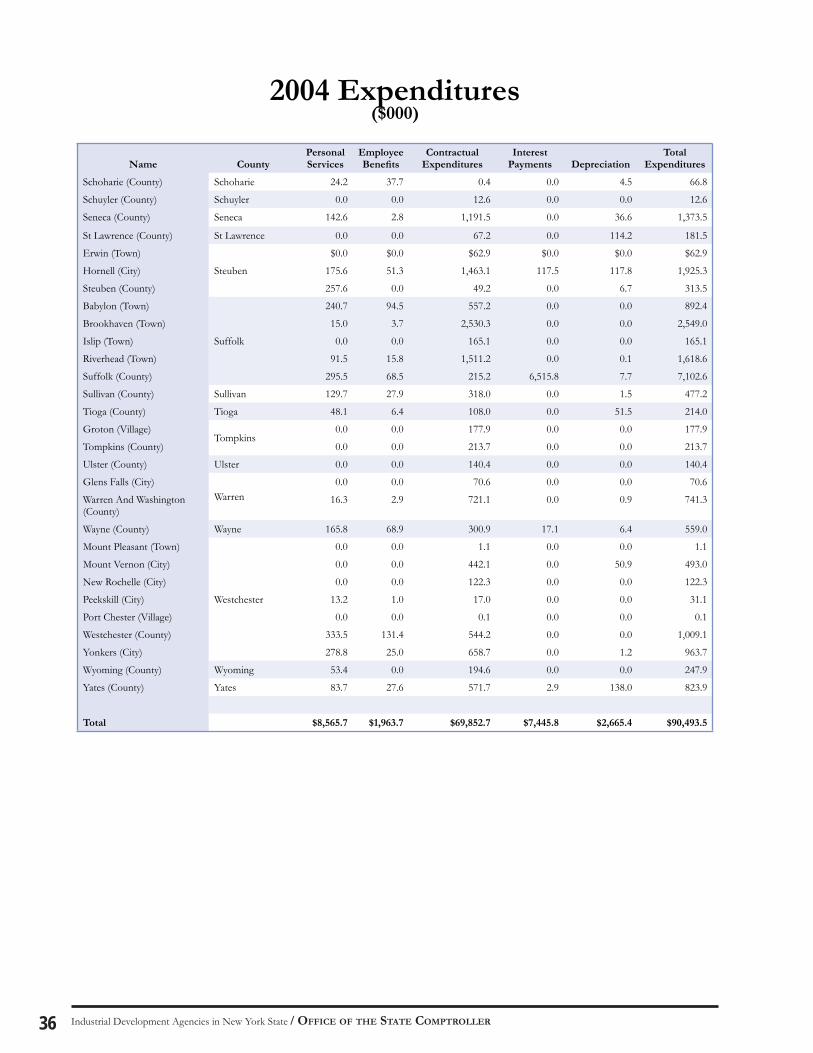
Industrial Development Agencies in New York State / OFFICE OF THE STATE COMPTROLLER36
Name CountyPersonalServices
EmployeeBenefi ts
ContractualExpenditures
InterestPayments Depreciation
TotalExpenditures
Schoharie (County) Schoharie 24.2 37.7 0.4 0.0 4.5 66.8
Schuyler (County) Schuyler 0.0 0.0 12.6 0.0 0.0 12.6
Seneca (County) Seneca 142.6 2.8 1,191.5 0.0 36.6 1,373.5
St Lawrence (County) St Lawrence 0.0 0.0 67.2 0.0 114.2 181.5
Erwin (Town)
Steuben
$0.0 $0.0 $62.9 $0.0 $0.0 $62.9
Hornell (City) 175.6 51.3 1,463.1 117.5 117.8 1,925.3
Steuben (County) 257.6 0.0 49.2 0.0 6.7 313.5
Babylon (Town)
Suffolk
240.7 94.5 557.2 0.0 0.0 892.4
Brookhaven (Town) 15.0 3.7 2,530.3 0.0 0.0 2,549.0
Islip (Town) 0.0 0.0 165.1 0.0 0.0 165.1
Riverhead (Town) 91.5 15.8 1,511.2 0.0 0.1 1,618.6
Suffolk (County) 295.5 68.5 215.2 6,515.8 7.7 7,102.6
Sullivan (County) Sullivan 129.7 27.9 318.0 0.0 1.5 477.2
Tioga (County) Tioga 48.1 6.4 108.0 0.0 51.5 214.0
Groton (Village)Tompkins
0.0 0.0 177.9 0.0 0.0 177.9
Tompkins (County) 0.0 0.0 213.7 0.0 0.0 213.7
Ulster (County) Ulster 0.0 0.0 140.4 0.0 0.0 140.4
Glens Falls (City)Warren
0.0 0.0 70.6 0.0 0.0 70.6
Warren And Washington (County)
16.3 2.9 721.1 0.0 0.9 741.3
Wayne (County) Wayne 165.8 68.9 300.9 17.1 6.4 559.0
Mount Pleasant (Town)
Westchester
0.0 0.0 1.1 0.0 0.0 1.1
Mount Vernon (City) 0.0 0.0 442.1 0.0 50.9 493.0
New Rochelle (City) 0.0 0.0 122.3 0.0 0.0 122.3
Peekskill (City) 13.2 1.0 17.0 0.0 0.0 31.1
Port Chester (Village) 0.0 0.0 0.1 0.0 0.0 0.1
Westchester (County) 333.5 131.4 544.2 0.0 0.0 1,009.1
Yonkers (City) 278.8 25.0 658.7 0.0 1.2 963.7
Wyoming (County) Wyoming 53.4 0.0 194.6 0.0 0.0 247.9
Yates (County) Yates 83.7 27.6 571.7 2.9 138.0 823.9
Total $8,565.7 $1,963.7 $69,852.7 $7,445.8 $2,665.4 $90,493.5
2004 Expenditures($000)
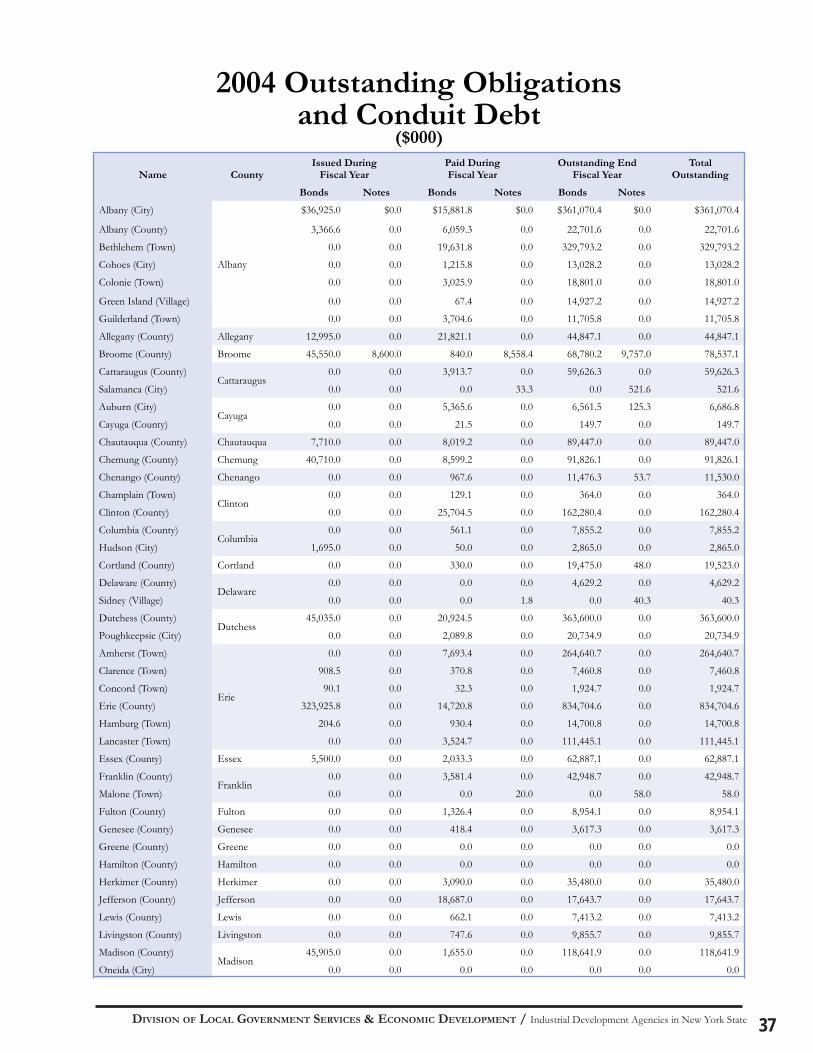
DIVISION OF LOCAL GOVERNMENT SERVICES & ECONOMIC DEVELOPMENT / Industrial Development Agencies in New York State 37
2004 Outstanding Obligations and Conduit Debt
($000)
Name CountyIssued During
Fiscal YearPaid DuringFiscal Year
Outstanding EndFiscal Year
Total Outstanding
Bonds Notes Bonds Notes Bonds Notes
Albany (City)
Albany
$36,925.0 $0.0 $15,881.8 $0.0 $361,070.4 $0.0 $361,070.4
Albany (County) 3,366.6 0.0 6,059.3 0.0 22,701.6 0.0 22,701.6
Bethlehem (Town) 0.0 0.0 19,631.8 0.0 329,793.2 0.0 329,793.2
Cohoes (City) 0.0 0.0 1,215.8 0.0 13,028.2 0.0 13,028.2
Colonie (Town) 0.0 0.0 3,025.9 0.0 18,801.0 0.0 18,801.0
Green Island (Village) 0.0 0.0 67.4 0.0 14,927.2 0.0 14,927.2
Guilderland (Town) 0.0 0.0 3,704.6 0.0 11,705.8 0.0 11,705.8
Allegany (County) Allegany 12,995.0 0.0 21,821.1 0.0 44,847.1 0.0 44,847.1
Broome (County) Broome 45,550.0 8,600.0 840.0 8,558.4 68,780.2 9,757.0 78,537.1
Cattaraugus (County)Cattaraugus
0.0 0.0 3,913.7 0.0 59,626.3 0.0 59,626.3
Salamanca (City) 0.0 0.0 0.0 33.3 0.0 521.6 521.6
Auburn (City)Cayuga
0.0 0.0 5,365.6 0.0 6,561.5 125.3 6,686.8
Cayuga (County) 0.0 0.0 21.5 0.0 149.7 0.0 149.7
Chautauqua (County) Chautauqua 7,710.0 0.0 8,019.2 0.0 89,447.0 0.0 89,447.0
Chemung (County) Chemung 40,710.0 0.0 8,599.2 0.0 91,826.1 0.0 91,826.1
Chenango (County) Chenango 0.0 0.0 967.6 0.0 11,476.3 53.7 11,530.0
Champlain (Town)Clinton
0.0 0.0 129.1 0.0 364.0 0.0 364.0
Clinton (County) 0.0 0.0 25,704.5 0.0 162,280.4 0.0 162,280.4
Columbia (County)Columbia
0.0 0.0 561.1 0.0 7,855.2 0.0 7,855.2
Hudson (City) 1,695.0 0.0 50.0 0.0 2,865.0 0.0 2,865.0
Cortland (County) Cortland 0.0 0.0 330.0 0.0 19,475.0 48.0 19,523.0
Delaware (County)Delaware
0.0 0.0 0.0 0.0 4,629.2 0.0 4,629.2
Sidney (Village) 0.0 0.0 0.0 1.8 0.0 40.3 40.3
Dutchess (County)Dutchess
45,035.0 0.0 20,924.5 0.0 363,600.0 0.0 363,600.0
Poughkeepsie (City) 0.0 0.0 2,089.8 0.0 20,734.9 0.0 20,734.9
Amherst (Town)
Erie
0.0 0.0 7,693.4 0.0 264,640.7 0.0 264,640.7
Clarence (Town) 908.5 0.0 370.8 0.0 7,460.8 0.0 7,460.8
Concord (Town) 90.1 0.0 32.3 0.0 1,924.7 0.0 1,924.7
Erie (County) 323,925.8 0.0 14,720.8 0.0 834,704.6 0.0 834,704.6
Hamburg (Town) 204.6 0.0 930.4 0.0 14,700.8 0.0 14,700.8
Lancaster (Town) 0.0 0.0 3,524.7 0.0 111,445.1 0.0 111,445.1
Essex (County) Essex 5,500.0 0.0 2,033.3 0.0 62,887.1 0.0 62,887.1
Franklin (County)Franklin
0.0 0.0 3,581.4 0.0 42,948.7 0.0 42,948.7
Malone (Town) 0.0 0.0 0.0 20.0 0.0 58.0 58.0
Fulton (County) Fulton 0.0 0.0 1,326.4 0.0 8,954.1 0.0 8,954.1
Genesee (County) Genesee 0.0 0.0 418.4 0.0 3,617.3 0.0 3,617.3
Greene (County) Greene 0.0 0.0 0.0 0.0 0.0 0.0 0.0
Hamilton (County) Hamilton 0.0 0.0 0.0 0.0 0.0 0.0 0.0
Herkimer (County) Herkimer 0.0 0.0 3,090.0 0.0 35,480.0 0.0 35,480.0
Jefferson (County) Jefferson 0.0 0.0 18,687.0 0.0 17,643.7 0.0 17,643.7
Lewis (County) Lewis 0.0 0.0 662.1 0.0 7,413.2 0.0 7,413.2
Livingston (County) Livingston 0.0 0.0 747.6 0.0 9,855.7 0.0 9,855.7
Madison (County)Madison
45,905.0 0.0 1,655.0 0.0 118,641.9 0.0 118,641.9
Oneida (City) 0.0 0.0 0.0 0.0 0.0 0.0 0.0
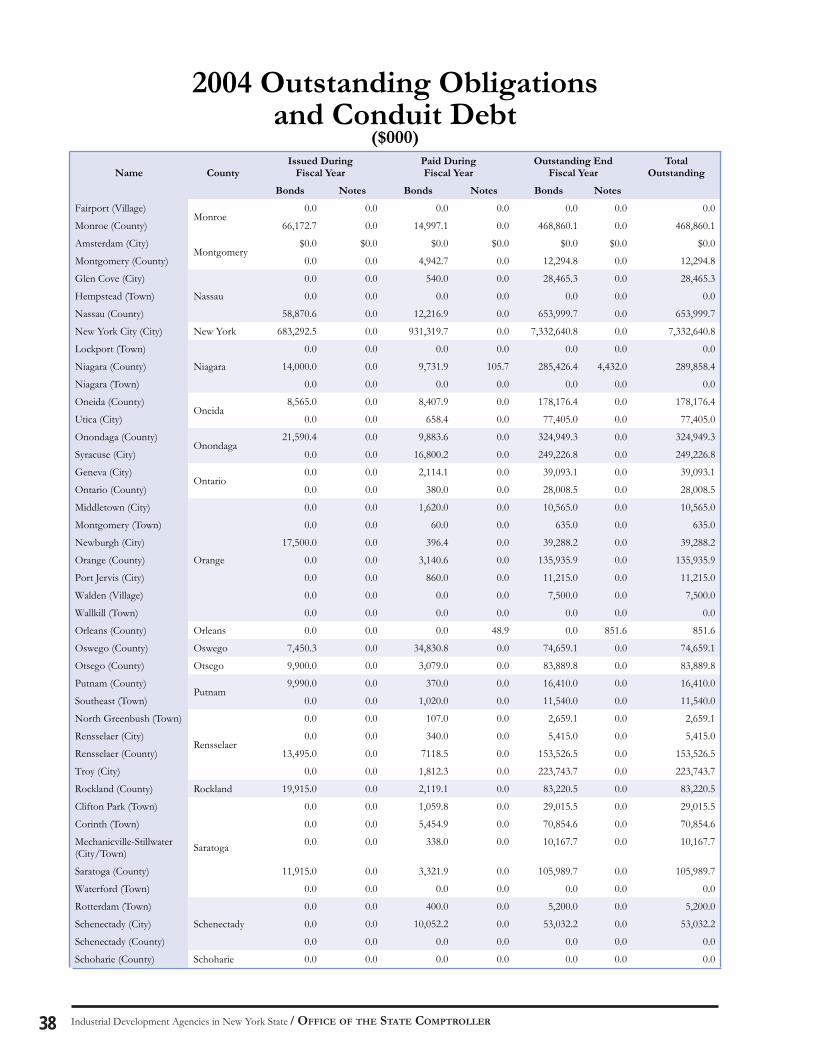
Industrial Development Agencies in New York State / OFFICE OF THE STATE COMPTROLLER38
2004 Outstanding Obligations and Conduit Debt
($000)
Name CountyIssued During
Fiscal YearPaid DuringFiscal Year
Outstanding EndFiscal Year
Total Outstanding
Bonds Notes Bonds Notes Bonds Notes
Fairport (Village)Monroe
0.0 0.0 0.0 0.0 0.0 0.0 0.0
Monroe (County) 66,172.7 0.0 14,997.1 0.0 468,860.1 0.0 468,860.1
Amsterdam (City)Montgomery
$0.0 $0.0 $0.0 $0.0 $0.0 $0.0 $0.0
Montgomery (County) 0.0 0.0 4,942.7 0.0 12,294.8 0.0 12,294.8
Glen Cove (City)
Nassau
0.0 0.0 540.0 0.0 28,465.3 0.0 28,465.3
Hempstead (Town) 0.0 0.0 0.0 0.0 0.0 0.0 0.0
Nassau (County) 58,870.6 0.0 12,216.9 0.0 653,999.7 0.0 653,999.7
New York City (City) New York 683,292.5 0.0 931,319.7 0.0 7,332,640.8 0.0 7,332,640.8
Lockport (Town)
Niagara
0.0 0.0 0.0 0.0 0.0 0.0 0.0
Niagara (County) 14,000.0 0.0 9,731.9 105.7 285,426.4 4,432.0 289,858.4
Niagara (Town) 0.0 0.0 0.0 0.0 0.0 0.0 0.0
Oneida (County)Oneida
8,565.0 0.0 8,407.9 0.0 178,176.4 0.0 178,176.4
Utica (City) 0.0 0.0 658.4 0.0 77,405.0 0.0 77,405.0
Onondaga (County)Onondaga
21,590.4 0.0 9,883.6 0.0 324,949.3 0.0 324,949.3
Syracuse (City) 0.0 0.0 16,800.2 0.0 249,226.8 0.0 249,226.8
Geneva (City)Ontario
0.0 0.0 2,114.1 0.0 39,093.1 0.0 39,093.1
Ontario (County) 0.0 0.0 380.0 0.0 28,008.5 0.0 28,008.5
Middletown (City)
Orange
0.0 0.0 1,620.0 0.0 10,565.0 0.0 10,565.0
Montgomery (Town) 0.0 0.0 60.0 0.0 635.0 0.0 635.0
Newburgh (City) 17,500.0 0.0 396.4 0.0 39,288.2 0.0 39,288.2
Orange (County) 0.0 0.0 3,140.6 0.0 135,935.9 0.0 135,935.9
Port Jervis (City) 0.0 0.0 860.0 0.0 11,215.0 0.0 11,215.0
Walden (Village) 0.0 0.0 0.0 0.0 7,500.0 0.0 7,500.0
Wallkill (Town) 0.0 0.0 0.0 0.0 0.0 0.0 0.0
Orleans (County) Orleans 0.0 0.0 0.0 48.9 0.0 851.6 851.6
Oswego (County) Oswego 7,450.3 0.0 34,830.8 0.0 74,659.1 0.0 74,659.1
Otsego (County) Otsego 9,900.0 0.0 3,079.0 0.0 83,889.8 0.0 83,889.8
Putnam (County)Putnam
9,990.0 0.0 370.0 0.0 16,410.0 0.0 16,410.0
Southeast (Town) 0.0 0.0 1,020.0 0.0 11,540.0 0.0 11,540.0
North Greenbush (Town)
Rensselaer
0.0 0.0 107.0 0.0 2,659.1 0.0 2,659.1
Rensselaer (City) 0.0 0.0 340.0 0.0 5,415.0 0.0 5,415.0
Rensselaer (County) 13,495.0 0.0 7118.5 0.0 153,526.5 0.0 153,526.5
Troy (City) 0.0 0.0 1,812.3 0.0 223,743.7 0.0 223,743.7
Rockland (County) Rockland 19,915.0 0.0 2,119.1 0.0 83,220.5 0.0 83,220.5
Clifton Park (Town)
Saratoga
0.0 0.0 1,059.8 0.0 29,015.5 0.0 29,015.5
Corinth (Town) 0.0 0.0 5,454.9 0.0 70,854.6 0.0 70,854.6
Mechanicville-Stillwater (City/Town)
0.0 0.0 338.0 0.0 10,167.7 0.0 10,167.7
Saratoga (County) 11,915.0 0.0 3,321.9 0.0 105,989.7 0.0 105,989.7
Waterford (Town) 0.0 0.0 0.0 0.0 0.0 0.0 0.0
Rotterdam (Town)
Schenectady
0.0 0.0 400.0 0.0 5,200.0 0.0 5,200.0
Schenectady (City) 0.0 0.0 10,052.2 0.0 53,032.2 0.0 53,032.2
Schenectady (County) 0.0 0.0 0.0 0.0 0.0 0.0 0.0
Schoharie (County) Schoharie 0.0 0.0 0.0 0.0 0.0 0.0 0.0
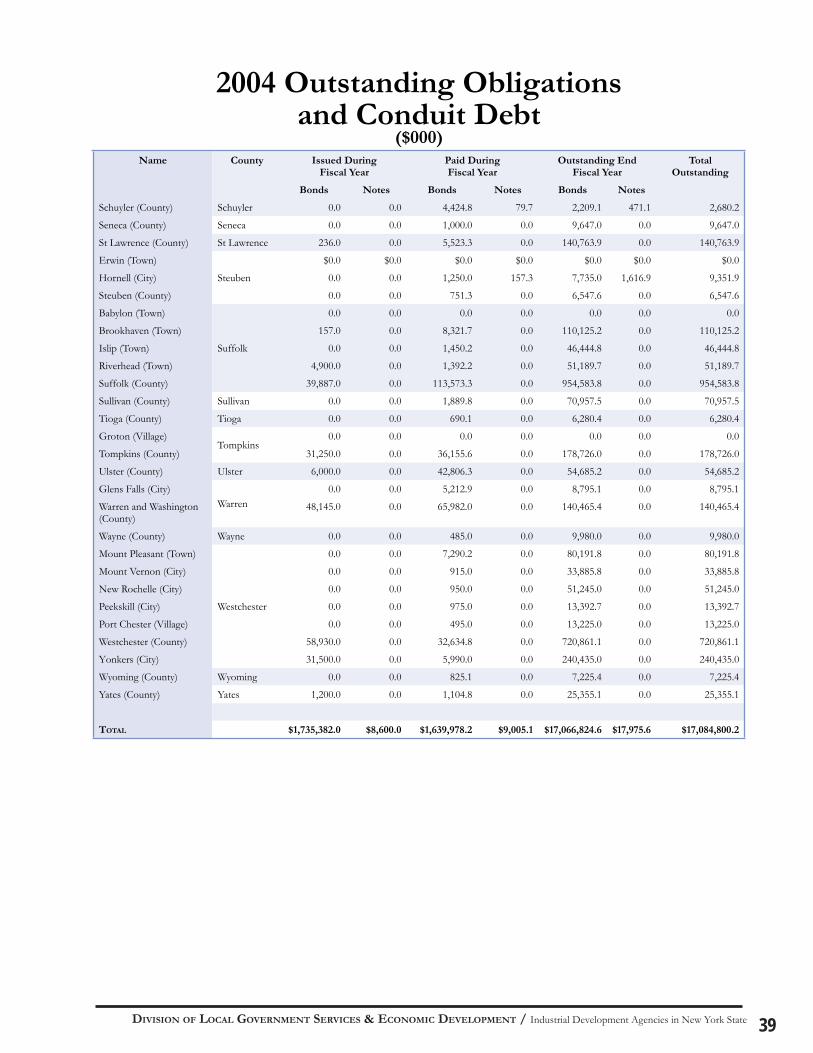
DIVISION OF LOCAL GOVERNMENT SERVICES & ECONOMIC DEVELOPMENT / Industrial Development Agencies in New York State 39
2004 Outstanding Obligations and Conduit Debt
($000)Name County Issued During
Fiscal YearPaid DuringFiscal Year
Outstanding EndFiscal Year
Total Outstanding
Bonds Notes Bonds Notes Bonds Notes
Schuyler (County) Schuyler 0.0 0.0 4,424.8 79.7 2,209.1 471.1 2,680.2
Seneca (County) Seneca 0.0 0.0 1,000.0 0.0 9,647.0 0.0 9,647.0
St Lawrence (County) St Lawrence 236.0 0.0 5,523.3 0.0 140,763.9 0.0 140,763.9
Erwin (Town)
Steuben
$0.0 $0.0 $0.0 $0.0 $0.0 $0.0 $0.0
Hornell (City) 0.0 0.0 1,250.0 157.3 7,735.0 1,616.9 9,351.9
Steuben (County) 0.0 0.0 751.3 0.0 6,547.6 0.0 6,547.6
Babylon (Town)
Suffolk
0.0 0.0 0.0 0.0 0.0 0.0 0.0
Brookhaven (Town) 157.0 0.0 8,321.7 0.0 110,125.2 0.0 110,125.2
Islip (Town) 0.0 0.0 1,450.2 0.0 46,444.8 0.0 46,444.8
Riverhead (Town) 4,900.0 0.0 1,392.2 0.0 51,189.7 0.0 51,189.7
Suffolk (County) 39,887.0 0.0 113,573.3 0.0 954,583.8 0.0 954,583.8
Sullivan (County) Sullivan 0.0 0.0 1,889.8 0.0 70,957.5 0.0 70,957.5
Tioga (County) Tioga 0.0 0.0 690.1 0.0 6,280.4 0.0 6,280.4
Groton (Village)Tompkins
0.0 0.0 0.0 0.0 0.0 0.0 0.0
Tompkins (County) 31,250.0 0.0 36,155.6 0.0 178,726.0 0.0 178,726.0
Ulster (County) Ulster 6,000.0 0.0 42,806.3 0.0 54,685.2 0.0 54,685.2
Glens Falls (City)Warren
0.0 0.0 5,212.9 0.0 8,795.1 0.0 8,795.1
Warren and Washington (County)
48,145.0 0.0 65,982.0 0.0 140,465.4 0.0 140,465.4
Wayne (County) Wayne 0.0 0.0 485.0 0.0 9,980.0 0.0 9,980.0
Mount Pleasant (Town)
Westchester
0.0 0.0 7,290.2 0.0 80,191.8 0.0 80,191.8
Mount Vernon (City) 0.0 0.0 915.0 0.0 33,885.8 0.0 33,885.8
New Rochelle (City) 0.0 0.0 950.0 0.0 51,245.0 0.0 51,245.0
Peekskill (City) 0.0 0.0 975.0 0.0 13,392.7 0.0 13,392.7
Port Chester (Village) 0.0 0.0 495.0 0.0 13,225.0 0.0 13,225.0
Westchester (County) 58,930.0 0.0 32,634.8 0.0 720,861.1 0.0 720,861.1
Yonkers (City) 31,500.0 0.0 5,990.0 0.0 240,435.0 0.0 240,435.0
Wyoming (County) Wyoming 0.0 0.0 825.1 0.0 7,225.4 0.0 7,225.4
Yates (County) Yates 1,200.0 0.0 1,104.8 0.0 25,355.1 0.0 25,355.1
TOTAL $1,735,382.0 $8,600.0 $1,639,978.2 $9,005.1 $17,066,824.6 $17,975.6 $17,084,800.2
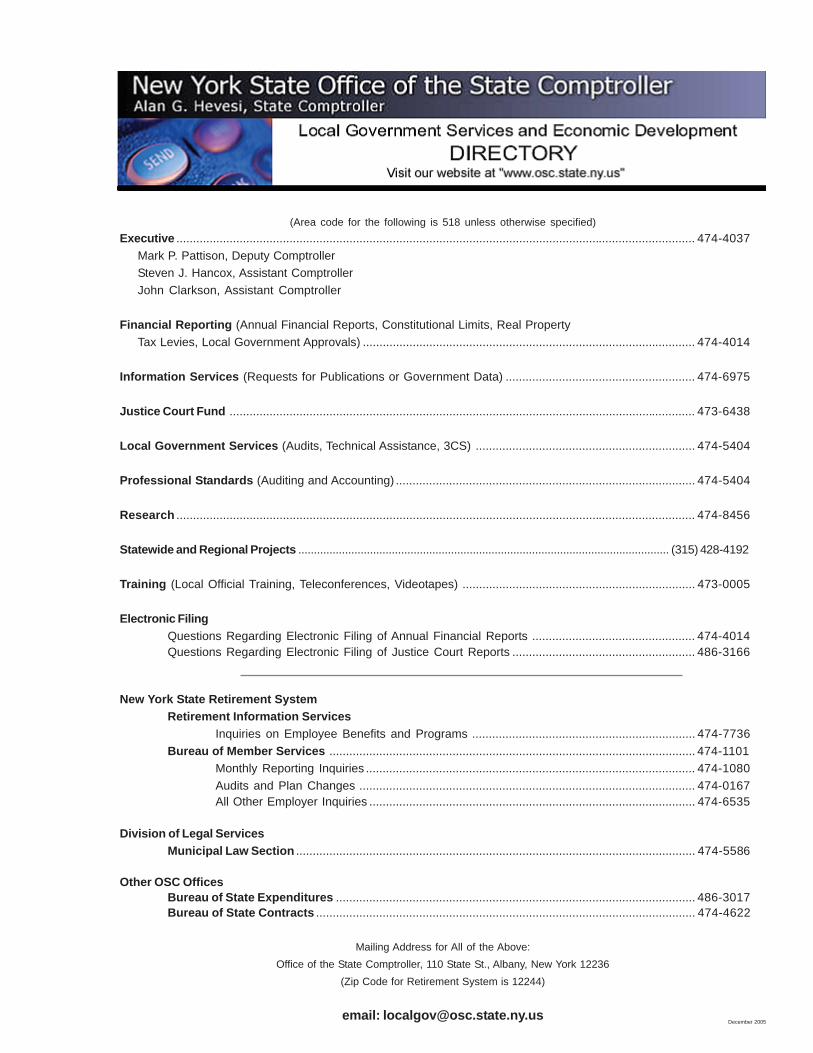
(Area code for the following is 518 unless otherwise specified)Executive ............................................................................................................................................................ 474-4037
Mark P. Pattison, Deputy ComptrollerSteven J. Hancox, Assistant ComptrollerJohn Clarkson, Assistant Comptroller
Financial Reporting (Annual Financial Reports, Constitutional Limits, Real PropertyTax Levies, Local Government Approvals) .................................................................................................... 474-4014
Information Services (Requests for Publications or Government Data) ......................................................... 474-6975
Justice Court Fund ............................................................................................................................................ 473-6438
Local Government Services (Audits, Technical Assistance, 3CS) .................................................................. 474-5404
Professional Standards (Auditing and Accounting) .......................................................................................... 474-5404
Research ............................................................................................................................................................ 474-8456
Statewide and Regional Projects ....................................................................................................................... (315) 428-4192
Training (Local Official Training, Teleconferences, Videotapes) ...................................................................... 473-0005
Electronic FilingQuestions Regarding Electronic Filing of Annual Financial Reports ................................................. 474-4014Questions Regarding Electronic Filing of Justice Court Reports ....................................................... 486-3166
New York State Retirement SystemRetirement Information Services
Inquiries on Employee Benefits and Programs ................................................................... 474-7736Bureau of Member Services .............................................................................................................. 474-1101
Monthly Reporting Inquiries ................................................................................................... 474-1080Audits and Plan Changes ..................................................................................................... 474-0167All Other Employer Inquiries .................................................................................................. 474-6535
Division of Legal ServicesMunicipal Law Section ........................................................................................................................ 474-5586
Other OSC OfficesBureau of State Expenditures ............................................................................................................ 486-3017Bureau of State Contracts .................................................................................................................. 474-4622
Mailing Address for All of the Above:Office of the State Comptroller, 110 State St., Albany, New York 12236
(Zip Code for Retirement System is 12244)
email: [email protected] 2005
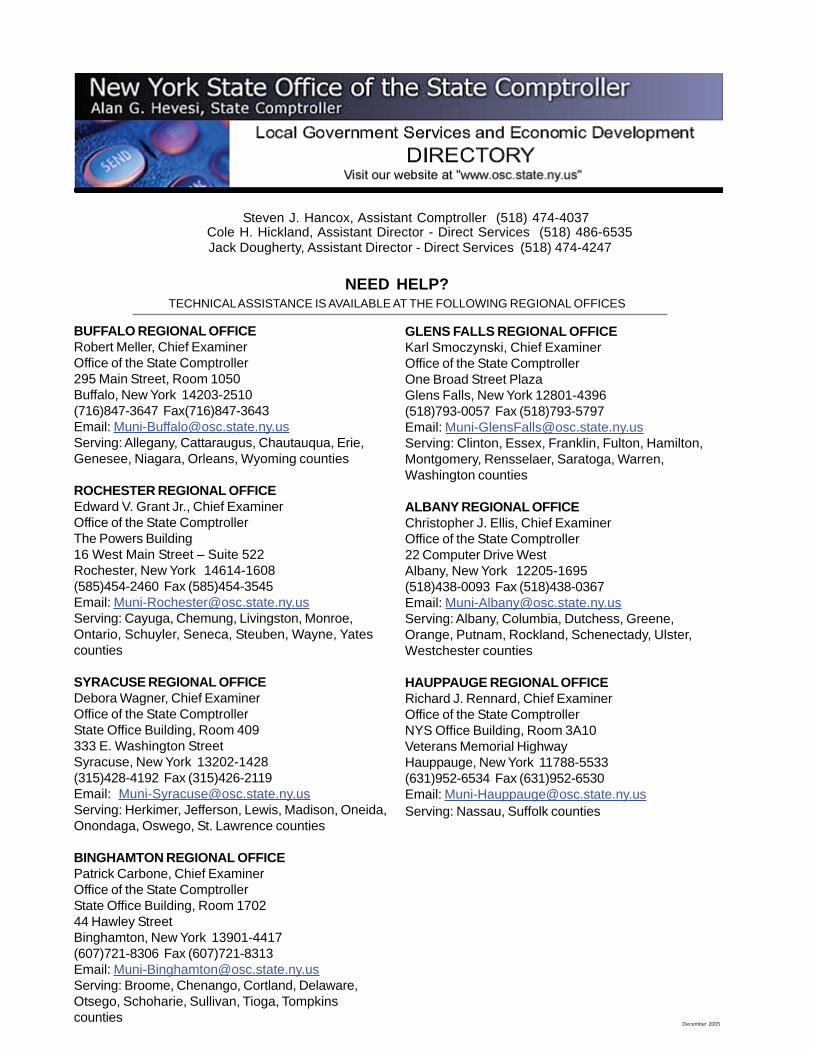
December 2005
Steven J. Hancox, Assistant Comptroller (518) 474-4037Cole H. Hickland, Assistant Director - Direct Services (518) 486-6535Jack Dougherty, Assistant Director - Direct Services (518) 474-4247
NEED HELP?TECHNICAL ASSISTANCE IS AVAILABLE AT THE FOLLOWING REGIONAL OFFICES
BUFFALO REGIONAL OFFICERobert Meller, Chief ExaminerOffice of the State Comptroller295 Main Street, Room 1050Buffalo, New York 14203-2510(716)847-3647 Fax(716)847-3643Email: [email protected]: Allegany, Cattaraugus, Chautauqua, Erie,Genesee, Niagara, Orleans, Wyoming counties
ROCHESTER REGIONAL OFFICEEdward V. Grant Jr., Chief ExaminerOffice of the State ComptrollerThe Powers Building16 West Main Street – Suite 522Rochester, New York 14614-1608(585)454-2460 Fax (585)454-3545Email: [email protected]: Cayuga, Chemung, Livingston, Monroe,Ontario, Schuyler, Seneca, Steuben, Wayne, Yatescounties
SYRACUSE REGIONAL OFFICEDebora Wagner, Chief ExaminerOffice of the State ComptrollerState Office Building, Room 409333 E. Washington StreetSyracuse, New York 13202-1428(315)428-4192 Fax (315)426-2119Email: [email protected]: Herkimer, Jefferson, Lewis, Madison, Oneida,Onondaga, Oswego, St. Lawrence counties
BINGHAMTON REGIONAL OFFICEPatrick Carbone, Chief ExaminerOffice of the State ComptrollerState Office Building, Room 170244 Hawley StreetBinghamton, New York 13901-4417(607)721-8306 Fax (607)721-8313Email: [email protected]: Broome, Chenango, Cortland, Delaware,Otsego, Schoharie, Sullivan, Tioga, Tompkinscounties
GLENS FALLS REGIONAL OFFICEKarl Smoczynski, Chief ExaminerOffice of the State ComptrollerOne Broad Street PlazaGlens Falls, New York 12801-4396(518)793-0057 Fax (518)793-5797Email: [email protected]: Clinton, Essex, Franklin, Fulton, Hamilton,Montgomery, Rensselaer, Saratoga, Warren,Washington counties
ALBANY REGIONAL OFFICEChristopher J. Ellis, Chief ExaminerOffice of the State Comptroller22 Computer Drive WestAlbany, New York 12205-1695(518)438-0093 Fax (518)438-0367Email: [email protected]: Albany, Columbia, Dutchess, Greene,Orange, Putnam, Rockland, Schenectady, Ulster,Westchester counties
HAUPPAUGE REGIONAL OFFICERichard J. Rennard, Chief ExaminerOffice of the State ComptrollerNYS Office Building, Room 3A10Veterans Memorial HighwayHauppauge, New York 11788-5533(631)952-6534 Fax (631)952-6530Email: [email protected]: Nassau, Suffolk counties

New York StateOffi ce of the State Comptroller
Division of Local Government Services and Economic Development
110 State Street, 12th Floor • Albany, New York 12236