Embed Size (px)
Citation preview
INDUSTRIAL CASE STUDY: THE CEMENT INDUSTRY CALMAC Study ID: PGE0251.01
FINAL REPORT PREPARED FOR
PACIFIC GAS AND ELECTRIC COMPANY SAN FRANCISCO, CALIFORNIA PREPARED BY
KEMA with assistance from
LAWRENCE BERKELEY NATIONAL LABORATORY
SEPTEMBER 2005


INDUSTRIAL CASE STUDY: THE CEMENT INDUSTRY
CALMAC Study ID: PGE0251.01
Final Report
Prepared for
Pacific Gas and Electric Company San Francisco, California
Prepared by
KEMA Inc. Oakland, California
with assistance from
Lawrence Berkeley National Laboratory
Berkeley, California
September 2005

TABLE OF CONTENTS
i
SECTION 1 INTRODUCTION .......................................................................................1–1
SECTION 2 CEMENT INDUSTRY STATISTICS ..........................................................2–1 2.1 Economic Statistics........................................................................................2–1 2.2 Energy Usage .................................................................................................2–1
2.2.1 Peak Electricity Demand....................................................................2–3 2.3 Energy Intensity .............................................................................................2–3 2.4 References......................................................................................................2–4
SECTION 3 CEMENT PRODUCTION PROCESS AND ENERGY USE.......................3–1 3.1 Introduction....................................................................................................3–1 3.2 Description of the Cement Production Process .............................................3–2
3.2.1 Mining and Quarrying........................................................................3–2 3.2.2 Raw Material Preparation ..................................................................3–3 3.2.3 Clinker Production (Pyro-Processing) ...............................................3–3 3.2.4 Finish Grinding ..................................................................................3–4
3.3 Cement Production Energy Use.....................................................................3–4 3.4 Technical Potential for Energy Efficiency.....................................................3–5 3.5 References......................................................................................................3–6
SECTION 4 CUSTOMER INTERVIEWS.......................................................................4–1 4.1 Overview........................................................................................................4–1 4.2 General Information.......................................................................................4–1 4.3 Energy Characteristics ...................................................................................4–2 4.4 Energy as It Relates to Overall Business Factors ..........................................4–2 4.5 Overall Energy Management .........................................................................4–3 4.6 General Decision-Making Practices ..............................................................4–5 4.7 Energy Efficiency Decision Making..............................................................4–6 4.8 O&M Practices...............................................................................................4–6 4.9 Attitudes Towards Energy Efficiency............................................................4–7 4.10 Recent Energy Efficiency Project Activity....................................................4–8 4.11 Energy Efficiency Information and Program Activity...................................4–9
SECTION 5 ENERGY-EFFICIENCY INITIATIVES .......................................................5–1 5.1 Portland Cement Association.........................................................................5–1 5.2 Cement Kiln Recycling Coalition..................................................................5–1 5.3 Climate VISION ............................................................................................5–1

TABLE OF CONTENTS
ii
5.4 ENERGY STAR ............................................................................................5–2 5.5 Climate Leaders .............................................................................................5–2 5.6 References......................................................................................................5–3
SECTION 6 OPPORTUNITIES AND BARRIERS.........................................................6–1 6.1 Energy Efficiency Opportunities ...................................................................6–1
6.1.1 O&M..................................................................................................6–1 6.1.2 High Efficiency Equipment/Processes...............................................6–1 6.1.3 Process Controls.................................................................................6–2
6.2 Barriers to Energy Efficiency ........................................................................6–3 6.2.1 Barriers to Program Participation ......................................................6–4
6.3 References......................................................................................................6–4
SECTION 7 RECOMMENDATIONS .............................................................................7–1
APPENDIX A INTERVIEW GUIDE ................................................................................. A–1
APPENDIX B CUSTOMER SURVEY RESULTS............................................................ B–1
LIST OF TABLES Table 2-1 Cement Industry Economic Statistics ................................................2–1 Table 2-2 Cement Industry Electricity and Natural Gas Consumption..............2–2 Table 4-1 General Customer/Facility Information.............................................4–2 Table 4-2 Rating of Key Business Factors (0 = Unimportant, 5 =
Extremely Important).........................................................................4–3 Table 4-3 Overall Energy Management Policy..................................................4–4 Table 4-4 Usual Decision Making Process for Capital Improvements ..............4–5 Table 4-5 Equipment-Specific O&M Practices..................................................4–7
LIST OF FIGURES Figure 2-1 Cement Industry End Use Electricity Consumption..........................2–2 Figure 2-2 Electric Energy Intensity Comparison ...............................................2–3 Figure 3-1 Simplified Process Schematic for Cement Making ...........................3–2

1 INTRODUCTION
1–1
1 INTRODUCTION This report summarizes a case study of the cement industry in California. The study was conducted to assist the four investor-owned utilities, Pacific Gas and Electric Company (PG&E), San Diego Gas and Electric Company (SDG&E), Southern California Edison Company (SCE), and Southern California Gas Company (SCG), to improve their understanding of industrial customers’ opportunities to save significant amounts of energy. This study was conducted at the request of the California Public Utilities Commission. The study was managed by PG&E. It was funded through the public goods charge (PGC) for energy efficiency and is available for download at www.calmac.org. The cement industry in California consists of 31 sites than consume roughly 1,600 GWh and 22 million therms per year. Eleven of these sites are involved in full-scale cement production, while the remainder of the facilities provides grinding and mixing operations only. The eleven full-operation sites account for over 90% of the California cement industry’s electric use and 80% of the natural gas use. The goals of this case study include the following:
• Develop an understanding of the key processes and associated energy consumption in the cement industry;
• Identify key energy efficiency opportunities and associated technical potential for the cement industry;
• Identify key barriers that preclude cement customers for adopting energy efficient practices and equipment;
• Examine how current PGC-funded programs can better address these customers’ barriers to implementation of more energy efficiency measures.
The primary approach to this case study involved walk-through surveys of customer facilities and in depth interviews with customer decision makers and subsequent analysis of collected data. In addition, a basic review of the cement production process was developed, and summary cement industry energy and economic data were collected, and analyzed. The remainder of this report is organized as follows:
• Section 2 summarizes California cement industry statistics • Section 3 provides an overview of the cement production process • Section 4 presents results of interviews with cement industry customers • Section 5 identifies energy efficiency initiatives in the cement industry

SECTION 1 INTRODUCTION
oa:projects:wpge0070:report:cement:final:1_intro 1–2
• Section 6 summarizes opportunities and barriers to increased energy efficiency in the cement industry; and
• Section 7 discusses possible ways to increase energy efficiency in the cement industry. In addition, Appendix A shows the interview guide used to structure cement industry customer surveys, and Appendix B provides a tabulation of survey results.

2 CEMENT INDUSTRY STATISTICS
2–1
2 CEMENT INDUSTRY STATISTICS The cement manufacturing industry is identified by North American Industry Classification System (NAICS) code 32731 (formerly identified as SIC code 3241). The cement industry “comprises establishments primarily engaged in manufacturing portland, natural, masonry, pozzalanic, and other hydraulic cements. Cement manufacturing establishments may calcine earths or mine, quarry, manufacture, or purchase lime.”1
2.1 ECONOMIC STATISTICS
In California, the cement industry employs approximately 1,990 workers and has an annual value of shipments of about $850 million. Table 2-1 presents economic statistics for the California cement industry, as compared to U.S. cement industry totals.
Table 2-1 Cement Industry Economic Statistics
California U.S. CA share of U.S.
Total establishments 31 279 11%
Establishments with 20 employees or more 15 136 11%
Number of employees 1,927 16,973 11%
Payroll ($1,000’s) 93,795 735,506 13%
Number of production workers 1,461 12,524 12%
Total hours worked (1,000’s) 3,118 27,294 11%
Total wages ($1,000’s) 66,434 498,875 13%
Value added ($1,000’s) 486,760 4,027,714 12%
Cost of materials ($1,000’s) 354,774 2,479,050 14%
Value of shipments ($1,000’s) 846,898 6,540,243 13%
Total capital expenditures ($1,000’s) 66,207 506,015 13%
Source: 1997 Economic Census, http://www.census.gov/epcd/www/econ97.html
2.2 ENERGY USAGE
In California, the cement industry consumes approximately 1,600 GWh per year, 220 MW, and 22 million therms per year. This represents about 5% of California manufacturing electricity consumption and 1% of California manufacturing natural gas consumption. Table 2-2 compares cement industry electricity and natural gas use for California and the U.S.
1 U.S. Census Bureau definition, http://www.census.gov/epcd/naics02/def/NDEF327.HTM#N32731

SECTION 2 CEMENT INDUSTRY STATISTICS
2–2
Table 2-2 Cement Industry Electricity and Natural Gas Consumption
Energy Use Type California U.S. CA share of U.S
GWh per year 1,620 11,900 14%
MW 224 na na Million therms per year 22 260 8%
Source: Utility billing data, CEC forecast database, and 1998 MECS data
Figure 2-1 shows typical end use electricity consumption shares, based on 1998 Manufacturing Energy Consumption Survey (MECS) data. Most of the usage is in the machine drive end use, associated with grinding, crushing, and materials transport. Cement industry natural gas consumption is concentrated in the process heating end use (about 90% of total gas consumption), which involves clinker production in large kilns. In most cases natural gas is used as a supplemental fuel to coal. Only one California plant utilizes gas as a primary kiln fuel. This is a relatively small plant that produces white cement. The remainder of the natural gas usage is associated with boiler and machine drive end uses.
Figure 2-1 Cement Industry End Use Electricity Consumption
Process Machine Drive
81%
Process Heating
10%
Process Othe2%
HVAC3%
Lighting3%
Other1%
Source: 1998 MECS
Of the 31 cement facilities in California, 11 are involved in full cement operation from raw materials. The production at the remainder of the facilities involves grinding and readymix of clinker that is produced in other facilities, either domestically or abroad. The 11 full operation facilities account for the majority of California energy use and these large facilities tend to use

SECTION 2 CEMENT INDUSTRY STATISTICS
2–3
ten to twenty times as much energy as the grinding/readymix facilities. The focus of this case study is on the larger full-scale facilities.
2.2.1 Peak Electricity Demand
Most California cement plants have a “reverse peak” electric load profile (i.e. their demand is lower during the peak hours) because they consciously defer peak load. They try to stockpile certain crushed products when they can so that they can shut down or slow down large process mills or fans during the on peak hours. The kilns operate at full capacity continuously.
2.3 ENERGY INTENSITY
Energy intensity can be examined by combining information on energy usage (Table 2-2) with information on cement industry economic activity (Table 2-1). Electricity use per production worker and per dollar of valued added are presented in Figure 2-2. Data for the overall manufacturing sector are presented for comparison purposes. As the figure illustrates, electric energy intensity in the cement industry is well above the industrial average. Also, the California cement industry is slightly more electricity intensive that the U.S cement average.
Figure 2-2 Electric Energy Intensity Comparison
0.0
0.5
1.0
1.5
2.0
2.5
3.0
3.5
CA Cement US Cement CA Mfg US Mfg
GWh /production workerkWh per $ value added
Sources: Utility Billing Data, CEC Forecast Database, 1997 Economic Census, 1998 MECS
SECTION 2 CEMENT INDUSTRY STATISTICS
2–4
2.4 REFERENCES
California Energy Commission. June 2000. California Energy Demand 2000-2010. Technical Report to California Energy Outlook 2000 Docket #99-CEO-1. Sacramento, CA U.S. Census Bureau. 2000. Economic Census. Available online:
http://www.census.gov/epcd/www/econ97.html U.S. Census Bureau. 2002. NAICS Definitions. Available online:
http://www.census.gov/epcd/naics02/def/NDEF327.HTM#N32731 U.S. Energy Information Administration. 2004. 1998 Manufacturing Consumption Survey.
Available online: http://www.eia.doe.gov/emeu/mecs/contents.html XENERGY Inc. 1998. United States Industrial Motor Systems Market Opportunities Assessment. Burlington, MA: US Department of Energy.

3 CEMENT PRODUCTION PROCESS AND ENERGY USE
3–1
3 CEMENT PRODUCTION PROCESS AND ENERGY USE
3.1 INTRODUCTION
Cement is an inorganic, non-metallic substance with hydraulic binding properties, and is used as a bonding agent in building materials. It is a fine powder, usually gray in color, that consists of a mixture of the hydraulic cement minerals to which one or more forms of calcium sulfate have been added (Greer et al., 1992). Mixed with water it forms a paste, which hardens due to formation of cement mineral hydrates. Cement is the binding agent in concrete, which is a combination of cement, mineral aggregates and water. Concrete is a key building material for a variety of applications. The U.S. cement industry is made up of either portland cement plants that produce clinker and grind it to make finished cement, or clinker-grinding plants that intergrind clinker obtained elsewhere, with various additives. Clinker is produced through a controlled high-temperature burn in a kiln of a measured blend of calcareous rocks (usually limestone) and lesser quantities of siliceous, aluminous, and ferrous materials. The kiln feed blend (also called raw meal or raw mix) is adjusted depending on the chemical composition of the raw materials and the type of cement desired. Portland and masonry cements are the chief types produced in the United States. More than 90% of the cement produced in the U.S. in 1999 was portland cement, while masonry cement accounted for 5.0% of U.S. cement output in 1999 (USGS, 2001). Cement plants are typically constructed in areas with substantial raw materials deposits (e.g. 50 years or longer). There were 117 operating cement plants in the U.S. in 1999, spread across 37 states and in Puerto Rico, owned by 42 companies. Portland cement was produced at 116 plants in 1999, while masonry cement was produced at 83 plants (82 of which also produced portland cement). Clinker was produced at 109 plants (111 including Puerto Rico) in the U.S. in 1999. Production rates per plant vary between 0.5 and 3.1 million metric tons (Mt) per year. Fuel costs are the single largest variable production cost at cement plants. Variable costs are typically about 50% of overall operating costs, so energy is frequently the single largest production cost, besides raw materials. Labor is relatively small at a cement plant.

SECTION 3 CEMENT PRODUCTION PROCESS AND ENERGY USE
3–2
3.2 DESCRIPTION OF THE CEMENT PRODUCTION PROCESS
3.2.1 Mining and Quarrying
The most common raw materials used for cement production are limestone, chalk and clay. The major component of the raw materials, the limestone or chalk, is usually extracted from a quarry adjacent to or very close to the plant. Limestone provides the required calcium oxide and some of the other oxides, while clay, shale and other materials provide most of the silicon, aluminum and iron oxides required for the manufacture of portland cement. In California, the limestone is extracted from open-face quarries. The raw materials are selected, crushed, ground, and proportioned so that the resulting mixture has the desired fineness and chemical composition for delivery to the pyroprocessing systems (see Figure 3-1). It is often necessary to raise the content of silicon oxides or iron oxides by adding quartz sand and iron ore, respectively. The quarried material is reduced in size by processing through a series of crushers. Normally primary size reduction is accomplished by a jaw or gyratory crusher, and followed by secondary size reduction with a roller or hammer mill. The crushed material is screened and stones are returned. More than 1.5 tons of raw materials are required to produce one ton of portland cement (Greer et al., 1992; Alsop and Post, 1995).
Figure 3-1 Simplified Process Schematic for Cement Making
Crusher
Limestone
Grinder
Kiln
Clinker
Raw meal
Additives
Grinder
Cement Limestone is the major process input. Other raw materials such as clay, shale, sand, quartz or iron ore may be added.

SECTION 3 CEMENT PRODUCTION PROCESS AND ENERGY USE
3–3
3.2.2 Raw Material Preparation
After primary and secondary size reduction, the raw materials are further reduced in size by grinding. The grinding differs with the pyroprocessing process used. In dry processing, the materials are ground into a flowable powder in horizontal ball mills or in vertical roller mills. In a ball (or tube) mill, steel-alloy balls (or tubes) are responsible for decreasing the size of the raw material pieces in a rotating cylinder, referred to as a rotary mill. Rollers on a round table fulfill this task of comminution in a roller mill. Utilizing waste heat from the kiln exhaust, clinker cooler hood, or auxiliary heat from a stand-alone air heater before pyroprocessing may further dry the raw materials. The moisture content in the kiln feed of the dry kiln is typically around 0.5% (0 - 0.7%). When raw materials are very humid, as found in some countries and regions, wet processing can be preferable1. In the wet process, raw materials are ground with the addition of water in a ball or tube mill to produce a slurry typically containing 36% water (range of 24-48%). Various degrees of wet processing exist, e.g. semi-wet (moisture content of 17-22%) to reduce the fuels consumption in the kiln.
3.2.3 Clinker Production (Pyro-Processing)
Clinker is produced by pyroprocessing in large kilns. These kiln systems evaporate the inherent water in the raw meal, calcine the carbonate constituents (calcination), and form cement minerals (clinkerization). The main pyroprocessing kiln type used in the U.S. is the rotary kiln. In these rotary kilns a tube with a diameter up to 25 feet is installed at a 3-4 degree angle that rotates 1-3 times per minute. The ground raw material, fed into the top of the kiln, moves down the tube countercurrent to the flow of gases and toward the flame-end of the rotary kiln, where the raw meal is dried, calcined, and enters into the sintering zone. In the sintering (or clinkering) zone, the combustion gas reaches a temperature of 3300–3600 °F. While many different fuels can be used in the kiln, coal has been the primary fuel in the U.S. since the 1970s. In a wet rotary kiln, the raw meal typically contains approximately 36% moisture. These kilns were developed as an upgrade of the original long dry kiln to improve the chemical uniformity in the raw meal. The water (due to the high moisture content of the raw meal) is first evaporated in the kiln in the low temperature zone. The evaporation step makes a long kiln necessary. The length to diameter ratio may be up to 38, with lengths up to 252 yards. The capacity of large units may be up to 4000 short tons of clinker per day. None of the cement plants in California operates a wet process clinker kiln. In a dry rotary kiln, feed material with much lower moisture content (0.5%) is used, thereby reducing the need for evaporation and reducing kiln length. The first development of the dry
1 Originally, the wet process was the preferred process, as it was easier to mix, grind and control the size distribution of the particles in a slurry form. The need for the wet process was reduced by the development of improved grinding processes, and improvement of the energy efficiency of the pyroprocessing systems.

SECTION 3 CEMENT PRODUCTION PROCESS AND ENERGY USE
3–4
process took place in the U.S. and was a long dry kiln without preheating (Cembureau, 1997). Later developments have added multi-stage suspension preheaters (i.e. a cyclone) or shaft preheater. Pre-calciner technology was more recently developed in which a second combustion chamber has been added between the kiln and a conventional pre-heater that allows for further reduction of kiln fuel requirements. Once the clinker is formed in the rotary kiln, it is cooled rapidly to minimize the formation of a glass phase and ensure the maximum yield of alite (tricalcium silicate) formation, an important component for the hardening properties of cement. The main cooling technologies are either the grate cooler or the tube or planetary cooler. In the grate cooler, the clinker is transported over a reciprocating grate through which air flows perpendicular to the flow of clinker. In the planetary cooler (a series of tubes surrounding the discharge end of the rotary kiln), the clinker is cooled in a counter-current air stream. The cooling air is used as secondary combustion air for the kiln.
3.2.4 Finish Grinding
After cooling, the clinker can be stored in the clinker dome, silos, bins, or outside. The material handling equipment used to transport clinker from the clinker coolers to storage and then to the finish mill is similar to that used to transport raw materials (e.g. belt conveyors, deep bucket conveyors, and bucket elevators). To produce powdered cement, the nodules of cement clinker are ground to the consistency of face powder. Grinding of cement clinker, together with additions (3-5% gypsum to control the setting properties of the cement) can be done in ball mills, ball mills in combination with roller presses, roller mills, or roller presses. While vertical roller mills are feasible, they have not found wide acceptance in the U.S. Coarse material is separated in a classifier that is re-circulated and returned to the mill for additional grinding to ensure a uniform surface area of the final product. Traditionally, ball mills are used in finish grinding, while many plants use vertical roller mills. In ball or tube mills, the clinker and gypsum are fed into one end of a horizontal cylinder and partially ground cement exits from the other end. Modern state-of-the-art concepts utilize a high-pressure roller mill and the horizontal roller mill (e.g. Horomill®) (Seebach et al., 1996) that are claimed to use 20-50% less energy than a ball mill. The roller press is a relatively new technology, and is more common in Western Europe than in North America. Various new grinding mill concepts are under development or have been demonstrated (Seebach et al., 1996), e.g. the Horomill® (Buzzi, 1997), Cemax (Folsberg, 1997a), the IHI mill, and the air-swept ring roller mill (Folsberg, 1997b).
3.3 CEMENT PRODUCTION ENERGY USE
Energy use associated with mining and quarrying raw materials for cement production are not typically included in the cement sector, but rather are accounted for in the mining sector. As such, the cement sector energy consumption is comprised of energy used for raw material preparation, clinker production, and finish grinding.

SECTION 3 CEMENT PRODUCTION PROCESS AND ENERGY USE
3–5
Raw material preparation is an electricity-intensive production step requiring generally about 23-32 kWh/short ton (COWIconsult et al., 1993; Jaccard and Willis, 1996), although it could require as little as 10 kWh/short ton. Clinker production is the most energy-intensive stage in cement production, accounting for over 90% of total industry energy use, and virtually all of the fuel use. Fuel use for clinker production in a wet kiln can vary between 4.6 and 6.1 MBtu/short ton clinker (Worrell and Galitsky, 2004). Typical fuel consumption of a dry kiln with 4 or 5-stage preheating can vary between 2.7 and 3.0 MBtu/short ton clinker, electricity use increases slightly due to the increased pressure drop across the system. A six stage preheater kiln can theoretically use as low as 2.5-2.6 MBtu/short ton clinker. The most efficient pre-heater, pre-calciner kilns use approximately 2.5 MBtu/short ton clinker. Alkali or kiln dust (KD) bypass systems may be required in kilns to remove alkalis, sulfates, and/or chlorides. Such systems lead to additional energy losses since sensible heat is removed with the bypass gas and dust. Power consumption for grinding depends on the surface area required for the final product and the additives used. Electricity use for raw meal and finish grinding depends strongly on the hardness of the material (limestone, clinker, pozzolana extenders) and the desired fineness of the cement as well as the amount of additives. Blast furnace slags are harder to grind and hence use more grinding power, between 45 and 64 kWh/short ton for a 3,500 Blaine2 (expressed in cm2/g). Modern ball mills may use between 29 and 34 kWh/short ton (Worrell and Galitsky, 2004) for cements with a Blaine of 3,500.
3.4 TECHNICAL POTENTIAL FOR ENERGY EFFICIENCY
A previous analysis of the technical potential for energy efficiency improvement in the U.S. cement industry found a potential of 180 PJ, or 40%, based on U.S. cement production characteristics in the early 1990s (Martin et al., 1999). This report as well as a later report (Worrell and Galitsky, 2004), evaluated the energy-saving potential of about 30 energy-efficiency technologies and practices that could be applied to both wet and dry process cement production. For this analysis, we compare current energy use (both for electricity and for fuels) for cement production in California in 2002 (van Oss, 2003) to best practice values for these two types of fuel. The best practice value of 109 kWh/short ton of cement for electricity production is based on expert judgment, taking into account the hard limestone found in California, as reported by representatives at Hansen Permanente Cement Company. The best practice value of 2.62 MBtu/short ton of clinker is based on a plant built in Taiwan in the mid-1990s that has an intensity of 2.64 MBtu/short ton (Die Zementindustrie Taiwans, 1994) and a plant built in India that has an intensity of 2.58 MBtu/short ton (Somani and Kothari, 1997).
2 Blaine is a measure of the total surface of the particles in a given quantity of cement, or an indicator of the fineness of cement. It is defined in terms of square centimetres per gram. The higher the Blaine, the more energy required to grind the clinker and additives (Holderbank, 1993).

SECTION 3 CEMENT PRODUCTION PROCESS AND ENERGY USE
3–6
Given these best practice values, we estimate potential electricity savings of about 32 kWh/short ton of cement and potential fuel savings of about 0.7 MBtu/short ton of clinker. Given 2002 production of 11,166,000 short tons of cement and 11,187,000 short tons of clinker in California, the technical potential electricity savings are about 360 GWh and fuel savings are about 7.8 TBtu, with a total technical potential savings for both fuels of about 20% over 2002 levels.
3.5 REFERENCES
Alsop, P.A. and J.W. Post, 1995. The Cement Plant Operations Handbook, (First edition), Tradeship Publications Ltd., Dorking, UK. Buzzi, S. and G. Sassone, 1993. “Optimization of Clinker Cooler Operation,” Proc. VDZ Kongress 1993: "Verfahrenstechnik der Zementherstellung" Bauverlag, Wiesbaden, Germany (pp.296-304). Cembureau, 1997. “Best Available Techniques for the Cement Industry,” Brussels: Cembureau. COWIconsult, March Consulting Group and MAIN, 1993. “Energy Technology in the Cement Industrial Sector”, Report prepared for CEC - DG-XVII, Brussels, April 1992. Die Zementindustrie Taiwans - Rueckblick und Gegenwaertiger Stand, 1994. (The Cement Industry in Taiwan - Historic and Current Situation, 1994) Zement-Kalk-Gips 147 pp.47-50. Folsberg, J., 1997a. "Future Grinding" Asian Cement, January 1997, pp.21-23 (1997). Folsberg, J., 1997b. “The Air-Swept Ring Roller Mill for Clinker Grinding” Proc.1997 IEEE/PCA Cement Industry Technical Conference XXXIX Conference Record, Institute of Electrical and Electronics Engineers: New Jersey. Greer, W. L., Johnson, M. D., Morton, E.L., Raught, E.C., Steuch, H.E. and Trusty Jr., C.B., 1992. “Portland Cement,” in Air Pollution Engineering Manual, Anthony J. Buonicore and Waynte T. Davis (eds.). New York: Van Nostrand Reinhold. Holderbank Consulting, 1993. “Present and Future Energy Use of Energy in the Cement and Concrete Industries in Canada,” CANMET, Ottawa, Ontario, Canada. Jaccard, M.K.& Associates and Willis Energy Services Ltd., 1996. Industrial Energy End-Use Analysis and Conservation Potential in Six Major Industries in Canada. Report prepared for Natural Resources Canada, Ottawa, Canada. Seebach, H.M. von, E. Neumann and L. Lohnherr, 1996. "State-of-the-Art of Energy-Efficient Grinding Systems" ZKG International 2 49 pp.61-67 (1996). Somani, R.A., S.S. Kothari, 1997. “Die Neue Zementlinie bei Rajashree Cement in Malkhed/Indien” ZKG International 8 50 pp.430-436 (1997).
SECTION 3 CEMENT PRODUCTION PROCESS AND ENERGY USE
3–7
United States Geological Survey, 2001. Minerals Yearbook, Washington, D.C., USGS, http://minerals.er.usgs.gov/minerals/. van Oss, H., 2002. Personal Communication. U.S. Geological Survey, March – May 2002. Worrell, E. and C. Galitsky. 2004. Energy Efficiency Improvement Opportunities for Cement Making: An ENERGY STAR Guide for Energy and Plant Managers. Berkeley, CA: Lawrence Berkeley National Laboratory (LBNL-54036).

4 CUSTOMER INTERVIEWS
4–1
4 CUSTOMER INTERVIEWS
4.1 OVERVIEW
This section presents results of in depth interviews with senior representatives from four cement companies representing operations at five California cement plants. The interviews were conducted by a senior KEMA-XENERGY engineer who was generally knowledgeable about cement plant operations. The interview process included a brief technical discussion of each facilities operations, but mainly focused on various aspects of the customers’ decision-making process, especially as it applies to purchases of energy efficiency products and services. The following survey topics are covered in this section:
• General customer information; • Plant energy characteristics; • Energy as It Relates to Overall Business Factors • Energy Management • General Decision-Making Practices • Energy Efficiency Decision Making • O&M Practices • Attitudes Towards Energy Efficiency • Recent Energy Efficiency Project Activity • Energy Efficiency Information and Program Activity
A copy of the interview guidelines is provided in Appendix A and a tabulation of survey responses is provided in Appendix B.
4.2 GENERAL INFORMATION
Table 4-1 summarizes some general information about the customers included in the interview process.
• All facilities are involved in full cement production, from quarry to finished product, although one facility is primarily involved in grinding operations of clicker produced elsewhere.
• In general, the cement facilities are not very labor intensive, employing only 100-200 full-time workers per site.
• All but one of the companies owns multiple cement facilities in California, and all companies own cement plants outside of California (although one company has only one U.S. facility). Only one of the companies (facilities A1 and A2) is U.S.-owned.

SECTION 4 CUSTOMER INTERVIEWS
4–2
• Overall cement plant efficiency is generally correlated with the age of the primary equipment.
Table 4-1 General Customer/Facility Information
Facility A1 A2 B C DLocation Riverside Oro Grande Colton Lucerne Valley TehachapiInterviewee(s) Title Community and Govt.
Affairs Manager,Financial Manager
Community and Govt. Affairs Manager,Financial Manager
Plant Manager,Operations Supervisor
Plant Manager Plant Manager
Product White cement from scratch; grey cement from clinker produced elsewhere
Grey cement Grey cement Grey cement Grey cement
Facility Description - 2 kilns, dating to 1963; clinker capacity of 110 k tons/yr- 4 mills, dating to 1963, with a capacity of 914 k tons/yr
- 7 kilns, newest dates to 1959; clinker capacity of 1,046 k tons/yr- 4 mills, newest dates to 1957, with a capacity of 640 k tons/yr;- 7 waste heat boilers and 2 generators for cogeneration
- 2 kilns, dating to 1962; clinker capacity of 680 k tons/yr- 4 mills, 2 dating to 1962 and 2 dating to 1980, with a capacity of 1,316 k tons/yr;- 30 MW steam plant utilizes waste heat (not fully utilized)
- 1 kiln, dating to 1982, clinker capacity of 1,543 k tons/yr- 4 mills, 3 dating to 1966 or older and 1 dating to 1982, with a capacity of 1,647 k tons/yr
- 1 kiln, dating to 1991, clinker capacity of 907 k tons/yr- 2 mills, dating to 1971 and 1992, with a capacity of 798 k tons/yr
General Plant Less efficient Less efficient Less efficient More efficient More efficientEmployees 100-150 100-150 120 180 150-200Company-Owned Plants in California
2 2 3 1 2
Company-Owned Plants outside
2 2 1 No other US plants 5 other US plants
4.3 ENERGY CHARACTERISTICS
Energy costs are the single largest variable production cost at cement plants, as indicated by all survey interviewees. Variable costs are typically about 50% of overall operating costs in the cement industry, so energy is frequently the single largest production cost. Electricity was estimated to account for over 10% of overall production costs for four of the facilities and over 30% of the production costs for one facility. All customers indicated that they were direct-access electricity purchasers. Natural gas tended to account for only 1% to 5% of overall production costs, as most facilities utilize other primary fuels (coal, tires, other waste fuels) in their kilns.
4.4 ENERGY AS IT RELATES TO OVERALL BUSINESS FACTORS
In the interview, the customers were asked (unaided) to list the factors that were very important to their business. All indicated that energy costs and market conditions were two of the factors that were very important to their businesses. Three of the four interviewees indicated that environmental regulations where also a very important consideration, while one customer cited production management as a very important factor.
SECTION 4 CUSTOMER INTERVIEWS
4–3
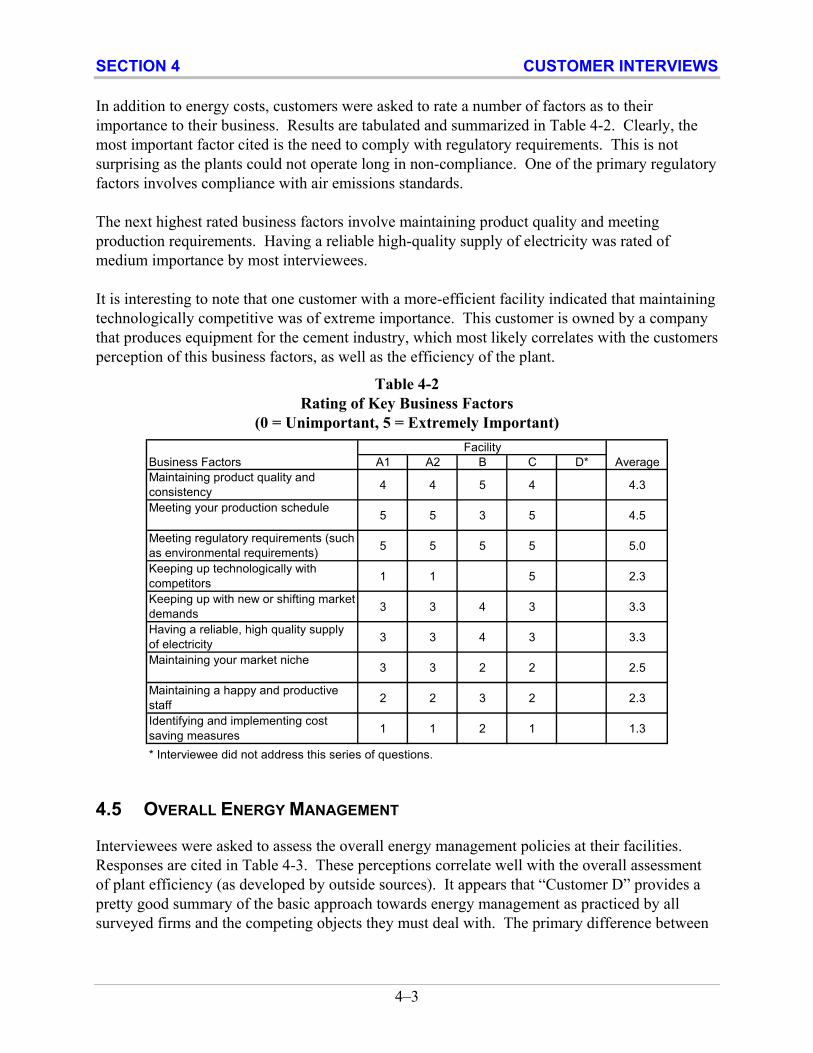
In addition to energy costs, customers were asked to rate a number of factors as to their importance to their business. Results are tabulated and summarized in Table 4-2. Clearly, the most important factor cited is the need to comply with regulatory requirements. This is not surprising as the plants could not operate long in non-compliance. One of the primary regulatory factors involves compliance with air emissions standards. The next highest rated business factors involve maintaining product quality and meeting production requirements. Having a reliable high-quality supply of electricity was rated of medium importance by most interviewees. It is interesting to note that one customer with a more-efficient facility indicated that maintaining technologically competitive was of extreme importance. This customer is owned by a company that produces equipment for the cement industry, which most likely correlates with the customers perception of this business factors, as well as the efficiency of the plant.
Table 4-2 Rating of Key Business Factors
(0 = Unimportant, 5 = Extremely Important)
Business Factors A1 A2 B C D* AverageMaintaining product quality and consistency 4 4 5 4 4.3
Meeting your production schedule 5 5 3 5 4.5
Meeting regulatory requirements (such as environmental requirements) 5 5 5 5 5.0
Keeping up technologically with competitors 1 1 5 2.3
Keeping up with new or shifting market demands 3 3 4 3 3.3
Having a reliable, high quality supply of electricity 3 3 4 3 3.3
Maintaining your market niche 3 3 2 2 2.5
Maintaining a happy and productive staff 2 2 3 2 2.3
Identifying and implementing cost saving measures 1 1 2 1 1.3
* Interviewee did not address this series of questions.
Facility
4.5 OVERALL ENERGY MANAGEMENT
Interviewees were asked to assess the overall energy management policies at their facilities. Responses are cited in Table 4-3. These perceptions correlate well with the overall assessment of plant efficiency (as developed by outside sources). It appears that “Customer D” provides a pretty good summary of the basic approach towards energy management as practiced by all surveyed firms and the competing objects they must deal with. The primary difference between

SECTION 4 CUSTOMER INTERVIEWS
4–4
firms appears to be the degree to which they practice weight the importance of energy management in their operations.
Table 4-3 Overall Energy Management Policy
Customer Response
A “Moderate: Energy costs are certainly a concern but capital is limited and no one really has time to focus on energy and carry forth projects. In addition, at <one site>, the uncertainty about the plant remaining in operation has kept us from doing any upgrades there.”
B “Moderate - High: It is our single largest production cost. Energy use guides all of our process operating practicing practices.”
C “Extremely Aggressive: Energy costs are constantly reviewed vs. production - daily, weekly, monthly and annually. Control decisions are based on power requirements.”
D “Strong: However, maintaining consistent production and product quality is the overriding concern. Although everyone at the plant is aware of energy and it is a key factor on which some operations are based, we have limited operating staff. Fine-tuning for optimizing efficiency, and developing, championing, and managing energy improvements takes staff time that is just not available given each person’s day to day responsibility. We do have “special projects “ engineering staff, but even they are too busy to take on energy projects that aren’t related to maintaining production. Also, the plant must remain in production as much as possible. The interruptions and coordination required for retrofits can also restrict consideration of energy retrofits.”
All interviewees indicated that they, for the most part, had the information they needed to effectively manage energy costs. However, to varying degrees, each customer indicated that they did not necessarily have time to process all the information or act on it. One of the more efficient companies indicated that their parent company has performed periodic process/energy audits to help facilitate increased efficiency. Another respondent indicated that often there are projects where energy impacts can’t be determined precisely enough and the ensuing risk was too high to justify investments. It appears likely that the customer responses are predominantly directed at the most significant energy-sing equipment because measures targeted there can deliver the highest level of savings. It is not as clear that these customers are as aware of smaller-impact measures, such as fine tuning of O&M activities, since these activities deliver relatively small levels of savings. Given the lack of manpower, it appears that the small cost-effective projects will often be overlooked. All customers indicated that they have implemented or would consider implementing a number activities to manage energy costs, including: adjusting production schedules, utilizing industry best practices/training to improve productivity, purchasing equipment to improve productivity, and implementing conservation activities. Most customers mentioned that they would require the appropriate price signals to trigger a shifting of their production processes. Three of the four interviewees indicated that, in the past, they have implemented shifts in production in response to Real Time Rate Programs. None of the customers indicated that they would consider downsizing their production facility to reduce energy costs.

SECTION 4 CUSTOMER INTERVIEWS
4–5
4.6 GENERAL DECISION-MAKING PRACTICES
Interviewees were asked a number of questions about how they made investment decisions and how energy efficiency related decisions were handled as compared to other investment decisions. For the most part, each company’s operations personnel are charged with identifying opportunities and specifying equipment to invest in, and senior management is responsible for approving all investments outside of normal O&M expenditures. Two of the respondents indicated that vendors were sometimes included in the equipment specification process. One company indicated that senior management approval was required for all expenditures over $10,000. The general decision-making process for each firm is summarized in Table 4-4. It is notable that the two more efficient facilities identified funds that are set aside annually for capital improvement, indicating that these firms have institutionalized a process on continually upgrading their facility.
Table 4-4 Usual Decision Making Process for Capital Improvements
Customer Response
A Corporate or plant managers identify technological potential; local corporate staff review and evaluate based on corporate criteria; ultimately goes to corporate for financial approval.
B Initiated and analyzed at plant, goes to corporate for financial approval.
C Plant process managers identify technological potential, cost-benefit is reviewed at the department level and then the plant level. Local corporate staff review and evaluate based on corporate criteria. Ultimately goes to corporate for final financial approval. Capital budget has been fairly fixed at $4 million for the last several years. Sometimes we get funds for special projects that are being pushed at the corporate level.
D Plant manager develops the operating and capital investment for the plant within guidelines provided by corporate management and with input from the various production section managers. Energy saving projects compete with other capital projects. The plant manager asks for project needs from the various division department managers and make the final determination on the budget request. It is usually they who propose energy related projects. Sometimes with guidance from the Plant Manager or Corporate suggestions but usually on their own initiative. The level of capital funding depends on business and macro economic conditions. We usually have $1 million/year for capital improvements. Investments over $10K require corporate approval – although sometimes they are lumped with other projects.
Generally, returns on capital investments need to be pretty high to justify expenditures. The interviewees from the less efficient facilities indicated that their typical targeted payback for investments was 1.0 to 1.5 years. The interviewees from the more efficient plants indicated somewhat high payback thresholds: one cited a maximum of three years, and one indicated that a 1.0-2.0 year payback requirement was typical. Only one customer indicated that energy-efficiency projects might be treated differently from other projects – they stated that production output related project might sometimes be given an advantage over cost-reduction projects.

SECTION 4 CUSTOMER INTERVIEWS
4–6
All customers indicated that their organizations required a detailed technical and financial review before investing in all projects, and the same type of analysis was required for energy and non-energy projects. Critical drivers for investment in new equipment (in addition to cost-effectiveness) included: capital availability, affects on production, market conditions, and innovation. One of the less efficient facilities was clearly facing limited capital availability that greatly limited any capital investments. The installation of innovative equipment was cited by an interviewee of one of the more efficient plants. Addition considerations for installation of new equipment included: lost production time, equipment reliability, environmental issues, safety, and effects on maintenance costs.
4.7 ENERGY EFFICIENCY DECISION MAKING
All interviewees indicated that, for the most part, energy efficiency investments were treated similarly to other investment opportunities. One customer noted that specific-energy is considered in all investment decisions – consistent with the fact that energy is such a large part of operating costs. One customer noted that the availability of incentives might cause them to look more favorably at energy efficiency investments. All companies utilize normal internal capital resources to fund energy efficiency projects. Two of the four companies indicated they had policies in place to specify higher efficiency equipment when making investments. A third company had no formal procedures in place, but expected new equipment to lower or at least be neutral with respect to specific energy. The fourth customer, owner of a less efficient plant, had no energy efficiency purchase policy. Only one of the four companies (at one of the more efficient facilities) indicated they had an employee dedicated to maintaining/improving energy efficiency at the plant. An additional two companies indicated that there were informal “champions” of energy efficiency at their plants. Given the large energy costs for these facilities, it appears that most operations staff have some directive to focus on efficient energy use, but it appears the only one company has put an organizational emphasis on reducing energy costs. When asked about disincentives to reducing energy operating costs, two customers cited large exit charges as a primary factor limiting the cost effectiveness of cogeneration projects that would take advantage of waste heat. One customer listed long project duration as a limiting factor in participating in rebate programs. Also, caps on incentive levels limit their effectiveness in influencing customer decisions, since many of the project involve very large capital outlays.
4.8 O&M PRACTICES
All customers indicated that the primary maintenance at their facilities was to do whatever was necessary to keep equipment running to maximize production. They all indicated that they tried to maintain equipments so as to minimize energy use, since energy was such a large part of their operations. Three of the interviewees indicated that their staff had good to very good knowledge

SECTION 4 CUSTOMER INTERVIEWS
4–7
of energy efficiency practices. One on the less efficient customers indicated their staff had modest knowledge. Customers were asked about their specific policies regarding maintenance policy for various types of equipment. Results are presented in Table 4-5. The proactive category includes limited scheduled preventive maintenance, aggressive scheduled preventive maintenance, and predictive maintenance. Most proactive strategies involved the limited scheduled preventive maintenance, but one customer, at a more efficient plant, indicated they utilized predictive O&M practices for bearing lubrication and for fan/blower wheel balancing.
Table 4-5 Equipment-Specific O&M Practices
Facility
O&M Category A1 A2 B C D Motor lubrication As needed As needed Proactive Proactive Proactive
Bearing lubrication Proactive Proactive Proactive Proactive Proactive
Motor belt replacement As needed As needed As needed As needed As needed
Fan/blower blade cleaning As needed As needed As needed As needed As needed
Fan/blower wheel balancing As needed As needed As needed Proactive As needed
Fan/blower airflow test As needed As needed As needed Proactive As needed
Air compressor intake filters Proactive Proactive Proactive Proactive Proactive
Compressed air water traps & pressure regulators
As needed As needed As needed Proactive As needed
4.9 ATTITUDES TOWARDS ENERGY EFFICIENCY
Three of the four customers indicated that energy efficiency equipment and practices were very important to their operations. One of the three acknowledged that they don’t have enough staff and time to pursue most of their energy efficiency opportunities. The fourth customer indicated that they could do much better with regard to energy efficiency, but felt they were severely limited by capital and other resource constraints. All customers believed that premium efficiency equipment was similar to standard equipment in terms of procurement lead times, installation costs, and ongoing maintenance costs. Thus, they appeared to have no predisposed bias against high efficiency equipment in terms of these dimension of hassle cost. The customers didn’t express strong options regarding how well energy efficiency deliver on expected energy savings. One customer indicated that they usually meet expectations due to this customer’s extensive research prior to energy efficiency investments.

SECTION 4 CUSTOMER INTERVIEWS
4–8
When asked about energy efficiency systems they would like to have, irregardless of cost, the interviewees were all able to provide a pretty good, and overlapping, wish list. Key measures were (number of respondents who cited the measure are listed in parentheses):
• Heat recovery for power generation (4) • More VFDs (4) • Roller mills versus ball mills (3) • Vertical calcining kilns(2) • Fewer pneumatic/more mechanical conveyors (2) • Improved compressed air system (1) • Better classifiers (1) • Better combustion controls for kilns (1) • More use of tires and waste fuels in kilns (1)
The primary factors limiting increased energy efficiency were listed as (with number of respondents in parentheses):
• To busy to research (3) • No money to research (3) • Capital constraints (3) • Too much plant down time (3) • Not worth the trouble for small items (3) • No staff time to manage the projects (2) • Insufficient reliable information on products (1) • Doesn’t meet payback criteria (1) • Hard to sell to management due to savings risk (1) • Waiting to see how measures perform elsewhere (1)
Clearly the key limitations for these customers are time and money. They have limited staff and limited capital, and most believe they are doing the best job they can with resources at hand. They all seem willing to do more to improve their plant’s energy efficiency if they had more resources. The smaller energy efficiency items at these cement plants are likely to amount to fairly large savings, given the overall energy intensity of these facilities. These smaller items don’t seem to get on the radar screen for these customers and are mainly seen as a hassle.
4.10 RECENT ENERGY EFFICIENCY PROJECT ACTIVITY
When asked if they had installed any major capital projects over the past several years: • One customer stated they had installed no projects • One customer installed a computer analyzer for a mixer

SECTION 4 CUSTOMER INTERVIEWS
4–9
• One customer installed classifiers on two mills and a VFD on a fan; • The last customer installed a number of measures in the past 10 years or so, including a
LOSHI vertical raw mill, a precalciner, control upgrades, and high efficiency separators. Energy efficiency considerations were primary motivators in all investments. The interviewees from two most efficient plants also indicated that they were planning to install new energy efficiency equipment in the next year or so: a waste heat cogeneration plant (possibly), a new classifier, improvements to the clinker coolers, and controls. All of the respondents were aware of many of the newer technologies in the industry (as listed at the top of page 4-8). They were all very receptive to the newer technologies, but they all indicated that the associated high capital costs were prohibitive. One customer wasn’t sure that retrofitting with the newer technologies would be cost effective at his plant.
4.11 ENERGY EFFICIENCY INFORMATION AND PROGRAM ACTIVITY
All customers claimed they utilized various sources to maintain awareness of energy efficiency measures, including: trade journals, vendors, utility staff, business associates, trade associations, and trade shows. Trusted sources of energy efficiency information cited by all respondents included the IEEE Tech Committee and the Portland Cement Association (PCA). In addition, one customer cited his corporate staff and one customer cited his local utility. All respondents were aware of the SPC and Express Efficiency Programs, and one respondent indicated he was aware of the availability of energy audits. Two customers were aware of recent compressed air programs. In terms of program participation, one customer had participated in the SPC Program and the Express Efficiency Program and had installed a new classifier and a fan VFD under the programs. Another customer had installed a new air compressor under the SPC Program. These installations came at the two more efficient plants included in the interviews. Finally, three of the four customers indicated that extending program time limits to three or more years would further encourage installation of more energy efficiency equipment. All these customers indicate that the planning and installation schedules in their industry did not line up well with the relatively short program periods associated with Public Goods Funded programs.

5 ENERGY-EFFICIENCY INITIATIVES
5–1
5 ENERGY-EFFICIENCY INITIATIVES This section presents a brief description of the key initiatives currently affecting the cement industry.
5.1 PORTLAND CEMENT ASSOCIATION
The Portland Cement Association (PCA) is the industry association with offices in Skokie (Illinois) and Washington, DC (PCA, 2004). The organization has a double function, as it serves as the representation in Washington, DC, and as a research and dissemination organization and clearinghouse focused on cement and concrete applications. Over 80% of the cement plants in the United States are associated with the PCA. All cement companies in California are PCA members. The PCA annually collects data on energy and labor inputs from all its members, which are published each year. The PCA has no special programs related to energy efficiency improvement in the cement industry. However, PCA serves as the conduit for national programs like ENERGY STAR® and ClimateVISION (see below).
5.2 CEMENT KILN RECYCLING COALITION
The Cement Kiln Recycling Coalition (CKRC) is a trade association with member companies located throughout the United States (CKRC, 2004). Members include cement companies engaged in the use of hazardous waste-derived fuel as well as companies involved in the collection, processing, management, and marketing of such fuel for use in cement kilns. CKRC and its member companies support appropriate regulations related to the use of waste-derived fuels including scrap tires. It collects and disseminates information on the use of wastes as fuel in clinker kilns. The CKRC is based in Washington, DC. Of the California based cement companies, only Texas Industries (TXI) is a member of the CKRC.
5.3 CLIMATE VISION
The federal government (through the U.S. Department of Energy, the U.S. Environmental Protection Agency, the U.S. Department of Transportation, and the U.S. Department of Agriculture) and industry organizations in 12 energy-intensive economic sectors joined in a voluntary partnership called Climate VISION. Climate VISION works with industry to identify and pursue cost-effective solutions to reduce emissions using existing technologies; develop tools to calculate and report emission intensity reductions; speed the commercial adoption of advanced technologies; and develop strategies to reduce emissions intensity in other economic sectors (ClimateVISION, 2004). The Portland Cement Association has committed to a 10% reduction in carbon dioxide emissions per ton of cementious product produced or sold from a 1990 baseline by 2020.

SECTION 5 ENERGY-EFFICIENCY INITIATIVES
5–2
5.4 ENERGY STAR
ENERGY STAR is the primary program of the U.S. Environmental Protection Agency aimed at energy-efficiency improvement. ENERGY STAR for industry (U.S. EPA, 2004a) aims at the development and institutionalization of strategic corporate energy management in companies participating in ENERGY STAR as a member or through the so-called Focus (see below). Currently, nearly 500 companies are ENERGY STAR members. All cement companies based in California are members of ENERGY STAR, except for Hanson in Cupertino. However, all companies and the PCA, including Hanson Permanente Cement participate in the ENERGY STAR Focus. Within the Focus effort, the ENERGY STAR program collaborates with specific industries. The cement industry is one of the Focus industries.1 The Focus efforts include three elements:
• Tailored support for the development of a corporate energy management program, offered through professional energy managers;
• A tool to analyze the performance of a plant compared to the peers in the U.S. based on a simplified “benchmarking” approach.
• An Energy Guide for the focus industry, providing detailed descriptions of energy efficiency measures in the Focus industry. LBNL prepares the Guides. The Guide for the cement industry was published in January 2004 (Worrell and Galitsky, 2004).
Besides the three elements above the ENERGY STAR program also offers regular networking meetings within each Focus industry and an annual energy managers networking meeting and workshop for all ENERGY STAR participants. ENERGY STAR has offered assistance in the development of an energy management program to several of the companies located in California, and has closely collaborated with California Portland Cement, Mitsubishi and RMC Pacific, while all representatives of all companies participate in the Focus networking meetings and tele-conferences.
5.5 CLIMATE LEADERS
Climate Leaders is a voluntary industry-government partnership of the U.S. Environmental Protection Agency that encourages companies to develop long-term comprehensive climate change strategies and set greenhouse gas (GHG) emissions reduction goals (U.S. EPA, 2004b). Members of Climate Leaders set a long-term target for GHG emission reduction for the company. Although currently three cement companies participate in Climate Leaders, none with facilities in California participate.
1 Other Focus industries (early 2004) are: breweries, wet corn milling, vehicle assembly, petroleum refining and pharmaceuticals. Every year new Focus industries are added.

SECTION 5 ENERGY-EFFICIENCY INITIATIVES
5–3
5.6 REFERENCES
Cement Kiln Recycling Coalition, 2004. www.ckrc.org ClimateVISION, 2004. www.climatevision.gov Dutrow, E. and T. Hicks. 2003. “Encouraging Development of Sustainable Energy Management Systems in the Manufacturing Sector.” Proceedings of the 2003 ACEEE Summer Study on Energy Efficiency in Industry. Washington, DC: ACEEE. Portland Cement Association, 2004. www.cement.org U.S. Environmental Protection Agency, 2004a. www.energystar.gov/index.cfm?c=industry.bus_industry U.S. Environmental Protection Agency, 2004b. www.epa.gov/climateleaders Worrell, E. and C. Galitsky. 2004. Energy Efficiency Improvement Opportunities for Cement Making: An ENERGY STAR Guide for Energy and Plant Managers. Berkeley, CA: Lawrence Berkeley National Laboratory (LBNL-54036).


6 OPPORTUNITIES AND BARRIERS
6–1
6 OPPORTUNITIES AND BARRIERS
6.1 ENERGY EFFICIENCY OPPORTUNITIES
Energy efficiency opportunities can fall into at least three primary categories:
• O&M activities to ensure that the installed equipment is running efficiently
• Installation of high efficiency equipment/processes
• Control of the production process to ensure efficient use of inputs Key energy efficiency opportunities, as indicated by customers and identified in literature, are discussed next. In addition these opportunities, a number of customers also indicated that they would be willing to shift production to off-peak periods given the right price signals, such as real time pricing.
6.1.1 O&M
Operations and maintenance practices include elements such as motor and bearing lubrication, motor belt replacement, fan blade cleaning, fan wheel balancing, and compressed air system maintenance including leak minimization and filter replacement. While most customers indicated that they tried to keep equipment in good working order, the primary focus is on keeping equipment operating to maximize production. Energy efficiency considerations are not the primary concern. Preventative maintenance is generally employed at the more efficient facilities but could be improved at other plants (see Table 4-5). Preventative maintenance includes training of plant staff to be attentive to energy consumption and efficiency. Energy savings of up to 2 to 3 percent are possible with the institution of a rigorous preventative maintenance program.
6.1.2 High Efficiency Equipment/Processes
In cement industry, as in other energy intensive process industries, the more generic measures, like high efficiency motors and lighting, are either already done or are so small that their impacts are “below the radar”. Significant energy savings projects typically involve major process and/or equipment modifications that are industry-specific and highly specialized. Often highly specialized expertise is necessary to identify and be able to quantify energy savings of technology improvements. Cement industry customers see their equipment vendors as “business partners” because the vendors tend to have the specialized expertise and experience in their particular area (e.g. crushers/classifiers, kilns, conveyors). Some of the energy efficiency equipment opportunities identified by customers, with a primary focus on electricity savings, include:
SECTION 6 OPPORTUNITIES AND BARRIERS
6–2
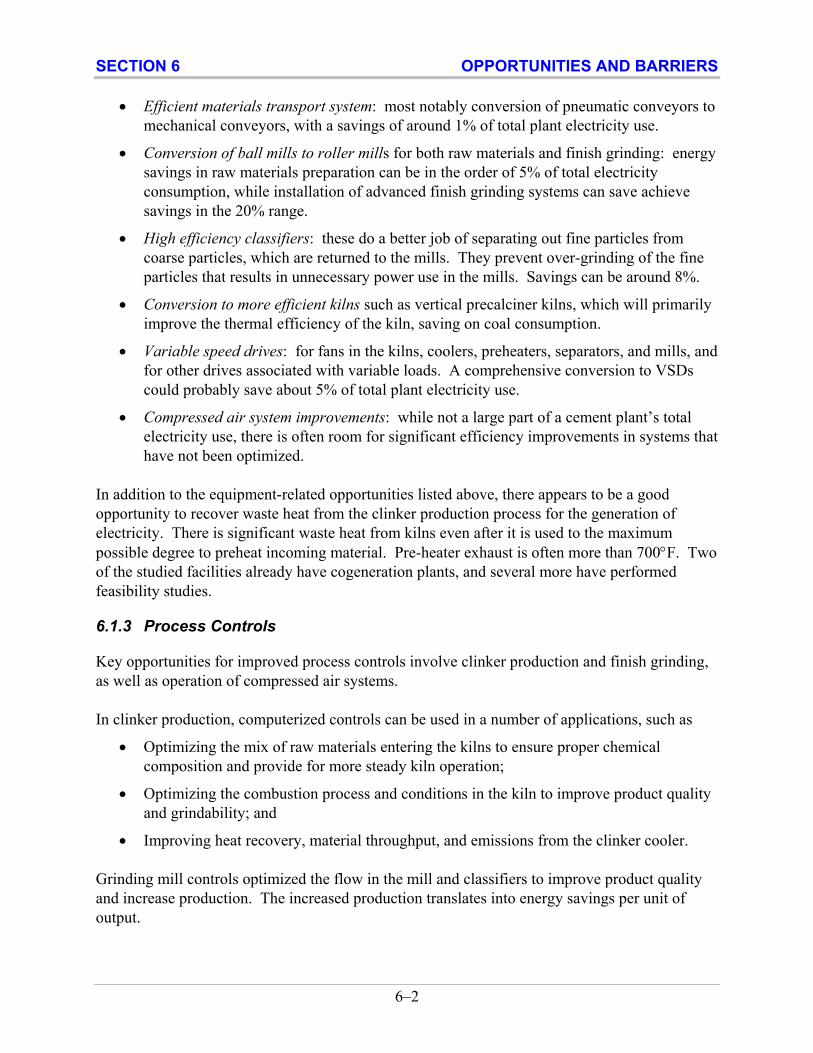
• Efficient materials transport system: most notably conversion of pneumatic conveyors to mechanical conveyors, with a savings of around 1% of total plant electricity use.
• Conversion of ball mills to roller mills for both raw materials and finish grinding: energy savings in raw materials preparation can be in the order of 5% of total electricity consumption, while installation of advanced finish grinding systems can save achieve savings in the 20% range.
• High efficiency classifiers: these do a better job of separating out fine particles from coarse particles, which are returned to the mills. They prevent over-grinding of the fine particles that results in unnecessary power use in the mills. Savings can be around 8%.
• Conversion to more efficient kilns such as vertical precalciner kilns, which will primarily improve the thermal efficiency of the kiln, saving on coal consumption.
• Variable speed drives: for fans in the kilns, coolers, preheaters, separators, and mills, and for other drives associated with variable loads. A comprehensive conversion to VSDs could probably save about 5% of total plant electricity use.
• Compressed air system improvements: while not a large part of a cement plant’s total electricity use, there is often room for significant efficiency improvements in systems that have not been optimized.
In addition to the equipment-related opportunities listed above, there appears to be a good opportunity to recover waste heat from the clinker production process for the generation of electricity. There is significant waste heat from kilns even after it is used to the maximum possible degree to preheat incoming material. Pre-heater exhaust is often more than 700°F. Two of the studied facilities already have cogeneration plants, and several more have performed feasibility studies.
6.1.3 Process Controls
Key opportunities for improved process controls involve clinker production and finish grinding, as well as operation of compressed air systems. In clinker production, computerized controls can be used in a number of applications, such as
• Optimizing the mix of raw materials entering the kilns to ensure proper chemical composition and provide for more steady kiln operation;
• Optimizing the combustion process and conditions in the kiln to improve product quality and grindability; and
• Improving heat recovery, material throughput, and emissions from the clinker cooler. Grinding mill controls optimized the flow in the mill and classifiers to improve product quality and increase production. The increased production translates into energy savings per unit of output.
SECTION 6 OPPORTUNITIES AND BARRIERS
6–3
Overall, savings from advanced control systems are in the 2-5% range for plants that have not already installed such system.
6.2 BARRIERS TO ENERGY EFFICIENCY
A number of barriers to increased energy efficiency were identified in discussions with cement customers and utility representatives who are in close contact with their cement customers. Following are some key barriers identified in the interview process. Limited capital: many of the energy efficiency equipment improvements in the cement industry involve large capital investments, and most customers cited limited capital availability as a key factor limiting increases in energy efficiency. One customer cited a $4 million capital budget, and another cited a $1 million capital budget. Two other customers did not indicate that they had any set budget to work with and had to justify all new capital expenditures on a case by case basis. Many targeted project cost many millions of dollars, so even the customers with assigned capital budgets are severely constrained. Production concerns: for all customers, keeping equipment operation and avoiding production disruptions was of the highest priority. Additionally, cement plants do not like to shut down except for once a year, largely because shut down stresses the ceramic insulation in the kiln. Heat-up and cool down has to be done very carefully or the ceramic insulation will deteriorate. Limited staff time: staffing limitations were another key barrier to increased energy efficiency. While all customers want to stay as efficient as possible, staff’s number one priority is “keeping things running.” Information: while all customers feel they have access to the information they need to make energy efficiency improvements, several customers indicated that they did not have time to focus on this information. Also, it appears that customer knowledge is mostly directed towards the “big ticket” equipment that are the primary energy users, and their understanding of the energy-saving aspects of smaller items such are preventative O&M appears to be lower. Reliability concerns: since maintaining production is such a high priority, cement customers are very concerned about the reliability of all new equipment, including high efficiency equipment. While the customers don’t perceive differences in reliability between energy efficient and standard equipment, any installations of new equipment at the plant will generate some reliability concerns. Hassle: since staff time is limited, smaller energy efficiency projects are not pursued because they “are not worth the trouble.” Facility uncertainty: one customer indicated that they were currently investigating the feasibility of a complete plant overhaul. Uncertainty over the overhaul project has halted any possible efficiency projects.
SECTION 6 OPPORTUNITIES AND BARRIERS
6–4
Cost effectiveness: most customers have severe cost effectiveness criteria. Two customers (with less efficient plants) have payback cutoffs of 1.0 to 1.5 years. Only one customer indicated that they would consider projects with paybacks of up to three years. Exit fees: Customers have not proceeded to install cogeneration equipment that would utilize waste heat because they would be subject to departure charges. Without the departure charges, on-site generation with waste heat would be very close to being economic.
6.2.1 Barriers to Program Participation
While all interviewed customers were aware of the PGC-funded programs, SPC and Express, and two of the customers had participated in the SPC program, there were several barriers to increased program participation cited:
• Short program period: in many cases it takes three to five years for these customers to develop and implement a project, from the planning through construction stages. Programs that have a one or two year time period don’t fit well with their operations.
• Limited incentives: many of the cement plant projects cost tens of millions of dollars. Incentives of a few hundred thousand dollars don’t provide much incentive for these types of projects.
• M&V requirements: past SPC M&V requirements have generally favored one-for-one equipment changeouts where pre and post equipment efficiencies are more readily measurable. Measures that are more “holistic” and affect energy use of a system are harder to justify savings for and thus have had limited acceptance in the Program.
• Program paperwork: SPC participation was limited at the beginning because the application process was time consuming and a burden on customer staff. Utility assistance to some customers with the applications, when necessary, has helped mitigate this barrier.
6.3 REFERENCES
Worrell, E. and C. Galitsky. 2004. Energy Efficiency Improvement Opportunities for Cement Making: An ENERGY STAR Guide for Energy and Plant Managers. Berkeley, CA: Lawrence Berkeley National Laboratory (LBNL-54036).

7 RECOMMENDATIONS
oa:projects:wpge0070:report:cement:7_recs 7–1
7 RECOMMENDATIONS This section provides some recommendations on how to increase energy efficiency in California’s cement industry. These recommendations address the opportunities and barriers summarized in Section 6. It is likely that PGC funds could be used to implement some, but not all of the following recommendations. Increase program time limits for project implementation: if program limits were increased to three years or more, the program participation process would fit better into customers planning and operations schedules. For customers with severe capital constraints, the availability of an incentive may be a driving factor in project approval. However, once an application is accepted, it still may take months for a project to get approval of upper management. Following the approval process, project design and implementation may take years and must fit into scheduled plant down times. Integrate industrial program activities with DOE and other initiatives: as presented in Section 5, there are a number of organizations and initiatives that cement industry customers are involved in or have access to. PGC program funding could be utilized to support energy efficiency aspects of these initiatives directed towards California cement producers. In addition, funding could be used to assist customers who participate in these initiatives. Provide energy manager funding: while most customers indicate that they manage their energy use, and that staff are committed to improving energy efficiency, only one interviewed customer has employed a full time energy management position. It may be possible to use PGC funding to hire industry experts to serve as energy managers at interested facilities. These experts could take the lead on identification, planning, and implementation of energy efficiency projects. This would help alleviate a key barrier to energy efficiency improvements – limited staff time. For example, a cement industry expert could be hired to provide energy efficiency services to several cement facilities over a program year, maybe spending 25% of their time at each of four plants. They could be charged with reviewing existing project plans, conducting or coordinating energy audit activities, and managing energy efficiency projects. Eliminate exit fees for waste heat cogeneration: currently, much of the heat generated in cement kilns is exhausted into the air. Recovery of this energy should be encouraged, but current regulatory practices work against the economics of customer-generation investments by adding an additional economic hurdle, exit fees, to the cost effectiveness calculations. Customers indicated that they are likely to seriously consider investing in waste heat cogeneration if the exit fee hurdle were to be removed.

SECTION 7 RECOMMENDATIONS
oa:projects:wpge0070:report:cement:7_recs 7–2
Increase rebate limits: for cement customers, where energy efficiency projects can cost many millions of dollars, caps on rebate levels limit their effectiveness in influencing customer decisions. The limited incentives primarily influence the smaller projects a customer will undertake, such as the installation of VSDs. While larger projects may also qualify for incentives, it is likely that these projects would proceed anyway. Make incentives conditional on customer installation of very cost-effective measures: customers indicate that the hassle factor may cause them not to pursue some of the smaller energy efficiency projects. If incentives for larger projects were conditional on customers implementing many of the smaller cost-effective projects, like those with paybacks of six months or less, it may be possible to get these smaller projects on the radar screen. Provide audits for cross-cutting technologies: while a high level of expertise is required for understanding and recommending energy efficiency projects particular to the cement industry, audits may be useful in identifying good opportunities for some of the more standard end uses such as lighting, HVAC, compressed air, and pumping. Combined with an energy manager program, these audits could help customers more easily implement some of these smaller projects. (Note, a small project at an energy intensive cement plant may equate to a fairly large project at other businesses.) Provided funding for industry-specific education and training: ongoing training of cement plant staff, with a special focus on energy efficiency, may be useful to maintain customer interest in improving plant efficiency. Such training could focus on the investments and practices that generally provide the best returns for an customer’s efforts. Such training could be coordinated with activities provided in other cement industry initiatives.
A INTERVIEW GUIDE
A–1
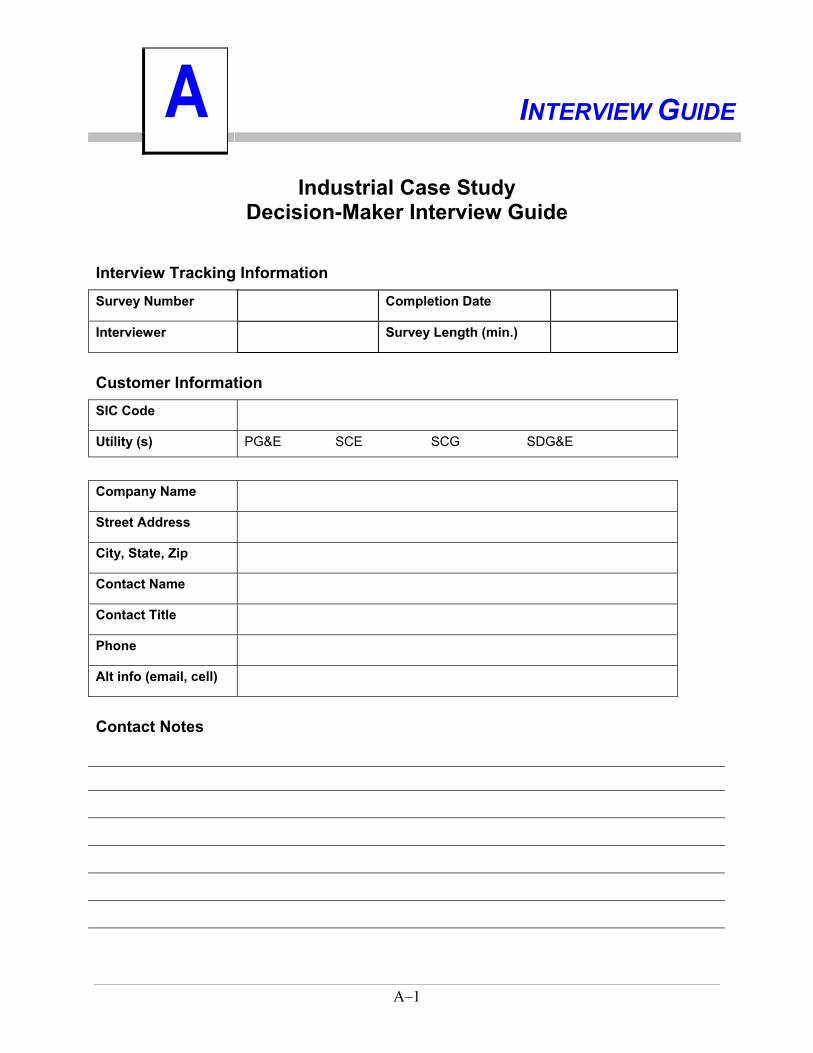
A INTERVIEW GUIDE
Industrial Case Study Decision-Maker Interview Guide
Interview Tracking Information Survey Number Completion Date
Interviewer Survey Length (min.)
Customer Information SIC Code
Utility (s) PG&E SCE SCG SDG&E
Company Name
Street Address
City, State, Zip
Contact Name
Contact Title
Phone
Alt info (email, cell)
Contact Notes

APPENDIX A INTERVIEW GUIDE
A–2
Firmographics
F1. What do you make/do at this facility?
F2. Basic Facility Description (number of buildings, process/offices, etc.)
F3. How many people work at your facility (full time equivalents)? _________ people
Not sure, this is a rough estimate Don’t know
F4. How many other separate facilities do you have in California? Outside California?
______________ in CA ______________ outside CA Not sure, this is a rough estimate Don’t know
Energy Characteristics
E1. How important is energy usage relative to your overall production costs? (gas/electric?) Not important Somewhat Important Very Important
E2. Could you estimate the percent of overall production costs that go to electricity? (If
necessary: 1% or less; >1%-5%, 5%-10%, over 10%) ________ E3. Could you estimate the percent of overall production costs that go to natural gas? (If
necessary: 1% or less; >1%-5%, 5%-10%, over 10%) ________

APPENDIX A INTERVIEW GUIDE
A–3
Important Factors for Business B1. What factor(s) do you consider to be very important to your business? B2. How would you rate the following factors in their importance to your business? (Use a
scale of 0 to 5, where 0 is unimportant and 5 is extremely important.) Maintaining product quality and consistency 0 1 2 3 4 5 Meeting your production schedule 0 1 2 3 4 5 Meeting regulatory requirements (such as environmental reqs) 0 1 2 3 4 5
Keeping up technologically with competitors 0 1 2 3 4 5
Keeping up with new or shifting market demands 0 1 2 3 4 5 Having a reliable, high quality supply of electricity 0 1 2 3 4 5 Maintaining your market niche 0 1 2 3 4 5 Maintaining a happy and productive staff 0 1 2 3 4 5 Identifying and implementing cost saving measures 0 1 2 3 4 5 B3. How would you assess the overall energy management policy at your facility?
(Minimal, moderate, extensive, …)
B4. Do you have the information you need to effectively manage energy costs?
Yes No Notes: ______________________________________________________

APPENDIX A INTERVIEW GUIDE
A–4
B5. Which of the following cost saving measures would you consider/have considered
implementing to reduce/manage energy costs?
Very Unlikely
Would Consider
Have already
Extend or shorten production schedule Shift production schedule Make use of best industry practices/training to improve productivity
Purchase equipment to improve productivity Implement energy conservation Layoffs and other staffing-based considerations Downsize our production facility B5. Would you be more likely to implement any of these with increasing energy costs? If
so which? (If asked, assume a roughly 25% increase). ____________________________________________________________________ ____________________________________________________________________ ____________________________________________________________________ ____________________________________________________________________
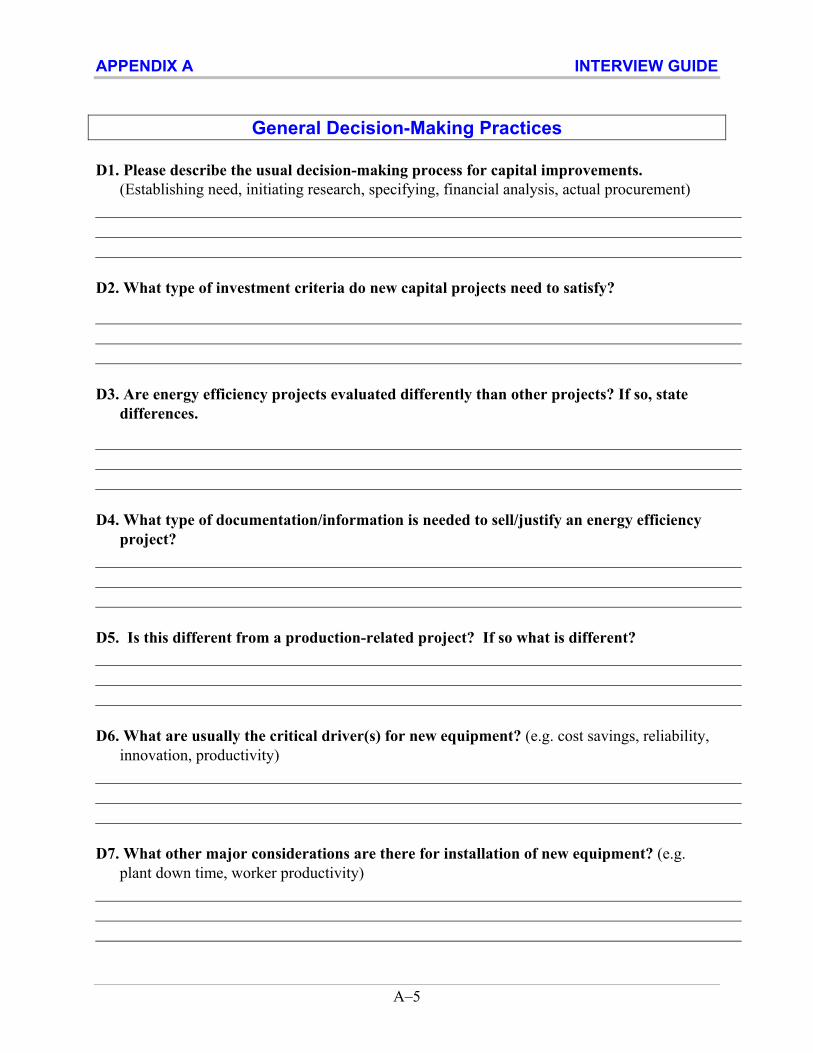
APPENDIX A INTERVIEW GUIDE
A–5
General Decision-Making Practices
D1. Please describe the usual decision-making process for capital improvements.
(Establishing need, initiating research, specifying, financial analysis, actual procurement)
D2. What type of investment criteria do new capital projects need to satisfy?
D3. Are energy efficiency projects evaluated differently than other projects? If so, state
differences.
D4. What type of documentation/information is needed to sell/justify an energy efficiency
project?
D5. Is this different from a production-related project? If so what is different?
D6. What are usually the critical driver(s) for new equipment? (e.g. cost savings, reliability,
innovation, productivity)
D7. What other major considerations are there for installation of new equipment? (e.g.
plant down time, worker productivity)
APPENDIX A INTERVIEW GUIDE
A–6
D8. Who most often specifies attributes of new equipment (efficiency, features)? D9. Who makes the final decision on purchasing?
D6.
Specifies
D7. Final Decision (Lower cost)
D7a. Final Decision (Higher cost)
President Plant engineer Plant electrician Operations manager Maintenance supervisor Facilities manager Purchasing department Other: _________________
D10. Is there a dollar threshold that would involve different decision makers? If so,
indicate dollar threshold, and identify both types of decision makers above. _________________ Notes:
Energy Efficiency Decision-Making E1. How are energy efficiency investments generally viewed at this facility? Are they treated differently than other capital investments?
E2. Are there any special considerations made for energy-efficient equipment or systems?
Yes No

APPENDIX A INTERVIEW GUIDE
A–7
E3. Are there any policies or procedures regarding energy efficiency when investing in new equipment or systems? (e.g. new construction/renovation or process design/retrofit decisions)
Yes No
E4. What is the approach to financing/access to capital for energy efficient equipment?
E5. Any champions of EE at your facility?
Yes No Notes: ______________________________________________________ Contact name and phone number: ________________________________ E6. Is there a full time energy manager? (or is anyone formally responsible for energy management?)
Yes No Notes: ______________________________________________________ Contact name and phone number: ________________________________ E7. What kind of incentives or disincentives are there to reducing energy operating costs? (e.g. Pro: recognition/awards programs, Con: reduced budget due to savings)

APPENDIX A INTERVIEW GUIDE
A–8
O&M Practices
M1. What is the size of your maintenance staff? _______ Full Time Equivalents Not sure, this is a rough estimate Don’t know
M2. Please briefly describe the overall maintenance strategy for this plant? (include any recent major changes)
M3. What type of maintenance policy does your company follow for each of the following types of equipment? Limited Aggressive As Unscheduled Scheduled Scheduled Not Don’t Equipment Needed Preventive Preventive Preventive Predictive Applicable Know
Motor lubrication Bearing lubrication Motor belt replacement Fan/blower blade cleaning Fan/blower wheel balancing Fan/blower airflow test Air compressor intake filters Compressed air water traps & pressure regulators
Other 1 ______________ Other 2 ______________
M4. What, if any, O&M procedures do you do regularly to conserve energy?
M5. How would you characterize the knowledge of the O&M staff regarding energy efficiency, overall?

APPENDIX A INTERVIEW GUIDE
A–9
Attitudes toward EE
A1. What are your thoughts generally on high efficiency equipment and practices to improve energy efficiency? A2. Please tell me how you think premium efficiency equipment compares to standard equipment in each of the following categories:
a. How long it takes to procure them: Notes (e.g. variations by equipment type): Longer Shorter About same Don’t know
b. Cost of installation Higher Lower About same Don’t know
c. Cost of maintenance Higher Lower About same Don’t know
A3. How do energy savings usually compare with original expectations?
Savings10% or more than expected Notes: Savings meet expectations (+/- 10%) Savings 10-20% short of expectations Savings over 20% short of expectations No reliable way to tell energy savings Don’t know what original expectations were
A4. If your facility were as energy efficient as possible, what would it have? (If cost was not a factor, but only using existing/emerging technologies)

APPENDIX A INTERVIEW GUIDE
A–10
A5. What are the primary factors keep you from being as energy efficient as possible?
No applicable measures for facility/processes Waiting to see how new measures perform at other sites Insufficient information (reliable, relevant) Too busy to research / specify No money to research / audit / specify EE measures usually do not meet payback criteria Reducing energy costs not a high priority Capital constraints for optional EE equipment Requires too much plant down time Difficult to sell to management/decisionmaker Only will do if has other benefits (e.g. productivity) Unwilling to risk possible effect on productivity Just not worth the trouble Other (1): Other (2): Other (3): Notes: If clear picture of situation has not already been established ask…. A5. What would need to change for your firm to be more likely to implement cost-effective energy efficiency measures?

APPENDIX A INTERVIEW GUIDE
A–11
Recent Project Activity P1. Have you implemented any major capital projects in the past 2 years? P2. Was energy efficiency considered for any of these projects?
Yes No P3. Have you installed any high efficiency equipment at your facility in the past 24 months? P4. What were the most important reasons that you installed high efficiency equipment or new technologies? <Check all that apply. Do NOT prompt with items from the list.>
Pros Energy cost savings Maintenance or other cost savings Increased system capacity/ productivity Improved reliability / less down time Improved worker environment Other non-energy benefit __________________________________
Cons Long delivery time Increased maintenance or other costs Decreased equipment reliability Capital cost too high Payback too long/savings too low/ Incompatibility with current systems Other EE equipment detriment _______________________________
Other Expertise of maintenance staff Environmental compliance concerns It was included in the systems we bought Corporate policy Other(1): __________________________________ Other(2): __________________________________ Other(3): __________________________________

APPENDIX A INTERVIEW GUIDE
A–12
P4. Do you have any plans to install high efficiency equipment in the next year? P5. Has the energy crisis in California, or the increase in your rates, had any effect on your decision making or practices?
Yes No Notes: Next I would like to ask about new production technologies designed for your industry.
P6. Are you aware of any specific new technologies for your industry? If yes, what?
Yes No Notes:
P7. What are your thoughts on this new technology?
P8. Are you considering (or have you already installed) this new technology(s)?
Yes, have already Yes, have plans to install No (if not, why not?) Notes:

APPENDIX A INTERVIEW GUIDE
A–13
Information on EE I1. How do you usually become aware of new products and product improvements?
Check all that apply. Read about them in trade journals Sales personnel/Vendors Utility staff/programs Business associates/ Industry Associations Trade shows Other ____________________________________________________________
I2. What industry organization(s) do you trust as a source for energy-related information?
I3. Are you aware of any programs or resources provided by your utility in 2002 or 2003 that were designed to promote energy efficiency for facilities like yours?
Yes No
Record program(s), if mentioned: Standard Performance Contract Program Express Efficiency Energy audits Technology demonstrations Other: ______________________________________________________
I4. During the last two years, did this facility participate in any energy efficiency programs offered by your utility or other source? (record all mentions)
Standard Performance Contract Program Express Efficiency Energy audits Technology demonstrations CEC Peak Load Reduction Other: ______________________________________________________
Brief description of project(s):
APPENDIX A INTERVIEW GUIDE
A–14
I5. What could the California energy efficiency programs, implemented by the utilities and other 3rd parties utilizing Publics Goods Funding, do to further encourage you to install more energy efficient equipment? (Prompt about factors such as information, education, and financial incentives.)
Energy Systems Things that will probably be covered in the Technical section of the survey, but address here if necessary. For each key end use address the following: awareness of: measures to implement of effects of energy savings costs savings payback reasons for efficient operations or inefficient operations M1. Do you have any electronic controls on process equipment that (check all that apply):
Unload or turn off equipment to save energy during idle periods? Manage process equipment operation to minimize peak demand? Have other energy management capabilities? Not sure -- (Skip to the Water Re-Use section) None -- (Skip to the Water Re-Use section)
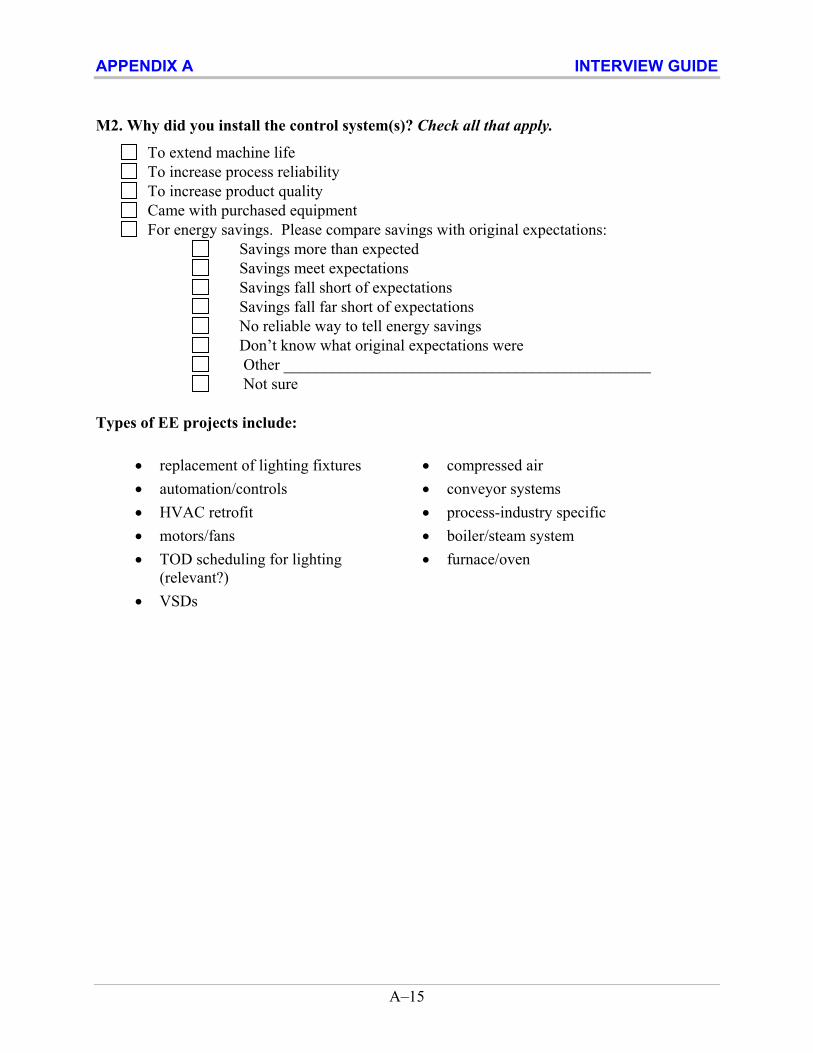
APPENDIX A INTERVIEW GUIDE
A–15
M2. Why did you install the control system(s)? Check all that apply.
To extend machine life To increase process reliability To increase product quality Came with purchased equipment For energy savings. Please compare savings with original expectations: Savings more than expected Savings meet expectations Savings fall short of expectations Savings fall far short of expectations No reliable way to tell energy savings Don’t know what original expectations were Other ______________________________________________ Not sure
Types of EE projects include:
• replacement of lighting fixtures • compressed air • automation/controls • conveyor systems • HVAC retrofit • process-industry specific • motors/fans • boiler/steam system • TOD scheduling for lighting
(relevant?) • furnace/oven
• VSDs


B CUSTOMER SURVEY RESULTS
B–1
B CUSTOMER SURVEY RESULTS

APPENDIX B CUSTOMER SURVEY RESULTS
B–2

APPENDIX B CUSTOMER SURVEY RESULTS
B–3
Facility A1 A2 B C D Location Riverside Oro Grande Colton CA Lucernce Valley; Ontario Tehachapi F1. What do you make/do at this facility? White cement from scratch,
grey cement from clinker produced elsewhere
Cement; old facility, 7 kilns, 14 raw and finish mills
Two types of grey cement Two types of grey cement Grey cement
F2. Basic Facility Description (number of buildings, process/offices, etc.)
Quarry, complete cement production, 10,000-15,000 sf offices/labs
Quarry, complete cement production, 10,000-15,000 sf offices/labs; also 7 waste heat boiler driving 2 generators for 90% of electricity
Quarry, cement production. 6 mills, 2 long dry kilns, 30MW steam power plant - operated at 1.5 to 3 MW using waste heat
Quarry; 1 dry kiln with pre-calciner; 4 finish mills; 2 raw mills; all are ball mills; all with recent he classifiers
This is a nearly 100 year old mill. It is one of two Lehigh Plants in Ca. It has a vertical precalciner combined with a short round kiln.
F3. How many people work at your facility (full time equivalents)? _________ people
100-150 100-150 120 180 150-200
F4. How many other separate facilities do you have in California? Outside California?
1 in CA 1 in CA 2 in CA 0 1 in CA
2 out of CA 2 out of CA 1 out of CA this is only plant in US 5 other US plants (German owner)
E1. How important is energy usage relative to your overall production costs? (gas/electric?)
Very important Very important Very important Very important Very important
E2. Could you estimate the percent of overall production costs that go to electricity? (If necessary: 1% or less; >1%-5%, 5%-10%, over 10%)
over 10% over 10% over 10% over 10% over 30%
E3. Could you estimate the percent of overall production costs that go to natural gas? (If necessary: 1% or less; >1%-5%, 5%-10%, over 10%)
1%-5% 1%-5% 1%-5% 1%-5% low
B1. What factor(s) do you consider to be very important to your business?
Energy Costs, Market Conditions, Environmental Regulations
Energy Costs, Market Conditions, Environmental Regulations
Energy Costs, Market Conditions, Environmental Regulations
Energy Costs, Market Conditions, Environmental Regulations
Energy Costs, running the plant, Production management, Market Issues
B2. How would you rate the following factors in their importance to your business? (Use a scale of 0 to 5, where 0 is unimportant and 5 is extremely important.)
Not asked
Maintaining product quality and consistency 4 4 5 4 Meeting your production schedule 5 5 3 5 Meeting regulatory requirements (such as environmental reqs)
5 5 5 5
Keeping up technologically with competitors 1 1 5 Keeping up with new or shifting market demands 3 3 4 3 Having a reliable, high quality supply of electricity 3 3 4 3

APPENDIX B CUSTOMER SURVEY RESULTS
B–4
Facility A1 A2 B C D Location Riverside Oro Grande Colton CA Lucernce Valley; Ontario Tehachapi Maintaining your market niche 3 3 2 2 Maintaining a happy and productive staff 2 2 3 2 Identifying and implementing cost saving measures
1 1 2 1
B3. How would you assess the overall energy management policy at your facility? (Minimal, moderate, extensive, …)
Moderate – Energy costs are certainly a concern but capital is limited and no one really has time to focus on energy and carry forth projects.
Moderate – Energy costs are certainly a concern but capital is limited and no one really has time to focus on energy and carry forth projects. In addition, at Oro Grande, the uncertainty about the plant remaining in operation has kept us from doing any upgrades there.
Moderate- High It is our single largest production cost. Energy use guides all of our process operating practicing practices.
Extremely aggressive. Energy costs are constantly reviewed vs production . Daily, weekly, monthly and annually. Control decisions are based on power requirements.
Strong – However, maintaining consistent production and product quality is the overriding concern. Although everyone at the plant is aware of energy and it is a key factor on which some operations are based, we have limited operating staff. Fine tuning for optimizing efficiency, and developing, championing, and managing energy improvements takes staff time that is just not available given each person’s day to day responsibility. We do have “special projects “ engineering staff, but even they are too busy to take on energy projects that aren’t related to maintaining production. Also, the plant must remain in production as much as possible. The interruptions and coordination required for retrofits can also restrict consideration of energy retrofits.
B4. Do you have the information you need to effectively manage energy costs?
Yes, For the most part. We keep well informed because energy is such an important cost factor. We are aware of most technological potential but do not have the resources to act on it.
Yes, For the most part. We keep well informed because energy is such an important cost factor. We are aware of most technological potential but do not have the resources to act on it.
For the most part. We keep well informed because energy is such an important cost factor. Have information available but not necessarily time to process and analyze it.
Yes, For the most part. We keep well informed because energy is such an important cost factor. We are aware of most technological potential but do not necessarily have the financial or resources to act on it. Our parent corporation is an
Yes, in general for the most part, we do. We keep well informed about energy saving potential because energy is such an important cost factor. We are aware of most technological potential but

APPENDIX B CUSTOMER SURVEY RESULTS
B–5
Facility A1 A2 B C D Location Riverside Oro Grande Colton CA Lucernce Valley; Ontario Tehachapi
equipment and process manufacturer so we have internal access to the newest technologies. The parent corporation has performed period process/energy audits of the plant. The most recent was two years ago.
do not always have the resources to act on it. That being said, we do often have projects where the precise energy savings cannot be predicted precisely or guaranteed by a vendor. So some projects are not followed up on due to the performance risk involved.
B5. Which of the following cost saving measures would you consider/have considered implementing to reduce/manage energy costs?
Extend or shorten production schedule. Unlikely Unlikely Have already - with price signal (real time pricing)
Unlikely Would consider
Shift production schedule If there is a price signal. We used to do this when we were on real time rates, but no more.
If there is a price signal. We used to do this when we were on real time rates, but no more.
Have already - with price signal (real time pricing)
Have/would - with price signal; did with rtp
Would consider
Make use of best industry practices/training to improve productivity
Would consider Would consider Have already Have/would consider Would consider
Purchase equipment to improve productivity Would consider Would consider Have already Have/would consider Would consider Implement energy conservation Would consider Would consider Have already Have/would consider Would consider Layoffs and other staffing-based considerations Would consider / have
already Would consider / have already
Have already Have/would consider Unlikely
Downsize our production facility Unlikely Unlikely Unlikely Unlikely Unlikely B6. Would you be more likely to implement any of these with increasing energy costs? If so which? (If asked, assume a roughly 25% increase).
Change schedule / shift production - if price signal is right
Change schedule / shift production - if price signal is right
Change schedule / shift production - if price signal is right
We will consider any option if it makes business sense.
D1. Please describe the usual decision-making process for capital improvements. (Establishing need, initiating research, specifying, financial analysis, actual procurement)
Corporate or plant managers identify technological potential; local corporate staff review and evaluate based on corporate criteria; ultimately goes to corporate for financial approval.
Corporate or plant managers identify technological potential; local corporate staff review and evaluate based on corporate criteria; ultimately goes to corporate for financial approval.
Initiated and analyzed at plant, goes to corporate for financial approval.
Plant process managers identify technological potential, cost benefit is reviewed at the department level and then the plant level. Local corporate staff review and evaluate based on corporate criteria. Ultimately goes to corporate for final financial approval. Capital budget has been fairly fixed at $4 million for the last several
Plant manager develops the operating and capital investment for the plant within guidelines provided by corporate management and with input from the various production section managers. Energy saving projects compete with other capital projects. The plant manager asks for

APPENDIX B CUSTOMER SURVEY RESULTS
B–6
Facility A1 A2 B C D Location Riverside Oro Grande Colton CA Lucernce Valley; Ontario Tehachapi
years. Sometimes we get funds for special projects that are being pushed at the corporate level.
project needs from the various division department managers and make the final determination on the budget request. It is usually they who propose energy related projects. Sometimes with guidance from the Plant Manager or Corporate suggestions but usually on their own initiative. The level of capital funding depends on business and macro economic conditions. We usually have $1 million/year for capital improvements. Investments over $10K require corporate approval – although sometimes they are lumped with other projects.
D2. What type of investment criteria do new capital projects need to satisfy?
1.0-1.5 year payback 1.0-1.5 year payback 1.0-1.5 year payback 3 years max. with limit of capital available – typically $4 million/year.
They need to be justified for overall economic efficiency – and level of production , etc. Energy projects typically have to payback within a year or two
D3. Are energy efficiency projects evaluated differently than other projects? If so, state differences.
No No Somewhat – Production output and specific energy is a key factor.
Not really. The driving factor for all recent projects has been energy costs.
Not really. Energy projects are evaluated on an overall financial sense just like any others.
D4. What type of documentation/information is needed to sell/justify an energy efficiency project?
Detailed technical and financial review
Detailed technical and financial review
A detailed technical and financial review.
A detailed technical and financial review.
A paper study either done in house or done by a vendor and reqiewed in house with the justification and financial analysis.
D5. Is this different from a production-related project? If so what is different?
No No No No Not really – except there is a Revenue stream that is generated. Many other projects are either intended to improve production or reduce

APPENDIX B CUSTOMER SURVEY RESULTS
B–7
Facility A1 A2 B C D Location Riverside Oro Grande Colton CA Lucernce Valley; Ontario Tehachapi
maintenance costs. D6. What are usually the critical driver(s) for new equipment? (e.g. cost savings, reliability, innovation, productivity)
Capital availability Capital availability Production and specific energy use, capital availability, market projections.
Energy costs, reliability, overall production costs, capital availability.
cost savings, reliability, innovation, productivity
D7. What other major considerations are there for installation of new equipment? (e.g. plant down time, worker productivity)
Lost production time, reliability risk, safety, environmental issues (NOX)
Lost production time, reliability risk, safety, environmental issues (NOX)
Lost production time, reliability risk, safety, environmental issues (NOX)
Production (continuity), environmental issues (NOX)
Plant down time is important. We never like to shut down. Reliability and maintenance costs are also a concern.
D8. Who most often specifies attributes of new equipment (efficiency, features)?
Plant Staff & Operating personnel & Corporate engineers
Plant Staff & Operating personnel & Corporate engineers
Staff and operating engineers Plant staff & operating personnel & plant process managers and engineering staff. Sometimes with assistance of the vendors
The section manager sets the performance requirement. Vendors often provide the final specification and selection and detailed installation requirements.
D9. Who makes the final decision on purchasing? Plant engineer / operations manager specified - Sr. management decides - both low and high cost purchases
Plant engineer / operations manager specified - Sr. management decides - both low and high cost purchases
Plant engineer / operations manager specified - Sr. management decides - both low and high cost purchases
Process managers ops manager, maintenance supervisor specify (also process engineer and ee manager both new); Sr. management makes final decisions
Plant engineer and operations manager specify; and approve low cost; upper management approve higher cost
D10. Is there a dollar threshold that would involve different decision makers? If so, indicate dollar threshold, and identify both types of decision makers above.
Any measure outside of normal O&M budget goes for corporate review
Any measure outside of normal O&M budget goes for corporate review
Any measure outside of normal O&M budget goes for corporate review
Any capital measure or measure outside of normal O&M practices maintenance budget goes for local management review.
Yes – Greater than 10k capital requirements outside the budget technically requires corporate approval.
E1. How are energy efficiency investments generally viewed at this facility? Are they treated differently than other capital investments?
Treated same as all investments
Treated same as all investments
No not really. Production projects are viewed more favorably.
No Not really, their costs and benefits are evaluated much like other projects. Corporate requires a minimum 18% IRR after taxes for app projects other than those necessary to keep the plant running. They have a 3 year capital planning program. Projects compete amongst all US plants.
E2. Are there any special considerations made for energy-efficient equipment or systems?
No No Efficiency and specific energy is always considered in all manufacturing decisions.
No Yes – if incentives are available we may take a look.

APPENDIX B CUSTOMER SURVEY RESULTS
B–8
Facility A1 A2 B C D Location Riverside Oro Grande Colton CA Lucernce Valley; Ontario Tehachapi E3. Are there any policies or procedures regarding energy efficiency when investing in new equipment or systems? (e.g. new construction/renovation or process design/retrofit decisions)
No No High efficiency motors, etc. are specified.
Yes. Energy is a consideration in all decisions already. HE motors and equipment is routinely specified for new equipment and replacement eqpt. A new position will be charged with reviewing existing systems and identifying whether there is a rationale for changing out existing equipment sucha as motors, fans, etc.
Nothing formal, but it is understood that improvements are expected to lower or at least be neutral with respect to specific energy.
E4. What is the approach to financing/access to capital for energy efficient equipment?
Internal capital resources are used
Internal capital resources are used
Internal capital resources are used
Internal capital resources are used. Funds are made available through standard corporate cash flow techniques, bonds, etc.
Internal corporate capital resources are used. This may include corporate bonds if the climate is right.
E5. Any champions of EE at your facility? No. Managers are concerned with production; staff is not "tuned in"
No. Managers are concerned with production; staff is not "tuned in"
Plant manager, Operations Supervisor
No. All line Managers are concerned with production. Two new positions, a process engineer and an operating engineer are charged with maintaining and improving energy use
Yes – I am, and all operating staff are. but there is no official energy manager and frequently staff to champion a particular project is limited.
E6. Is there a full time energy manager? (or is anyone formally responsible for energy management?)
No. financial officer takes on the role but is not involved in technical practices
No. financial officer takes on the role but is not involved in technical practices
No. Part of Plant Manager and ops supervisor responsibilities
Yes: Not an energy manager per-se, but there is a person – a process engineer to which energy use is a top priority and specific job function.
No
E7. What kind of incentives or disincentives are there to reducing energy operating costs? (e.g. Pro: recognition/awards programs, Con: reduced budget due to savings)
Capital is very limited. Most measures will require capital
Capital is very limited. Most measures will require capital
Very few – it is a significant part of our production costs. One significant disincentive is the departure charges that are levied for new generation capacity – even waste generation capacity.
Capital is very limited. Most major measures require capital. We are focused on production. Also, with regard to a potential cogen project, the current PUC rules allow lost revenue recovery which effectively makes a potential cogen project not financially attractive. Also mentioned was the duration of projects (long term planning is needed for major projects) , and limitations on rebates to one customer. Rebates

APPENDIX B CUSTOMER SURVEY RESULTS
B–9
Facility A1 A2 B C D Location Riverside Oro Grande Colton CA Lucernce Valley; Ontario Tehachapi
are usually play only a small part in a major capital project.
M1. What is the size of your maintenance staff? DK DK NA Operations and maintenance
are tied together. about 20 FTE
M2. Please briefly describe the overall maintenance strategy for this plant? (include any recent major changes)
Do whatever is necessary to keep equipment operating so there is no lost production
Do whatever is necessary to keep equipment operating so there is no lost production
Do whatever is necessary to keep equipment operating so there are no bottlenecks and lost production
Do whatever is necessary to keep equipment operating so there is no lost production
Make as much cement as possible as efficiently as possible.
M3. What type of maintenance policy does your company follow for each of the following types of equipment?
Motor lubrication As needed As needed Limited scheduled preventitive Aggressive scheduled
preventative
Bearing lubrication Limited scheduled preventitive
Limited scheduled preventitive
Limited scheduled preventitive Predictive Limited scheduled preventative
Motor belt replacement As needed As needed As needed As needed As needed Fan/blower blade cleaning As needed As needed As needed As needed As needed Fan/blower wheel balancing As needed As needed As needed Predictive As needed Fan/blower airflow test As needed As needed As needed Limted Scheduled Preventitive As needed
Air compressor intake filters Limited scheduled preventitive
Limited scheduled preventitive
Limited scheduled preventitive Limted Scheduled Preventitive Limited scheduled preventative
Compressed air water traps & pressure regulators As needed As needed As needed Limted Scheduled Preventitive As needed
“We had an air compressor survey done by a consultant in a recent year. But we haven’t done much to implement it.” (NOTE –a 2001 LBL publication says that they installed 2 new compressors and other equipment and saved 900,000 kWh or $90,000.)
M4. What, if any, O&M procedures do you do regularly to conserve energy?
Within the limits of the controls and equipment, we try to minimize energy use.
Within the limits of the controls and equipment, we try to minimize energy use.
Everything possible. All operations are based on energy use.
Within the limits of the controls and equipment, we try to minimize energy use. WE had a survey done about 3 years ago where we turned off all unnecessary equipment down to lights, AC, pumps, etc.
Lubrication, cleaning (Cleaning is a major issue with all the dust here….), change belts, other manufacturer’s recommended activities.

APPENDIX B CUSTOMER SURVEY RESULTS
B–10
Facility A1 A2 B C D Location Riverside Oro Grande Colton CA Lucernce Valley; Ontario Tehachapi
Savings were about 5-6% M5. How would you characterize the knowledge of the O&M staff regarding energy efficiency, overall?
Moderate Moderate Very High Excellent Generally good but most have other priorities.
A1. What are your thoughts generally on high efficiency equipment and practices to improve energy efficiency?
We know that we can do much better but we are very capital and resource limited.
We know that we can do much better but we are very capital and resource limited.
We are very motivated We support and encourage all energy saving within our capital and time constraints.
They are very important to us. We encourage them but we don’t have enough staff to pursue most of them.
A2. Please tell me how you think premium efficiency equipment compares to standard equipment in each of the following categories:
Similar with regard to procurement, cost, and maintenance
Similar with regard to procurement, cost, and maintenance
Similar with regard to procurement, cost, and maintenance
Similar with regard to procurement, cost, and maintenance
A3. How do energy savings usually compare with original expectations?
Variable Variable Savings meet expectations. WE do a fairly thorough review so we’re fairly confident before the project takes place. We have a good energy information database.
Savings are often suspected to be short of expectations or impossible to calculate.
A4. If your facility were as energy efficient as possible, what would it have? (If cost was not a factor, but only using existing/emerging technologies)
Roller Mills vs ball mills Roller Mills vs ball mills Roller Mills vs ball mills Roller Mills vs ball mills
Better air/combustion controls in kilns
Better air/combustion controls in kilns
Optimized heat recovery/power generation
Optimized heat recovery/power generation
Optimized heat recovery/power generation
Heat recovery power generation Heat recovery for cogen from the clinker cooler.
More VFDs where appropriate
More VFDs where appropriate
More VFDs where appropriate More VFDs where appropriate VFDs on most fans.
A vertical calcining kiln A vertical calcining kiln A vertical calcining furnace Improved compresswed air
system
Fewer Pneumatic conveyors Better classifiers Mechanical conveyors in some
areas
More use of tires and waste fuels.
A5. What are the primary factors keep you from being as energy efficient as possible?
Too busy to research Too busy to research
Waiting to see how new

APPENDIX B CUSTOMER SURVEY RESULTS
B–11
Facility A1 A2 B C D Location Riverside Oro Grande Colton CA Lucernce Valley; Ontario Tehachapi
measures perform at other sites
Insufficient information (reliable, relevant)
Too busy to research / specify
No money to research No money to research No money to research No money to research EE doesn't meet payback
criteria
Capital constraints Capital constraints Capital constraints Capital constraints Too much plant down time Too much plant down time Too much plant down time Too much plant down time Hard to sell to mgmt - savings
risk
Not worth trouble for small items
Not worth trouble for small items
Not worth trouble for small items
Not worth trouble for small items
No staff time to manage project No staff time to assess/manage project
A5. What would need to change for your firm to be more likely to implement cost-effective energy efficiency measures?
More staff time; more capital More staff time; more capital More staff time Change of regulation and incentive constraints (waste heat generation process); more available capital
More staff time; more available capital
P1. Have you implemented any major capital projects in the past 2 years?
No No Yes - computer analyzer for mix Yes – classifiers on #2 finish mill and raw mill, VFD on ??? fan;
YES a LOSHI vertical raw Mill
Precalciner was installed in 1991
Control Upgrade HE Separators – 1992,
1997 P2. Was energy efficiency considered for any of these projects?
NA NA Yes Yes – it was the primary motivation for all of those projects.
Yes – all of them, especially Controls
P3. Have you installed any high efficiency equipment at your facility in the past 24 months?
No No Yes - see P1 Yes – Classifiers/VFDs improved controls.
Yes LOSHI Mill
P4. What were the most important reasons that you installed high efficiency equipment or new technologies? <Check all that apply. Do NOT prompt with items from the list.>
Energy cost savings; increase capacity/productivity; improved reliability; imporved quality control
Energy cost savings Energy cost savings; maintenacne cost savings; increase productivity; increased reliability;
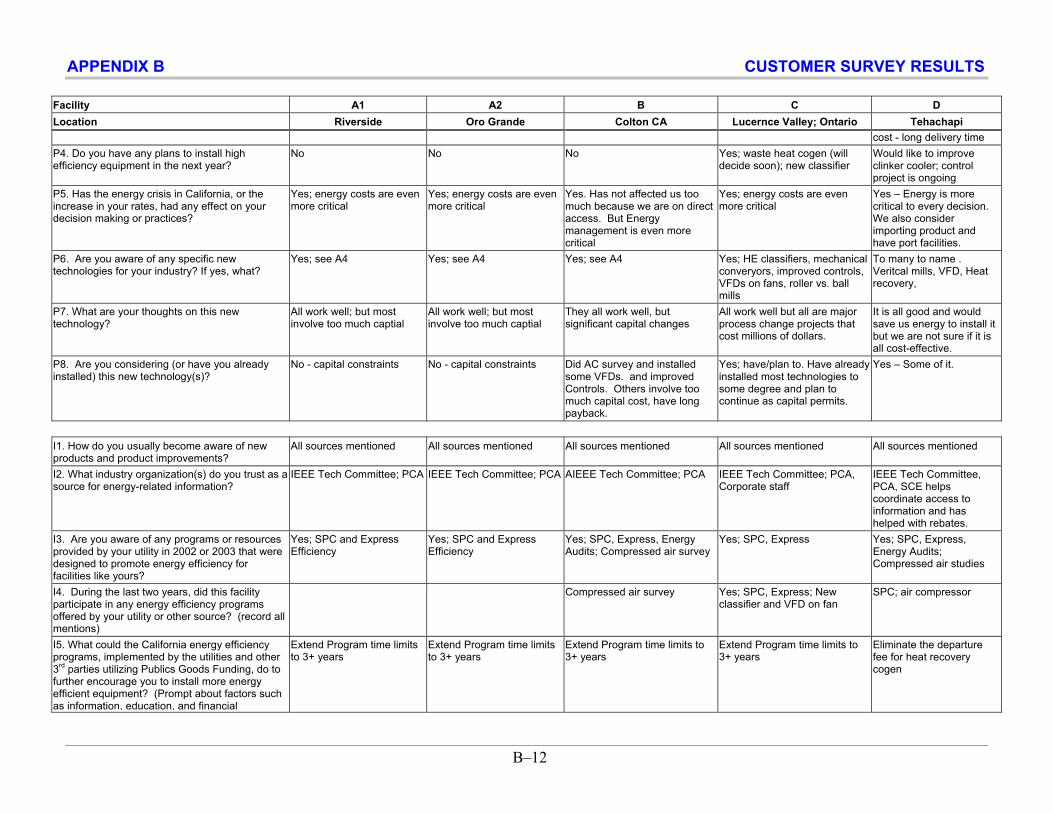
APPENDIX B CUSTOMER SURVEY RESULTS
B–12
Facility A1 A2 B C D Location Riverside Oro Grande Colton CA Lucernce Valley; Ontario Tehachapi
cost - long delivery time P4. Do you have any plans to install high efficiency equipment in the next year?
No No No Yes; waste heat cogen (will decide soon); new classifier
Would like to improve clinker cooler; control project is ongoing
P5. Has the energy crisis in California, or the increase in your rates, had any effect on your decision making or practices?
Yes; energy costs are even more critical
Yes; energy costs are even more critical
Yes. Has not affected us too much because we are on direct access. But Energy management is even more critical
Yes; energy costs are even more critical
Yes – Energy is more critical to every decision. We also consider importing product and have port facilities.
P6. Are you aware of any specific new technologies for your industry? If yes, what?
Yes; see A4 Yes; see A4 Yes; see A4 Yes; HE classifiers, mechanical converyors, improved controls, VFDs on fans, roller vs. ball mills
To many to name . Veritcal mills, VFD, Heat recovery,
P7. What are your thoughts on this new technology?
All work well; but most involve too much captial
All work well; but most involve too much captial
They all work well, but significant capital changes
All work well but all are major process change projects that cost millions of dollars.
It is all good and would save us energy to install it but we are not sure if it is all cost-effective.
P8. Are you considering (or have you already installed) this new technology(s)?
No - capital constraints No - capital constraints Did AC survey and installed some VFDs. and improved Controls. Others involve too much capital cost, have long payback.
Yes; have/plan to. Have already installed most technologies to some degree and plan to continue as capital permits.
Yes – Some of it.
I1. How do you usually become aware of new products and product improvements?
All sources mentioned All sources mentioned All sources mentioned All sources mentioned All sources mentioned
I2. What industry organization(s) do you trust as a source for energy-related information?
IEEE Tech Committee; PCA IEEE Tech Committee; PCA AIEEE Tech Committee; PCA IEEE Tech Committee; PCA, Corporate staff
IEEE Tech Committee, PCA, SCE helps coordinate access to information and has helped with rebates.
I3. Are you aware of any programs or resources provided by your utility in 2002 or 2003 that were designed to promote energy efficiency for facilities like yours?
Yes; SPC and Express Efficiency
Yes; SPC and Express Efficiency
Yes; SPC, Express, Energy Audits; Compressed air survey
Yes; SPC, Express Yes; SPC, Express, Energy Audits; Compressed air studies
I4. During the last two years, did this facility participate in any energy efficiency programs offered by your utility or other source? (record all mentions)
Compressed air survey Yes; SPC, Express; New classifier and VFD on fan
SPC; air compressor
I5. What could the California energy efficiency programs, implemented by the utilities and other 3rd parties utilizing Publics Goods Funding, do to further encourage you to install more energy efficient equipment? (Prompt about factors such as information, education, and financial
Extend Program time limits to 3+ years
Extend Program time limits to 3+ years
Extend Program time limits to 3+ years
Extend Program time limits to 3+ years
Eliminate the departure fee for heat recovery cogen

APPENDIX B CUSTOMER SURVEY RESULTS
B–13
Facility A1 A2 B C D Location Riverside Oro Grande Colton CA Lucernce Valley; Ontario Tehachapi incentives.) Increase max funds Increase max funds Increase max funds Increase max funds Allow more “wholistic “
projects that don’t require a before and after efficiency calculation.
Remove restrictions to on site generation.
Extend waste heat generation incentive to more than 1 MW
Allow more long term projects
Remove departure fee disincentive for waste heat generation.
Increase capital
M1. Do you have any electronic controls on process equipment that (check all that apply):
Yes; not sure specifics Yes; not sure specifics Yes; they have other energy management capabilities
Yes; Unload or turn off equipment to save energy during idle periods; Have other energy management capabilities
M2. Why did you install the control system(s)? Check all that apply.
Increase process reliability Increase process reliability To increase reliability; to increase quality; fore energy savings - to allow energy-based control
To increase product quality; for energy savings
Increase product quality Increase product quality Energy savings Energy savings