Embed Size (px)
Citation preview
309
INDUSTRIAL CASE STUDY OF INNOVATIVE MANAGERIAL CONTROL SYSTEM APPLIED TO SITE CONTROL PROCESS (IMCS-CON)
Anfas Thowfeek, Nashwan Dawood, Ramesh Marasini, John Dean CCIR, University of Teesside, Middlebsrough, UK
ABSTRACT: Construction projects are complex, fragmented and highly risk business, due to the nature of construction operations. Therefore project managers require more efficient techniques and tools to plan and monitor the construc-tion project. In recent years many research studies have been carried out in order to make construction industry more efficient, profitable and attractive business. The IMCS-CON developed as decision support system for project mangers to assist project-controlling processes using a holistic approach. The IMCS-CON provide a framework to measure, analyse, review, and report performance data and enabling project management team to make corrective decision and keep project on track. The IMCS-CON system was evaluated using a case study of £2.3 million, three-story residential apartment building project in UK. The IMCS-CON system utilises multivariate statistical process control techniques to monitor the construction site variables. The MSPC combines a large number of variables into few independent vari-ables, which then can be monitored and any process deviations from the normal operating conditions can be identified with corrective actions suggested. The IMCS-CON models on-site information as quantitative variables and uses his-torical data and establishes patterns of correlated variables and assists project management in making future decisions. The outputs can also be visualised in multi-dimensional graphs. Statistics of external variables and internal variables influencing construction site operations were identified using a real life case study. The results of modelling the vari-ables and conducting experiments with IMCS-CON are analysed and discussed in this paper. KEYWORDS: performance measurement, construction process variables, statistical process control, construction proc-ess benchmarking, construction process improvement, construction productivity. 1 INTRODUCTION
In complex and fast track construction projects, project analysis is very complicated. It is understood that the de-velopment of dynamic tools to monitor and control on-site construction performance by implementing modern construction management theories and techniques are appreciated, which enable to practice modern research techniques and theories into current practice. The auto-mating control of on-site construction performance en-ables management to take corrective measures in real-time. As there are large numbers of variables that influ-ence a performance on construction sites, it is very essen-tial to take a holistic approach to study the variability and impact of the variable on the process. In today’s competi-tive market, the success of construction projects depends largely on project managers’ capabilities to make correc-tive decisions during construction planning and control stages [16]. The IMCS-CON developed to monitor and control key construction processes variables on site. The system will be able to analyse historical and current in-formation and visualise the result in multidimensional graphs, establish patterns and report to project managers on weekly basis. Therefore project managers able make effective decisions and corrective action to keep project on track using advance statistical tools integrated with information visualisation techniques. The results of mod-
elling the variables and conducting experiments with IMCS-CON are analysed and discussed in this paper. 2 IMCS-CON FRAMEWORK
The aim of IMCS-CON is to develop a decision support system that can be utilised by project managers to control construction processes using a holistic approach. The IMCS-CON provides a framework to measure, analyse, review, and report construction site information and ena-bling project management team to make corrective deci-sion and keep project on track. The IMCS-CON has three main components, which includes 1) Electronic site diary; 2) Database; and 3) Data analysis and visualisation using MSPC (Multivariate Statistical Process Control) tech-nique. The electronic site diary provides facilities to enter the site information and output of the site diary provides summary of weekly site performance in terms of values of the construction process variables. Database is used to record all the weekly variable values as historic and cur-rent information. Marasini and Dawood [12] developed innovative managerial control system (IMCS) to monitor and control business processes of a precast building prod-ucts industry. The IMCS utilises Multivariate Statistical Process Control (MSPC) techniques combined with in-
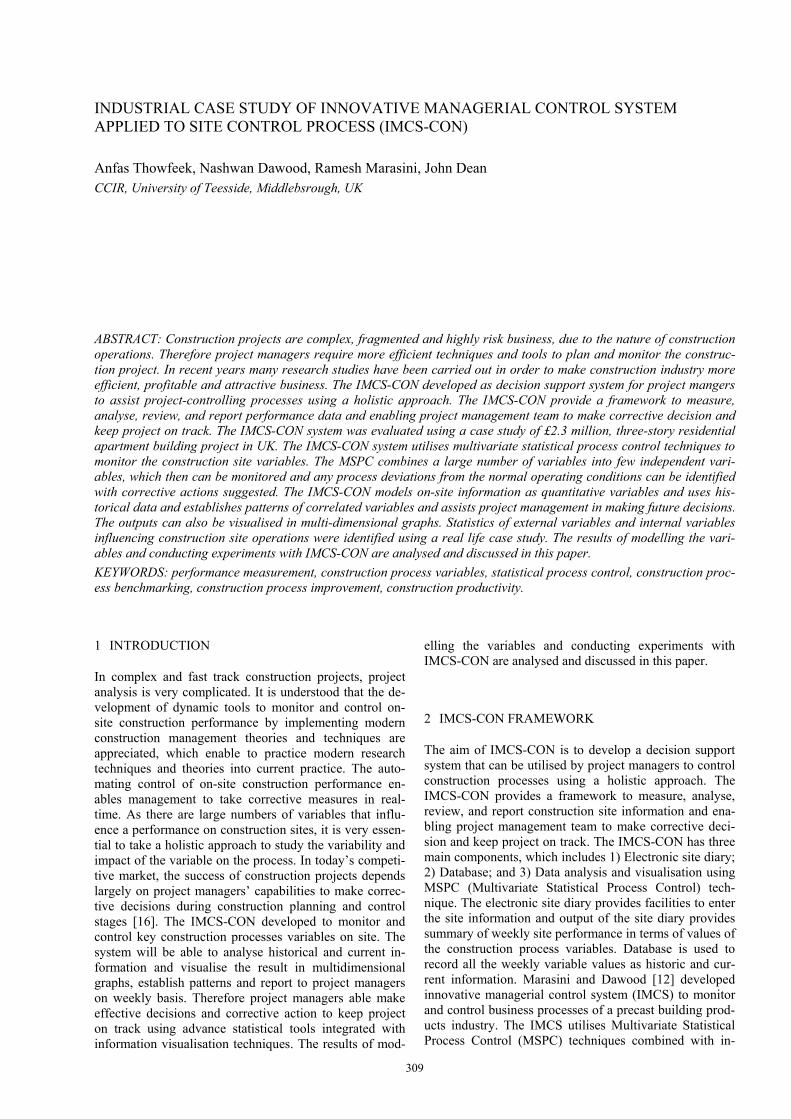
formation visualisation model. The IMCS able to analyse data and visualise information of large number of vari-ables. In order to analyse and graphically visualise con-struction variables, IMCS system has been utilised as a key component in IMCS-CON system. Figure 1 shows an outline structure of the IMCS-CON control process.
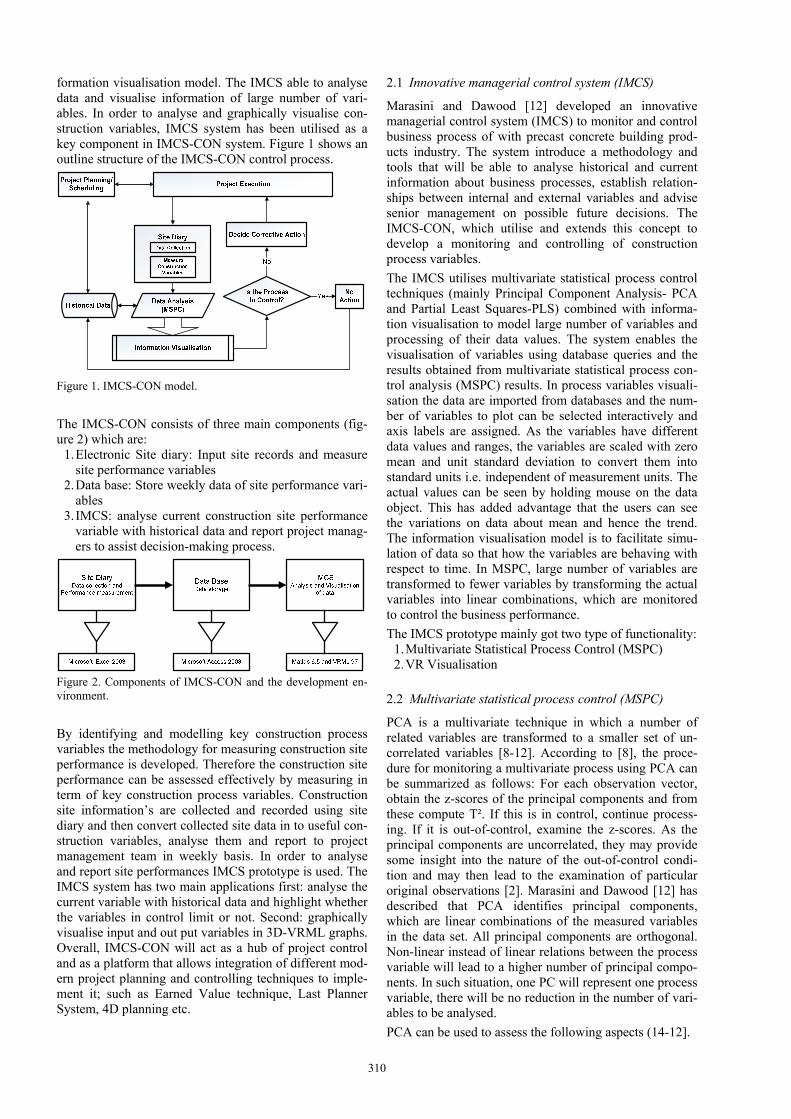
Figure 1. IMCS-CON model. The IMCS-CON consists of three main components (fig-ure 2) which are:
1. Electronic Site diary: Input site records and measure site performance variables
2. Data base: Store weekly data of site performance vari-ables
3. IMCS: analyse current construction site performance variable with historical data and report project manag-ers to assist decision-making process.
Figure 2. Components of IMCS-CON and the development en-vironment. By identifying and modelling key construction process variables the methodology for measuring construction site performance is developed. Therefore the construction site performance can be assessed effectively by measuring in term of key construction process variables. Construction site information’s are collected and recorded using site diary and then convert collected site data in to useful con-struction variables, analyse them and report to project management team in weekly basis. In order to analyse and report site performances IMCS prototype is used. The IMCS system has two main applications first: analyse the current variable with historical data and highlight whether the variables in control limit or not. Second: graphically visualise input and out put variables in 3D-VRML graphs. Overall, IMCS-CON will act as a hub of project control and as a platform that allows integration of different mod-ern project planning and controlling techniques to imple-ment it; such as Earned Value technique, Last Planner System, 4D planning etc.
2.1 Innovative managerial control system (IMCS)
Marasini and Dawood [12] developed an innovative managerial control system (IMCS) to monitor and control business process of with precast concrete building prod-ucts industry. The system introduce a methodology and tools that will be able to analyse historical and current information about business processes, establish relation-ships between internal and external variables and advise senior management on possible future decisions. The IMCS-CON, which utilise and extends this concept to develop a monitoring and controlling of construction process variables. The IMCS utilises multivariate statistical process control techniques (mainly Principal Component Analysis- PCA and Partial Least Squares-PLS) combined with informa-tion visualisation to model large number of variables and processing of their data values. The system enables the visualisation of variables using database queries and the results obtained from multivariate statistical process con-trol analysis (MSPC) results. In process variables visuali-sation the data are imported from databases and the num-ber of variables to plot can be selected interactively and axis labels are assigned. As the variables have different data values and ranges, the variables are scaled with zero mean and unit standard deviation to convert them into standard units i.e. independent of measurement units. The actual values can be seen by holding mouse on the data object. This has added advantage that the users can see the variations on data about mean and hence the trend. The information visualisation model is to facilitate simu-lation of data so that how the variables are behaving with respect to time. In MSPC, large number of variables are transformed to fewer variables by transforming the actual variables into linear combinations, which are monitored to control the business performance. The IMCS prototype mainly got two type of functionality:
1. Multivariate Statistical Process Control (MSPC) 2. VR Visualisation
2.2 Multivariate statistical process control (MSPC)
PCA is a multivariate technique in which a number of related variables are transformed to a smaller set of un-correlated variables [8-12]. According to [8], the proce-dure for monitoring a multivariate process using PCA can be summarized as follows: For each observation vector, obtain the z-scores of the principal components and from these compute T². If this is in control, continue process-ing. If it is out-of-control, examine the z-scores. As the principal components are uncorrelated, they may provide some insight into the nature of the out-of-control condi-tion and may then lead to the examination of particular original observations [2]. Marasini and Dawood [12] has described that PCA identifies principal components, which are linear combinations of the measured variables in the data set. All principal components are orthogonal. Non-linear instead of linear relations between the process variable will lead to a higher number of principal compo-nents. In such situation, one PC will represent one process variable, there will be no reduction in the number of vari-ables to be analysed. PCA can be used to assess the following aspects (14-12].
310
- Identification of process variables, which are associ-ated with the bulk variability in the data set.
- Identification of data subsets with a different correla-tion structure from the bulk of the data.
- Identification of the number of independent phenom-ena leading to data set variability.
- The objective of the principal components is to deter-mine a set of new variables that are linear combina-tions of the original variables and are orthogonal to each other.
The results of the PC and PLS analyses can be displayed graphically, including multivariate control charts, MSPC, (e.g., Hotelling’s T2 and PC components scores and load-ing charts). These charts based on the model residuals, provide tools for early fault detection, the detection of drift, mean shifts etc. These indicate which variables those are likely to be related to process problems, upsets, and other process events. The rational of the MSPC is to identify the combined re-lationship among the different variables, establish the control limits of the process variables and identify any significant deviations in the processes. Multivariate con-trol charts usually generate one common statistics from the values of many variables that can be plotted on a con-trol chart. In order implement MSPC technique Marasini and Da-wood [12] described two step processes. Step 1: Establishment of base line model The first step is the establishment of base line model, which utilises large historical data of process variables. The faulty measurements and disturbances are removed from the historical data so that an in-control set of process data is obtained representing normal operating conditions of the process. The screened (cleaned for errors) data are used for monitoring, control and optimization operations. The screened historical data set is referred, in the MSPC literature, as historical data set (HDS), calibration data set, base line or reference. The relationships between the variables and their control limits are established to de-velop a base model of the business process. Step 2: Monitoring of new operational data to ascertain if control is maintained. The second step is monitoring of new operational data to ascertain if control is maintained i.e. the new data are projected into the base model and are analysed whether new values are within the limits specified in the base model. If any significant deviations are detected, the cause of it is diagnosed and corrective actions are de-cided. This paper introduces the methodology of modelling the construction variables using MSPC techniques mainly PCA techniques and the following section will demon-strate experiments using real life project data obtained from a one of local UK Construction Company. 2.3 VR visualisation
The data visualization is one powerful form of descriptive data mining [6, 24]. It helps accentuate the relationship among data points in extremely large amounts of data, and allows the visualization of multiple metrics based on
multiple data sources on a single screen or dashboard [7]. In order to develop a VR visualisation component in IMCS prototype several functions were written in MAT-LAB6.5 to create VRML97 information visualisation models reading process variable values directly from the database and the output variables of the MSPC analysis. Utilising IMCS prototype the site information can be per-cent in clear and effective form through multidimensional graphical information visualisation of in put and out put variables. 3 APPLICATION OF IMCS-CON SYSTEM: A CASE
STUDY
This section describes experimentation of the IMCS-CON system through a case study. A case study is used to evaluate functionality of IMCS-CON components which includes electronic site diary, database, utilisation of IMCS. An appraisal of the developed IMCS-CON regard-ing its validity, its benefits, and its limitations to the con-struction industry is lastly reported. A £2.3 million, three storey residential apartment construction project in UK was selected as a case study for the system evaluation. 3.1 Selection of construction variables
The key variables which have impact on construction site performance were identified through industrial and litera-ture review. The IMCS-CON system design to monitor and control construction site operation through measuring and analysing these selected variables. The selection of variables should represent complete picture of construc-tion site process. The key construction process variables were selected from ten main construction variable catego-ries. Table 1 illustrates list of selected variables and their measurement units.
Table 1. Selected key construction variables.
311
These variables can be classified as internal variables and external variables. The external variables that are beyond the control of the managers; that are external to the com-pany (example: Rain fall, Temperature) and the internal variables that can be controlled by the managers; that are internal to the company (example quality, site safety etc). The comprehensive approach identifies these variables and establishes method to measure and analyse them and taking action to ensure desired results. Developing a methodology to assess the above key performance vari-ables for above ten categories provide an integrated con-struction operational level performance measurement sys-tem. These construction process variables can be subse-quently used by construction executives and project man-agers both to monitor and to evaluate site performances. The two type of construction processes variables consid-ered in this research are:
1. Quantitative variables: these variable values can quan-tify. The commonly used quantitative construction performance variables or indicators are deriving from literature review.
2. Qualitative variables: for those variables which can not be quantify, score based approach is used to meas-ure them.
In the score based measurement system for each qualita-tive variables, the project managers are asked to rank 1 to 5 in a point scale the extent to which they believe each variable was performing (for example: quality, site safety, client satisfaction etc). In order to assist the project man-agers in ranking each variable the relevant performance criteria has been provided, so that they can correlate with other relevant values and rank particular variables appro-priately where, the performance variables are ranked us-ing 1 to 5 scale based on their level of performance during their operation. The 1 to 5 scores are defined as: 1 = very poor 2 = poor 3 = fair 4 = good 5 = excellent The score 3 is considered as average performance level of the variable. The application of this score system will be illustrated in following sections. 3.2 The electronic site diary
In construction project, to record site information in regu-lar bases site diaries are widely used. In order to input and retrieve site records effectively, an electronic site diary is developed. The electronic site diary provides project managers with an enormous data to improve the results of project. Here MS excel software is selected for develop-ment site diary in electronic format due to its simplicity and it is wide functionality. The following sub-sections illustrate the developed system interfaces. The site diary is organised in 3 layers in Micro soft excel.
- Layer 1: Site data collection sheet - Layer 2: Site diary - Layer 3: Weekly site variables values
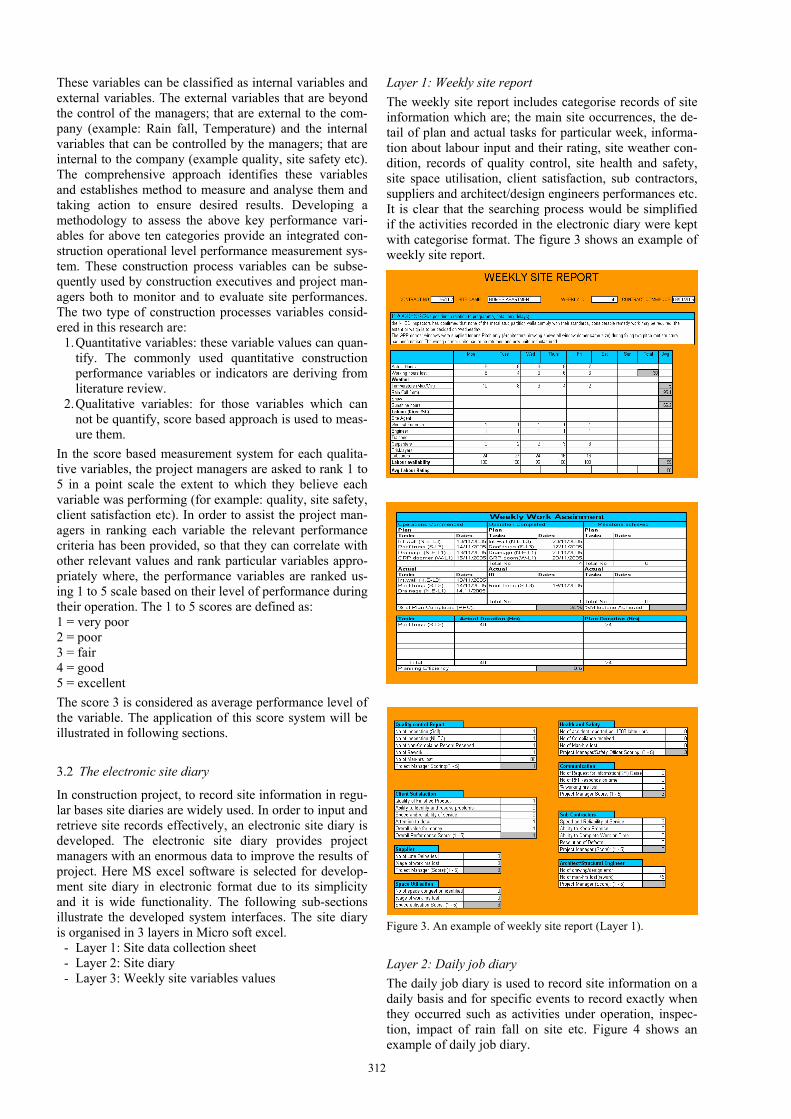
Layer 1: Weekly site report The weekly site report includes categorise records of site information which are; the main site occurrences, the de-tail of plan and actual tasks for particular week, informa-tion about labour input and their rating, site weather con-dition, records of quality control, site health and safety, site space utilisation, client satisfaction, sub contractors, suppliers and architect/design engineers performances etc. It is clear that the searching process would be simplified if the activities recorded in the electronic diary were kept with categorise format. The figure 3 shows an example of weekly site report.
Figure 3. An example of weekly site report (Layer 1). Layer 2: Daily job diary The daily job diary is used to record site information on a daily basis and for specific events to record exactly when they occurred such as activities under operation, inspec-tion, impact of rain fall on site etc. Figure 4 shows an example of daily job diary.
312
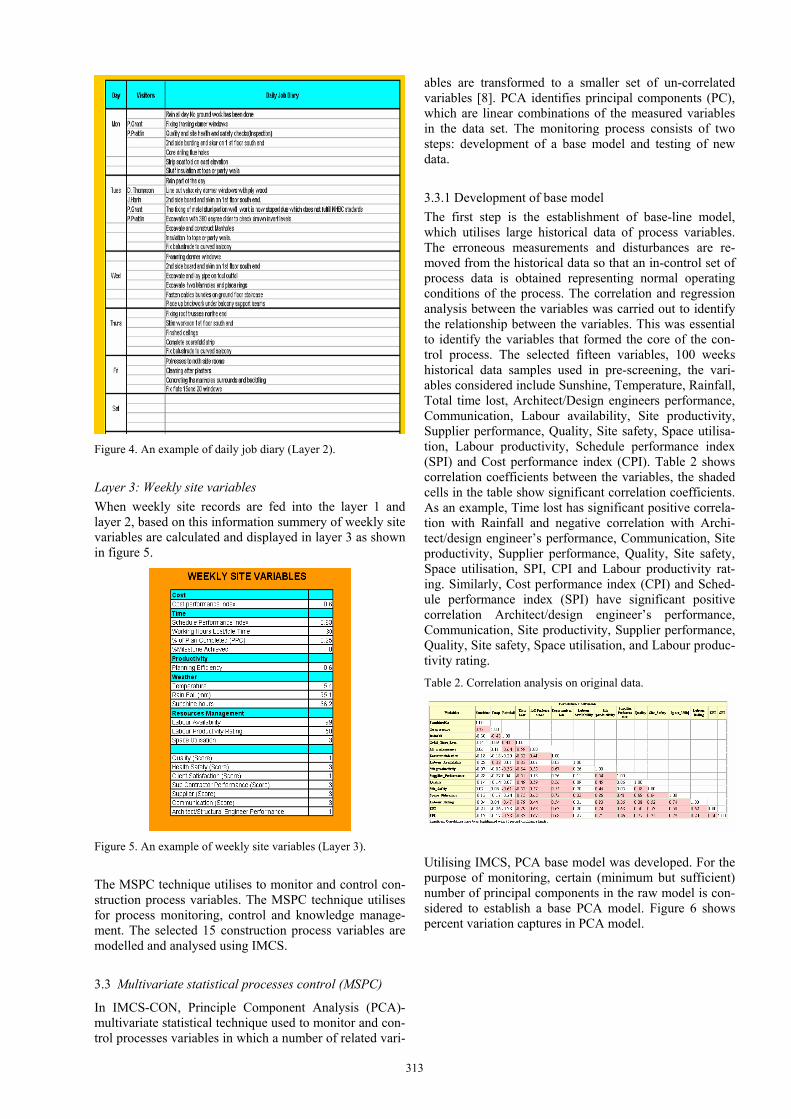
Figure 4. An example of daily job diary (Layer 2). Layer 3: Weekly site variables When weekly site records are fed into the layer 1 and layer 2, based on this information summery of weekly site variables are calculated and displayed in layer 3 as shown in figure 5.
Figure 5. An example of weekly site variables (Layer 3). The MSPC technique utilises to monitor and control con-struction process variables. The MSPC technique utilises for process monitoring, control and knowledge manage-ment. The selected 15 construction process variables are modelled and analysed using IMCS. 3.3 Multivariate statistical processes control (MSPC)
In IMCS-CON, Principle Component Analysis (PCA)-multivariate statistical technique used to monitor and con-trol processes variables in which a number of related vari-
ables are transformed to a smaller set of un-correlated variables [8]. PCA identifies principal components (PC), which are linear combinations of the measured variables in the data set. The monitoring process consists of two steps: development of a base model and testing of new data. 3.3.1 Development of base model The first step is the establishment of base-line model, which utilises large historical data of process variables. The erroneous measurements and disturbances are re-moved from the historical data so that an in-control set of process data is obtained representing normal operating conditions of the process. The correlation and regression analysis between the variables was carried out to identify the relationship between the variables. This was essential to identify the variables that formed the core of the con-trol process. The selected fifteen variables, 100 weeks historical data samples used in pre-screening, the vari-ables considered include Sunshine, Temperature, Rainfall, Total time lost, Architect/Design engineers performance, Communication, Labour availability, Site productivity, Supplier performance, Quality, Site safety, Space utilisa-tion, Labour productivity, Schedule performance index (SPI) and Cost performance index (CPI). Table 2 shows correlation coefficients between the variables, the shaded cells in the table show significant correlation coefficients. As an example, Time lost has significant positive correla-tion with Rainfall and negative correlation with Archi-tect/design engineer’s performance, Communication, Site productivity, Supplier performance, Quality, Site safety, Space utilisation, SPI, CPI and Labour productivity rat-ing. Similarly, Cost performance index (CPI) and Sched-ule performance index (SPI) have significant positive correlation Architect/design engineer’s performance, Communication, Site productivity, Supplier performance, Quality, Site safety, Space utilisation, and Labour produc-tivity rating. Table 2. Correlation analysis on original data.
Utilising IMCS, PCA base model was developed. For the purpose of monitoring, certain (minimum but sufficient) number of principal components in the raw model is con-sidered to establish a base PCA model. Figure 6 shows percent variation captures in PCA model.
313
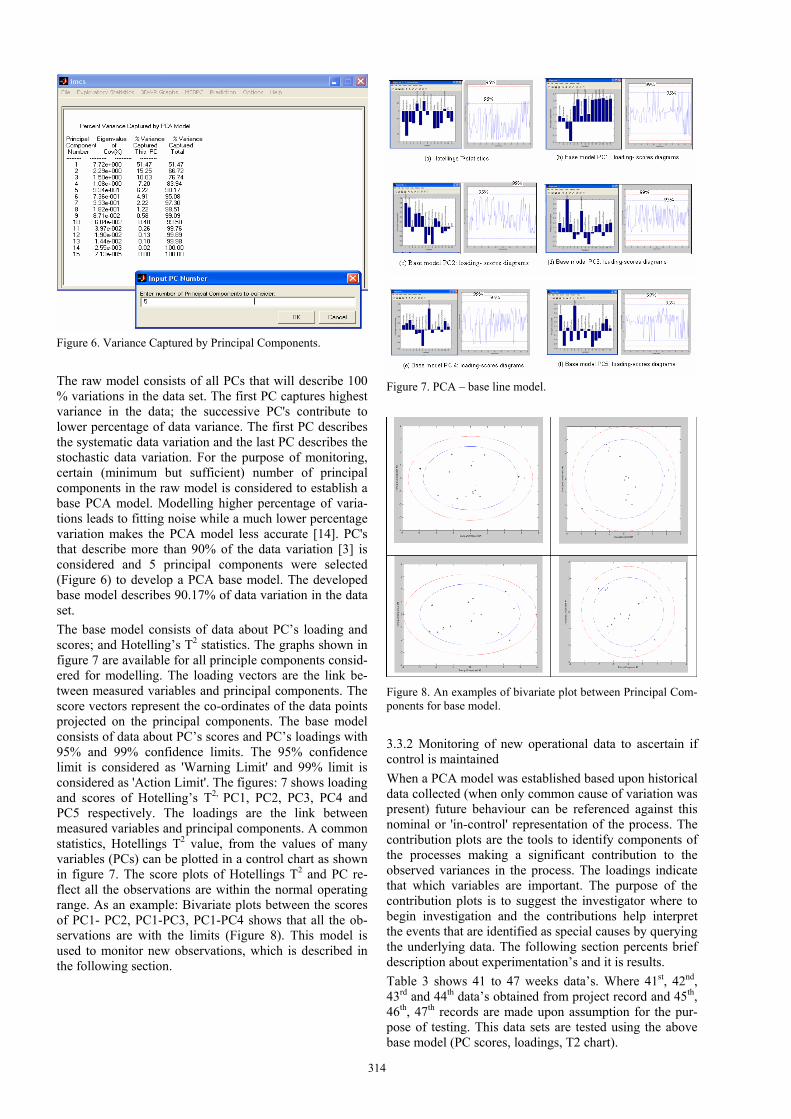
Figure 6. Variance Captured by Principal Components. The raw model consists of all PCs that will describe 100 % variations in the data set. The first PC captures highest variance in the data; the successive PC's contribute to lower percentage of data variance. The first PC describes the systematic data variation and the last PC describes the stochastic data variation. For the purpose of monitoring, certain (minimum but sufficient) number of principal components in the raw model is considered to establish a base PCA model. Modelling higher percentage of varia-tions leads to fitting noise while a much lower percentage variation makes the PCA model less accurate [14]. PC's that describe more than 90% of the data variation [3] is considered and 5 principal components were selected (Figure 6) to develop a PCA base model. The developed base model describes 90.17% of data variation in the data set. The base model consists of data about PC’s loading and scores; and Hotelling’s T2 statistics. The graphs shown in figure 7 are available for all principle components consid-ered for modelling. The loading vectors are the link be-tween measured variables and principal components. The score vectors represent the co-ordinates of the data points projected on the principal components. The base model consists of data about PC’s scores and PC’s loadings with 95% and 99% confidence limits. The 95% confidence limit is considered as 'Warning Limit' and 99% limit is considered as 'Action Limit'. The figures: 7 shows loading and scores of Hotelling’s T2, PC1, PC2, PC3, PC4 and PC5 respectively. The loadings are the link between measured variables and principal components. A common statistics, Hotellings T2 value, from the values of many variables (PCs) can be plotted in a control chart as shown in figure 7. The score plots of Hotellings T2 and PC re-flect all the observations are within the normal operating range. As an example: Bivariate plots between the scores of PC1- PC2, PC1-PC3, PC1-PC4 shows that all the ob-servations are with the limits (Figure 8). This model is used to monitor new observations, which is described in the following section.
Figure 7. PCA – base line model.
Figure 8. An examples of bivariate plot between Principal Com-ponents for base model. 3.3.2 Monitoring of new operational data to ascertain if control is maintained When a PCA model was established based upon historical data collected (when only common cause of variation was present) future behaviour can be referenced against this nominal or 'in-control' representation of the process. The contribution plots are the tools to identify components of the processes making a significant contribution to the observed variances in the process. The loadings indicate that which variables are important. The purpose of the contribution plots is to suggest the investigator where to begin investigation and the contributions help interpret the events that are identified as special causes by querying the underlying data. The following section percents brief description about experimentation’s and it is results. Table 3 shows 41 to 47 weeks data’s. Where 41st, 42nd, 43rd and 44th data’s obtained from project record and 45th, 46th, 47th records are made upon assumption for the pur-pose of testing. This data sets are tested using the above base model (PC scores, loadings, T2 chart).
314
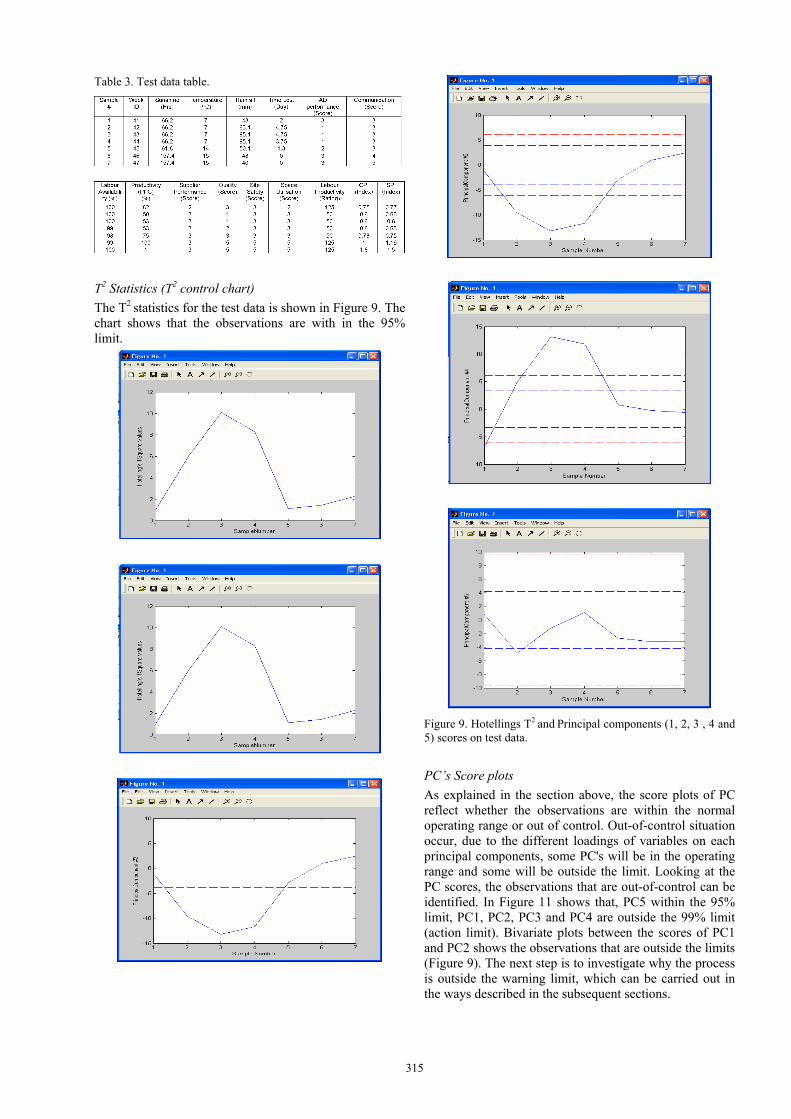
Table 3. Test data table.
T2 Statistics (T2 control chart) The T2 statistics for the test data is shown in Figure 9. The chart shows that the observations are with in the 95% limit.
Figure 9. Hotellings T2 and Principal components (1, 2, 3 , 4 and 5) scores on test data. PC’s Score plots As explained in the section above, the score plots of PC reflect whether the observations are within the normal operating range or out of control. Out-of-control situation occur, due to the different loadings of variables on each principal components, some PC's will be in the operating range and some will be outside the limit. Looking at the PC scores, the observations that are out-of-control can be identified. In Figure 11 shows that, PC5 within the 95% limit, PC1, PC2, PC3 and PC4 are outside the 99% limit (action limit). Bivariate plots between the scores of PC1 and PC2 shows the observations that are outside the limits (Figure 9). The next step is to investigate why the process is outside the warning limit, which can be carried out in the ways described in the subsequent sections.
315
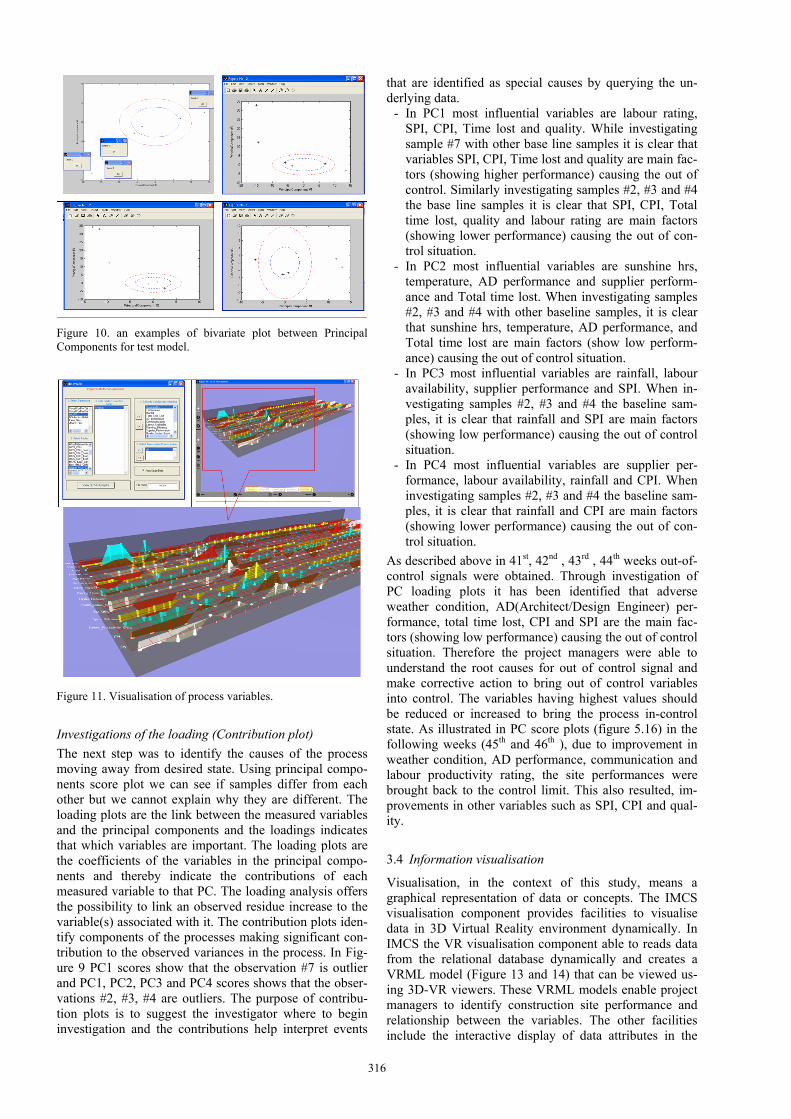
Figure 10. an examples of bivariate plot between Principal Components for test model.
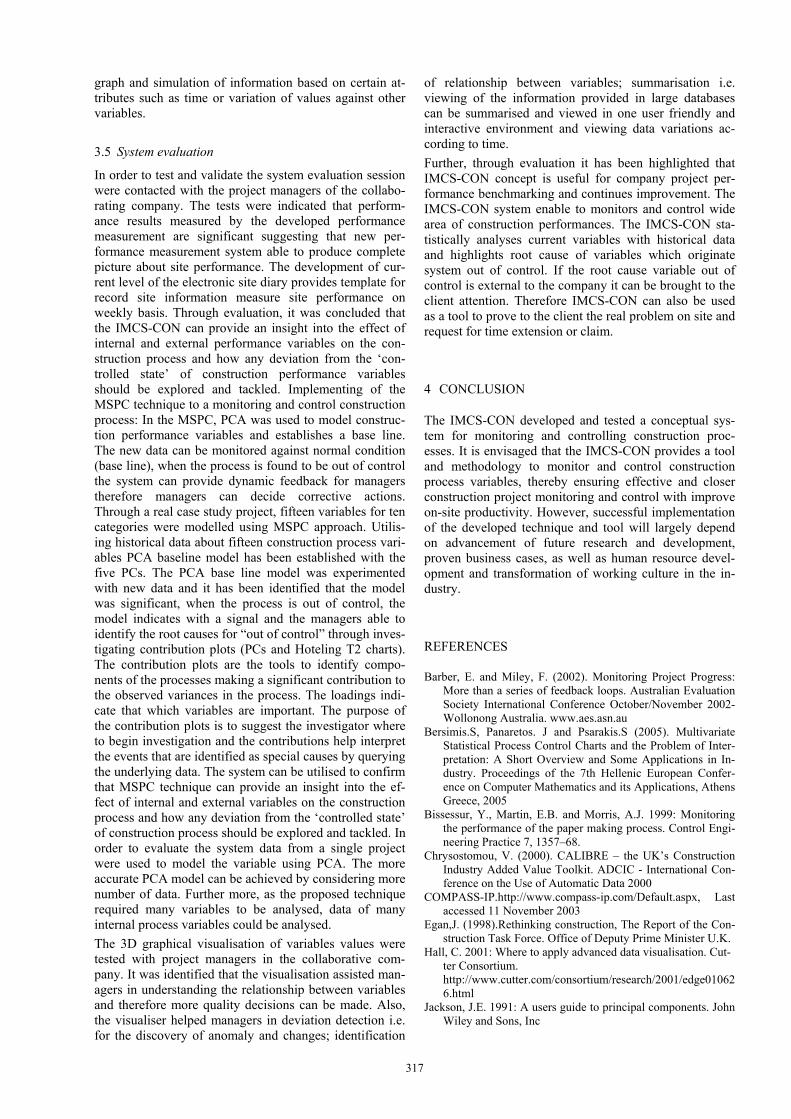
Figure 11. Visualisation of process variables. Investigations of the loading (Contribution plot) The next step was to identify the causes of the process moving away from desired state. Using principal compo-nents score plot we can see if samples differ from each other but we cannot explain why they are different. The loading plots are the link between the measured variables and the principal components and the loadings indicates that which variables are important. The loading plots are the coefficients of the variables in the principal compo-nents and thereby indicate the contributions of each measured variable to that PC. The loading analysis offers the possibility to link an observed residue increase to the variable(s) associated with it. The contribution plots iden-tify components of the processes making significant con-tribution to the observed variances in the process. In Fig-ure 9 PC1 scores show that the observation #7 is outlier and PC1, PC2, PC3 and PC4 scores shows that the obser-vations #2, #3, #4 are outliers. The purpose of contribu-tion plots is to suggest the investigator where to begin investigation and the contributions help interpret events
that are identified as special causes by querying the un-derlying data.
- In PC1 most influential variables are labour rating, SPI, CPI, Time lost and quality. While investigating sample #7 with other base line samples it is clear that variables SPI, CPI, Time lost and quality are main fac-tors (showing higher performance) causing the out of control. Similarly investigating samples #2, #3 and #4 the base line samples it is clear that SPI, CPI, Total time lost, quality and labour rating are main factors (showing lower performance) causing the out of con-trol situation.
- In PC2 most influential variables are sunshine hrs, temperature, AD performance and supplier perform-ance and Total time lost. When investigating samples #2, #3 and #4 with other baseline samples, it is clear that sunshine hrs, temperature, AD performance, and Total time lost are main factors (show low perform-ance) causing the out of control situation.
- In PC3 most influential variables are rainfall, labour availability, supplier performance and SPI. When in-vestigating samples #2, #3 and #4 the baseline sam-ples, it is clear that rainfall and SPI are main factors (showing low performance) causing the out of control situation.
- In PC4 most influential variables are supplier per-formance, labour availability, rainfall and CPI. When investigating samples #2, #3 and #4 the baseline sam-ples, it is clear that rainfall and CPI are main factors (showing lower performance) causing the out of con-trol situation.
As described above in 41st, 42nd , 43rd , 44th weeks out-of-control signals were obtained. Through investigation of PC loading plots it has been identified that adverse weather condition, AD(Architect/Design Engineer) per-formance, total time lost, CPI and SPI are the main fac-tors (showing low performance) causing the out of control situation. Therefore the project managers were able to understand the root causes for out of control signal and make corrective action to bring out of control variables into control. The variables having highest values should be reduced or increased to bring the process in-control state. As illustrated in PC score plots (figure 5.16) in the following weeks (45th and 46th ), due to improvement in weather condition, AD performance, communication and labour productivity rating, the site performances were brought back to the control limit. This also resulted, im-provements in other variables such as SPI, CPI and qual-ity. 3.4 Information visualisation
Visualisation, in the context of this study, means a graphical representation of data or concepts. The IMCS visualisation component provides facilities to visualise data in 3D Virtual Reality environment dynamically. In IMCS the VR visualisation component able to reads data from the relational database dynamically and creates a VRML model (Figure 13 and 14) that can be viewed us-ing 3D-VR viewers. These VRML models enable project managers to identify construction site performance and relationship between the variables. The other facilities include the interactive display of data attributes in the
316
317
graph and simulation of information based on certain at-tributes such as time or variation of values against other variables. 3.5 System evaluation
In order to test and validate the system evaluation session were contacted with the project managers of the collabo-rating company. The tests were indicated that perform-ance results measured by the developed performance measurement are significant suggesting that new per-formance measurement system able to produce complete picture about site performance. The development of cur-rent level of the electronic site diary provides template for record site information measure site performance on weekly basis. Through evaluation, it was concluded that the IMCS-CON can provide an insight into the effect of internal and external performance variables on the con-struction process and how any deviation from the ‘con-trolled state’ of construction performance variables should be explored and tackled. Implementing of the MSPC technique to a monitoring and control construction process: In the MSPC, PCA was used to model construc-tion performance variables and establishes a base line. The new data can be monitored against normal condition (base line), when the process is found to be out of control the system can provide dynamic feedback for managers therefore managers can decide corrective actions. Through a real case study project, fifteen variables for ten categories were modelled using MSPC approach. Utilis-ing historical data about fifteen construction process vari-ables PCA baseline model has been established with the five PCs. The PCA base line model was experimented with new data and it has been identified that the model was significant, when the process is out of control, the model indicates with a signal and the managers able to identify the root causes for “out of control” through inves-tigating contribution plots (PCs and Hoteling T2 charts). The contribution plots are the tools to identify compo-nents of the processes making a significant contribution to the observed variances in the process. The loadings indi-cate that which variables are important. The purpose of the contribution plots is to suggest the investigator where to begin investigation and the contributions help interpret the events that are identified as special causes by querying the underlying data. The system can be utilised to confirm that MSPC technique can provide an insight into the ef-fect of internal and external variables on the construction process and how any deviation from the ‘controlled state’ of construction process should be explored and tackled. In order to evaluate the system data from a single project were used to model the variable using PCA. The more accurate PCA model can be achieved by considering more number of data. Further more, as the proposed technique required many variables to be analysed, data of many internal process variables could be analysed. The 3D graphical visualisation of variables values were tested with project managers in the collaborative com-pany. It was identified that the visualisation assisted man-agers in understanding the relationship between variables and therefore more quality decisions can be made. Also, the visualiser helped managers in deviation detection i.e. for the discovery of anomaly and changes; identification
of relationship between variables; summarisation i.e. viewing of the information provided in large databases can be summarised and viewed in one user friendly and interactive environment and viewing data variations ac-cording to time. Further, through evaluation it has been highlighted that IMCS-CON concept is useful for company project per-formance benchmarking and continues improvement. The IMCS-CON system enable to monitors and control wide area of construction performances. The IMCS-CON sta-tistically analyses current variables with historical data and highlights root cause of variables which originate system out of control. If the root cause variable out of control is external to the company it can be brought to the client attention. Therefore IMCS-CON can also be used as a tool to prove to the client the real problem on site and request for time extension or claim. 4 CONCLUSION
The IMCS-CON developed and tested a conceptual sys-tem for monitoring and controlling construction proc-esses. It is envisaged that the IMCS-CON provides a tool and methodology to monitor and control construction process variables, thereby ensuring effective and closer construction project monitoring and control with improve on-site productivity. However, successful implementation of the developed technique and tool will largely depend on advancement of future research and development, proven business cases, as well as human resource devel-opment and transformation of working culture in the in-dustry. REFERENCES
Barber, E. and Miley, F. (2002). Monitoring Project Progress: More than a series of feedback loops. Australian Evaluation Society International Conference October/November 2002-Wollonong Australia. www.aes.asn.au
Bersimis.S, Panaretos. J and Psarakis.S (2005). Multivariate Statistical Process Control Charts and the Problem of Inter-pretation: A Short Overview and Some Applications in In-dustry. Proceedings of the 7th Hellenic European Confer-ence on Computer Mathematics and its Applications, Athens Greece, 2005
Bissessur, Y., Martin, E.B. and Morris, A.J. 1999: Monitoring the performance of the paper making process. Control Engi-neering Practice 7, 1357–68.
Chrysostomou, V. (2000). CALIBRE – the UK’s Construction Industry Added Value Toolkit. ADCIC - International Con-ference on the Use of Automatic Data 2000
COMPASS-IP.http://www.compass-ip.com/Default.aspx, Last accessed 11 November 2003
Egan,J. (1998).Rethinking construction, The Report of the Con-struction Task Force. Office of Deputy Prime Minister U.K.
Hall, C. 2001: Where to apply advanced data visualisation. Cut-ter Consortium. http://www.cutter.com/consortium/research/2001/edge010626.html
Jackson, J.E. 1991: A users guide to principal components. John Wiley and Sons, Inc

318
Josephson, P. E. and Hammarlund. Y. The causes and costs of defects in construction A study of seven building projects. Automation in Construction Volume 8, Issue 6 , August 1999, Pages 681-687.
Koskela, L. and Howell, G. (2001). Reforming project manage-ment: The Role of planning, Execution and controlling. Pro-ceedings of the 9th International Group for Lean Construc-tion 2001.
Love, P. E. D. and Holt, G. D. (2000). Construction business performance measurement: The SPM alternative Business Process Management., 6(5), 408–416.
Marasini, R. and Dawood, N. (2006). Innovative managerial control system (IMCS): an application in precast concrete building products industry, Construction Innovation2006; 6: 97–120.
Navon, R.(2005) Automated project performance control of construction projects. Automation in Construction 14 (2005) 467– 476
Santen, A., Koot, G.L.M. and Zullo, L.C. 1997: Statistical data analysis of a chemical plant.Computers in Chemical Engi-neering 21, S1123–29.
Scott, S. and Assadi, S.O.A.(1997), Towards an electronic site diary', Proceedings of the CIB Workshop W78, Cairns , Australia , July 1997, pp 349-358.
Soibelman, L. and Kim, H. (2002). Data preparation process for construction knowledge generation through knowledge dis-covery in databases.” Journal of Computing in Civil Engi-neering, ASCE, 16(1), 39-48.
The UK building Research Establishment (2003). http://www.bre.co.uk /services/publications.html
Ward, C. S., Curtis, B., and Chapman, C. B. (1991). Objectives and performance in construction projects.Construction Man-agement Economics, 9, 343–354.