Embed Size (px)
Citation preview

Source: (1) Economists survey, India, 2004(2) The Economists survey, the tiger in front 5 March 2005(3) Asian Development Bank - Key Indicators 2004: Poverty in Asia: Measurement, Estimates, and Prospects
Source: (1) Economists survey, India, 2004(2) The Economists survey, the tiger in front 5 March 2005(3) Asian Development Bank - Key Indicators 2004: Poverty in Asia: Measurement, Estimates,
and Prospects(2) World Bank Global Development Finance 2005, April 2005(3) Deutsche Bank Nov 2004 - India’s Changing Households(1) World Bank Investment Climate and Manufacturing Industry, November 2004(2) IMD Competitiveness Survey 2004(3) EIU Country Commerce India(4) Economist Survey, India, 2004(9) Asian Development Bank Key Indicators 2002: Population and Human Resource trends and
challenges(3) UN World Population Prospects (2004 revision) published by the UN Population Division, the
standard source for global demographic data and forecasts(9) World Competitiveness Yearbook, published by IMD International, a Swiss business school,
2005
INDUSTRIAL MARKETS
Manufacturing in IndiaOpportunities, Challenges, and Myths
INDUSTRIAL & AUTOMOTIVE PRODUCTS

Contents
Page
Summary 1
Part One: Why India? 4
Part Two: The Political Economy 12
Part Three: Location and Market 26
Conclusion 43
Unless otherwise stated information sources in this report are based on originalinterviews conducted on behalf of KPMG International in May 2005.

Manufacturing in India
Manufacturing in India 1
Why India?
India represents an economic opportunity on a massive scale: China and India
are likely to be the world’s two biggest economies by mid-century, and although
India has underperformed in the first lap of the growth race, there was a strong
possibility that India may well move ahead.
Although India is still seen by industrial investors as an economy where risk
is higher and the business environment more problematic than in rival Asian
investment locations, India also offers some advantages in the region. The legal
framework that protects investment is one of the best in Asia. The economy
offers an abundance of technical and managerial talent, often with international
experience. Geopolitical risk is diminishing consistently, in contrast with some of
India’s emerging economy rivals in Asia. And above all, India has a demographic
advantage that should see its working age population continue to grow well into
the century, increasing wealth and reducing cost.
The political economy
India is changing from a command economy focused on self-sufficiency to
becoming a key link in the global economic chain. But India’s ambition to catch
up with other high-growth Asian economies is not always matched by its ability
to implement change.
• Nation and state India is a federation of 29 states, and highly politicized.
This means that an investment decision in India is quite likely to be affected by
politics, and that needed changes in regulation and infrastructure development
are often undermined by conflict and competition between state and federal
governments. However, competition between states means that the total tax
incentive package can be high.(1)
• Licensing, law, and reform Central government has succeeded in opening
many sectors of the economy to foreign investment, while reserving others
to state or local business. These continuing restrictions impose costs on
manufacturers even though many manufacturing sectors (apart from strategic
industries like defense and aerospace) are open for investment. According to
the World Bank, the burden of licensing and bureaucratic administration has
significantly reduced since 2000. In terms of companies’ perception of the
burden, India scores better than either China or Brazil on business regulation,
better than either on the burden of tax and customs administration, and better
than Brazil on the perceived level of corruption.(2)
Summary
Source: (1) The Economists survey, The Tiger in Front 5 March 2005(2) World Bank Investment Climate and Manufacturing Industry, November 2004

• Investment procedures Investments in some economic sectors are now
given automatic approval by the Reserve Bank of India.(a) In other sectors the
government has attempted to streamline the process of approval through
the Foreign Investment Promotion Board (FIPB). In practice companies report
that decision-making can still appear arbitrary. Manufacturing investors can
incorporate in India as Indian companies or foreign companies. Indian
companies may be joint ventures or wholly owned subsidiaries, and foreign
equity ownership can be up to 100 percent. However, foreign equity caps
apply to several sectors.
• Labor Some companies say that labor legislation remains a significant drag
on business. Other companies point out that location tends to determine
the quality of labor relations. Many complaints focus on the rigidity of firing
regulations – only Mexico is considered equally restrictive. Nevertheless, the
labor pool is exceptionally rich, with nine million new entrants a year. It takes
on average fewer days to fill skilled job vacancies in India than in either China
or Brazil; remuneration costs are also at the low end of the emerging economy
scale. India is marginally more costly than China for most senior managers,
such as directors of HR and manufacturing, and CFOs. But costs are
significantly less than in other emerging economies such as Brazil and Mexico.(1)
• Taxation Corporate taxation is high compared to European and U.S. rates, but
average in world terms, and has been significantly reduced in the last 15 years –
the top basic rate fell from 48 percent to 35 percent in 2004. The indirect tax
burden varies from state to state: the federal government has current plans
to introduce a unified VAT at two lower rates of 4 percent and 12.5 percent;
(20 of the 29 states have moved to the new VAT regime starting April 2005).
Companies say this can bring a significant reduction in operational costs. Tax-
related industrial incentives include tax holidays, 100 percent deductible R&D
and capital expenses, accelerated depreciation and exemptions or deferral of
state sales taxes. The government is also committed to rapidly expanding
the number of concessionary Special Economic Zones (SEZs) where tax is
significantly reduced.(2) A new SEZ bill was passed in Parliament in May 2005.
Location and market
In recent years almost all foreign direct investment in India went to a small
privileged group of states and territories: according to the World Bank's
Investment Climate Report 2004, over 80 percent of FDI in 2000-2003 went
to Delhi, Maharashtra, Karnataka, Tamil Nadu, Chandigarh, Gujarat, and Andhra
Pradesh. But investment patterns are changing, say companies, with many
looking further afield to less congested and cheaper states.
2 Manufacturing in India
Note: (a) http://www.gujaratindustry.gov.in http://www.midcindia.org/ http://www.citcochandigarh.com/about_citco/about_citco.htm http://www.tidco.com
Source: (1) World Bank Investment Climate and Manufacturing Industry, November 2004(2) EIU Country Commerce India

Manufacturing in India 3
• Domestic markets The consumer market is remarkably undeveloped.
Consumer goods penetration is very low compared to other emerging
economies, partly because potential consumers are more difficult to reach.
India has a lower proportion of urban households compared to Asian
competitors: it is estimated that around 70 percent of Indians live in the
countryside, compared to around 60 percent in China.(1)(2) Consumption patterns
are also different: as Indians have grown richer, discretionary spending has
become focused outside the home. Unlike other Asian consumers, Indians
have tended not to greatly increase their spending on clothes, personal care,
and household goods.
• Infrastructure Infrastructure is top of the agenda for corporate planners in
India. By far the most significant infrastructure constraint for manufacturing is
the unreliability of power supply. On average a company can expect nearly 17
significant power outages per month, against one per month in Malaysia and
fewer than five in China. At the same time costs are higher.(3) Transport is also
a constraint, and companies focus on the weakness of ports and the road
network (the deterioration of the rail system means that companies have
moved most of their distribution to road). However, new road investment
is bringing significant improvements, and public-private partnerships are
beginning to be struck in infrastructure development projects.(4)
Source: (1) Asian Development Bank - Key Indicators 2004: Poverty in Asia: Measurement, Estimates, and Prospects(2) India’s Changing Households - Deutsche Bank Nov 2004(3) World Bank Investment Climate and Manufacturing Industry, November 2004(4) Economist Survey, India, 2004
4 Manufacturing in India
Source: World Bank Investment Climate and Manufacturing Industry, November 2004
China
India
Malaysia
Bangladesh
0
200
400
600
800
1000
1980 1982 1984 1986 1988 1990 1992 1994 1996 1998 2000
Annu
al p
er c
apita
l GDP
, PPP
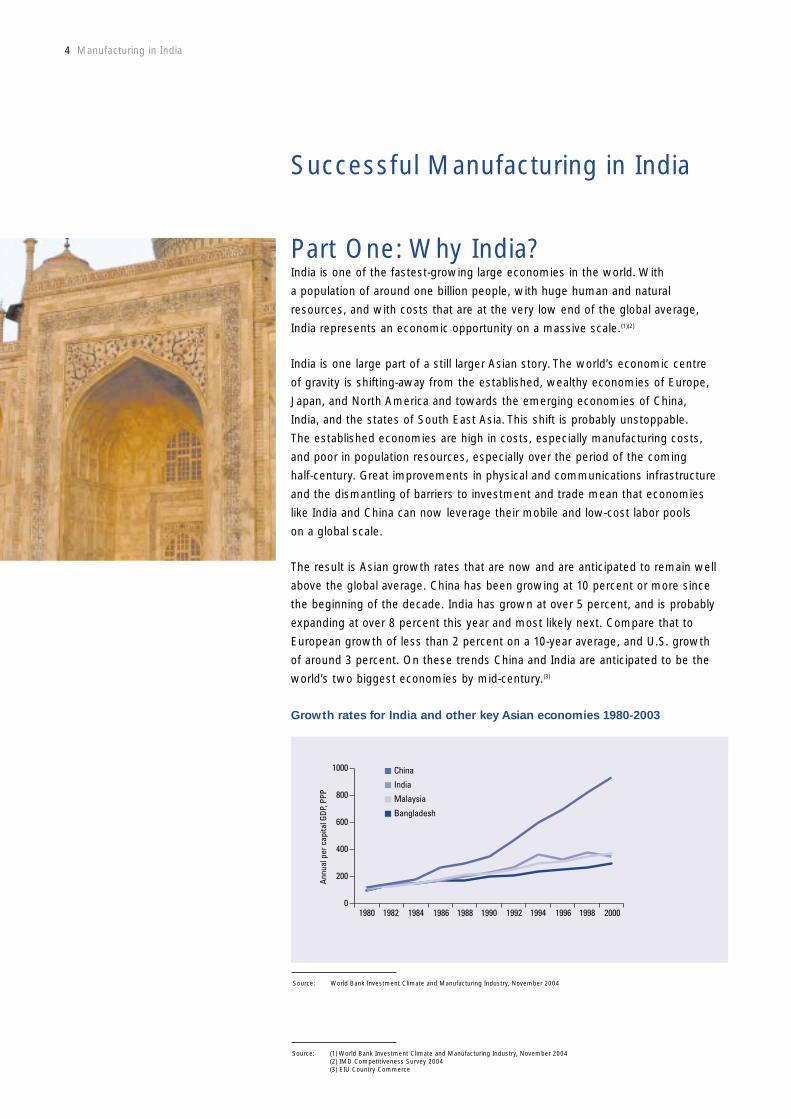
Part One: Why India?India is one of the fastest-growing large economies in the world. With
a population of around one billion people, with huge human and natural
resources, and with costs that are at the very low end of the global average,
India represents an economic opportunity on a massive scale.(1)(2)
India is one large part of a still larger Asian story. The world’s economic centre
of gravity is shifting-away from the established, wealthy economies of Europe,
Japan, and North America and towards the emerging economies of China,
India, and the states of South East Asia. This shift is probably unstoppable.
The established economies are high in costs, especially manufacturing costs,
and poor in population resources, especially over the period of the coming
half-century. Great improvements in physical and communications infrastructure
and the dismantling of barriers to investment and trade mean that economies
like India and China can now leverage their mobile and low-cost labor pools
on a global scale.
The result is Asian growth rates that are now and are anticipated to remain well
above the global average. China has been growing at 10 percent or more since
the beginning of the decade. India has grown at over 5 percent, and is probably
expanding at over 8 percent this year and most likely next. Compare that to
European growth of less than 2 percent on a 10-year average, and U.S. growth
of around 3 percent. On these trends China and India are anticipated to be the
world’s two biggest economies by mid-century.(3)
Successful Manufacturing in India
Source: (1) World Bank Investment Climate and Manufacturing Industry, November 2004(2) IMD Competitiveness Survey 2004(3) EIU Country Commerce
Growth rates for India and other key Asian economies 1980-2003

Manufacturing in India 5
In unadjusted U.S. dollar terms Indian growth dipped soon after the millennium,
reflecting not only the world growth downturn that hit bottom in 2002 but also
the exceptionally severe drought that hit India in that year. It also took until 2003
for the Indian corporate sector to unwind the capacity overhang caused by over-
investment in the mid-1990s.
Many commentators assume that China will eventually be the world’s largest
economy. This is not assured: half a century is a long race, and India has
some advantages that China lacks. But the fact is that India underperformed
in the first lap of the growth race. As a result, India is now widely seen by
industrial investors as an economy where the business environment
remains challenging.(1)(2)(3)
A challenging environment
India has changed, and fast. “If you had asked me 15 years ago I would have
said there was no hope for India, economically,” says Kuldip Khushoo, head of
manufacturing at Honeywell Automation India. “There were so many regulations
and restrictions, it was enough to send anyone crazy. But now there has been
a sea change, a real opening of the economy.” So what holds investors back from
committing to India? More than anything else, it is the quality of government
and administration.
First, there are doubts about the commitment of successive governments
to deliver rapid reform in what many agree is one of the most regulated and
bureaucratic of the emerging economies. The reform process began under the
Congress Party at the start of the 1980s, passed into the hands of the nationalist
BJP government in the 1990s, and back into today’s Congress-dominated
coalition government after the general election of 2004. Both Congress and the
BJP proclaim the cause of reform: actually dismantling India’s countless licenses,
charges, and administrative barriers to business is another matter entirely, and
a significant part of India’s labor cost advantage is cancelled by the excessive
bureaucratic cost of doing business. After all, India spent the first four decades
of independence trying to limit the influence of foreign capital in the economy.
Those attitudes die hard. When Finance Minister Palaniappan Chidambaram
presented the 2005 budget earlier this year, he still had to ask parliament’s
indulgence for the very fact that the federal government wanted to encourage
foreign investment.
Source: (1) World Bank Investment Climate and Manufacturing Industry, November 2004(2) Economist Survey, India, 2004(3) The Economists survey, The Tiger in Front 5 March 2005

6 Manufacturing in India
Source: World Economic Forum
Property Rights
JudicialIndependence
Freedom of Press
64
43
62
25
99
26
IndiaIndia
China
Corruption is also a significant cost, although when asked companies are usually
less concerned with corruption and more concerned with labor flexibility and
productivity, communications costs, and the total cost of power supplies.
“On corruption we have a very clear policy – we won’t tolerate it,” says Suhas
Kadlaskar, director of Corporate Affairs and Finance at DaimlerChrysler. “Now
you can’t say, I won’t invest in India because there is corruption. You just have
to accept the fact that you will have to find your own way.”
But if corruption is an everyday reality, companies point out that it is not as
corrosive as in other economies. Says Pradipta Sen, President of Emerson India:
“One advantage of India is that if you do have to walk away from a deal [where
the company suspects corruption], you don’t get penalized. You don’t get labeled
as a bad news company, which can happen in other economies.”
The variability of India’s score on these issues, region by region, means that India
is not one investment location, but many. Several of the 29 states remain virtually
off limits to international investors, while only six states in the west and south
of India have accounted for the lion’s share of foreign direct investment in recent
years.(1) And while costs and obstacles to investment are high in national terms,
things are quite different in these six states, several of which are highly
competitive in terms of productivity, flexibility, and quality-of-life attractiveness.
India also offers some advantages in the region. Compared to other
Asian nations, the quality of many of the institutions that influence business
environment is high.(1) Property rights are watertight and enforceable; the judiciary
is highly independent; freedom of the press and political life is assured.
Source: (1) World Bank Investment Climate and Manufacturing Industry, November 2004
World competitiveness - rank out of 102 countries (the lower the rating, the
higher the competitiveness)

Manufacturing in India 7
India has already achieved very significant deregulation since 1990: for example,
the number of sectors open to foreign participants has expanded steadily,
while import and export duties have been progressively reduced. There is
also continued cross-party support for continued reform, despite a political
environment that is often tempestuous. Many analysts predicted that the election
of a Congress-led coalition government in 2004 could derail India’s economic
liberalization process, as the Congress Party depended on left-wing partners
disinclined to support reformist legislation. That has not happened: the 2005
budget was widely seen as a balanced attempt to keep liberalization on track
without alienating Congress’s coalition partners. In addition, government has
recognized that its economy cannot be grown through services alone: according
to Ashok Jha, India's Secretary for Industrial Policy and Promotion, the
government believes that service sector growth alone can no longer be expected
to support growth of 8 percent. He says the government now wants to turn its
attention to manufacturing and its potential to raise India’s long-term growth rate.
India vs China
Will it be India or China that wins the race to dominate the world economy in
the second half of this century? Many assume the answer has to be China, the
economy that has been growing and drawing in manufacturing investment at an
astonishing pace for the last two decades. But this is a long race, and India has
several long-term advantages.
China has certainly made most of the running in recent years. In 1950 China was
the poorer country, with per capita GDP in today’s dollars of U.S.$439, against
U.S.$619 for India. By 2003 the Chinese figure had leaped ahead to U.S.$1,100,
while India had slipped to U.S.$530.(1)
The disparity is highly marked in the relative record on foreign direct investment.
According to Chinese figures, well over U.S.$50 billion in FDI is now going into
China each year: today it is hard to think of a significant cross-border company
that does not have manufacturing or services operations based in China.(2)
India is a long way from being able to claim the same, even though much has
been achieved since the government of Rajiv Ghandi began the long, slow, and
painful process of opening up the economy. Over the 1980s the growth rate rose
from 3.5 percent to over 5 percent; a financial crisis in 1991 prompted a bigger
and faster deregulatory reform package with cuts in trade taxes and sell-offs in
the state-owned economy. Growth crept up further, to 6 percent, but that level is
still well below the growth of around 9 percent that China is currently recording.(1)
Source: (1) The Economists survey, The Tiger in Front 5 March 2005(2) World Bank Global Development Finance 2005, April 2005
8 Manufacturing in India
Source: Goldman Sachs
0
2
4
6
8
10
2000- 2005
2005- 2010
2010- 2015
2015- 2020
2020- 2025
2025- 2030
2030- 2035
2035- 2040
2040- 2045
China GDP % growth
India GDP % growth
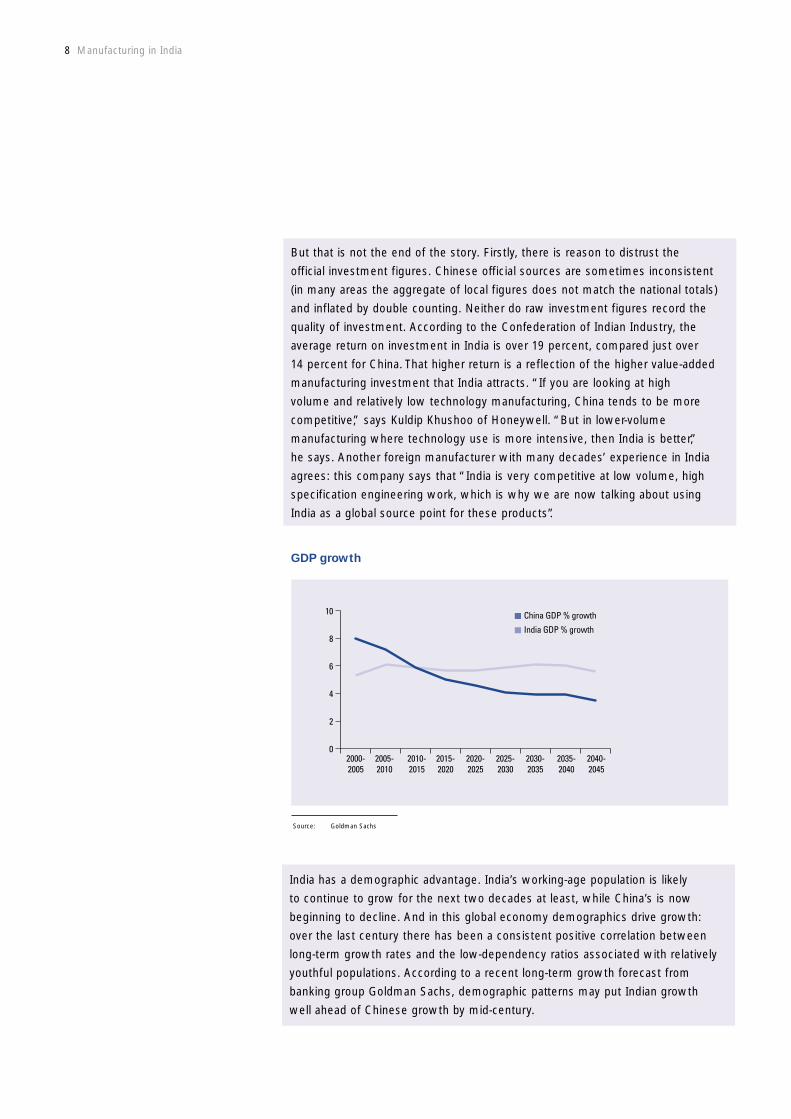
India has a demographic advantage. India’s working-age population is likely
to continue to grow for the next two decades at least, while China’s is now
beginning to decline. And in this global economy demographics drive growth:
over the last century there has been a consistent positive correlation between
long-term growth rates and the low-dependency ratios associated with relatively
youthful populations. According to a recent long-term growth forecast from
banking group Goldman Sachs, demographic patterns may put Indian growth
well ahead of Chinese growth by mid-century.
But that is not the end of the story. Firstly, there is reason to distrust the
official investment figures. Chinese official sources are sometimes inconsistent
(in many areas the aggregate of local figures does not match the national totals)
and inflated by double counting. Neither do raw investment figures record the
quality of investment. According to the Confederation of Indian Industry, the
average return on investment in India is over 19 percent, compared just over
14 percent for China. That higher return is a reflection of the higher value-added
manufacturing investment that India attracts. “If you are looking at high
volume and relatively low technology manufacturing, China tends to be more
competitive,” says Kuldip Khushoo of Honeywell. “But in lower-volume
manufacturing where technology use is more intensive, then India is better,”
he says. Another foreign manufacturer with many decades’ experience in India
agrees: this company says that “India is very competitive at low volume, high
specification engineering work, which is why we are now talking about using
India as a global source point for these products”.
GDP growth

Manufacturing in India 9
Just now confidence is booming in India, with record growth and low inflation.
If recent history is any guide, the euphoria will not last – domestic confidence
tends to be highly cyclical in India. But the longer-term outlook is exceptionally
positive: Indians may at last have to get used to success.(1)
Source: (1) Economists survey, India, 2004(2) World Bank Global Development Finance 2005, April 2005
Security improves
Higher growth usually brings higher risk. The emerging economies of Asia are no
exception. Along with a higher level of political uncertainty and greater operating
risks, there are also regional security risks – the possibility of civil disturbances,
cross border war, perhaps even nuclear conflict. These threats are not analysts’
fictions: in the last half century India has fought one war with China and three
with Pakistan. Added to these longstanding cross-border rivalries there is the
very real threat of civil strife within India itself.
Yet today many of these threats are receding fast. Relations with both Pakistan
and China are more encouraging than at any time since independence. This
reflects more than just the post 2001 realities of regional diplomacy; emerging
economies in Asia are increasingly aware that they are mutually dependent
on each other not only for export markets but also for labor and even inward
investment (a recent report from the World Bank suggests that at least a third
of FDI going to emerging economies came from other emerging economies).(2)
The improvement in India’s security prospects is recent, but there is certainly
a distinct sense in India today that the country has grown tired of the cost of
perpetual conflict on its borders: for many Indians the heady acceleration of the
economy is becoming too valuable to be put at risk by another cycle of conflict
with neighbors.
The place and the market
When asked what drives their Asian investments, international companies
almost invariably state that the primary need is to service local markets.
To achieve this objective they may follow a number of strategies: some
manufacturers build a plant in India to service local markets; some subcontract
manufacturing operations to local companies; and some bring in product
from plants already established in other low-cost economies. Many do
a combination of all three. Says one diversified manufacturer, “We build facilities
if the local market is strong, with good margins. If the market is low margin
and highly competitive, we tend to subcontract. And where we already have
the capacity outside India, we will import. Everything depends on the market,
the margins and global capacity.”

10 Manufacturing in India
India’s domestic market is underrated, but it is also underdeveloped. It includes
a large and growing middle class that controls a significant reserve of disposable
personal income.(1) Yet this market remains largely one of potential.
The challenge for domestic manufacturers is to succeed in a highly regional
market. A patchwork of cultures and languages, federal India also has a highly
uneven pattern of personal and infrastructural wealth. Average state incomes
in Punjab, Gujarat, and Maharashtra are around five times the level in Bihar, for
example. Some urban and union territory areas are on average much richer
still, while large rural areas of Bihar, Jharkand, Uttar Pradesh, and Orissa are
officially destitute.(a)(2)(3)
Can India also grow as a manufacturing exporter? Many companies think so –
Ford, for example, is already exporting in volume from its plant in Chennai. As
a global manufacturer India is well placed by geography, language, and historical
association to service customers in advanced economies, while as a regional
manufacturer India has highly developed historical trading links with the Middle
East and Africa as well as its own south Asian back yard. Changing patterns of
trade show that Indian trade, in common with that of regional competitors, is
inexorably moving away from the traditional markets of Western Europe and
towards the Middle East, the Americas, and above all other Asian markets.
In trade, too, the Asian century is taking shape.(4)
Source: Asian Development Bank - Key Indicators 2004: Poverty in Asia: Measurement, Estimates, and Prospects
1990 – 2003 shift in trade
0
5
10
15
20
25
30
Asia Western Europe Americas Middle East
1990
2003
% o
f Dire
ctio
n of
Tra
de: M
erch
andi
se E
xpor
ts
Note: (a) http://www.gujaratindustry.gov.in http://www.midcindia.org/ http://www.citcochandigarh.com/about_citco/about_citco.htm http://www.tidco.com
Source: (1) India’s Changing Households - Deutsche Bank Nov 2004(2) Economists survey, India, 2004(3) The Economists survey, The Tiger in Front 5 March 2005(4) Asian Development Bank - Key Indicators 2004: Poverty in Asia: Measurement, Estimates, and Prospects

Manufacturing in India 11
The demographic advantage
One of India’s greatest advantages in the race for growth in Asia is itsdemographic profile. The working-age population is likely to continue to growrelative to total population for the next two decades. By contrast many otherAsian economies are facing imminent or present declines in working-agepopulations. In the growth stakes this is critical: economic growth is closelycorrelated with demographic growth.(1)
Increases in wealth, improvements in life expectancy, and increased access tobirth control are contributing to reducing fertility rates worldwide. The reduction is marked in developing countries: the World Bank’s population data shows thatsince the 1970s medical care and birth control have dramatically reduced thenumber of children born per couple, and dramatically increased the proportion of citizens living past retirement age.(1)
India, however, is one of the handful of countries where not only overallpopulation is rising but the proportion of citizens of working-age is also growing.Unlike China, where the proportion of working-age citizens is likely to fall fromaround 2010, India is likely to have a growing employed workforce for at least the next 20 years. A growing labor force can enable higher growth rates andcreate an urgent political need for growth: according to the Asian DevelopmentBank India needs to achieve around 8 percent average annual growth over thenext two decades to create employment for new entrants to the workforce.India’s forecasted lower age dependency ratio over the next half-century meansthat public finances could come under less strain than in many other countries,potentially making infrastructural investment easier and allowing the economy to continue growing well above the global trend.
Source: UN World Population Prospects (2004 revision) published by the UN Population Division, thestandard source for global demographic data and forecasts
Percent of population 65 and older
0
5
10
15
20
25
30 2000
2025
2050
India China Thailand Korea Europe
% o
f Tot
al P
opul
atio
n 65
and
Abo
ve
Source: (1) Asian Development Bank Key Indicators 2002: Population and Human Resource trends and challenges

12 Manufacturing in India
Part Two: The Political Economy
India is a challenging economy in which it is nonetheless possible to succeed.
Successful companies are likely to be those with a better grasp of India’s
complex and contradictory web of rules, institutions, and practices, and which
accept that while change is in the air, implementation of change often leaves
a lot to be desired. “The economy is being liberalized,’ says Suhas Kadlaskar
of DaimlerChrysler, ‘but it takes time to liberalize the mindset. Indian
bureaucrats will have to keep up with the liberalized world economy and we
are sure they will.”
Nation and state
India is a federation of 29 states. There are also several small ‘union territories’
and the separate state capital territory of Delhi. State boundaries tend to reflect
linguistic divisions, such that the culture and economy of one state may differ
markedly to that of a neighbor. There are great differentials in local growth rates:
for example, the economy of Maharashtra is growing at around 8 percent,
compared to less than 4 percent in Bihar and Orissa.(1)
India is highly politicized: with 29 states and staggered election timetables
India is generally in the grip of a significant election somewhere. This means
that investment decisions in India are quite likely to be affected by politics,
especially if it is a large investment. “It is always that much harder to implement
very large projects, because large projects attract so much political interest,” says
K. Rajagopal, CFO of ABB India. “You need to manoeuvre around many different
interests, inevitably the energy you have to expend is greater” And Indian politics
is a maelstrom. The federal political scene is still dominated by two national
parties, the Congress Party of India and the Hindu nationalist Bharatiya Janata
Party (BJP). But these two parties are no longer as dominant as they were: state
politics is becoming increasingly significant, and state parties often owe little
allegiance to the national parties or national issues. So while a Congress-led
coalition currently controls the federal government (after general elections in
2004), that may mean little in poor north-eastern states where government may
be driven by local politics.
But if the Indian political scene is both confused and confusing, it has the
advantage of flexibility. Whatever party holds federal control in Delhi, local
interests can still find representation at the state level. Social and religious
tensions are inevitable in India: Indian democracy helps to neutralize those
tensions, an advantage that economies run by monolithic political parties do not
have. But, simply, the risk of a political explosion could potentially be higher in
China than it is in India, where democracy has roots that are six decades deep.
Source: (1) Economists survey, India, 2004

Manufacturing in India 13
Taxation in India
India’s commercial taxation system is unusually complex, especially where
indirect taxes are concerned. While income tax and excise and customs duty are
set by central government, states and municipalities also levy their own taxes
and provide discretionary exemptions to attract investment. Although tax policy
and many tax rates are set by central government, states and municipalities also
levy their own taxes which can often overlap with state taxes. However, the
taxation regime is moving in the direction of greater simplicity and predictability.(1)
Nevertheless, individual investment decisions are likely to have tax implications
that can only be established with professional assistance: all investors are
recommended to consult a professional taxation advisory service for advice
on individual cases.
The accounting year in all cases is April 1 – March 31. All federal taxes are
collected by the Central Board of Direct Taxes and the Central Board of Excise
and Customs. Tax inspections have in the past constituted a considerable
administrative burden for some companies: since 2003 the tax authorities have
said that tax inspections are on the basis of computerized random selection. India
has double taxation agreements with most large economies; an exceptional tax
treaty with Mauritius gives a capital gains tax exemption for investing companies
based in Mauritius (making it appear in official statistics that Mauritius is a leading
investor in India). Transfer pricing rules are primarily in line with OECD practices.(1)
Corporate taxation is high compared to European and U.S. rates but average
in world terms, and has been significantly reduced in the last 15 years – the
top basic rate fell from 48 percent to 40 percent in 2004. Basic rates of 35
percent for Indian-incorporated businesses and 40 percent for foreign companies
are pushed up to nearly two percentage points higher by a ‘corporate’
surcharge of 2.5 percent and an education surcharge of 2 percent, levied
on the taxable amount.(1)
Companies and individuals are liable to wealth tax of one percent payable on
certain assets above a threshold value of Rs 1.5 million. Wealth tax is aimed
primarily at economically unproductive assets. Municipalities and states may
also levy taxes on land value and land revenues.
Source: (1) EIU Country Commerce India

14 Manufacturing in India
Certain service businesses are liable to a service tax introduced in 1998 to
create government revenue from the explosive growth of the service sector;
the total effective rate, including surcharges, is 10.2 percent. Service tax is not
levied directly on revenues from manufacturing, but manufacturers may be
engaged in some of the categories of business liable for this tax, such as
warehousing and financial leasing.
Calculation of liability for direct corporate taxes varies according to the form
of incorporation of a business. Resident Indian companies are taxed on gross
worldwide income less deductions, including most non-capital business
expenditures and also some local taxes and customs duties. There are also
deductions for layoff expenditure, designed to reduce the cost of hiring and firing.
Indian branches of foreign companies are taxed on the profits attributable only to
that branch, at the higher foreign company corporate tax rate. Foreign companies
buying weak local companies selected by the Reserve Bank of India (RBS) for
takeover get special tax breaks that allow business losses and unabsorbed
depreciation to be carried forward for long periods.
The indirect tax burden varies from state to state, although the main indirect tax
burden is from federal levies. Value-added tax has until recently been applied
in all states at various rates: until 2005 this tax was called excise duty and levied
at three rates of 8 percent, 16 percent and 24 percent, plus local sales taxes
levied by individual states. However, beginning in April 2005 the federal
government has plans to introduce a unified VAT at two lower rates of 4 percent
and 12.5 percent, the lower rate applying to industrial inputs and capital goods
among other categories. Companies should note that the success of the new
VAT system is not assured: similar reforms have been postponed on at least
five occasions in the last ten years, and at least seven states have yet to agree
to the new VAT rates; and it remains uncertain whether VAT paid in one state
will be allowable as a credit in another state. Customs duties on both exports
and imports have been falling in recent years: the top rate of basic duty is
now 20 percent.

Manufacturing in India 15
Direct and indirect corporate taxation can be reduced through a number of
tax-related industrial incentives. These include tax holidays, 100 percent
deductible R&D and capital expenses, accelerated depreciation for certain
investments (mainly in environmental protection categories) and exemptions or
deferral of state sales taxes. Actual or intending exporters are eligible for
concessional customs duty rates for imported capital goods under the Export
Promotion Capital Goods Scheme. Exporters may also qualify for special tax
treatment if they are set up as Export Oriented Units (EOUs) or in designated
Export Processing Zones (EPZs). The government is also committed to rapidly
expanding the number of concessionary Special Economic Zones (SEZs) which
allow a wider range of business operations than either EOUs or EPZs, and which
shield foreign investors from a range of normal Indian commercial regulations.
Benefits in SEZs and some other concessionary zones include a wide range of
duty – free imports, a 100 percent tax holiday until 2010, exemption from sales
and service taxes, and the right to sell some export tax-free products into the
Indian domestic market. However, promised liberalization of hire-and-fire
regulations in the SEZs have not materialized.
Personal taxation is levied on less than 4 percent of India’s population, but is
important for both expatriate and local executive remuneration. Income is taxed
on a three-tier assessment, with income above Rs 1million (£12,610) taxed at
30 percent plus a 10 percent surcharge on the tax liability. Individuals are liable
for income tax if they spend at least 182 days in India in a year, or 60 days if they
have spent 365 days or more in India in the preceding four years. Expatriate
managers can avoid personal taxation if they qualify as “not ordinarily resident”
by virtue of having been in India for fewer than two years in the preceding seven.
If they do not qualify they may be liable for tax on all income, including foreign
income, although this liability is yet to be tested in court. Individuals are also
liable for wealth tax on non-productive assets.
16 Manufacturing in India
Licensing, law, and reform
In recent memory the Indian economy was still based on a socialist system of
centralized control developed under the leadership of Jawaharlal Nehru, India’s
first prime minister. Key industries were taken into state ownership; all economic
activity was subject to license and administrative management; taxes were high,
and import duties prohibitive. The thrust of policy was to achieve economic
development without the participation or influence of foreign capital.
India has achieved a remarkable political turnaround in reversing this policy.
Yet a large part of the historical system of control still exists, and continues to
absorb immense amounts of investors’ time, money, and energy. But equally
the program of economic liberalization begun a quarter of a century ago has
succeeded in dismantling much gratuitous regulation, and continues to clear
space for profitable operations.
Liberalization is increasingly an issue for state governments as much as for
central government. Power generation, for example, is usually in state hands, as
is the power to progress or hinder many infrastructure developments. Meanwhile
central government has succeeded in opening many sectors of the economy to
foreign investment, while reserving others to state or local business (the full list
of ‘reserved products’ still runs to around 600 categories, although it is shrinking
annually). For example, vehicles, consumer electronics, and white goods are fully
liberalized, while insurance and media investments are restricted to minority
partnerships, retailing remains barred to foreign investors, and defense,
and aerospace are in state hands.(1)
These continuing restrictions impose costs on manufacturers. One diversified
European manufacturing company points out that firms with extensive facilities in
India have large insurance needs and they are required to use local state-owned
insurance companies. “The result is that prices are high, and as a manufacturer
we have to pay significantly higher premiums than are necessary” the company
says. K. Rajagopal of ABB India adds, “I think it will take at least another four or
five more years to get parts of the financial system really opened up.”
Source: (1) EIU Country Commerce India

Manufacturing in India 17
According to the World Bank’s survey on investment climate and manufacturing,(1)
which tracks changes in the Indian investment and operating environment
between 2000 and 2003, manufacturing companies do find the burden of
administrative compliance, complex taxation, and corruption considerable. But the
Bank also notes that in several key indicators of the costs of doing business in
India there are considerable disparities between states (this is discussed in more
detail below), and that many ratings have significantly improved since 2000. India
is an environment where companies can expect incremental but consistently
positive change. Overall, according to the IMD global competitiveness database,
the overall ease of doing business in India is now on a par with China, and better
than in other emerging economy competitors.
Source: World Competitiveness Yearbook, published by IMD International, a Swiss business school, 2005
Ease of doing business
0
1
2
3
4
5
6
7
2001 2002 2003 2004 2005
Brazil
China Mainland
India
Mexico
High operating costs, also affect sectors differentially. Companies report that
they believe that corruption does not significantly affect productivity in high-cost
technology-rich businesses; it is reported to have a negative effect in resource-
based industries. Typically companies say that corruption is low level, and an
irritant rather than a critical issue: “It is usually nothing more than junior officials
wanting to be paid to shuffle papers from one desk to another,” says Kuldip
Khushoo of Honeywell.
Across sectors, one of the most commonly cited negative factors for
manufacturing were power availability and cost (discussed below) and the cost
of excessive bureaucracy and indirect taxation. Completing reforms of the tax
and business administration systems could improve average manufacturing labor
productivity by 60 percent, the Bank calculates.(1)
Source: (1) World Bank Investment Climate and Manufacturing Industry, November 2004

18 Manufacturing in India
Inward investment: ways and means
India has been officially open to inward investment since 1991, when the federal
government embarked on a second round of economic liberalization. In recent
years the focus has been on attracting investment in infrastructure, energy,
telecommunication services, and software development. Only recently has
government begun to attract a wider FDI presence in manufacturing.
Although the rules governing permissible inward investments are complex
and restrictive, they are also transparent, says Pradipta Sen of Emerson India:
“It is not like China, where government will scrutinize every single proposed
investment in terms of how much benefit does this investment bring to the
economy. In India, if an investment falls within the policy guidelines, then it
will be approved – there is no short cut, but there is almost total predictability.”
Investments in some economic sectors are given automatic approval by the
Reserve Bank of India.(1) In other sectors the government has attempted to
streamline the process of approval through the Foreign Investment Promotion
Board (FIPB); in practice companies report that decision-making can still appear
arbitrary, and much time is taken up through the need to gain approval from
numerous subsidiary agencies. Investments are also limited by sector.
Investments of 100 percent are permitted in a wide range of businesses from
advertising to pharmaceuticals. Other sectors such as media and banking are
subject to investment caps; a diminishing list of sectors, such as retail trading,
remain effectively closed to foreign participation. However, the FIPB considers
Foreign Direct Investment (FDI) proposals that fall outside the sectoral and
cap limits on a case-by-case basis. The Secretariat for Industrial Assistance
(http://siadipp.nic.in/sia/default.htm) at the Ministry of Commerce and Industry,
and the Indian Investment Centre (http://iic.nic.in/), as well as the FIPB
(http://finmin.nic.in/the_ministry/dept_eco_ affairs/fipb/fipb_index.htm), both
at the Ministry of Finance, can offer guidance on current policy. The Foreign
Investment Implementation Authority (http://siadipp.nic.in/sia/fiia.htm) in the
Ministry of Commerce exists to help intending investors co-ordinate approvals
with different arms of government; large independent investment projects may
also get procedural assistance from the strategic management group in the
Prime Minister’s Office (http://pmindia.nic.in/).
Source: (1) EIU Country Commerce India

Manufacturing in India 19
Manufacturing investors can incorporate in India as Indian companies or as
foreign companies. Indian companies may be joint ventures or wholly owned
subsidiaries, and foreign equity ownership can be up to 100 percent. However,
foreign equity caps apply to several sectors: for example, defense industries are
limited to 26 percent foreign holding, aviation is limited to 74 percent, and trading
companies are normally limited to 51 percent although up to 100 percent is
allowed in some categories of trading. A wide range of manufacturing operations
are not subject to limit, but it is vital to obtain advice on the fast-changing equity
limit regime from the Secretariat for Industrial Assistance: limits can be
instrumental in deciding the corporate form of investment, although some
companies seek joint ventures in the absence of equity limits to take advantage
of Indian market expertise. Many foreign investors entered India in a JV
agreement and later took full control of the business in order to operate in new
business areas. Honeywell is typical: “We began as a joint venture with Tata but
exporting was not allowed under the JV agreement, which is why we have only
just begun to export from India,” says Kuldip Khushoo.
Companies do not have to incorporate in India, but can operate as foreign
companies: forms available include liaison offices, branch offices, and project
offices. Of these the branch office is more likely to be of interest to manufacturers
as a tax-efficient way of investing in India, but only for manufacturers intending to
subcontract manufacturing operations to Indian partners. Foreign companies do
not usually use India as a global headquarters as the likely tax treatment makes
this disadvantageous.(1)
What does excessive bureaucracy actually consist of? According to
companies there are at least four issues of concern. Firstly, the cost of
entering and exiting businesses in India is high. Compliance with health,
safety and environmental standards is costly, due to excessive inspections
and documentation requirements, and there is a great deal of inter-state
bureaucracy of questionable utility (for example, of the ‘entry forms’ that some
states require whenever goods are moved across state borders, Mohandes
Menon of logistics specialist Exel asks, ‘what are these entry forms for?
Nobody knows. There is no real logic to this practice being followed for
several years which brings so much hardship to the industry.’)
Source: (1) EIU Country Commerce India

20 Manufacturing in India
Nevertheless, India is far from being the most regulated of emerging economies.
In terms of companies’ perception of the burden, India scores better than either
China or Brazil on business regulation, better than either on the burden of tax
and customs administration, and better than Brazil on the perceived level
of corruption.(1)
And some companies point out that while the Indian bureaucratic burden can be
heavy, it also has its strengths. “I think Indian bureaucrats often get a bad press,
and the bad becomes the benchmark,” says K. Rajagopal of ABB. “A lot of the
bureaucrats I meet are well intentioned, well informed and capable too.” Mr H.
Gelis, executive director of Siemens, agrees: “The Indian bureaucracy overall
is knowledgeable and informed,” he says.
Source: World Bank Investment Climate and Manufacturing Industry, November 2004
0
10
20
30
40
50
60
70 Brazil
China
India
Business regulation Tax and customs admin Corruption
Source: (1) World Bank Investment Climate and Manufacturing Industry, November 2004
Cost of doing business: India, China, and Brazil
Percent of respondents identifying business regulation, tax and customs, andcorruption as impediments to growth

Manufacturing in India 21
The procedures for entering and exiting businesses remain slow by the standards
of competitor economies. Administrative approval of new businesses takes an
average of over 89 days, more than double the time taken in China.(1) Closing
businesses takes even longer: the average time to complete bankruptcy
proceedings in India is 10 years.(2) Some companies do not consider this
a significant barrier, however. “You can debate about how long it takes to
set up a business,” says Khuldip Khushoo of Honeywell, adding, “But how
important is that? Once you have got past those hurdles it is really relatively
easy to operate in India.”
Businesses also face a considerable administrative burden during operations,
through inspections from health, safety, and environmental officials. The rules
governing operations are contained in a number of overlapping pieces of
legislation (including the Factories Act of 1948, the Water Act of 1974, the
Air Act of 1981, and the Environmental Protection Act of 1986). However, the
weight of the administrative burden depends largely on the individual state
where the business is located. Evidence from the World Bank suggests that
the compliance burden is falling.(1) The average number of inspections fell to 7.4
a year in 2003, compared to 11.7 in 2000. But the burden may be much lower
in regions with business-friendly administrations: the average number of
inspections in the Mumbai metro area, for example, ran at 4.4 a year in 2003,
more than 20 percent down on 2000. The number of days it took goods to clear
customs showed similar improvements.
Companies also complain of the ‘hidden’ regulatory burden of the time it takes
to secure a wide range of approvals. One diversified manufacturer reports that
after many years of operation in India, the company has only just secured
a ‘general services agreement’ allowing the Indian subsidiary to reimburse
European and U.S. R&D centers for intangible services. The company says,
“We got the agreement last year, but that literally took decades – just about
anywhere else it would have been considered routine. And if you ask would
investment in India have been higher in the past with such an agreement, the
answer is yes it would.”
Source: (1) World Bank Investment Climate and Manufacturing Industry, November 2004(2) Economists survey, India, 2004

22 Manufacturing in India
Companies are largely in agreement that one of the most significant regulatory
burdens in India is labor regulation, which provides a disincentive to grow
businesses, reduces flexibility in operations, and increases exit costs. Under the
Industrial Disputes Act of 1947 businesses with over 100 workers have to secure
the permission of state governments to close businesses or lay off workers.
The Industrial Employment Act of 1946 and the Contract Labor (Abolition and
Regulation) Act of 1970 make it difficult to redeploy workers in reorganizations
without unanimous agreement of workers.
Some companies say that labor legislation remains a significant drag on business.
“If we want to close down a factory, if any employees don’t want to take the
severance package then we have to go on employing them – we may have
no economic work for them, but we have to go on paying them,” says one
diversified foreign manufacturer in India. Other companies point out that location
tends to determine the quality of labor relations, and the way that courts interpret
labor law. “Fifteen years ago there were endless strikes and lockouts, but you
just don’t hear about that any more,” says Kuldip Khushoo of Honeywell, which
has plants in Pune in Maharashtra state. He adds, “Labor has realized that jobs
can be lost. The reality today is that you can lay people off. Legislation is just not
enforced in the restrictive way it used to be.”
The labor pool is exceptionally rich, with nine million new entrants a year, and
with a wider range of top-level technical skills than in any comparable market.
It takes on average fewer days to fill skilled job vacancies in India than in either
China or Brazil.(1)
Source: World Bank Investment Climate and Manufacturing Industry, November 2004
Time taken for business start-ups – average number of days
0
20
40
60
80
100
120
140
160
Brazil India Mexico China RussianFederation
Malaysia
Source: (1) World Bank Investment Climate and Manufacturing Industry, November 2004

Manufacturing in India 23
Remuneration costs are also at the low end of the emerging economy scale.
India is marginally more costly than China for most senior managers, such as
directors of HR and manufacturing, and CFOs. But costs are significantly less
than in other emerging economies, such as Brazil and Mexico. “Top level skills
are still cheap compared to their equivalents in Europe – and that includes
managers with real international experience,” says Suhas Kadlaskar of
DaimlerChrysler. Kuldip Khushoo of Honeywell agrees, saying, “I have recently
been involved in setting up high tech production lines in India, and it is really
quite cheap to get engineers in India, and they are good engineers – they still
cost maybe a half or a third of what they would in Europe.”
Source: World Competitiveness Yearbook, published by IMD International, a Swiss business school, 2005
Competency levels of senior managers
0
1
2
3
4
5
6
7
8
9 Argentina
Brazil
China Mainland
India
Mexico
2001 2002 2003 2004 2005
Source: World Competitiveness Yearbook, published by IMD International, a Swiss business school, 2005
Remuneration of management / directors in manufacturing
0
50000
100000
150000
200000
250000 Argentina
Brazil
China Mainland
India
Mexico
2000 2001 2002 2003 2004
Source: (1) The Economist, Today India tomorrow the world, 31 March 2005(2) World Bank Investment Climate and Manufacturing Industry, November 2004(3) World Competitiveness Yearbook, published by IMD International, a Swiss business school, 2005
24 Manufacturing in India
Downsizing strategies that include large-scale job cuts are difficult but achievable
in India, especially if local governments are supportive. For example, at the end of
the 1990s Tata Motors (formerly Telco) reacted to the failure of its early attempts
to develop a small passenger car by severely rationalizing the supplier base and
cutting jobs by 40 percent.(1) World Bank data suggests that it is becoming easier
to achieve such reorganizations: the reported overstaffing rate in Indian firms
decreased from 10.9 percent to 6.8 percent between 2000 and 2003.(2)
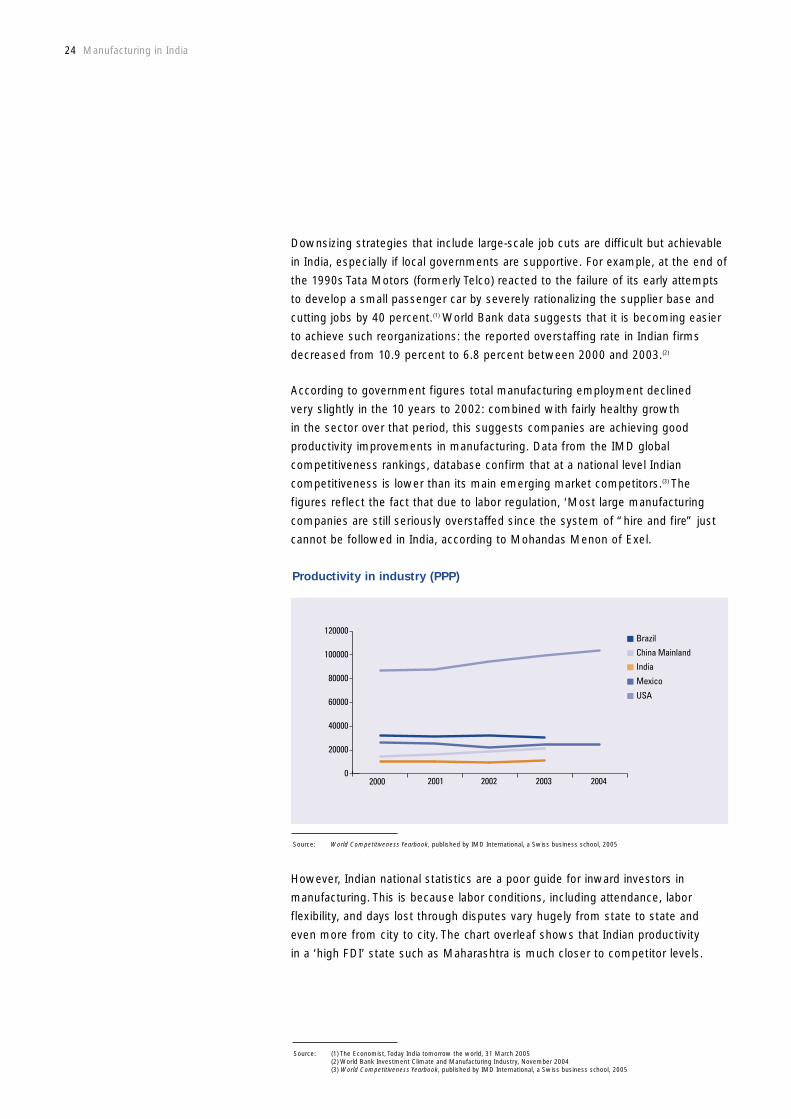
According to government figures total manufacturing employment declined
very slightly in the 10 years to 2002: combined with fairly healthy growth
in the sector over that period, this suggests companies are achieving good
productivity improvements in manufacturing. Data from the IMD global
competitiveness rankings, database confirm that at a national level Indian
competitiveness is lower than its main emerging market competitors.(3) The
figures reflect the fact that due to labor regulation, ‘Most large manufacturing
companies are still seriously overstaffed since the system of “hire and fire” just
cannot be followed in India, according to Mohandas Menon of Exel.
Source: World Competitiveness Yearbook, published by IMD International, a Swiss business school, 2005
Productivity in industry (PPP)
0
20000
40000
60000
80000
100000
120000
2000 2001 2002 2003 2004
Brazil
China Mainland
India
Mexico
USA
However, Indian national statistics are a poor guide for inward investors in
manufacturing. This is because labor conditions, including attendance, labor
flexibility, and days lost through disputes vary hugely from state to state and
even more from city to city. The chart overleaf shows that Indian productivity
in a ‘high FDI’ state such as Maharashtra is much closer to competitor levels.
Source: (1) World Bank Investment Climate and Manufacturing Industry, November 2004
Manufacturing in India 25
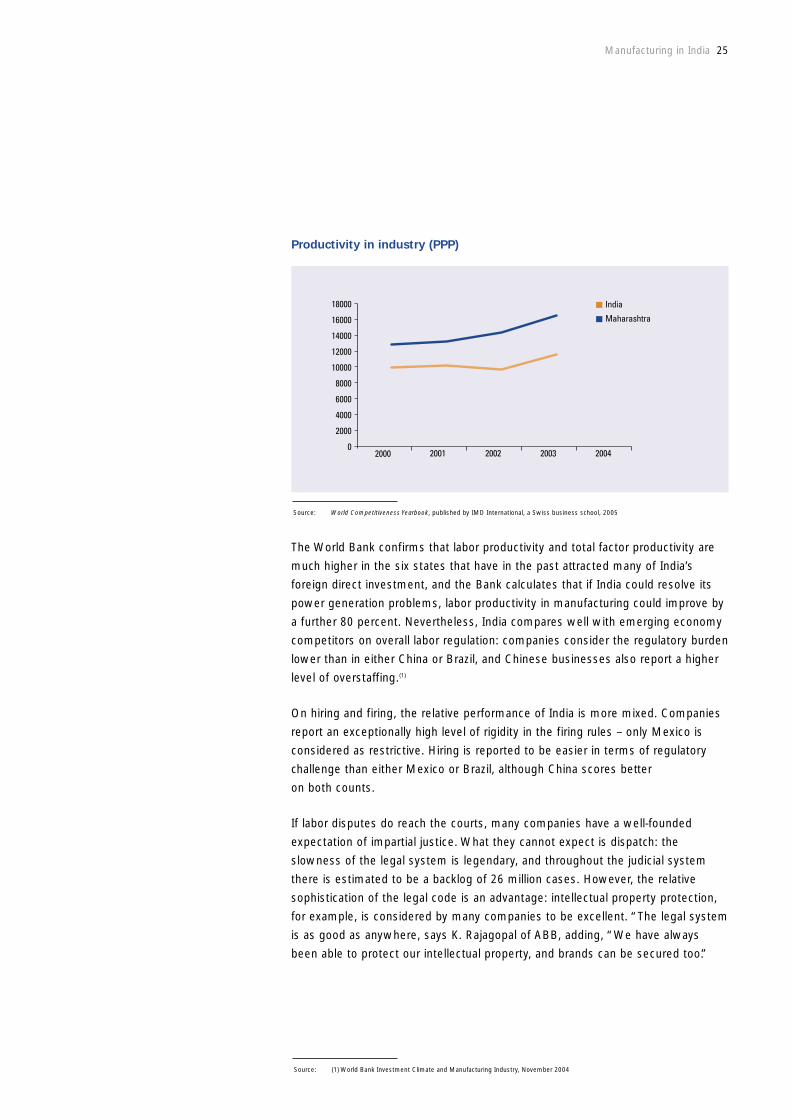
Source: World Competitiveness Yearbook, published by IMD International, a Swiss business school, 2005
Productivity in industry (PPP)
0
2000
4000
6000
8000
10000
12000
14000
16000
18000
2000 2001 2002 2003 2004
India
Maharashtra
The World Bank confirms that labor productivity and total factor productivity are
much higher in the six states that have in the past attracted many of India’s
foreign direct investment, and the Bank calculates that if India could resolve its
power generation problems, labor productivity in manufacturing could improve by
a further 80 percent. Nevertheless, India compares well with emerging economy
competitors on overall labor regulation: companies consider the regulatory burden
lower than in either China or Brazil, and Chinese businesses also report a higher
level of overstaffing.(1)
On hiring and firing, the relative performance of India is more mixed. Companies
report an exceptionally high level of rigidity in the firing rules – only Mexico is
considered as restrictive. Hiring is reported to be easier in terms of regulatory
challenge than either Mexico or Brazil, although China scores better
on both counts.
If labor disputes do reach the courts, many companies have a well-founded
expectation of impartial justice. What they cannot expect is dispatch: the
slowness of the legal system is legendary, and throughout the judicial system
there is estimated to be a backlog of 26 million cases. However, the relative
sophistication of the legal code is an advantage: intellectual property protection,
for example, is considered by many companies to be excellent. “The legal system
is as good as anywhere, says K. Rajagopal of ABB, adding, “We have always
been able to protect our intellectual property, and brands can be secured too.”

Note: (a) http://www.gujaratindustry.gov.in http://www.midcindia.org/ http://www.citcochandigarh.com/about_citco/about_citco.htm http://www.tidco.com
Source: (1) Economists survey, India, 2004(2) World Bank Investment Climate and Manufacturing Industry, November 2004
26 Manufacturing in India
In recent years almost all foreign direct investment in India went to a small
privileged group of states and territories: according to the World Bank's
Investment Climate Report 2004, over 80 percent of FDI in 2000-2003
went to Delhi, Maharashtra, Karnataka, Tamil Nadu, Chandigarh, Gujarat,
and Andhra Pradesh.
Per capita wealth is one factor in this disparity, but by no means the only factor.
For instance, Haryana, Punjab, and West Bengal are all in the top five states by
per capita income, but have in the past attracted relatively little manufacturing
investment.(a)(1)(2) Companies say that state government attitudes, the reliability of
power and water supplies, relative crime rates, and quality of life issues, including
climate, are just as important as wealth levels when it comes to location
decisions. “The fact is that southern India is much safer and more predictable,
and that’s important for companies,” says one Indian analyst.
But investment patterns are changing, say companies. “Other states are catching
up,” says Kuldip Khushoo of Honeywell. “To the list of preferred states I think
you can now add Pondicherry, Goa, and perhaps Arunachal Pradesh. Even in
a communist state like West Bengal they are beginning to attract industry,
because the government there is no longer on the side of the militants.” Mr H.
Gelis of Siemens says his company would also include Haryana state in the list
of preferred locations. And several other companies remark on the resurgence
of West Bengal as an investment location, despite a history of labor militancy:
“Economic logic is now one of the most important issues when it comes
to location decisions,” notes one company. There remain ‘problem states’,
despite official efforts to attract companies with tax and capital incentives.
“If you think of state in North East areas, there is virtually no tax for a lot of
manufacturing operations there,’ says Suhas Kadlaskar of DaimlerChrysler India.
‘But the problem is that tax incentives aren’t really only deciding issues for
companies like ours. The fact is you can’t find the international managerial talent
in those states, there are logistical and infrastructural issues, and these all
outweigh tax incentives.”
Part Three: Location and Market

Manufacturing in India 27
Domestic markets remain untapped
The consumer market is remarkably undeveloped. Consumer goods penetration
is very low compared to other emerging economies, and consumer markets have
the potential to grow rapidly in the coming decade. “We expect a lot of growth
because of the young demographic in India,” says K. Rajagopal of ABB. “This will
create an enormous consumption surge. We think demand will grow between
6-8 percent in the next decade – it will certainly be very different to the last 25
years, that’s for sure.”
India remains a relatively poor country in terms of the proportions of the
population in poverty. According to the Asian Development Bank, around
35 percent of Indians are living on less than U.S.$1 dollar a day. That compares
to just over 16 percent of Chinese, less than 7 percent of Sri Lankans, and less
than 2 percent of Thais.(1) India is still a country of massive wealth disparities,
and faces the challenge of not only increasing its economic growth rate but
of distributing the economic benefits more widely.
Source: The Marketing Whitebook 2003-04 by BusinessWorld
Classes 1994-95 1999-00 2005-06
Rich 1 Million 3 Million 6 Million
(Above Rs.2,15,000) households households households
Consuming 29 Million 66 Million 75 Million
(Rs.45,000-2,15000) households households households
Climbers 48 Million 66 Million 78 Million
(Rs.22,000-45,000) households households households
Aspirants 48 Million 32 Million 33 Million
(Rs.16,000-22,000) households households households
Destitutes 32 Million 24 Million 17 Million
(Less than Rs.16,000) households households households
Source: (1) Asian Development Bank - Key Indicators 2004: Poverty in Asia: Measurement, Estimates, and Prospects
28 Manufacturing in India
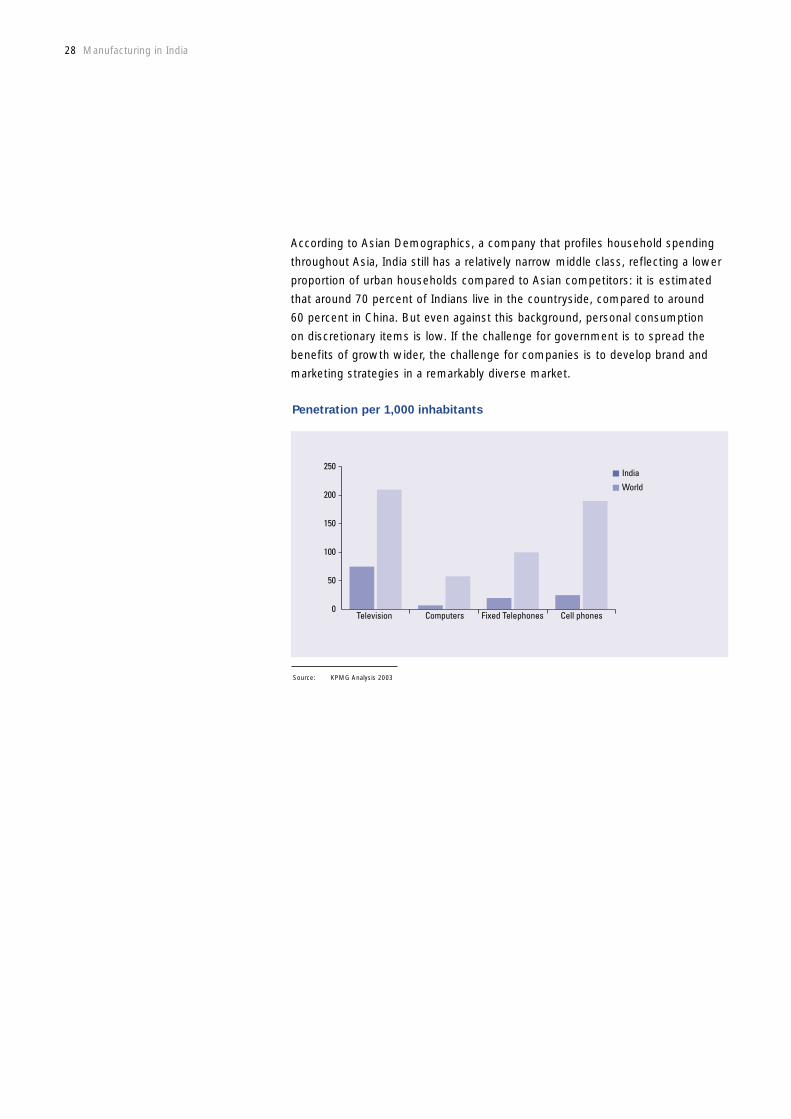
According to Asian Demographics, a company that profiles household spending
throughout Asia, India still has a relatively narrow middle class, reflecting a lower
proportion of urban households compared to Asian competitors: it is estimated
that around 70 percent of Indians live in the countryside, compared to around
60 percent in China. But even against this background, personal consumption
on discretionary items is low. If the challenge for government is to spread the
benefits of growth wider, the challenge for companies is to develop brand and
marketing strategies in a remarkably diverse market.
Source: KPMG Analysis 2003
Penetration per 1,000 inhabitants
0
50
100
150
200
250
Television Computers Fixed Telephones Cell phones
India
World

Manufacturing in India 29
Indian consumers do not follow the consumption patterns seen in other Asian
countries. As Indians have grown richer, they have begun to spend more on
vehicles, phones, and restaurants, according to recent research on consumption
patters by Deutsche Bank.(1) Indians’ discretionary spending is focused outside
the home; unlike other Asian consumers, they have tended not to greatly
increase their spending on clothes, personal care, and household goods.
Source: Carnegie Mellon Electricity Industry Center (CEIC), Deutsche Bank 2003
Changing consumption pattern
0
2
4
6
8
10
12
14
16
1972/73 1977/78 1982/83 1987/88 1997/98 2002/031992/93
Clothing/footwearFurniture, appliances etcMedicalTransport/Comm
% o
f per
sona
l con
sum
ptio
n
Source: (1) India’s Changing Households - Deutsche Bank Nov 2004

Source: (1) India’s Changing Households - Deutsche Bank Nov 2004(2) World Bank Investment Climate and Manufacturing Industry, November 2004
30 Manufacturing in India
India is also unusual in its patterns of urbanization. The population of cities has
been rising absolutely and relative to rural population but at a rather slow rate,
unlike other Asian economies. By 2001 28 percent of Indians were living in
towns, compared to 39 percent of Chinese and 83 percent of South Koreans.
Some smaller Indian towns are actually shrinking, as Indians congregate
increasingly in larger towns, which now account for more than three-quarters
of the urban population.(1)
The World Bank says that the six states and territories that have attracted most
foreign direct investment were also rated as having the best investment climates
on a broad range of measures. Investment is clearly flowing to locations that
yield the best return, irrespective of government attempts to lure investors into
some less attractive states.(2)
“The business environment varies hugely state by state,” says one diversified
manufacturer. “Some states are liberal, and the courts interpret legislation
liberally. In others there is still a highly socialist culture, and the courts are
correspondingly severe.”
But the World Bank’s historical figures conceal a developing trend for companies
to seek new investment locations, as congestion and cost make some traditional
FDI states less attractive.(2) “Like a lot of manufacturers we have a facility
in Bangalore [Maharashtra state],” says one foreign manufacturer, “But we
and other companies are starting to say we are not really happy with the
infrastructure in Bangalore, or the salaries. That’s one reason why we recently
chose Chennai [Tamil Nadu state] for a new investment. Companies are looking
further afield, and making choices based on economics and sustainability.”
Manufacturing in India 31
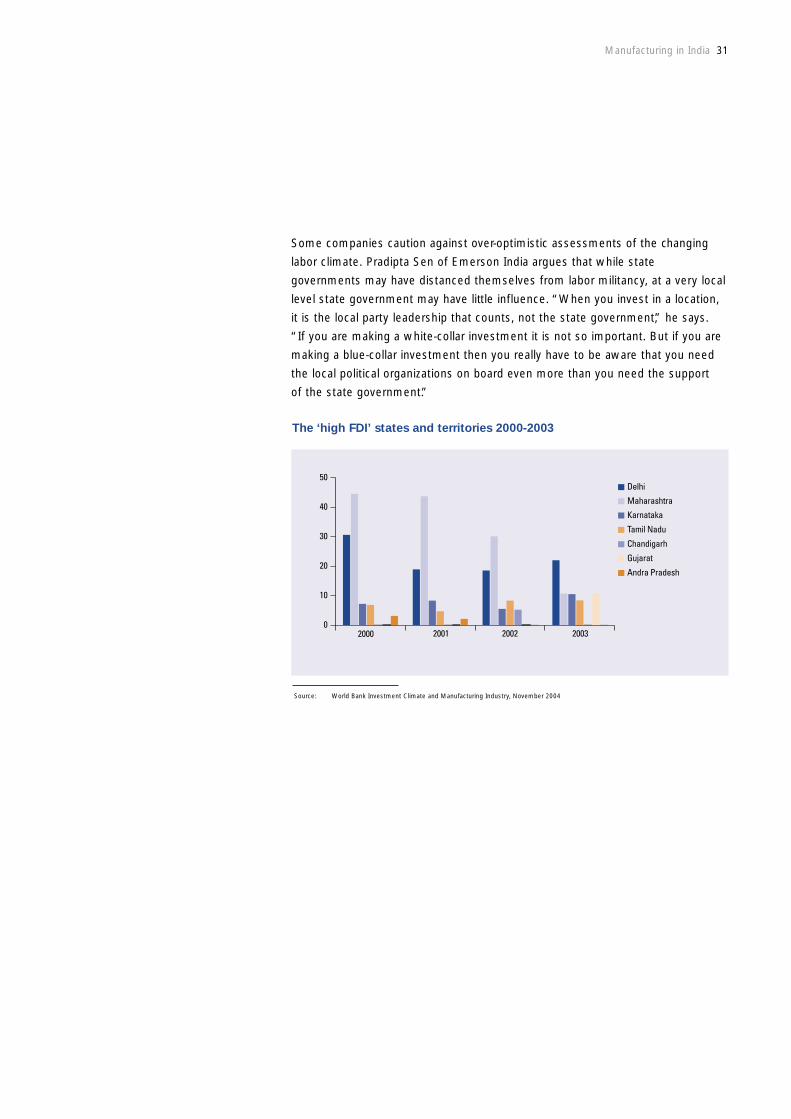
Source: World Bank Investment Climate and Manufacturing Industry, November 2004
The ‘high FDI’ states and territories 2000-2003
0
10
20
30
40
50Delhi
Maharashtra
Karnataka
Tamil Nadu
Chandigarh
Gujarat
Andra Pradesh
2000 2001 2002 2003
Some companies caution against over-optimistic assessments of the changing
labor climate. Pradipta Sen of Emerson India argues that while state
governments may have distanced themselves from labor militancy, at a very local
level state government may have little influence. “When you invest in a location,
it is the local party leadership that counts, not the state government,” he says.
“If you are making a white-collar investment it is not so important. But if you are
making a blue-collar investment then you really have to be aware that you need
the local political organizations on board even more than you need the support
of the state government.”
Jammu & Kashmir
Punjab
HimachalPradesh
Utt
Haryana
Rajasthan
Gujarat
Madhya Pradesh
Maharashtra
Goa
Karnataka
KeralaTamil Nadu
AndhraPradesh
Gandhinagar
Chandigarh
Mumbai
(Bombay)Hyderaba
Bangalore
Chennai
(Madras)
32 Manufacturing in India
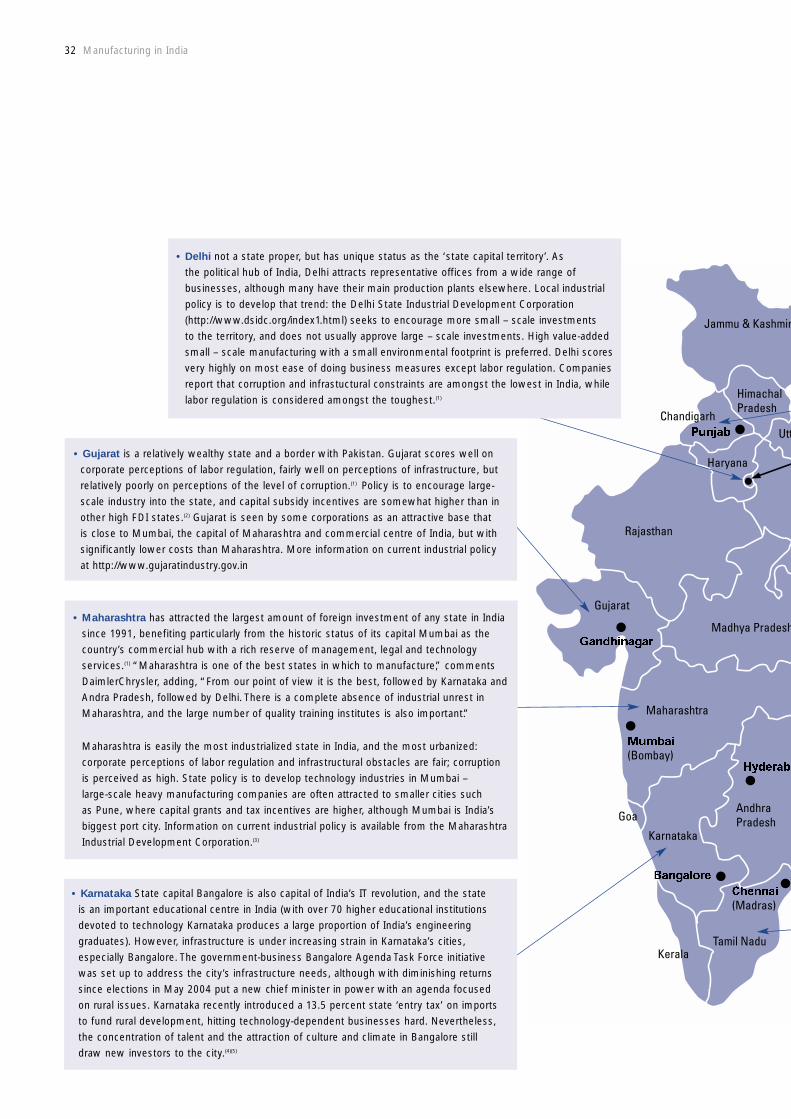
• Maharashtra has attracted the largest amount of foreign investment of any state in Indiasince 1991, benefiting particularly from the historic status of its capital Mumbai as thecountry’s commercial hub with a rich reserve of management, legal and technologyservices.(1) “Maharashtra is one of the best states in which to manufacture,” commentsDaimlerChrysler, adding, “From our point of view it is the best, followed by Karnataka andAndra Pradesh, followed by Delhi. There is a complete absence of industrial unrest inMaharashtra, and the large number of quality training institutes is also important.”
Maharashtra is easily the most industrialized state in India, and the most urbanized:corporate perceptions of labor regulation and infrastructural obstacles are fair; corruptionis perceived as high. State policy is to develop technology industries in Mumbai – large-scale heavy manufacturing companies are often attracted to smaller cities such as Pune, where capital grants and tax incentives are higher, although Mumbai is India’sbiggest port city. Information on current industrial policy is available from the MaharashtraIndustrial Development Corporation.(3)
• Delhi not a state proper, but has unique status as the ‘state capital territory’. Asthe political hub of India, Delhi attracts representative offices from a wide range ofbusinesses, although many have their main production plants elsewhere. Local industrialpolicy is to develop that trend: the Delhi State Industrial Development Corporation(http://www.dsidc.org/index1.html) seeks to encourage more small – scale investments to the territory, and does not usually approve large – scale investments. High value-added small – scale manufacturing with a small environmental footprint is preferred. Delhi scoresvery highly on most ease of doing business measures except labor regulation. Companiesreport that corruption and infrastuctural constraints are amongst the lowest in India, whilelabor regulation is considered amongst the toughest.(1)
• Karnataka State capital Bangalore is also capital of India’s IT revolution, and the state is an important educational centre in India (with over 70 higher educational institutionsdevoted to technology Karnataka produces a large proportion of India’s engineeringgraduates). However, infrastructure is under increasing strain in Karnataka’s cities,especially Bangalore. The government-business Bangalore Agenda Task Force initiative was set up to address the city’s infrastructure needs, although with diminishing returnssince elections in May 2004 put a new chief minister in power with an agenda focused on rural issues. Karnataka recently introduced a 13.5 percent state ‘entry tax’ on importsto fund rural development, hitting technology-dependent businesses hard. Nevertheless, the concentration of talent and the attraction of culture and climate in Bangalore still draw new investors to the city.(4)(5)
• Gujarat is a relatively wealthy state and a border with Pakistan. Gujarat scores well oncorporate perceptions of labor regulation, fairly well on perceptions of infrastructure, butrelatively poorly on perceptions of the level of corruption.(1) Policy is to encourage large-scale industry into the state, and capital subsidy incentives are somewhat higher than inother high FDI states.(2) Gujarat is seen by some corporations as an attractive base that is close to Mumbai, the capital of Maharashtra and commercial centre of India, but withsignificantly lower costs than Maharashtra. More information on current industrial policy at http://www.gujaratindustry.gov.in

r
Delhi
taranchal
UttarPradesh
h
Sikkim
Bihar
Orissa
Chhattisgarh
WestBengal
TripuraMizoram
Manipur
Meghalaya
Araunachal Pradesh
NagalandAssam
ad
Jharkhand
Source: (1) World Bank Investment Climate and Manufacturing Industry, November 2004(2) http://www.gujaratindustry.gov.in(3) http://www.midcindia.org/(4) Economists survey, India, 2004(5) The Economists survey, The Tiger in Front 5 March 2005(6) http://www.citcochandigarh.com/about_citco/about_citco.htm(7) TBC(8) http://www.tidco.com
Manufacturing in India 33
• Chandigarh is a geographically small ‘capital territory’ of less than a million inhabitants,serving as the capital city of three states in north-west India – Punjab, Haryana, andHimachal Pradesh. It owes its position in the list of ‘high FDI’ states to its attractivenessto service companies, especially financial institutions seeking to serve the north-westernstates. The level of manufacturing industry has remained almost static for the last 10 years(only 15 plants are rated by the state government as medium or large scale). Localindustrial policy is focused on attracting IT investment: more information is available from the Chandigarh Industrial Development Corporation.(6)
• Tamil Nadu is one of the two states with an eastern seaboard that score among the topsix ‘high FDI’ states. Among the top six it scores moderately well in terms corporateperception on infrastructure, labor regulation, and corruption, although markedly less thanDelhi or Andrha Pradesh. Foreign investors have located chemicals, textiles, and autoproduction in Tamil Nadu – Hyundai, Ford, for example, is now a significant auto exporterfrom its production plant in the capital city of Chennai, and Nokia recently announcedplans to set up a new manufacturing plant in the state. State policy is to build on theseinvestments, with 10 percent asset investment subsidies available for particular industries,including auto parts and pharmaceuticals. Current policy is available from the Tamil NaduIndustrial Development Corporation.(1)(8)
• Andrha Pradesh is the poorest of the six ‘high FDI’ states, with lower literacy rates,urbanization levels around half the Indian average, and per capita incomes somewhatlower than the average of the top six states. Nevertheless Andrha Pradesh scoresrelatively highly in terms of investment attractiveness, attracting a wide range of industrialinvestments. The reason is that investors report that easier labor regulation, fewerinfrastructure constraints, and lower levels of corruption make the state investment-friendly. Andrha Pradesh has also benefited from a structured and targeted investment policy, with capital subsidies and long-term indirect tax holidays for incoming industries.(1)(4)(7)

34 Manufacturing in India
Source: World Bank Investment Climate and Manufacturing Industry, November 2004
Key issues in the ‘high FDI’ states – percentage of companies rating these
issues as obstacles to growth
0
10
20
30
40
50
60
70
80Delhi
Maharashtra
Karnataka
Tamil Nadu
Gujarat
Andra Pradesh
Labor Corruption Infrastructure
There is also evidence that choice of city is just as important as choice of state.
Data from the World Bank rank cities according to their industrial cost base in
terms of total labor costs, infrastructure-related costs, and real estate. Large
cities with relatively low costs include Ahmedabad, Bangalore, Delhi, Hyderabad,
and Kolkata. High-cost large cities include Indore, Kanpur, Pune, and Vadodara.
The significance of these cost differentials is seen in relative productivity rates:
low-cost cities deliver almost twice the value added per worker than high-cost
cities, despite higher wage rates.(1) However, companies caution that
generalizations about rival locations can be misleading: “In manufacturing
everything really depends on the company, and its level of automation,”
says K. Rajagopal of ABB.
Source: (1) World Bank Investment Climate and Manufacturing Industry, November 2004

Manufacturing in India 35
The infrastructure crisis eases
Weak infrastructure remains a significant cost factor for companies, although
most infrastructure indicators are showing an improving trend.(1) Yet there is little
doubt that infrastructure is top of the agenda for corporate planners. “It’s the
biggest challenge for industry,” says Suhas Kadlaskar of DaimlerChrysler, who
adds, “the problem is that politically the states are often in conflict with the
federal government. That’s why things don’t get done.”
In particular imports are constrained by inadequate facilities at ports of entry
and what in regional terms is a weak transport system – there are barely
2,000 miles of expressway throughout India, and distribution costs are
correspondingly high.(2) Power supply is also a key issue: over 60 percent of
companies rely on private power supplies (although the percentage is falling quite
fast).(1) Data communications, however, are good, especially in technology hub
cities; communications at the national level have been greatly enhanced by
the development of a 53,000-mile nationwide fiber-optic network by
telecommunications giant Reliance.(2) Nevertheless, India remains costly in-terms
of cost per call. It takes longer in India to get connected to the fixed line network
than in either China or Brazil; it takes twice as long to get connected to the
national power grid than in either competitor; and the average inventory time
for major industrial inputs (which reflects customs delays) is significantly higher
(around 32 days for India, compared to around 24 in China and 20 in Brazil).(1)
Source: (1) World Bank Investment Climate and Manufacturing Industry, November 2004(2) Economists survey, India, 2004

36 Manufacturing in India
U.S. cents per kWh of power for industries
Source: Energy Prices and Taxes 1st Quarter 2005
RussiaSouth Korea
U.S.UK
TaiwanPolandMexico
GermanyIndia
Japan
3.15.15.1
5.55.8
66.2
6.58.3
12.2
But according to companies, the most significant direct infrastructure constraint
for manufacturing is the unreliability of power supply. On average a company can
expect nearly 17 significant power outages per month, against one per month in
Malaysia and fewer than five in China. At the same time costs are higher: average
tariffs for industrial use are around U.S.$0.08 per kWh in India, compared with
U.S.$0.05 in South-East Asia. Indian charges vary state by state, being highest
in some of the poorer rural states of the North-East, where industrial prices
cross-subsidize households and farms.(1)
Even in traditional manufacturing states like Maharashtra, power availability is
becoming problematic. “That’s because we’ve had no new power generation
come on-stream for the last three years,” says Kuldip Khushoo of Honeywell.
“We have started facing power outages, so we had to bring in our own diesel
generator sets. In our case our business is not very power intensive, so it doesn’t
affect margins, but for some companies the cost is very significant” Siemens
agrees, saying that in 2005 the company will for the first time have to begin
relying on its own power generation in Maharashtra.
Source: (1) World Bank Investment Climate and Manufacturing Industry, November 2004

Manufacturing in India 37
Transport is another constraint for manufacturers. Companies say there are two
primary sources of cost: delays in distribution and delays in ports. However, there
are striking differences between states in commercial transportation. Companies
in two of the six ‘high FDI’ states report a high level of transport bottlenecks,
with 43 percent or more of businesses considering transport to be an obstacle
to growth in Karnataka and Tamil Nadu. Responses are much more positive in the
other four states: less than 3.5 percent of businesses in Maharashtra, Gujarat,
Andra Pradesh and Delhi consider transport to be an obstacle. All six of the ‘high
FDI’ states experience around the Indian average in customs delays in ports,
from an average of 7.1 days in Karnataka to 9.6 days in Delhi. Commercial freight
transport is moving consistently away from rail and onto the roads. India’s rail
transport system is deteriorating, and the proportions of many categories of
goods transport by rail have halved over the last fifteen years. “We have never
depended on rail,” says Mohandes Menon of Exel, “The problem is not cost,
the problem is the unpredictability of the rail network.” “Roads are getting more
and more important in India,” confirms Indranil Chowdhury, CFO of Volvo India,
who adds, “The current level of road investment is good, and it will greatly
improve our logistics.”(1)
Source: (1) World Bank Investment Climate and Manufacturing Industry, November 2004

38 Manufacturing in India
Transport delays increase the cost of distribution, although companies believe
that other factors contribute to distribution difficulties. “The issues around
domestic distribution by road in India are a mixture of poor road infrastructure,
complex tax structure and lack of large fleet owners and the unavoidable
dependence on the broker community for truck placement”, says Mohandas
Menon of Exel, who argues that India needs transport companies with larger
fleets of trucks to make distribution effective and controllable. But he believes
that the biggest obstacle to efficient distribution is India’s complex indirect tax
system coupled with the routine bureaucracy that adds to the hardships of
moving goods across state borders. Indranil Chowdhury of Volvo agrees, saying,
“At the moment the concept of the regional distribution hub does not exist –
instead there are a lot of small warehouses in every state.” The effect is that
manufacturing investment remains fragmentary, says Pradipta Sen of Emerson
India. “If you have an investment that needs national distribution it may be better
to manufacture in more than one location. But that does lead to added costs – it
means you don’t get the economies of scale at the beginning, and it adds to
management cost.”
“The complicated indirect tax system prevailing in India makes JIT supplies to
manufacturing plants difficult”, says Mohandas Menon of Exel.
Politics as much as money, according to the companies we interviewed is often
at the root of the infrastructural deficit. A large transport project, for example,
might fail to get any further than the drawing board while the state government
and federal government are in opposition. But once state government and federal
government have leading parties in common, the project may progress very fast.
And despite the high costs of telecommunications, power, and transport, it is
notable that according to companies India does not compare badly with either
China or Brazil on these measures.(1)
Source: (1) World Bank Investment Climate and Manufacturing Industry, November 2004

Manufacturing in India 39
Source: World Bank Investment Climate and Manufacturing Industry, November 2004
Infrastructure as an obstacle to growth
0
5
10
15
20
25
30Brazil
China
India
Telecom Electricity Transport
The scope for improving India’s infrastructure is limited by the poor state of public
finances. The combined deficit of the federal and state governments is running
at around 10 percent of GDP, a fact that severely limits spending on long-term
infrastructural improvement.(1) However, federal and state governments are
showing increasing interest in the potential of private-public partnerships in large
transport, power, and water projects, cutting the amount of capital that federal
and state governments have to commit to improving the infrastructure, and
opening new investment opportunities for foreign contractors. The construction
of Bangalore’s new international airport, currently under way, was made possible
by just such a mix of public and private finance. Other projects that are likely
to benefit from such an approach include the ‘Golden Quadrilateral’ project
of highways linking Delhi, Kolkata, Chennai, and Mumbai, which is due for
completion in 2007, and a U.S.$120 billion water management scheme that
is intended to link major rivers and manage India’s crippling pattern of flood
and drought.
Many companies point out that infrastructure difficulties remain critical, yet at
the same time they see a rapid pace of improvement. “For example, Say ten
years back, I never thought that I would see in my lifetime an electronic interface
with the customs the department,’ says Mohandas Menon of Exel. ‘But today
I can at least file the clearance documents electronically and interactively with
the customs. This is real improvement’.
Source: (1) Economists survey, India, 2004
40 Manufacturing in India
India’s auto sector
India’s automotive industry is in some ways typical of the country’s industrial
development. Automaking has a long history in the country, longer than in many
emerging economy competitors – General Motors began assembling Chevrolets
in India in 1928. Industrial development has been stunted by a host of factors:
low growth in spending power, lack of encouragement for foreign investors, and
high indirect taxes have all played a part. Most foreign automakers consider that
it is in the past: the turning point was the government’s decision in 2002
to lift all equity caps for foreign investors in the sector. Other barriers to foreign
manufacturers have also fallen. “There are hardly any important non-tax barriers
now,” says Suhas Kadlaskar of DaimlerChrysler. “Product certification for example
is no longer much of a problem”
India is now the world’s fastest-growing large market for passenger cars, albeit
from a low base.(1) Disposable income is rising fast and, according to research
on consumption patterns by Deutsche Bank, Indian consumers are more strongly
predisposed than other Asian consumers to commit rising incomes to buying
vehicles.(2) India currently has one of the world’s lowest per capita passenger car
ownership rates, with less than six cars per 1,000 people in 2004. The next 10
years are likely to see the market grow dramatically as consumers upgrade
rapidly from motorcycles and three-wheel vehicles: light vehicle sales passed
the one million mark in 2004.
Source: (1) EIU Country Commerce India(2) India’s Changing Households - Deutsche Bank Nov 2004

Manufacturing in India 41
Foreign manufacturers began taking India seriously in the 1990s, and many now
operate as wholly owned subsidiaries, although many are stated as joint ventures
– for example, the biggest manufacturer of passenger cars by market share,
Maruti Udyog, is now wholly controlled by former JV partner Suzuki of Japan.
Maruti, with around 51 percent of the market, is followed by South Korea’s
Hyundai (18 percent) and India’s Tata (16 percent). The remaining seven
companies in the top ten by market share each have less than 3 percent of
the market; only one, Hindustan Motors, is Indian (the others are Ford, Honda,
Fiat, GM’s Opel, Toyota, and Skoda). However, in commercial vehicles Indian
companies dominate: Toyota is the only foreign manufacturer that has
a significant market share in light commercial vehicles, while the truck market
is overwhelmingly dominated by India’s Tata.(1)
There are around 400 auto component manufacturers of size, and a large
proportion of them (some 40 percent) are joint ventures with foreign
manufacturers. (Bosch, Ford, General Motors and a large range of Japanese
manufacturers have joint venture presences in India.)(1) Indranil Chouwdhury
of Volvo believes that the component supplier network is now well developed.
“Whether you use it depends on your volume,” he says. “We import a lot of
components, because it is expensive to develop local partners for a low volume
of components. But the availability is there. The technology is there. It’s just
a question of volume.”
Auto components are increasingly exported from India by manufacturers, says
DaimlerChrysler. The company says, “We don’t export cars, but we do export
components back to Europe, and we have about a 15 percent cost advantage
over European sourced components.”
Source: (1) EIU Country Commerce India

42 Manufacturing in India
The market overall is increasingly competitive. The biggest maker of passenger
cars, Maruti, has seen its share eroded quite sharply in recent years by newer
entrants.(1) Indian competitors are offering a strong challenge to foreign
manufacturers: Tata, for example, is developing a small car to be priced at
Rs100,000, less than half the cost of the lowest-priced passenger car now on the
market. The auto sector is already one of the most significant attractors of FDI in
India, and competition is making it one of the most fiercely contested markets.(2)
Says Indranil Chowdhury of Volvo: “The auto industry in India has really matured.
We are very upbeat about India, because we have been growing fast and we
think we will go on growing fast.”
Source: (1) EIU Country Commerce India(2) Economist Today India tomorrow the world, 31 March 2005

Manufacturing in India 43
Over the last 15 years India has changed much faster than many predicted.
The door to foreign investment is now open, and the ambition to make
investments work is tangible. The task of building an efficient economy remains
an enormous one, but companies agree that, whatever the faults in execution,
India’s policymakers are moving in the right direction.
“There is no problem with industrial policy,” says Khuldip Khushoo of Honeywell.
“Look at what the latest policy documents say – they say we will dismantle the
regulatory system, we will bring in technology, we will upgrade Indian industry.
The policy is really very business-friendly. The question is, does that policy filter
down to the grass roots? Frankly, on that score it could be better.”
Companies tell us that they face myriad operational problems in India, particularly
through restrictive labor regulation, excessive bureaucracy, and a complex web
of indirect taxes that make it much harder than it need be to serve the domestic
market. But these issues have one thing in common: they are improving fast.
It is in the area of infrastructure that some companies doubt that rapid
improvement will be made. “There is improvement, but the pace of improvement
needs to match the rate of growth in the economy,” says Suhas Kadlaskar of
Daimler Chrysler. Another company with diversified manufacturing investments
in consumer and industrial products across India adds that this is the issue
that discourages head offices from committing to India. “Unless infrastructure
is improved significantly people are always going to be hesitant about major
investments – particularly where the business depends on efficient movement
of goods,” the company says.
Conclusion

44 Manufacturing in India
Pradipta Sen of Emerson India agrees. “I see senior executives coming to
India and they can see that the economy is growing, there is a lot of talent,
a lot of entrepreneurship,” he says. “But then they travel. They see the traffic,
the state of the roads. They experience a power cut. Finally they fight their
way back to the airport. And they go away ready to invest somewhere else
where the infrastructure is in place, even if that somewhere else doesn’t have
India’s advantages.”
In practice many companies have developed effective ‘workarounds’ to deal with
India’s infrastructural challenge. “It’s true, all ports are congested in India” says
Indranil Chowdhury of Volvo. “But we find that if you have the right clearing
agents, you can ship cargo.” But decision-makers outside India are often critically
discouraged by the infrastructural deficit. Says one manufacturer headquartered
in Europe: “In many ways the problem is one of convincing people within
the company of the attraction of India. They know we have good people
in India, and access to talent. But they say why should we invest when the
infrastructure is clearly so poor? They don’t necessarily understand the potential.”
Yet as awareness of India’s potential grows, so should the understanding
of the business case for manufacturing investment in India. Some companies
point out that actual returns from Indian investment compare very favorably
with returns from emerging economies where the environment may not appear
quite so challenging.
“What has the invested dollar returned to us in India, compared to say China?”
asks Pradipta Sen of Emerson India. “We have been in India for 25 years,
and 17 years in China. Every dollar we have put into India has earned a very
good return. Every dollar invested in China promises a terrific return, but it
is still only a promise. Investing in India is justified in terms of a solid historical
business case.”
Source: (1) Economists survey, India, 2004(2) The Economists survey, the tiger in front 5 March 2005(3) Asian Development Bank - Key Indicators 2004: Poverty in Asia: Measurement, Estimates, and Prospects
Source: (1) Economists survey, India, 2004(2) The Economists survey, the tiger in front 5 March 2005(3) Asian Development Bank - Key Indicators 2004: Poverty in Asia: Measurement, Estimates,
and Prospects(2) World Bank Global Development Finance 2005, April 2005(3) Deutsche Bank Nov 2004 - India’s Changing Households(1) World Bank Investment Climate and Manufacturing Industry, November 2004(2) IMD Competitiveness Survey 2004(3) EIU Country Commerce India(4) Economist Survey, India, 2004(9) Asian Development Bank Key Indicators 2002: Population and Human Resource trends and
challenges(3) UN World Population Prospects (2004 revision) published by the UN Population Division, the
standard source for global demographic data and forecasts(9) World Competitiveness Yearbook, published by IMD International, a Swiss business school,
2005
Title
kpmg.com
The information contained herein is of a general nature and is not intended to address the circumstances of anyparticular individual or entity. Although we endeavor to provide accurate and timely information, there can be noguarantee that such information is accurate as of the date it is received or that it will continue to be accurate in thefuture. No one should act on such information without appropriate professional advice after a thorough examination ofthe particular situation.
KPMG International is a Swiss cooperative that serves as a coordinating entity for a network of independent memberfirms. KPMG International provides no audit or other client services. Such services are provided solely by memberfirms in their respective geographic areas. KPMG International and its member firms are legally distinct and separateentities. They are not and nothing contained herein shall be construed to place these entities in the relationship ofparents, subsidiaries, agents, partners, or joint venturers. No member firm has any authority (actual, apparent, impliedor otherwise) to obligate or bind KPMG International or any member firm in any manner or vice versa.
©2005 KPMG International. KPMG International is a Swisscooperative of which all KPMG firms are members. KPMGInternational provides no services to clients. Each memberfirm is a separate and independent legal entity and eachdescribes itself as such. All rights reserved.
KPMG and the KPMG logo are registered trademarks ofKPMG International.
Designed and produced by Tugboat
Publication name: Manufacturing in India
Publication number: 211-786
Publication date: June 2005
Contact us
For more information please contact:
Indian Contacts
Ian Gomes
Country Managing DirectorKPMG448 Kamala Mills Compound Senapati Bapat Marg Lower Parel Mumbai Maharashtra 400013 India Tel: +91 22 2491 3030 e-Mail: [email protected]
Yezdi Nagporewalla
National Industries Director, Industrial MarketsKPMG448 Kamala Mills Compound Lower Parel Mumbai Maharashtra 400013 India Tel: +91 22 2491 3030 e-Mail: [email protected]
Sanjay Upendram
KPMG Advisory Services Private Ltd.Wescare Towers16 Cenotaph RoadTeynampetChennai 600018IndiaTel: +91 44 2847 3911e-Mail: [email protected]
Global Contacts
Harald von Heynitz
Global Chair - Industrial & Automotive ProductsGanghoferstrasse 29 D-80339 Munich Germany Tel: +49 89 9282 1201 e-Mail: [email protected]
Oliver Gross
Global Executive - Industrial & Automotive Products Kurfürstendamm 207-208 10719 Berlin Germany Tel: +49 30 2068 4254 e-Mail: [email protected]