Embed Size (px)
Citation preview
The Mechanical Properties of Newly Developed Iron and Nickel-based Hardfacing Alloys for Industrial Applications
A Senior Project
presented to
the Faculty of the Materials Engineering
California Polytechnic State University, San Luis Obispo
In Partial Fulfillment
of the Requirements for the Degree
Bachelor of Science
by
Kristi Lucas
June 11, 2014
© 2014 Kristi Lucas
ii
The Mechanical Properties of Newly Developed Iron and
Nickel-based Hardfacing Alloys for Industrial
Applications
Kristi Lucas
California Polytechnic State University
Materials Engineering Senior Project
Advisor: Professor Blair London
Corporate Sponsor: Scoperta Inc.
June 11, 2014
iii
Acknowledgments
I would like to thank my senior project sponsor Scoperta Inc. for providing funding as well
as the samples to make my project possible. In particular John Madok, Justin Cheney, and
Jonathon Bracci from Scoperta provided me with the technical expertise on their hardfacing alloys
that were tested for strength properties. I would also like to thank my advisor, Dr. Blair London,
who provided weekly deadlines, guidelines and continued support throughout this process.
iv
Abstract
Standard practice in the oil-drilling industry is to weld-deposit a hardfacing layer to the outside of
a tool joint prolonging the life of the tool. These hardfacing layers are iron (steel)-based and
nickel-based alloys. The main applications for the steel-based hardfacing alloys are for hardfacing,
hardbanding, and non-magnetic hardbanding. The nickel-based hardfacing alloy application is a
corrosion resistance weld overlay. Current hardfacing alloys do not have mechanical data due to
the difficultly in producing samples suitable for mechanical testing. Microhardness and three-point
bend testing were done to measure the alloys’ mechanical properties. Samples from six hardfacing
alloys were tested in three different forms: melted ingots, un-notched bend, and notched bend
samples. Six different alloys designations were examined with varying amounts of Fe, B, C, Cr,
Mn, Mo, Nb, Ni, Si, Ti, V, and W. The two main classes of these different alloys are ferritic and
austenitic. Six small arc-welded ingots roughly 1 x 0.5 inches were produced for microhardness
testing. The ferritic steel-based hardfacing alloy was the highest hardness measured at 62.3 HRC.
The austenitic nickel-based hardfacing alloy was the lowest hardness measured at 30.3 HRC.
Three-point bend testing was conducted on two different types of samples: un-notched and
notched. The bend samples were fabricated by weld depositing a hardfacing alloy onto a steel
plate. The thickness was achieved with three layers and three weld beads. Dimensions for the
smooth and notched bend samples were completed with Electro Discharge Machine (EDM) and
the steel base plate was machined off. The results from the three-point bend test highlighted the
un-notched bend samples’ increased strength. There was a correlation between hardness and
strength. The ferritic steel-based hardfacing alloy that was the hardest had the highest bending
strength at 1856 MPa (Modulus of Rupture). The softest austenitic nickel-based hardfacing alloy
had the lowest strength at 1117 MPa. Overall, the hardfacing alloys displayed high strength
values. Scanning Electron Microscopy was employed to examine fracture surfaces to determine
fracture characteristics.
Keywords: Hardfacing alloy, three-point bending, microhardness, weld-deposit, Modulus of
Rupture, Scanning Electron Microscope, Materials Engineering
v
Table of Contents
Introduction.....................................................................................................................................................1
Problem Statement...................................................................................................................................1
Application: Oil Drilling......................................................................................................................... 1
Hardfacing .............................................................................................................................................. 2
Iron-based Hardfacing Alloys............................................................................................................ 3
Nickel-based Hardfacing Alloys.........................................................................................................4
Hardbanding ...........................................................................................................................................5
Welding a Hardfacing Layer...................................................................................................................5
Three-point Bend Test.............................................................................................................................7
Project Justification.................................................................................................................................9
Procedure......................................................................................................................................................10
Three-point Bend Tests..........................................................................................................................10
Sample Preparation & Testing Procedure.........................................................................................10
Scanning Electron Microscope (SEM) Examination.............................................................................13
Sample Preparation ……………………...........................................................................................13
Microhardness .......................................................................................................................................13
Sample Preparation & Testing Procedure.........................................................................................13
Results............................................................................................................................................................14
Three-point Bend Tests..........................................................................................................................14
Scanning Electron Microscope (SEM) ..................................................................................................17
Microhardness .......................................................................................................................................18
Discussion......................................................................................................................................................20
Three-point Bend Tests..........................................................................................................................20
Scanning Electron Microscope (SEM) ..................................................................................................21
Microhardness........................................................................................................................................22
Conclusions....................................................................................................................................................22
References......................................................................................................................................................24
Appendix A....................................................................................................................................................26
Appendix B....................................................................................................................................................28
vi
List of Figures Figure 1: Oil- drilling rig schematic highlighting the drill collar1. …………………………………………1
Figure 2: Corrosion Weld Overlay being applied to a base metal to increase the wear resistance5. ………2
Figure 3: Three weld beads on a base metal drill joint for underground drilling in the oil industry12.……..5
Figure 4: TIG welding schematic for applying hardfacing alloys on a substrate13. ………………………..6
Figure 5: (A) Manual Metal Arc welding schematic and (B) PTA welding schematic for applying hardfacing alloys13. …………………………………………………………………………………………..7
Figure 6: Example of bending under a three- point bend arragnement15. …………………………………..7
Figure 7: Three-point bend sample experiencing compression and tension stresses under a given load16…8
Figure 8: Stress distribution of compression and tension stress can be seen from the red arrows14.………..8
Figure 9: An example of the output of a bend test displaying stress and strain14. ………………………….9
Figure 10: A) Weld-deposit of hardfacing alloy to steel base. B) Dimensions for 3-point bend test samples after cutting process. ………………………………………………………………………………………..11
Figure 11: Notch 3-point test sample schematic. ………………………………………………………….12
Figure 12: Three-point bend test set up for both un-notched and notched samples14. …………………….13
Figure 13: Three-point bend test of un-notched samples. …………………………………………………14
Figure 14: Three-point bend test for notched ferritic samples. ……………………………………………16
Figure 15: Three-point bend test results for austenitic samples. ………………………………………….16
Figure 16: SEM images of the fracture surfaces of the four un-notched samples A) H7 at 2121X magnification B) 350XT at 2117X magnification C) P21-X9 at 2400X magnification and D) P8-X11 at 2000X magnification. ………………………………………………………………………………………18
Figure 17: Box plot for microhardness of all 6 hardfacing alloys. ………………………………………...19
Figure 18: SEM images of the fracture surfaces of the four un-notched samples A) 350XT at 6000X magnification B) H7 at 6131X magnification C) P21-X9 at 3112X magnification and D) P8-X11 at 5154X magnification. ………………………………………………………………………………………………22
Figure 19: SEM image of fracture surface of 350XT alloy at 5000X. ……………………………….…...26
Figure 20: SEM image of fracture surface of H7 alloy at 5054X…………………………….…………...26
Figure 21: SEM image of fracture surface of P21-X9 alloy at 1200X. …………………………………...27
Figure 22: SEM image of fracture surface of P8-X11 alloy at 7135X. …………………………………...27

vii
List of Tables Table I. Compositions and Hardness values for Buildup weld overlay for Iron-based Hardfacing alloys8……………………………………………………………………………………………….4 Table II. Compositions in Weight Percent of Nickel-base Hardfacing Alloys8. …………………….5 Table III. Compositions of the Six Different Hardfacing Alloys for Microhardness and Three-point Bend Testing. ………………………………………………………………………………...………..…10 Table IV. Dimensions of Notched Bend Test Samples. ………………………………………….12 Table V. Summary of Extension and Modulus of Rupture Strength Values for Un-notched samples…………………………………………………………………………..………………...15 Table VI. Summary of Extension and Modulus of Rupture Strength Values for Notched Samples ……………………………………………………………………………………………..………17 Table VII. Mean, Standard Deviation and HRC Values for H7, 350XT, P21-X9, P8-X11, AHB 35, and NS 100 Alloys ……………………………..………………………………………….….…………...19 Table VIII. Comparison of Un-notched and Notched Strength Values for H7, 350XT, P21-X9, and P8-X11 alloys ………………………………………………………………………………….…….…….20 Table VIIII. Microhardness Values for All Six Hardfacing Alloys …………………….…….….28 Table X. HRC Values for All Six Hardfacing Alloy ………………………………………….….28
1
Introduction Problem Statement Hardfacing alloys are commonly used in many applications such as drilling equipment in
oil mining. The hardfacing alloys produced by Scoperta Inc., (San Diego, CA) are designed to be
wear-resistant when encountering abrasive oil sands. The problem is the wear-resistant coatings
are weld-deposited onto the steel drill pipe components and have been known to crack in
neighboring weld beads. Scoperta designs different alloy designations to increase the wear
resistance of the hardfacing alloy in order to address the cracking in the weld beads. The goal of
this project is to evaluate the bend strength of different weld-deposited alloys through three-point
bend testing to measure the modulus of rupture (MOR) and image the fracture surface with a
Scanning Electron Microscope (SEM).
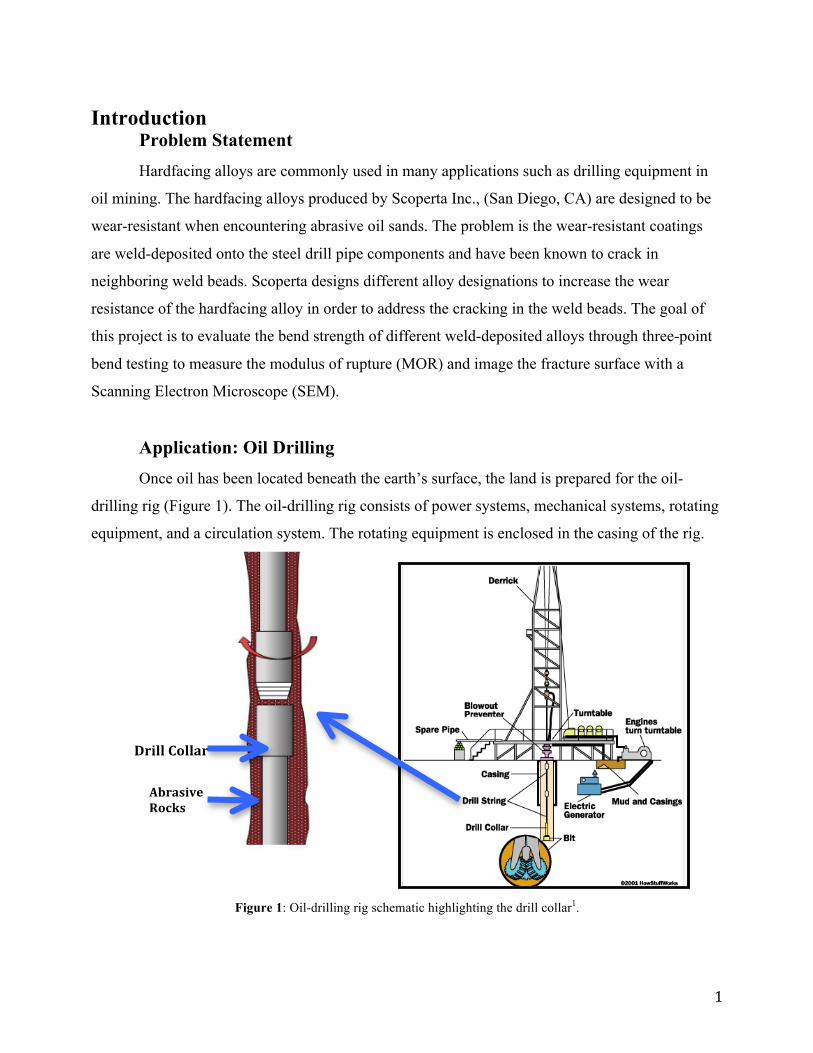
Application: Oil Drilling Once oil has been located beneath the earth’s surface, the land is prepared for the oil-
drilling rig (Figure 1). The oil-drilling rig consists of power systems, mechanical systems, rotating
equipment, and a circulation system. The rotating equipment is enclosed in the casing of the rig.
Figure 1: Oil-drilling rig schematic highlighting the drill collar1.
Drill Collar
Abrasive Rocks
2
The casing in Figure 1 is a large-diameter concrete pipe that lines the drill hole in order to
prevent the hole from collapsing. Within the casing there is a drill string that consists of 10-meter
sections of drill pipes that are connected together. A larger diameter, heavier pipe fits around the
drill pipe called a drill collar1. As the hole becomes deeper, more sections of drill string are
added2. Clogging of the drill bit during the drilling process is prevented with the circulation
system. The drill string and drill collar need to be fabricated from wear-resistant material due to
the abrasive rocks and sands that they encounter in the drilling process.
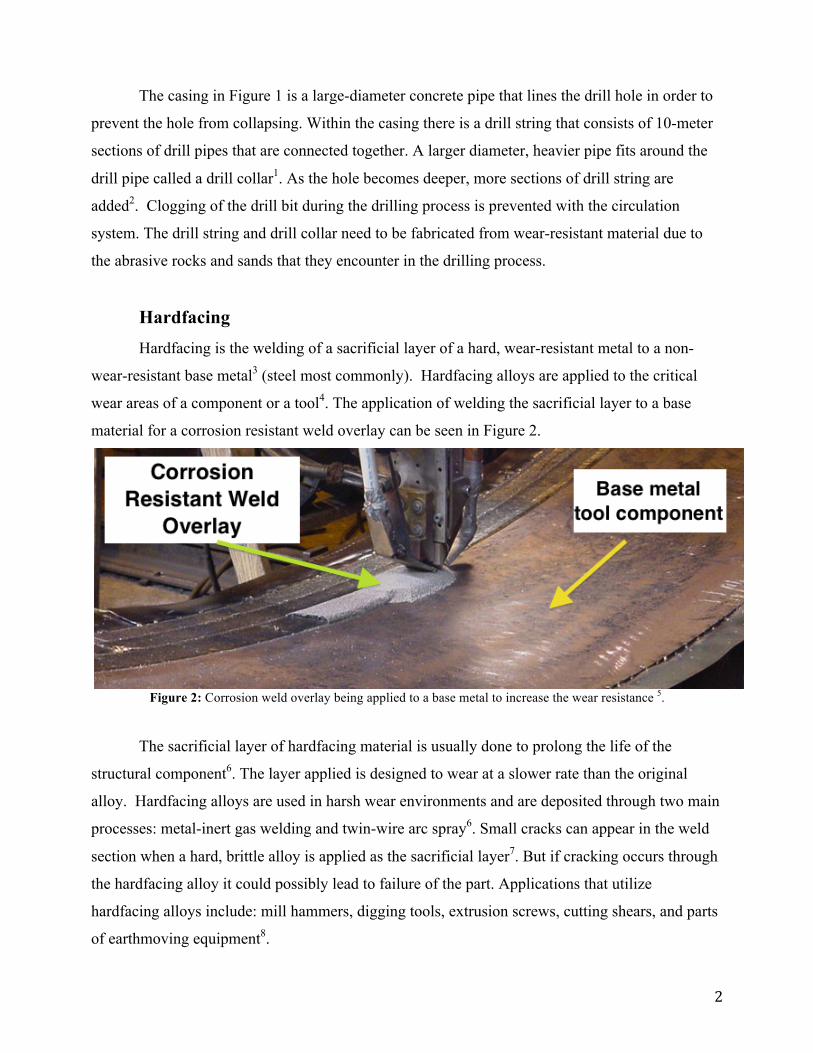
Hardfacing Hardfacing is the welding of a sacrificial layer of a hard, wear-resistant metal to a non-
wear-resistant base metal3 (steel most commonly). Hardfacing alloys are applied to the critical
wear areas of a component or a tool4. The application of welding the sacrificial layer to a base
material for a corrosion resistant weld overlay can be seen in Figure 2.
Figure 2: Corrosion weld overlay being applied to a base metal to increase the wear resistance 5.
The sacrificial layer of hardfacing material is usually done to prolong the life of the
structural component6. The layer applied is designed to wear at a slower rate than the original
alloy. Hardfacing alloys are used in harsh wear environments and are deposited through two main
processes: metal-inert gas welding and twin-wire arc spray6. Small cracks can appear in the weld
section when a hard, brittle alloy is applied as the sacrificial layer7. But if cracking occurs through
the hardfacing alloy it could possibly lead to failure of the part. Applications that utilize
hardfacing alloys include: mill hammers, digging tools, extrusion screws, cutting shears, and parts
of earthmoving equipment8.
3
Conventional hardfacing materials are also referred to as weld overlays9. A weld overlay
can also restore the original dimensions of the component or essentially repair a damaged part.
Weld overlay is different than general welding because it applies a corrosive or hardfacing layer
onto the parent material9. The weld overlay provides protection against corrosion and helps reduce
material wastage on the component, which can reduce the cost of replacing parts frequently due to
wear.
Hardfacing alloys can be differentiated into five general categories, which include: buildup
alloys, metal-to-metal wear alloys, metal-to-earth abrasion alloys, tungsten carbide, and
nonferrous alloys8. On a microstructural level, hardfacing alloys consist of hard phase precipitates.
These hard phase precipitates that form in iron, nickel, or cobalt-base alloy matrices include
borides, carbides, or intermetallics8.
Iron-Base Hardfacing Alloys
Iron-based hardfacing alloys are beneficial due to their low cost and range of properties.
The iron-based hardfacing alloys are divided into different classes depending on the composition.
The main classes are pearlitic steels, austenitic steels, martensitic steels, and high alloy steels8. The
pearlitic steels are considered to be low alloy steels that contain generally less than 0.2% C (Table
I). The weldability of pearlitic steels can be achieved by altering the composition slightly. This
particular group of alloys tends to have low hardness (25 to 37 HRC), high impact resistance, and
excellent weldability. Austenitic steels contain the addition of manganese in order to stabilize it.
This addition of manganese provides the austenitic steels with high strength due to the interaction
of carbon and manganese atoms. In order to only form the austenitic phase, manganese increases
carbon solubility at lower temperatures and promotes carbon supersaturation8. Austenitic steels are
considered to be metastable, which can delay phase transformations when the steel is cooled
slowly or reheated. As a solution, the majority of the austenitic steel is submerged under water
during the welding process in order to keep the part as cool as possible8. Martensitic steels are
engineered to form the martensitic phase on the weld deposit upon normal air-cooling conditions.
Typically, the carbon content can range up to 0.7% for these steels and have a hardness range of
45 to 60 HRC (Table I). Molybdenum, tungsten, nickel, and chromium (up to 12%) are added to
increase hardenability. To increase the weldability of martensitic steels, manganese and silicon are
added8. In mildly corrosive environments, slight modifications to the alloying elements, such as
adding niobium or vanadium, are done to prevent corrosion8.
4
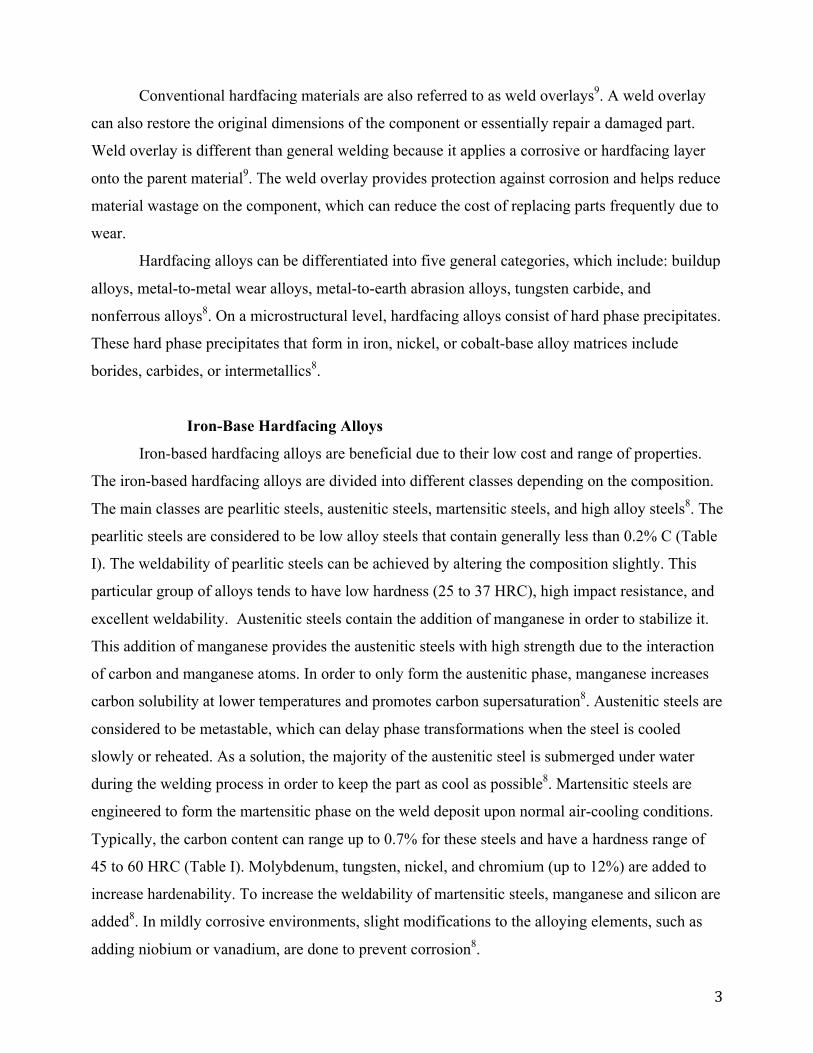
Table I. Compositions and Hardness Values for Buildup Weld Overlay for Iron-Based Hardfacing alloys8
Alloy
Compositions wt%
Fe Cr C Si Mn Mo Ni
Hardness (HRC)
Pearlitic Bal. 2.0 0.1 1.0 1.0 1.5 …
37
Austenitic Bal. 4.0 0.8 1.3 14.0 … 4.0
18
Martensitic Bal. 6.0 0.7 1.0 1.0 1.0 …
59
Nickel-base Hardfacing Alloys
Similar to iron-base hardfacing alloys, nickel-base hardfacing alloys can also be separated
into different groups depending on their alloying elements. The three different groups are boride-
containing alloys, carbide-containing alloys, and Laves phase-containing alloys8. The boride-
containing nickel-base alloys were originally produced as spray-and-fuse powders8. The other
alloying elements besides nickel in this group are chromium, boron, silicon, and carbon. The
boron content can range from 1.5 to 3.5% and up to 16% for chromium content (Table II). The
hardness in the higher chromium alloys can be attributed to the large amount of boron, which
forms hard chromium borides8. The boride-containing nickel-base alloys have the most complex
microstructure out of all the hardfacing alloys. This group of alloys exhibits excellent resistance to
abrasion because of the dispersed borides and carbides in the microstructure8. Another group is the
carbide-containing alloys, an up and coming alternatives to cobalt-base hardfacing alloys. This is
because the nuclear power plants that used cobalt- base hardfacing alloys discovered that they are
a source of highly radioactive 60Co isotope8. Cobalt-base hardfacing alloys were originally
preferred for their high weldability over the carbide-containing nickel-base hardfacing alloys.
Recently, it has been revealed that the carbide-containing nickel-base hardfacing alloys that have
nickel, chromium, molybdenum, cobalt, iron, tungsten, and carbon have better weldability than
before8. The last group of nickel-base hardfacing alloys is Laves phase alloys. These alloys can be
welded easily using gas-tungsten arc welding and have excellent metal-to-metal wear resistance8.
5
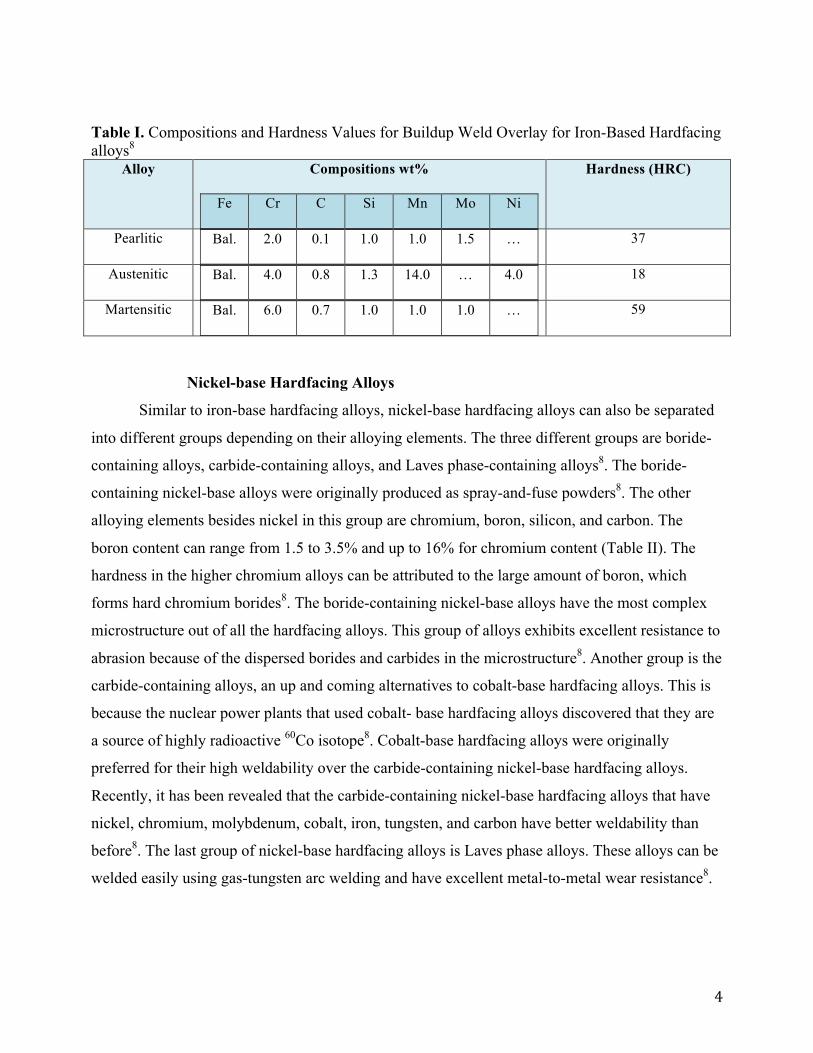
Table II. Compositions in Weight Percent of Nickel-base Hardfacing Alloys8 Alloy Composition wt%
Fe
Cr Mo W Si C B Co Ni
Boride-containing alloys (Alloy 40)
1.5
7.5 … … 3.5 0.3 1.5 … Bal
Carbide-containing alloys (Alloy N-6)
3.0
29.0 5.5 2.0 1.5 1.1 0.6 3.0 Bal
Laves phase containing alloys (T-700)
…
16.0 33.0 … 3.5 … … … Bal
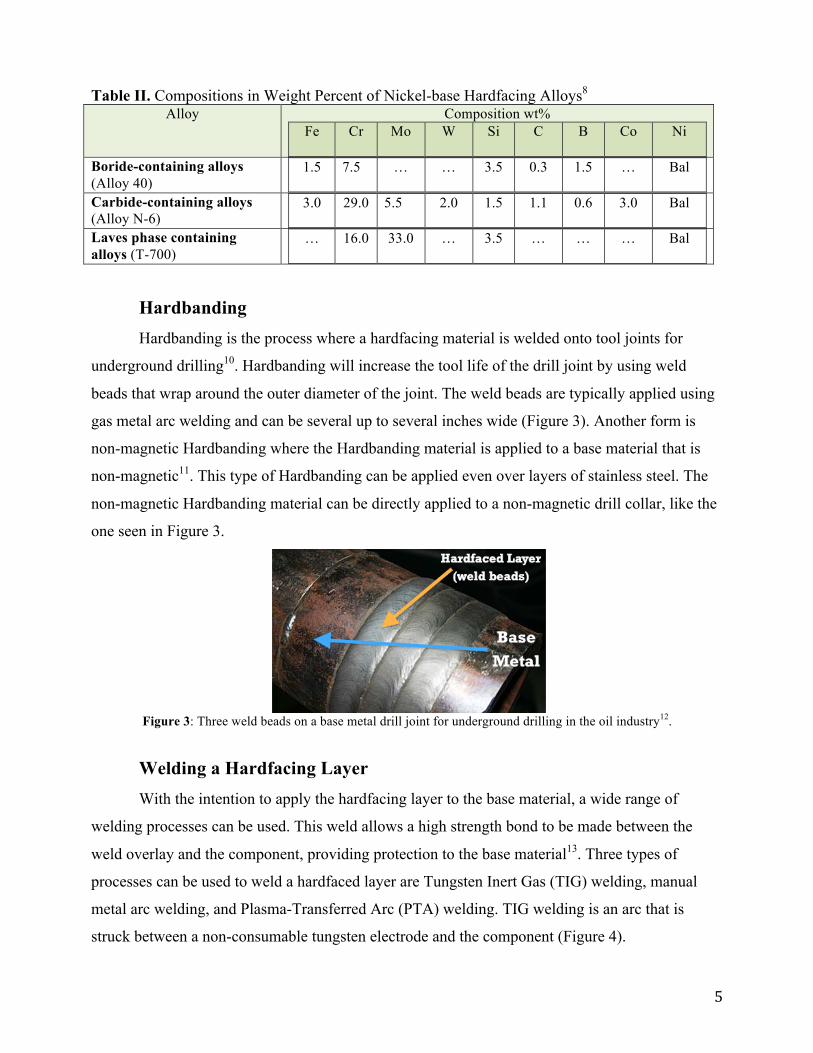
Hardbanding Hardbanding is the process where a hardfacing material is welded onto tool joints for
underground drilling10. Hardbanding will increase the tool life of the drill joint by using weld
beads that wrap around the outer diameter of the joint. The weld beads are typically applied using
gas metal arc welding and can be several up to several inches wide (Figure 3). Another form is
non-magnetic Hardbanding where the Hardbanding material is applied to a base material that is
non-magnetic11. This type of Hardbanding can be applied even over layers of stainless steel. The
non-magnetic Hardbanding material can be directly applied to a non-magnetic drill collar, like the
one seen in Figure 3.
Figure 3: Three weld beads on a base metal drill joint for underground drilling in the oil industry12.
Welding a Hardfacing Layer With the intention to apply the hardfacing layer to the base material, a wide range of
welding processes can be used. This weld allows a high strength bond to be made between the
weld overlay and the component, providing protection to the base material13. Three types of
processes can be used to weld a hardfaced layer are Tungsten Inert Gas (TIG) welding, manual
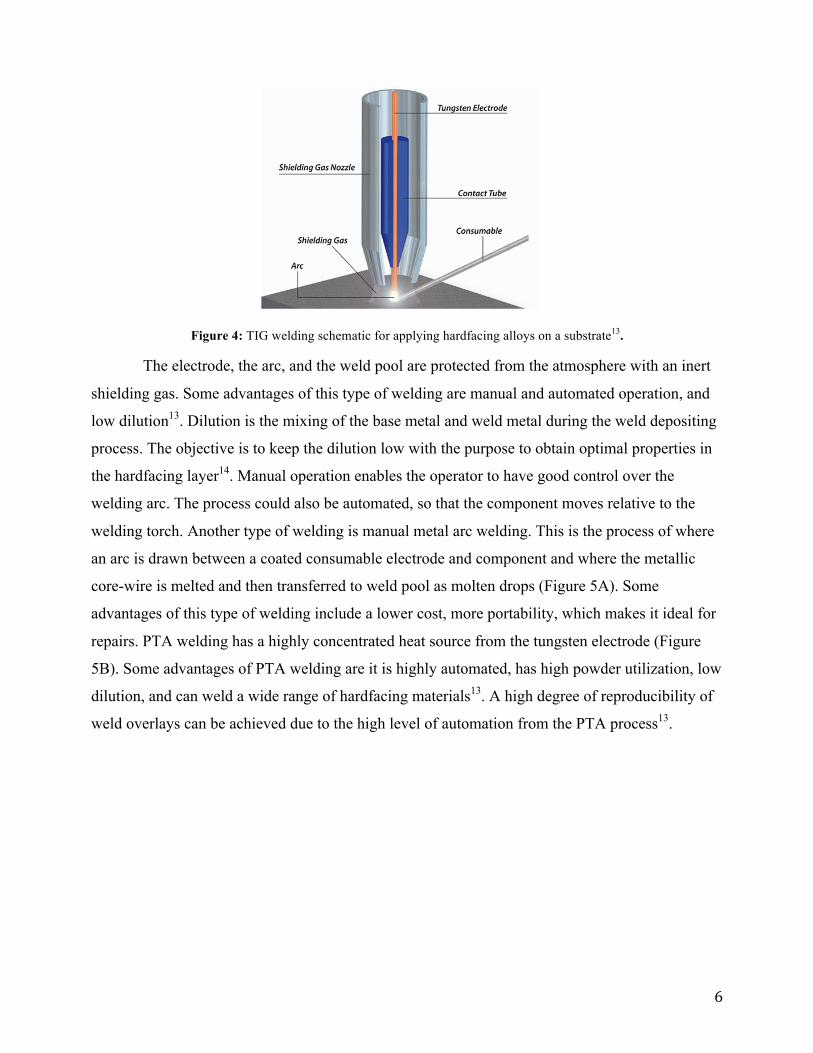
metal arc welding, and Plasma-Transferred Arc (PTA) welding. TIG welding is an arc that is
struck between a non-consumable tungsten electrode and the component (Figure 4).
6
Figure 4: TIG welding schematic for applying hardfacing alloys on a substrate13.
The electrode, the arc, and the weld pool are protected from the atmosphere with an inert
shielding gas. Some advantages of this type of welding are manual and automated operation, and
low dilution13. Dilution is the mixing of the base metal and weld metal during the weld depositing
process. The objective is to keep the dilution low with the purpose to obtain optimal properties in
the hardfacing layer14. Manual operation enables the operator to have good control over the
welding arc. The process could also be automated, so that the component moves relative to the
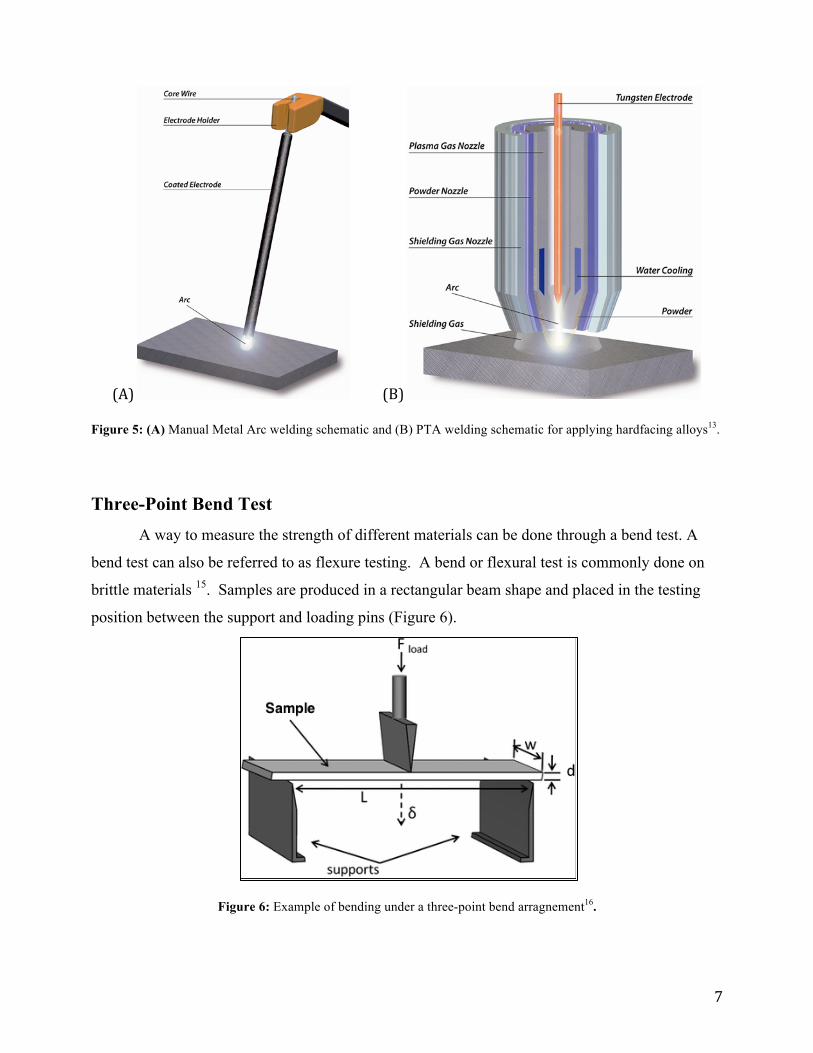
welding torch. Another type of welding is manual metal arc welding. This is the process of where
an arc is drawn between a coated consumable electrode and component and where the metallic
core-wire is melted and then transferred to weld pool as molten drops (Figure 5A). Some
advantages of this type of welding include a lower cost, more portability, which makes it ideal for
repairs. PTA welding has a highly concentrated heat source from the tungsten electrode (Figure
5B). Some advantages of PTA welding are it is highly automated, has high powder utilization, low
dilution, and can weld a wide range of hardfacing materials13. A high degree of reproducibility of
weld overlays can be achieved due to the high level of automation from the PTA process13.
7
(A) (B)
Figure 5: (A) Manual Metal Arc welding schematic and (B) PTA welding schematic for applying hardfacing alloys13.
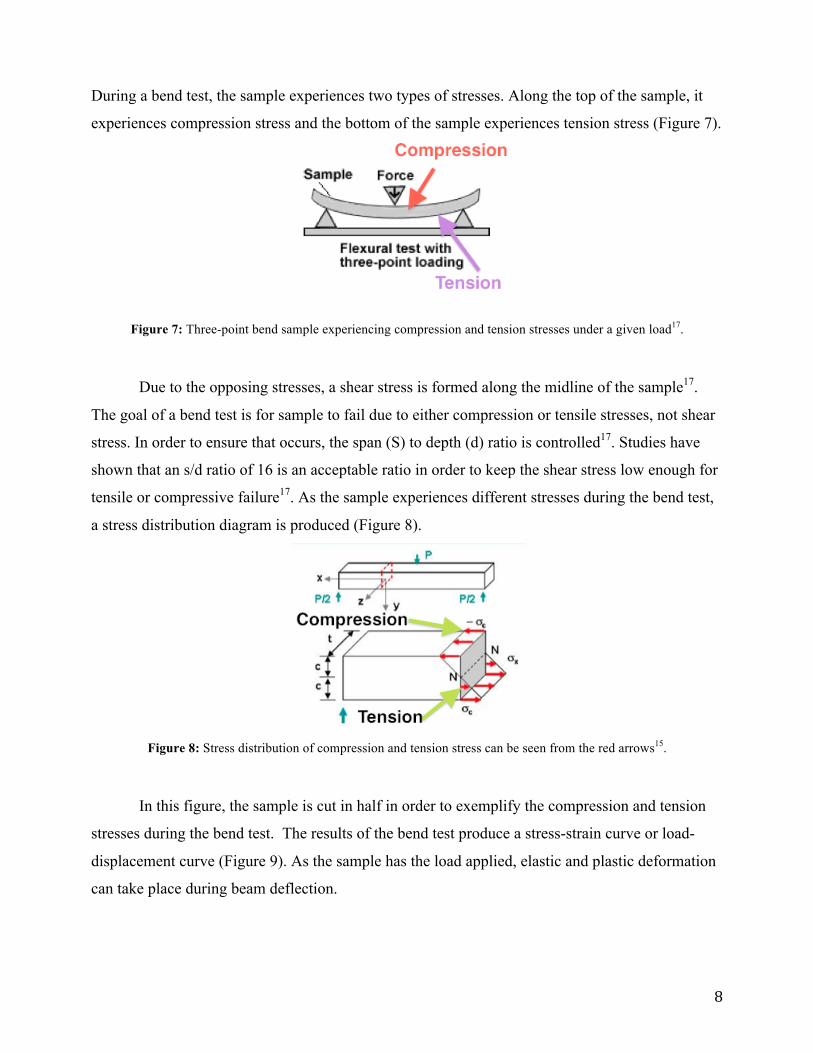
Three-Point Bend Test A way to measure the strength of different materials can be done through a bend test. A
bend test can also be referred to as flexure testing. A bend or flexural test is commonly done on
brittle materials 15. Samples are produced in a rectangular beam shape and placed in the testing
position between the support and loading pins (Figure 6).
Figure 6: Example of bending under a three-point bend arragnement16.
8
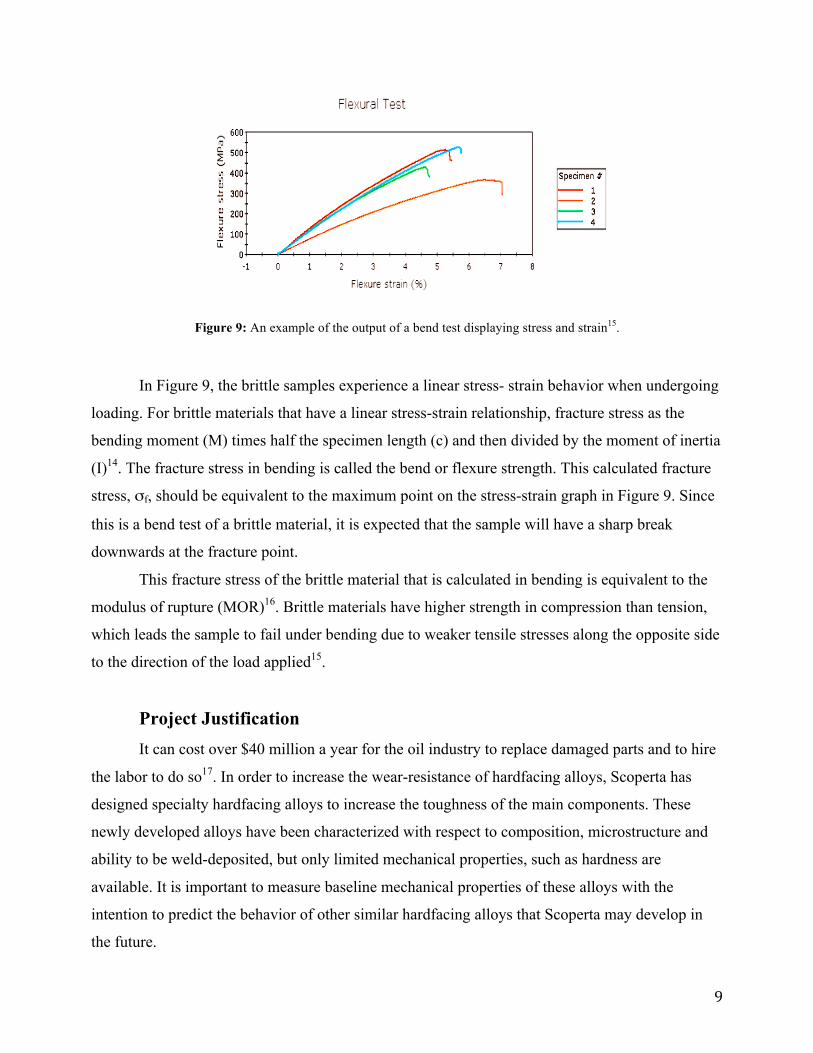
During a bend test, the sample experiences two types of stresses. Along the top of the sample, it
experiences compression stress and the bottom of the sample experiences tension stress (Figure 7).
Figure 7: Three-point bend sample experiencing compression and tension stresses under a given load17.
Due to the opposing stresses, a shear stress is formed along the midline of the sample17.
The goal of a bend test is for sample to fail due to either compression or tensile stresses, not shear
stress. In order to ensure that occurs, the span (S) to depth (d) ratio is controlled17. Studies have
shown that an s/d ratio of 16 is an acceptable ratio in order to keep the shear stress low enough for
tensile or compressive failure17. As the sample experiences different stresses during the bend test,
a stress distribution diagram is produced (Figure 8).
Figure 8: Stress distribution of compression and tension stress can be seen from the red arrows15.
In this figure, the sample is cut in half in order to exemplify the compression and tension
stresses during the bend test. The results of the bend test produce a stress-strain curve or load-
displacement curve (Figure 9). As the sample has the load applied, elastic and plastic deformation
can take place during beam deflection.
9
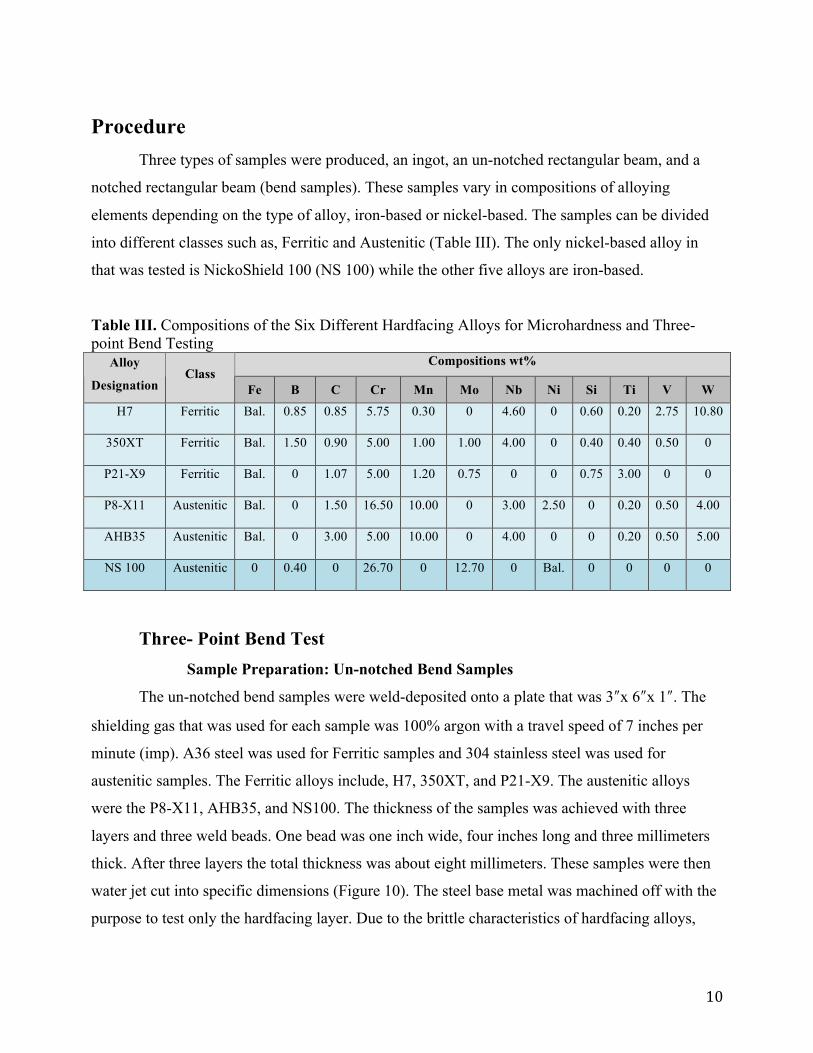
Figure 9: An example of the output of a bend test displaying stress and strain15.
In Figure 9, the brittle samples experience a linear stress- strain behavior when undergoing
loading. For brittle materials that have a linear stress-strain relationship, fracture stress as the
bending moment (M) times half the specimen length (c) and then divided by the moment of inertia
(I)14. The fracture stress in bending is called the bend or flexure strength. This calculated fracture
stress, σf, should be equivalent to the maximum point on the stress-strain graph in Figure 9. Since
this is a bend test of a brittle material, it is expected that the sample will have a sharp break
downwards at the fracture point.
This fracture stress of the brittle material that is calculated in bending is equivalent to the
modulus of rupture (MOR)16. Brittle materials have higher strength in compression than tension,
which leads the sample to fail under bending due to weaker tensile stresses along the opposite side
to the direction of the load applied15.
Project Justification It can cost over $40 million a year for the oil industry to replace damaged parts and to hire
the labor to do so17. In order to increase the wear-resistance of hardfacing alloys, Scoperta has
designed specialty hardfacing alloys to increase the toughness of the main components. These
newly developed alloys have been characterized with respect to composition, microstructure and
ability to be weld-deposited, but only limited mechanical properties, such as hardness are
available. It is important to measure baseline mechanical properties of these alloys with the
intention to predict the behavior of other similar hardfacing alloys that Scoperta may develop in
the future.
10
Procedure Three types of samples were produced, an ingot, an un-notched rectangular beam, and a
notched rectangular beam (bend samples). These samples vary in compositions of alloying
elements depending on the type of alloy, iron-based or nickel-based. The samples can be divided
into different classes such as, Ferritic and Austenitic (Table III). The only nickel-based alloy in
that was tested is NickoShield 100 (NS 100) while the other five alloys are iron-based.
Table III. Compositions of the Six Different Hardfacing Alloys for Microhardness and Three-point Bend Testing
Compositions wt% Alloy
Designation Class
Fe B C Cr Mn Mo Nb Ni Si Ti V W H7 Ferritic Bal. 0.85 0.85 5.75 0.30 0 4.60 0 0.60 0.20 2.75 10.80
350XT Ferritic Bal. 1.50 0.90 5.00 1.00 1.00 4.00 0 0.40 0.40 0.50 0
P21-X9 Ferritic Bal. 0 1.07 5.00 1.20 0.75 0 0 0.75 3.00 0 0
P8-X11 Austenitic Bal. 0 1.50 16.50 10.00 0 3.00 2.50 0 0.20 0.50 4.00
AHB35 Austenitic Bal. 0 3.00 5.00 10.00 0 4.00 0 0 0.20 0.50 5.00
NS 100 Austenitic 0 0.40 0 26.70 0 12.70 0 Bal. 0 0 0 0
Three- Point Bend Test Sample Preparation: Un-notched Bend Samples
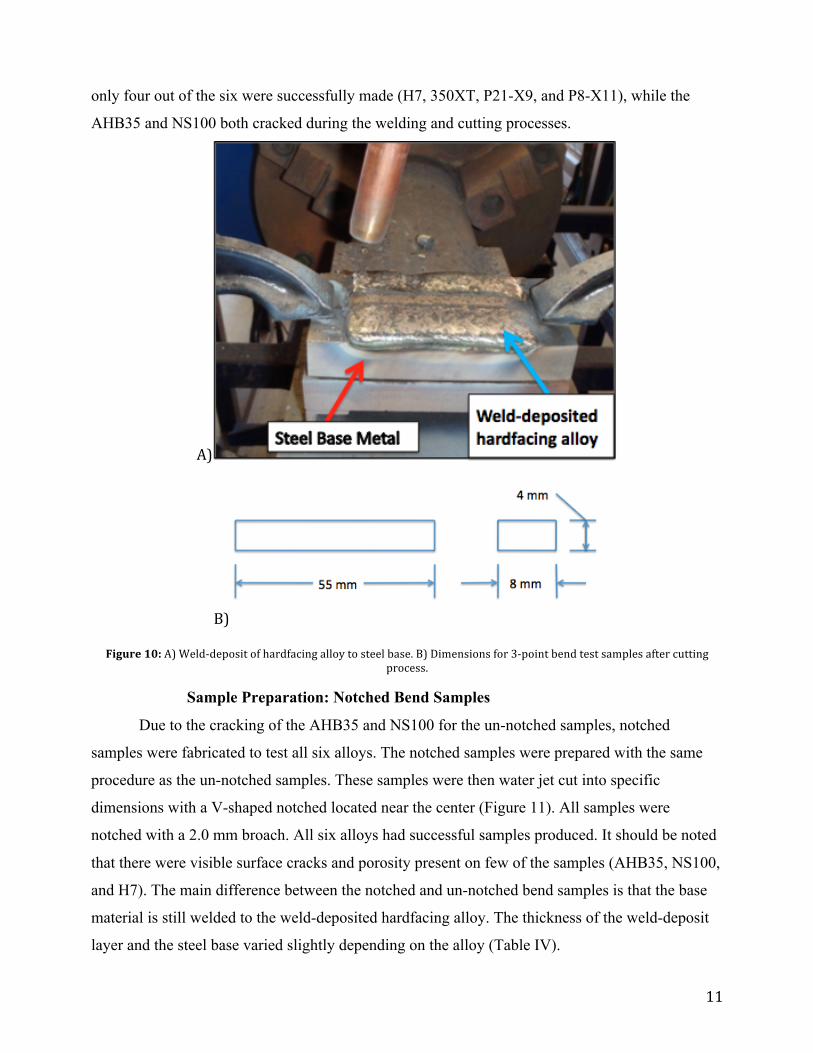
The un-notched bend samples were weld-deposited onto a plate that was 3ʺ″x 6ʺ″x 1ʺ″. The
shielding gas that was used for each sample was 100% argon with a travel speed of 7 inches per
minute (imp). A36 steel was used for Ferritic samples and 304 stainless steel was used for
austenitic samples. The Ferritic alloys include, H7, 350XT, and P21-X9. The austenitic alloys
were the P8-X11, AHB35, and NS100. The thickness of the samples was achieved with three
layers and three weld beads. One bead was one inch wide, four inches long and three millimeters
thick. After three layers the total thickness was about eight millimeters. These samples were then
water jet cut into specific dimensions (Figure 10). The steel base metal was machined off with the
purpose to test only the hardfacing layer. Due to the brittle characteristics of hardfacing alloys,
11
only four out of the six were successfully made (H7, 350XT, P21-X9, and P8-X11), while the
AHB35 and NS100 both cracked during the welding and cutting processes.
A)
B)
Figure 10: A) Weld-‐deposit of hardfacing alloy to steel base. B) Dimensions for 3-‐point bend test samples after cutting process.
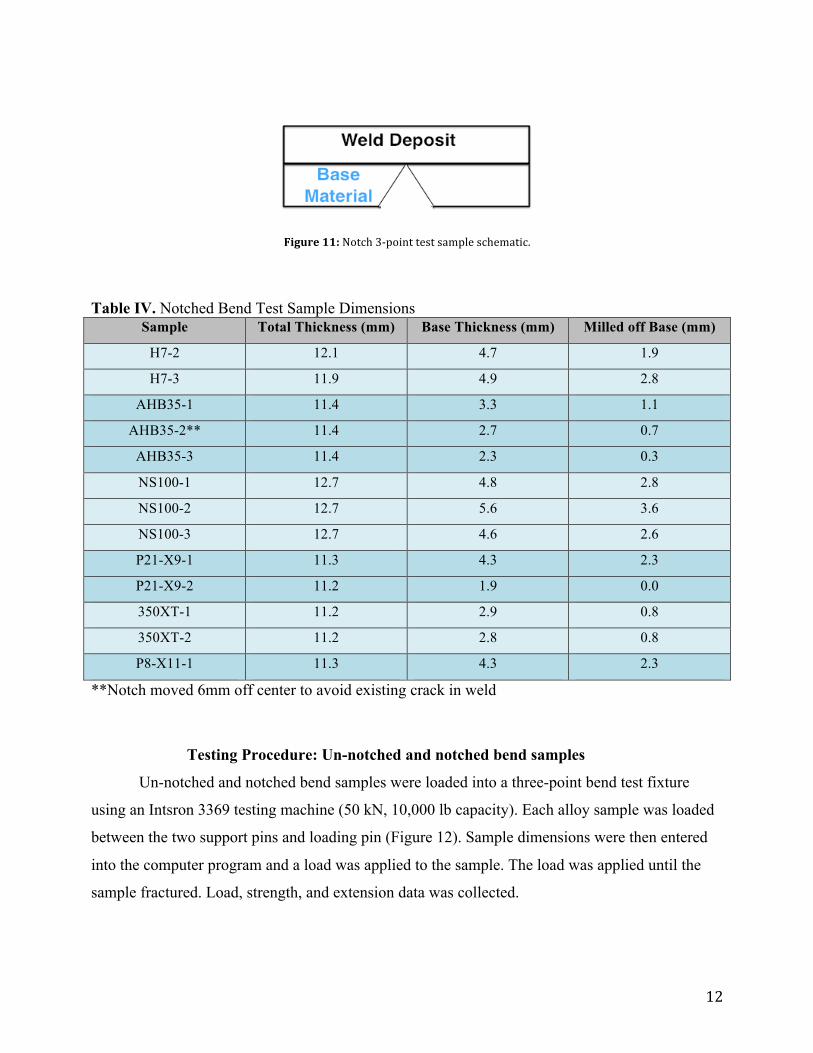
Sample Preparation: Notched Bend Samples
Due to the cracking of the AHB35 and NS100 for the un-notched samples, notched
samples were fabricated to test all six alloys. The notched samples were prepared with the same
procedure as the un-notched samples. These samples were then water jet cut into specific
dimensions with a V-shaped notched located near the center (Figure 11). All samples were
notched with a 2.0 mm broach. All six alloys had successful samples produced. It should be noted
that there were visible surface cracks and porosity present on few of the samples (AHB35, NS100,
and H7). The main difference between the notched and un-notched bend samples is that the base
material is still welded to the weld-deposited hardfacing alloy. The thickness of the weld-deposit
layer and the steel base varied slightly depending on the alloy (Table IV).
12
Figure 11: Notch 3-‐point test sample schematic.
Table IV. Notched Bend Test Sample Dimensions
Sample Total Thickness (mm) Base Thickness (mm) Milled off Base (mm)
H7-2 12.1 4.7 1.9
H7-3 11.9 4.9 2.8
AHB35-1 11.4 3.3 1.1
AHB35-2** 11.4 2.7 0.7
AHB35-3 11.4 2.3 0.3
NS100-1 12.7 4.8 2.8
NS100-2 12.7 5.6 3.6
NS100-3 12.7 4.6 2.6
P21-X9-1 11.3 4.3 2.3
P21-X9-2 11.2 1.9 0.0
350XT-1 11.2 2.9 0.8
350XT-2 11.2 2.8 0.8
P8-X11-1 11.3 4.3 2.3
**Notch moved 6mm off center to avoid existing crack in weld
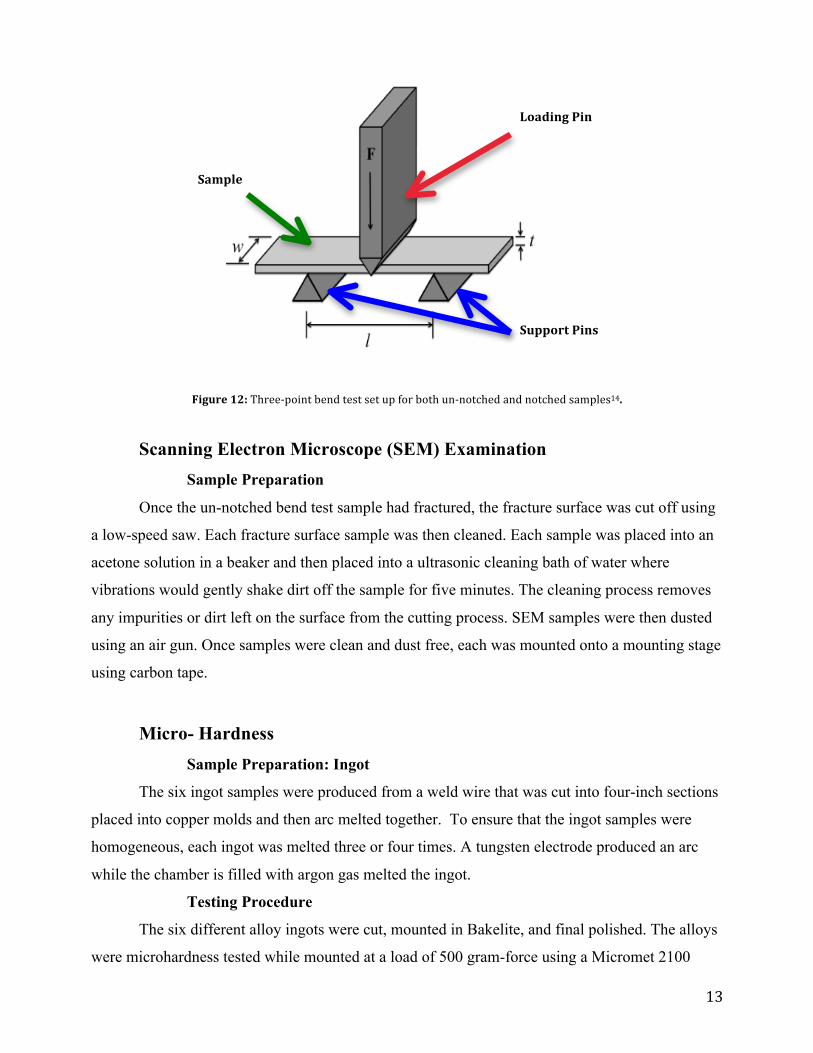
Testing Procedure: Un-notched and notched bend samples
Un-notched and notched bend samples were loaded into a three-point bend test fixture
using an Intsron 3369 testing machine (50 kN, 10,000 lb capacity). Each alloy sample was loaded
between the two support pins and loading pin (Figure 12). Sample dimensions were then entered
into the computer program and a load was applied to the sample. The load was applied until the
sample fractured. Load, strength, and extension data was collected.
13
Figure 12: Three-‐point bend test set up for both un-‐notched and notched samples14.
Scanning Electron Microscope (SEM) Examination Sample Preparation
Once the un-notched bend test sample had fractured, the fracture surface was cut off using
a low-speed saw. Each fracture surface sample was then cleaned. Each sample was placed into an
acetone solution in a beaker and then placed into a ultrasonic cleaning bath of water where
vibrations would gently shake dirt off the sample for five minutes. The cleaning process removes
any impurities or dirt left on the surface from the cutting process. SEM samples were then dusted
using an air gun. Once samples were clean and dust free, each was mounted onto a mounting stage
using carbon tape.
Micro- Hardness Sample Preparation: Ingot
The six ingot samples were produced from a weld wire that was cut into four-inch sections
placed into copper molds and then arc melted together. To ensure that the ingot samples were
homogeneous, each ingot was melted three or four times. A tungsten electrode produced an arc
while the chamber is filled with argon gas melted the ingot.
Testing Procedure
The six different alloy ingots were cut, mounted in Bakelite, and final polished. The alloys
were microhardness tested while mounted at a load of 500 gram-force using a Micromet 2100
Loading Pin
Sample
Support Pins
14
Series microhardness testing machine. The alloys were tested in ten random locations along the
longitudinal direction. The values were recorded from measuring the length each of the diagonals
from the pyramid shape of the indenter. The values were measured in Vickers and converted to
HRC.
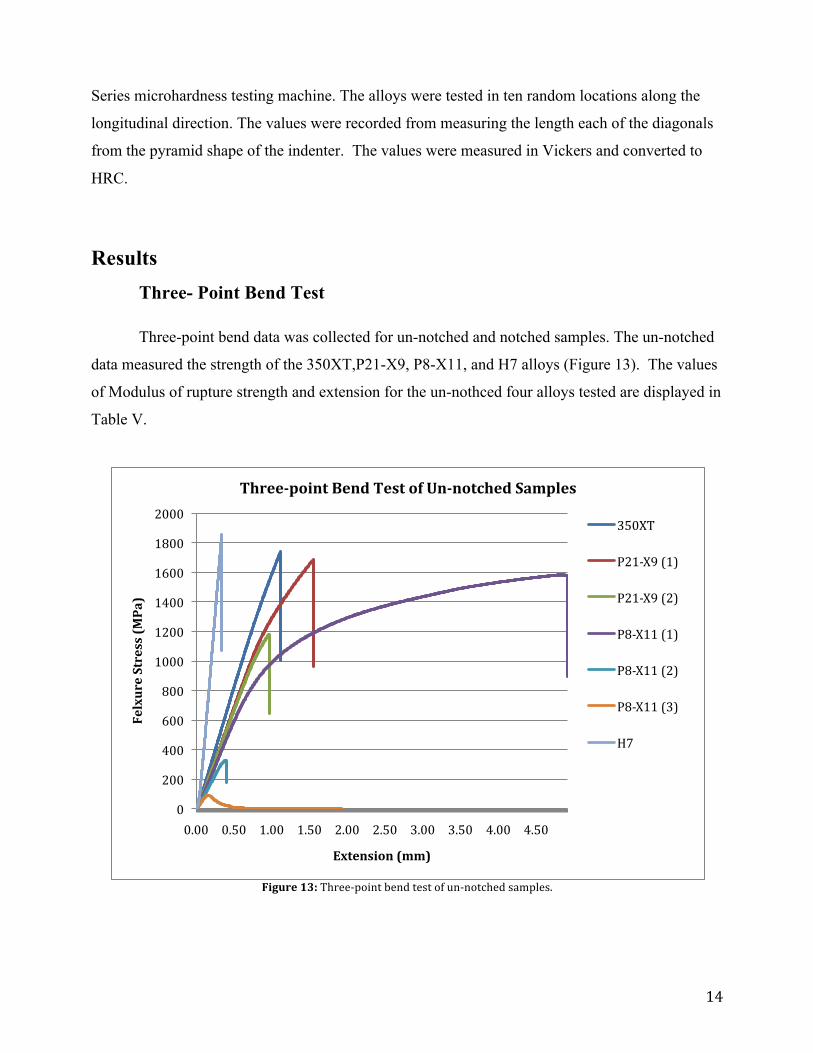
Results Three- Point Bend Test
Three-point bend data was collected for un-notched and notched samples. The un-notched
data measured the strength of the 350XT,P21-X9, P8-X11, and H7 alloys (Figure 13). The values
of Modulus of rupture strength and extension for the un-nothced four alloys tested are displayed in
Table V.
Figure 13: Three-‐point bend test of un-‐notched samples.
0
200
400
600
800
1000
1200
1400
1600
1800
2000
0.00 0.50 1.00 1.50 2.00 2.50 3.00 3.50 4.00 4.50
Felxure Stress (MPa)
Extension (mm)
Three-point Bend Test of Un-notched Samples
350XT
P21-‐X9 (1)
P21-‐X9 (2)
P8-‐X11 (1)
P8-‐X11 (2)
P8-‐X11 (3)
H7
15
Table V. Summary of Extension and Modulus of Rupture Strength Values for Un-notched Samples Alloy Designation Extension at Maximum Stress
(mm)
Modulus of Rupture Strength (MPa)
H7 0.30 1856
350XT 1.10 1739
P21-X9 (1) 1.53 1686
P21-X9 (2) 0.95 1182
P8-X11 (1) 4.86 1583
P8-X11 (2) 0.37 328
P8-X11 (3) 0.15 91.5
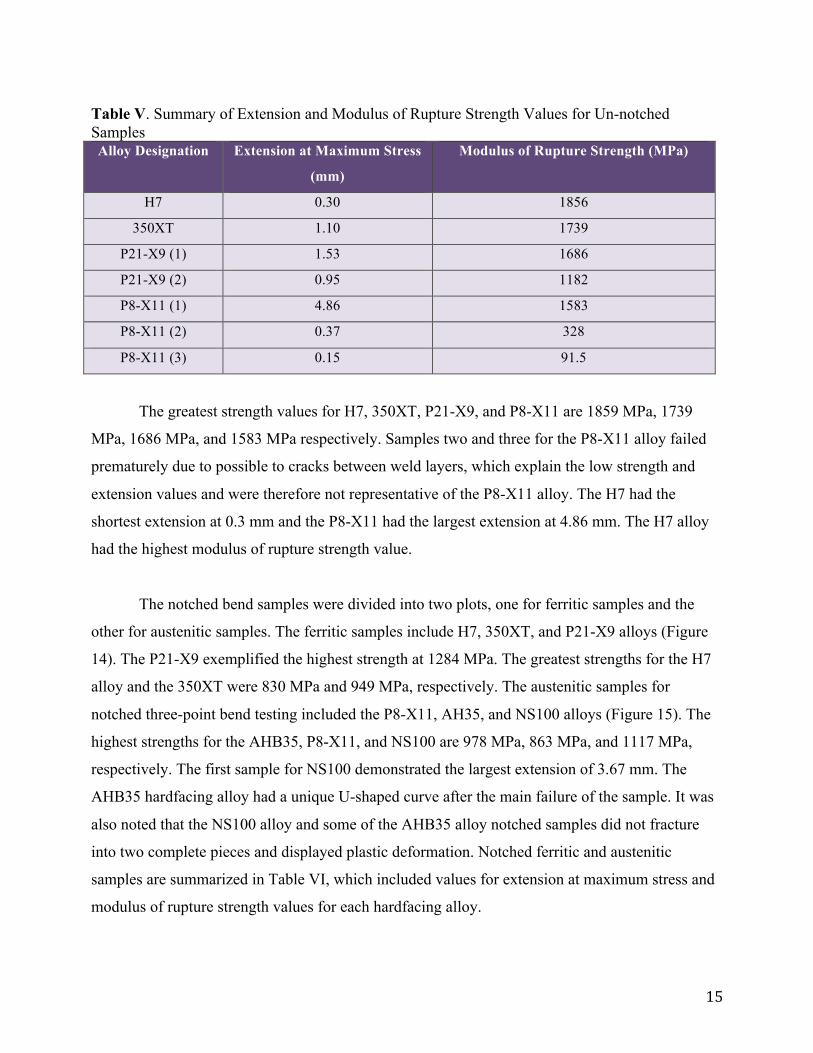
The greatest strength values for H7, 350XT, P21-X9, and P8-X11 are 1859 MPa, 1739
MPa, 1686 MPa, and 1583 MPa respectively. Samples two and three for the P8-X11 alloy failed
prematurely due to possible to cracks between weld layers, which explain the low strength and
extension values and were therefore not representative of the P8-X11 alloy. The H7 had the
shortest extension at 0.3 mm and the P8-X11 had the largest extension at 4.86 mm. The H7 alloy
had the highest modulus of rupture strength value.
The notched bend samples were divided into two plots, one for ferritic samples and the
other for austenitic samples. The ferritic samples include H7, 350XT, and P21-X9 alloys (Figure
14). The P21-X9 exemplified the highest strength at 1284 MPa. The greatest strengths for the H7
alloy and the 350XT were 830 MPa and 949 MPa, respectively. The austenitic samples for
notched three-point bend testing included the P8-X11, AH35, and NS100 alloys (Figure 15). The
highest strengths for the AHB35, P8-X11, and NS100 are 978 MPa, 863 MPa, and 1117 MPa,
respectively. The first sample for NS100 demonstrated the largest extension of 3.67 mm. The
AHB35 hardfacing alloy had a unique U-shaped curve after the main failure of the sample. It was
also noted that the NS100 alloy and some of the AHB35 alloy notched samples did not fracture
into two complete pieces and displayed plastic deformation. Notched ferritic and austenitic
samples are summarized in Table VI, which included values for extension at maximum stress and
modulus of rupture strength values for each hardfacing alloy.

16
Figure 14: Three-‐point bend test for notched ferritic samples.
Figure 15: Three-‐point bend test results for notched austenitic samples.
0
200
400
600
800
1000
1200
1400
0.00 0.13 0.25 0.38 0.50 0.63 0.75 0.88 1.00 1.13
Flexure Stress (MPa)
Extension (mm)
Three-point Bend Test for Notched Ferritic Samples
H7 (1)
H7 (2)
350XT (1)
350XT (2)
P21-‐X9 (1)
P21-‐X9 (2)
0
200
400
600
800
1000
1200
0.00 0.49 0.97 1.46 1.94 2.43 2.91 3.40
Flexure Stress (MPa)
Extension (mm)
Three-point Bend Test for Notched Austenitic Samples
AHB35 (1)
AHB35 (2)
AHB35 (3)
NS100 (1)
NS100 (2)
NS100 (3)
P8-‐X11 (1)
17
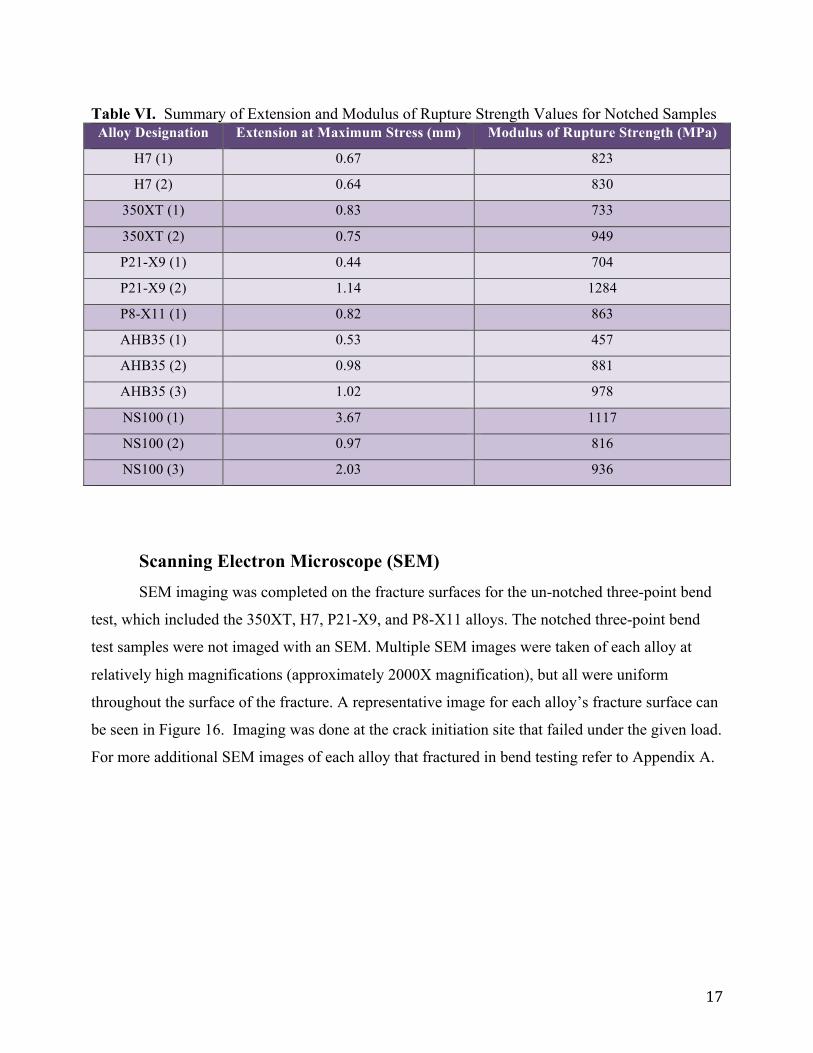
Table VI. Summary of Extension and Modulus of Rupture Strength Values for Notched Samples Alloy Designation Extension at Maximum Stress (mm) Modulus of Rupture Strength (MPa)
H7 (1) 0.67 823
H7 (2) 0.64 830
350XT (1) 0.83 733
350XT (2) 0.75 949
P21-X9 (1) 0.44 704
P21-X9 (2) 1.14 1284
P8-X11 (1) 0.82 863
AHB35 (1) 0.53 457
AHB35 (2) 0.98 881
AHB35 (3) 1.02 978
NS100 (1) 3.67 1117
NS100 (2) 0.97 816
NS100 (3) 2.03 936
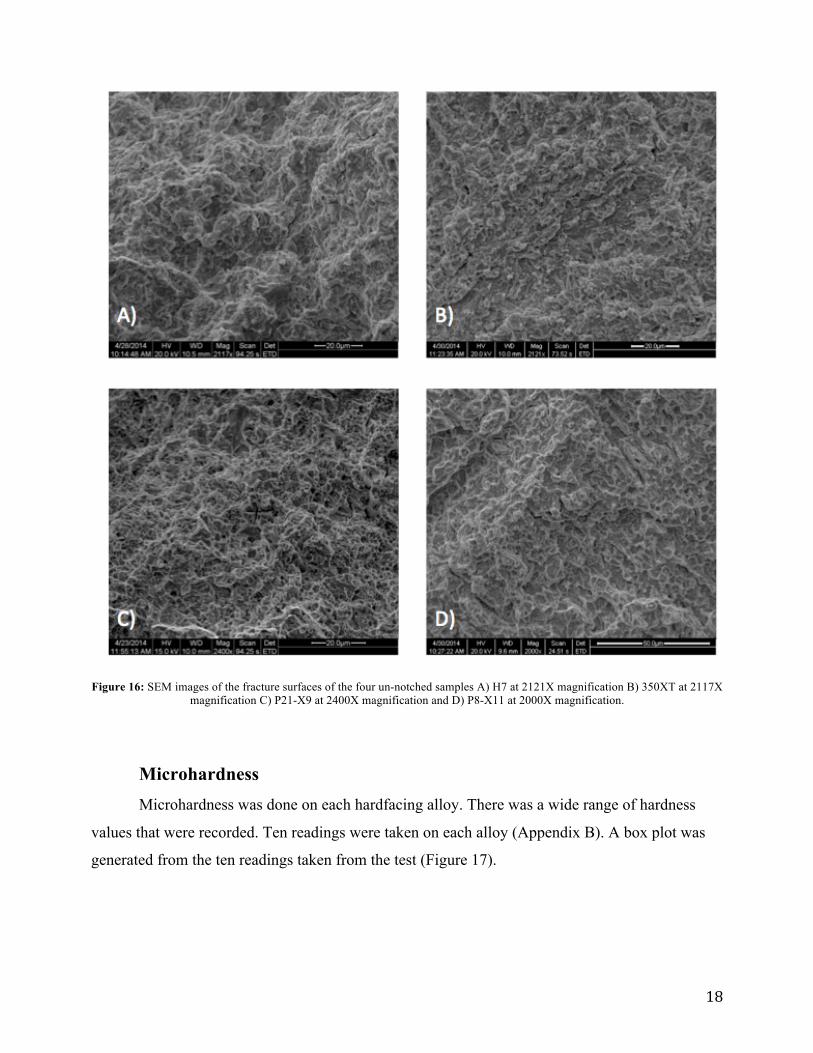
Scanning Electron Microscope (SEM) SEM imaging was completed on the fracture surfaces for the un-notched three-point bend
test, which included the 350XT, H7, P21-X9, and P8-X11 alloys. The notched three-point bend
test samples were not imaged with an SEM. Multiple SEM images were taken of each alloy at
relatively high magnifications (approximately 2000X magnification), but all were uniform
throughout the surface of the fracture. A representative image for each alloy’s fracture surface can
be seen in Figure 16. Imaging was done at the crack initiation site that failed under the given load.
For more additional SEM images of each alloy that fractured in bend testing refer to Appendix A.
18
Figure 16: SEM images of the fracture surfaces of the four un-notched samples A) H7 at 2121X magnification B) 350XT at 2117X magnification C) P21-X9 at 2400X magnification and D) P8-X11 at 2000X magnification.
Microhardness Microhardness was done on each hardfacing alloy. There was a wide range of hardness
values that were recorded. Ten readings were taken on each alloy (Appendix B). A box plot was
generated from the ten readings taken from the test (Figure 17).
19
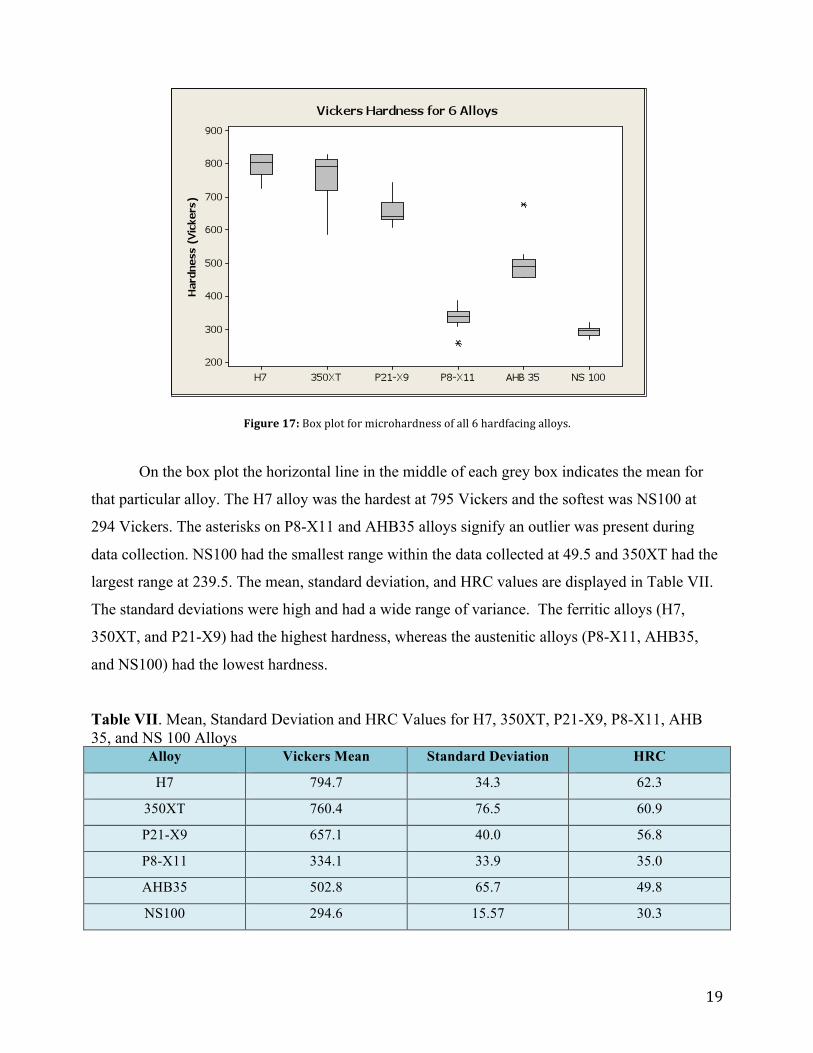
Figure 17: Box plot for microhardness of all 6 hardfacing alloys.
On the box plot the horizontal line in the middle of each grey box indicates the mean for
that particular alloy. The H7 alloy was the hardest at 795 Vickers and the softest was NS100 at
294 Vickers. The asterisks on P8-X11 and AHB35 alloys signify an outlier was present during
data collection. NS100 had the smallest range within the data collected at 49.5 and 350XT had the
largest range at 239.5. The mean, standard deviation, and HRC values are displayed in Table VII.
The standard deviations were high and had a wide range of variance. The ferritic alloys (H7,
350XT, and P21-X9) had the highest hardness, whereas the austenitic alloys (P8-X11, AHB35,
and NS100) had the lowest hardness.
Table VII. Mean, Standard Deviation and HRC Values for H7, 350XT, P21-X9, P8-X11, AHB 35, and NS 100 Alloys
Alloy Vickers Mean Standard Deviation HRC
H7 794.7 34.3 62.3
350XT 760.4 76.5 60.9
P21-X9 657.1 40.0 56.8
P8-X11 334.1 33.9 35.0
AHB35 502.8 65.7 49.8
NS100 294.6 15.57 30.3
20
Discussion Three-Point Bend Test The shape of the plot from the un-notched bend samples was expected. The linear-elastic
slope up to a sharp turn down at the fracture point is characteristic of a brittle material. The P8-
X11 sample 1 showed the most ductility due to the largest extension of 4.86 mm. The sample
showed evidence of plastic deformation after fracture. The other alloys did not have this level of
ductility present. P8-X11 samples 2 and 3 had the lowest strengths, which signifies that these
samples failed prematurely due to cracks were present within the sample prior to testing possibly
between the weld layers from the welding and cutting processes.
The notched bend data had uniquely shaped curves. The AHB35 had the most unique
shaped data with bumps and curves throughout. These samples still had the hardfacing alloy that
was weld-deposited to the base steel metal. The steel base could have had an effect on the
hardfacing alloy being tested. Another factor is the stress concentration of the V-shaped notch.
The properties of A36 steel and 304 stainless steel are different and could lead to inconsistent
strength values if the notch did not get machined all the way through the base material.
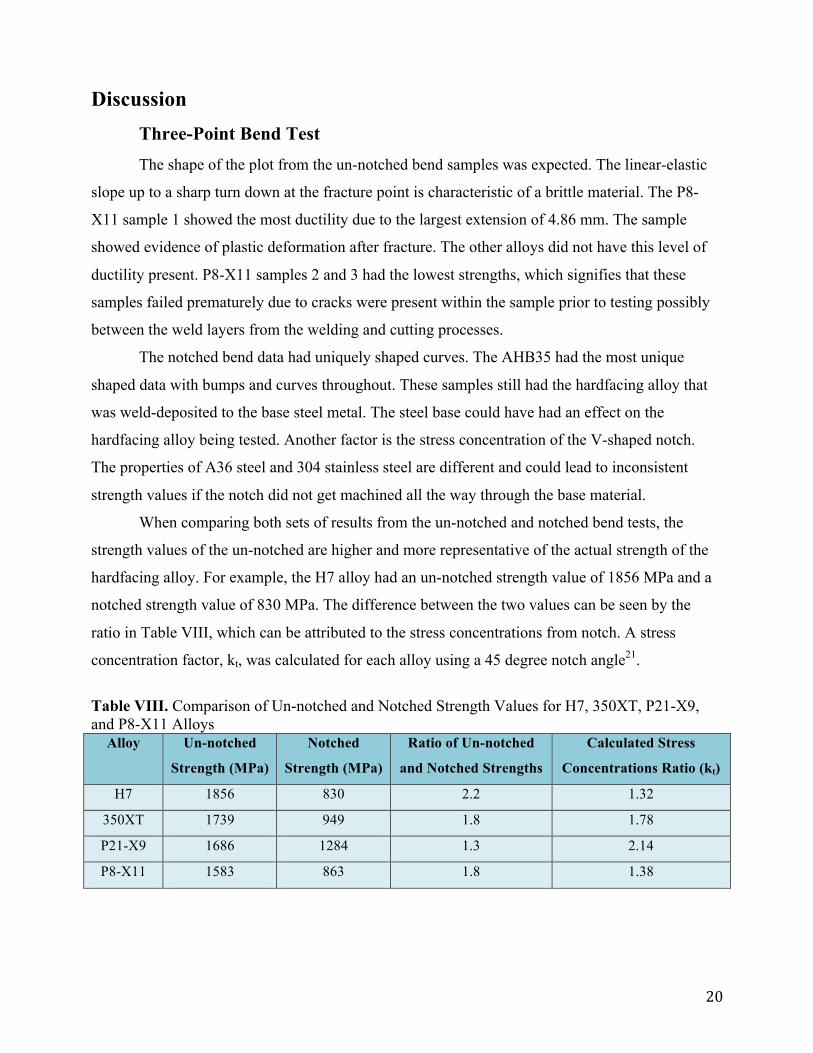
When comparing both sets of results from the un-notched and notched bend tests, the
strength values of the un-notched are higher and more representative of the actual strength of the
hardfacing alloy. For example, the H7 alloy had an un-notched strength value of 1856 MPa and a
notched strength value of 830 MPa. The difference between the two values can be seen by the
ratio in Table VIII, which can be attributed to the stress concentrations from notch. A stress
concentration factor, kt, was calculated for each alloy using a 45 degree notch angle21.
Table VIII. Comparison of Un-notched and Notched Strength Values for H7, 350XT, P21-X9, and P8-X11 Alloys
Alloy Un-notched
Strength (MPa)
Notched
Strength (MPa)
Ratio of Un-notched
and Notched Strengths
Calculated Stress
Concentrations Ratio (kt)
H7 1856 830 2.2 1.32
350XT 1739 949 1.8 1.78
P21-X9 1686 1284 1.3 2.14
P8-X11 1583 863 1.8 1.38
21
The kt values for each were relatively similar to the ratios of un-notched to notched
strengths, which demonstrate that the notched test was an acceptable way to measure Modulus of
Rupture. The notched bend strengths are more representative than the un-notched bend strengths
for the level of stress the hardfacing alloy can withstand during application when welded to a base
drill collar.
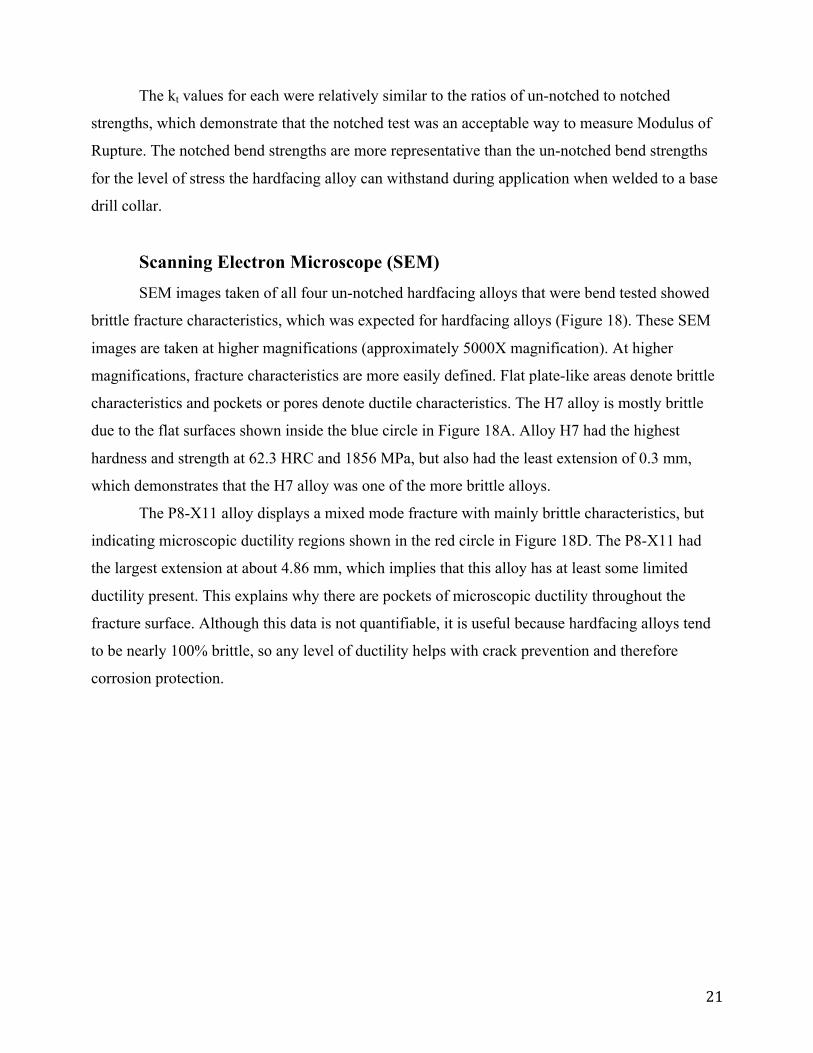
Scanning Electron Microscope (SEM) SEM images taken of all four un-notched hardfacing alloys that were bend tested showed
brittle fracture characteristics, which was expected for hardfacing alloys (Figure 18). These SEM
images are taken at higher magnifications (approximately 5000X magnification). At higher
magnifications, fracture characteristics are more easily defined. Flat plate-like areas denote brittle
characteristics and pockets or pores denote ductile characteristics. The H7 alloy is mostly brittle
due to the flat surfaces shown inside the blue circle in Figure 18A. Alloy H7 had the highest
hardness and strength at 62.3 HRC and 1856 MPa, but also had the least extension of 0.3 mm,
which demonstrates that the H7 alloy was one of the more brittle alloys.
The P8-X11 alloy displays a mixed mode fracture with mainly brittle characteristics, but
indicating microscopic ductility regions shown in the red circle in Figure 18D. The P8-X11 had
the largest extension at about 4.86 mm, which implies that this alloy has at least some limited
ductility present. This explains why there are pockets of microscopic ductility throughout the
fracture surface. Although this data is not quantifiable, it is useful because hardfacing alloys tend
to be nearly 100% brittle, so any level of ductility helps with crack prevention and therefore
corrosion protection.
22
Figure 18: SEM images of the fracture surfaces of the four un-notched samples A) 350XT at 6000X magnification B) H7 at 6131X magnification C) P21-X9 at 3112X magnification and D) P8-X11 at 5154X magnification.
Microhardness There was a correlation between hardness and strength values. The H7 hardfacing alloy
had the highest strength and also had the highest hardness. The strength and hardness of this
hardfacing alloy come from the microstrucural properties. This alloy’s main application that it was
designed for was hardfacing, so that is why it was hard and strong. On the other hand, the NS100
alloy had the lowest hardness and a relatively low strength comparatively. The main application
23
for this alloy was as a corrosion resistant weld overlay, which means that this alloy contains
significantly more chromium, which aids in the corrosion protection. Since the main focus of this
alloy is corrosion protection, it does not need to be designed to be as hard as the other alloys, such
as the H7 alloy. The high standard deviation and high variance could be due to slight
microstructural changes throughout the ingot sample, but this seems unlikely for the number of
times the ingot was melted to ensure a homogeneous microstructure.
Conclusions
1. From the un-notched bend test, H7 hardfacing alloy had the highest strength at 1856 MPa with
the smallest extension of 0.3 mm. P8-X11 hardfacing alloy had the lowest strength at 1583 MPa
with the greatest extension of 4.86 mm.
2. SEM images of the fracture surface showed that the hardfacing alloys displayed a small level
of microscopic ductility, which aids in crack prevention and corrosion protection.
3. There was a correlation between hardness values and strength values.
4. The notched bend test results were expected to be lower strength values due to the stress
concentrations that were present in the V-shaped notch.
24
References 1. Freudenric, Craig H, Ph.D, and Jonathan Strickland. "How Oil Drilling Works." How Stuff Works. A
Discovery Company, n.d. Web. 15 Oct. 2013.
2. "DRILLING EQUIPMENT." Drilling Equipment Used for Purposes of Oil Extraction. N.p., n.d. Web.
23 Nov. 2013. <http://www.flowtechenergy.com/Oilfield-Equipment/Drilling-Equipment/>.
3. Kilduff, Thomas F. "Other Methods of Surface Modification." Engineering Materials Technology. By
James A. Jacobs. 5th ed. Columbus, Ohio: Prentice Hall, 2005. 412-13. Print.
4. "Hardfacing Alloys Introduction." ASM International. N.p., 1998. Web. 17 Oct. 2013.
5. "Corrosion Resistant Weld Overlay / Clad Welding." Rode Welding Service. N.p., n.d. Web. 18 Jan.
2014. <http://www.rodewelding.com/steel-fabrication/weld-overlay.asp>.
6. Rafa, Kyle. "The Effects of Carbon, Boron and Vanadium on the Microstructural Evolution and
Hardness of Steel-based Hardfacing Alloys." Materials Engineering Senior Project (n.d.): 1-10.
California Polytechnic State University. Web. 22 Oct. 2013.
7. "CLASSIFICATION OF HARDFACING ALLOYS." ESAB. N.p., n.d. Web. 22 Nov. 2013.
<http://www.esabna.com/EUWeb/AWTC/Lesson8_12.htm>.
8. "Davis, J.R., Hardfacing, Weld Cladding, and Dissimilar Metal Joining." Vol. 6, ASM International. P
789-829, 1993. Web. 17 Oct. 2013.
9. "What Is Weld Overlay?" Renown Oil & Gas LTD. N.p., n.d. Web. 13 Jan. 2014. <http://www.renown-
oil-and-gas.co.uk/wp-content/uploads/2012/01/Information-Sheet-What-Is-Weld-Overlay.pdf>.
10. Kuzniar, Renee. "The Effects of Heat Treatment on the Grain Growth, Phase Evolution, and Hardness
of Newly Developed Steel-based Hardfacing Alloys for Industrial Applications." Materials
Engineering Senior Project (n.d.): 1-10. California Polytechnic State University. Web. 31 Oct.
2013.
11. "ROGTEC Magazine - Russian Oil & Gas Technologies - News, Reviews & Articles." ROGTEC
Magazine Russian Oil Gas Technologies Magazine. N.p., 7 Jan. 2013. Web. 18 Jan. 2014.
<http://www.rogtecmagazine.com/blog/new-non-metallic-hardbanding-improves-wear-resistance-
in-non-mag-applications>.
12. "Superior Performance in Cutting, Welding and Hardfacing Products." NANO 7 Ultra High
Performance Crack-Free Alloy. N.p., n.d. Web. 23 Nov. 2013. <http://www.broco-
rankin.com/hardfacing/smoothbanding/nano-7-ultra-high-performance-crack-free-alloy/>.
13. "Hard-facing by Welding." Deloro Stellite. N.p., 2012. Web. 18 Jan. 2014.
<http://www.stellite.de/ProcessesOutline/CoatingServices/HardfacingbyWelding/tabid/119/Default
.aspx>.
25
14. "Controlling Weld Metal Dilution." Repair and Maintenance Welding Handbook 2 (n.d.): n. pag.
ESAB. Web. 4 June 2014. <http://www.esab.com/france-benelux/fr/erc-login/upload/Handbook-R-
M-XA00086820.pdf>.
15. "Laboratory 7: Bend Testing." Mechanical Metallurgy Laboratory, n.d. Web. 4 Dec. 2013. PDF.
16. "Journal of Materials Chemistry." Electroactive Polymer Actuators with Carbon Aerogel Electrodes -
(RSC Publishing). N.p., n.d. Web. 30 Jan. 2014.
<http://pubs.rsc.org/en/content/articlelanding/2011/jm/c0jm01729a>.
17. "Flexure Test." Flexure Test. Instron, n.d. Web. 18 Jan. 2014.
<http://www.instron.us/wa/applications/test_types/flexure/default.aspx>.
18. Menedez, Patricio F., Namin Barnes, and Kurtis Bell. "Welding Processes for Wear Resistant
Overlays." Journal of Manufacturing Processes (2013): n. pag. Science Direct. Web. 18 Jan. 2014.
<http://www.sciencedirect.com.ezproxy.lib.calpoly.edu/science/article/pii/S1526612513000807>.
19 "Bend Testing." ASM International. N.p., 2013. Web. 30 Nov. 2013. <PDF>.
20. "CONVERSION CHART OF VICKERS HARDNESS (HV) TO ROCKWELL C (HRC)." Taylor
Special Steels. N.p., n.d. Web. 23 Jan. 2014.
<http://www.taylorspecialsteels.co.uk/pages/main/conchart.htm>.
21. Peterson, R. E., and R. Plunkett. "Stress Concentration Factors." Journal of Applied Mechanics 42.1
(1975): 248. Web. 3 June 2014.
<http://www.ewp.rpi.edu/hartford/~ernesto/Su2012/EP/MaterialsforStudents/Aiello/Roark-
Ch06.pdf>.
26
Appendix A: SEM Fracture Surface Images
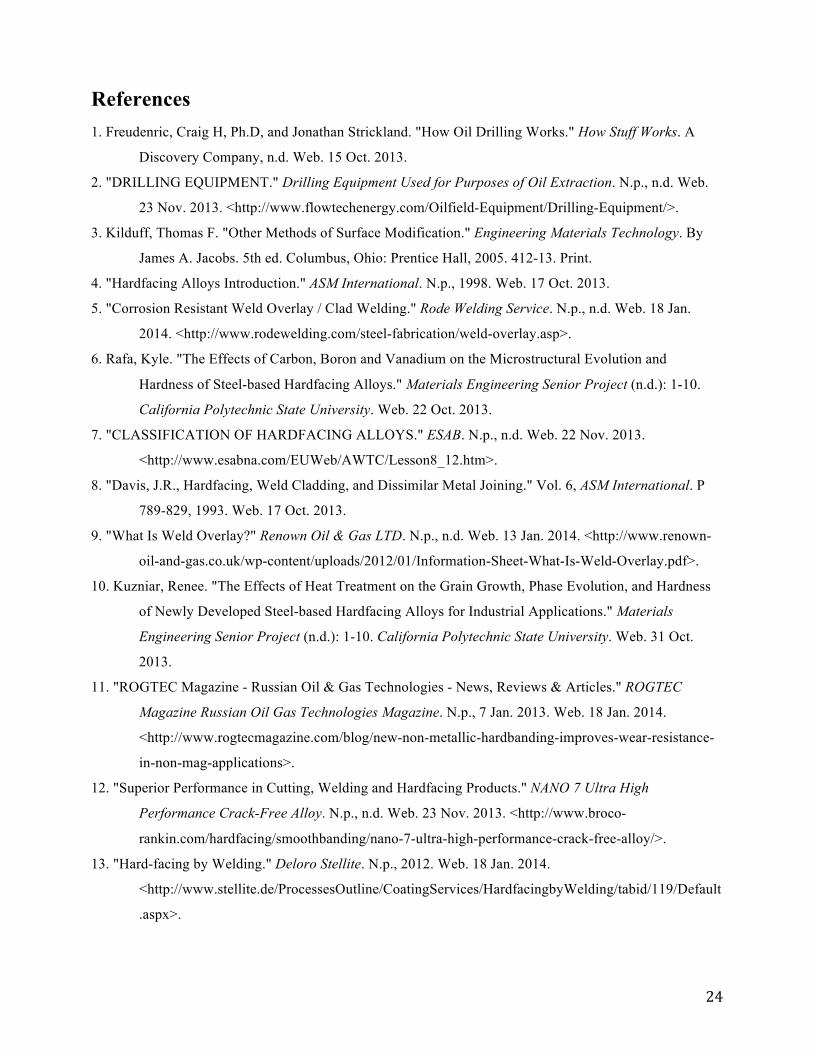
Figure 19: SEM image of fracture surface of 350XT alloy at 5000X magnification.
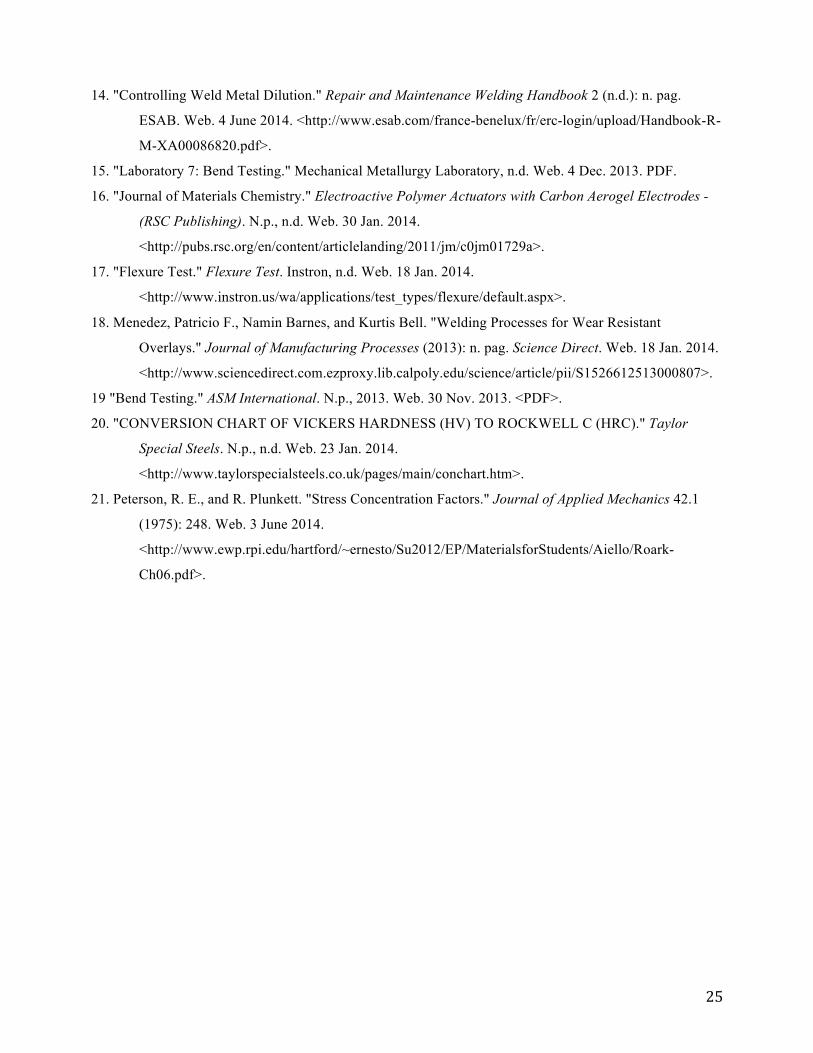
Figure 20: SEM image of fracture surface of H7 alloy at 5054X magnification.
27
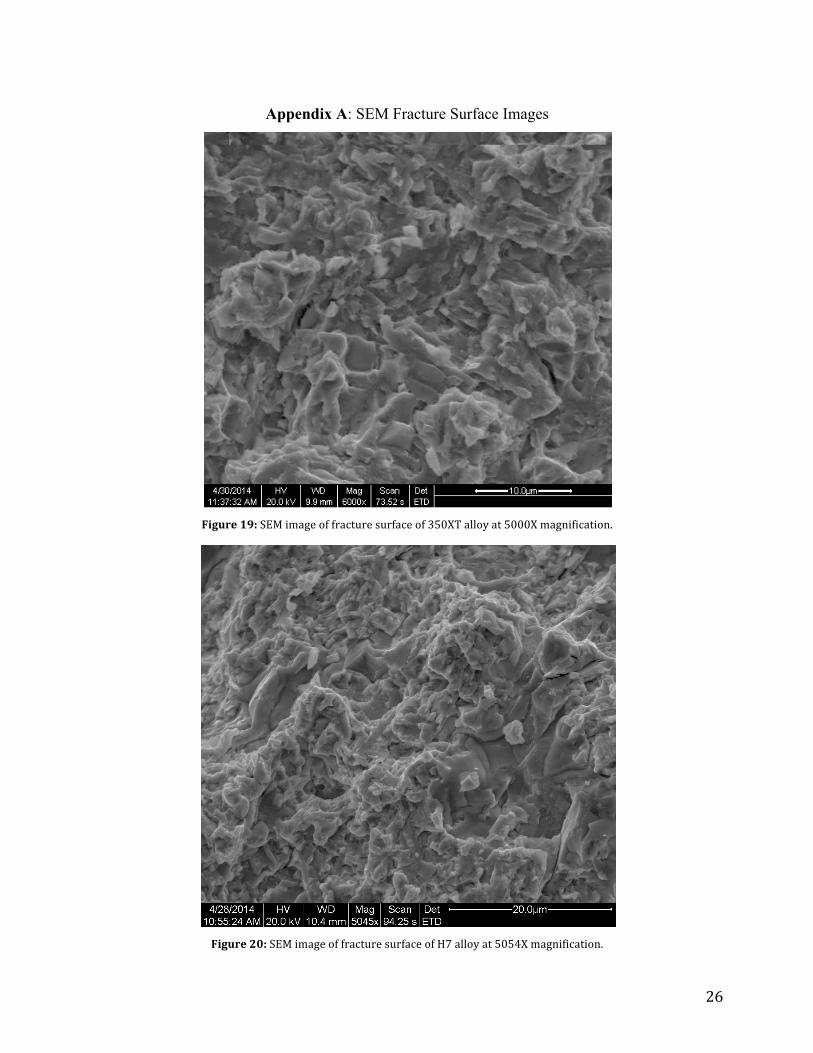
Figure 21: SEM image of the fracture surface of P21-‐X9 alloy at 1200X magnification.
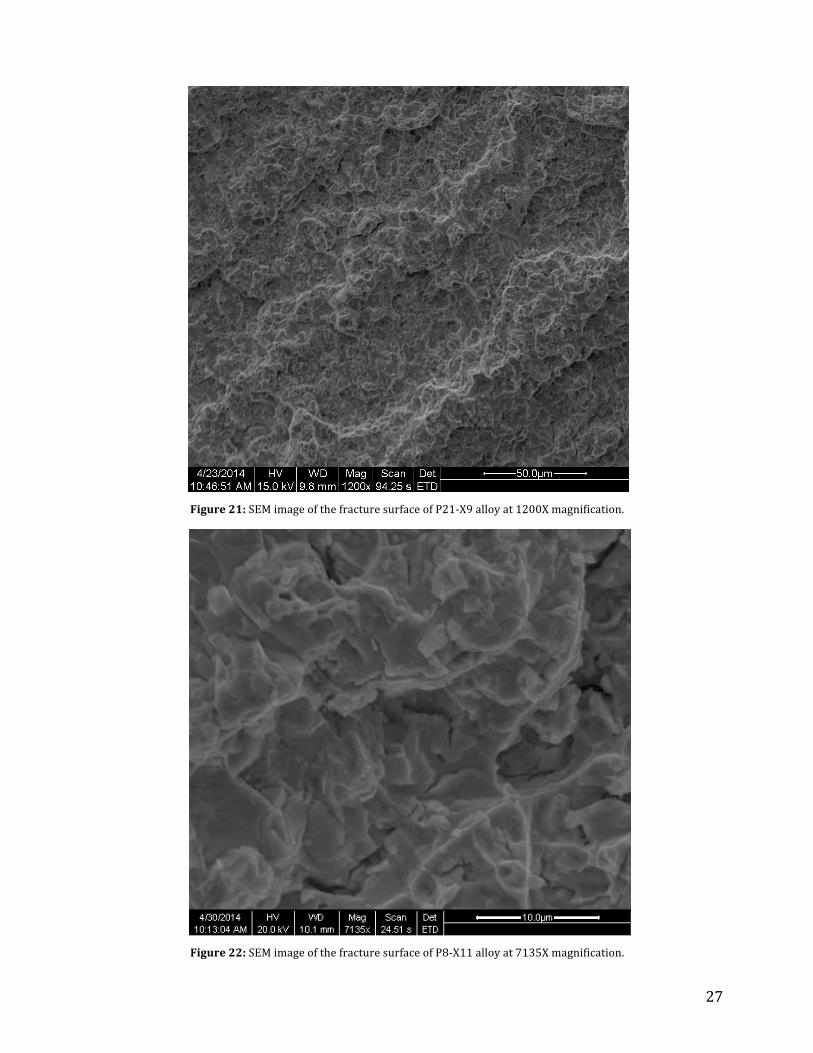
Figure 22: SEM image of the fracture surface of P8-‐X11 alloy at 7135X magnification.
28
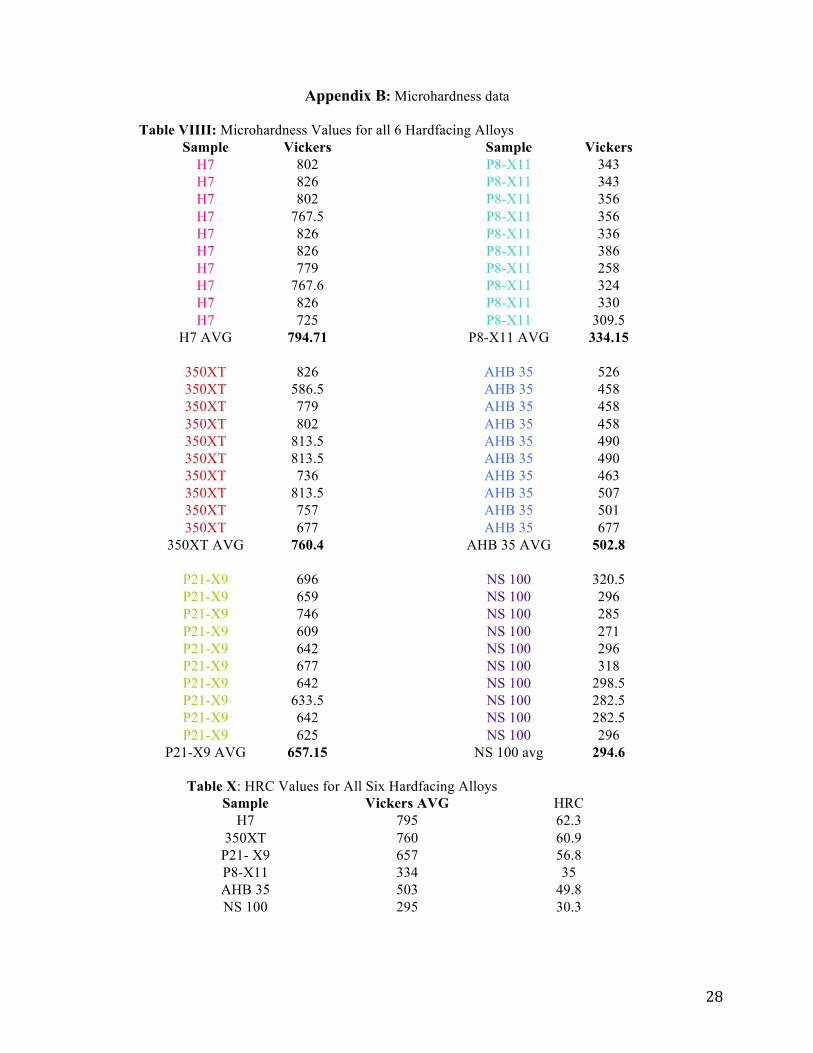
Appendix B: Microhardness data
Table VIIII: Microhardness Values for all 6 Hardfacing Alloys Sample Vickers Sample Vickers
H7 802 P8-X11 343 H7 826 P8-X11 343 H7 802 P8-X11 356 H7 767.5 P8-X11 356 H7 826 P8-X11 336 H7 826 P8-X11 386 H7 779 P8-X11 258 H7 767.6 P8-X11 324 H7 826 P8-X11 330 H7 725 P8-X11 309.5
H7 AVG 794.71 P8-X11 AVG 334.15
350XT 826 AHB 35 526 350XT 586.5 AHB 35 458 350XT 779 AHB 35 458 350XT 802 AHB 35 458 350XT 813.5 AHB 35 490 350XT 813.5 AHB 35 490 350XT 736 AHB 35 463 350XT 813.5 AHB 35 507 350XT 757 AHB 35 501 350XT 677 AHB 35 677
350XT AVG 760.4 AHB 35 AVG 502.8
P21-X9 696 NS 100 320.5 P21-X9 659 NS 100 296 P21-X9 746 NS 100 285 P21-X9 609 NS 100 271 P21-X9 642 NS 100 296 P21-X9 677 NS 100 318 P21-X9 642 NS 100 298.5 P21-X9 633.5 NS 100 282.5 P21-X9 642 NS 100 282.5 P21-X9 625 NS 100 296
P21-X9 AVG 657.15 NS 100 avg 294.6
Table X: HRC Values for All Six Hardfacing Alloys Sample Vickers AVG HRC
H7 795 62.3 350XT 760 60.9
P21- X9 657 56.8 P8-X11 334 35 AHB 35 503 49.8 NS 100 295 30.3