Embed Size (px)
Citation preview

(Company No. 839839 M)(Incorporated in Malaysia)
OFFICER-IN-CHARGE’S ATTESTATION
Yuan Bin
Chief Executive Officer
Date: 30 July 2015
I, Yuan Bin, being the Chief Executive Officer of Industrialand Commercial Bank of China (Malaysia)Berhad, do hereby state that, in my opinion, the Pillar 3 Disclosures set out on pages 1 to 21 have beenprepared in accordance with the Bank Negara Malaysia’s Risk-Weighted Capital Adequacy Framework(Basel II) - Disclosure Requirements (Pillar 3), and are accurate and complete.
Industrial and Commercial Bank of China (Malaysia) Berhad
Risk-Weighted Capital Adequacy Framework (Basel II) Pillar 3 Disclosuresas at 30 June 2015

1Industrial and Commercial Bank of China (Malaysia) Berhad(Company No. 839839 M)(Incorporated in Malaysia)
Risk-Weighted Capital Adequacy Framework (Basel II)Pillar 3 Disclosure
1.0 Overview
(i) Pillar 1
(ii) Pillar 2
(iii) Pillar 3
Risk Type1 Credit2 Market3 Operational
2.0
The Bank adopts a prudent and forward-looking capital management approach to ensure it has adequate capital to support itsoperations at all times. On top of the minimum regulatory capital requirements, a buffer is added on to arrive at the Bank’s internalcapital target to ensure adequacy of capital to support the current and anticipated business growth. Internal Capital AdequacyAssessment Process (“ICAAP”) is formulated to identify thematerial risks in the business. The material risk areas thatare taken intoconsideration are credit risk, market risk, operational risk, credit concentration risk, liquidity risk, interest rate risk in banking book,compliance risk, legal risk, strategic risk as well as reputation risk.
The Pillar 3 Disclosure for financial reporting beginning 1January 2011 is required under the Bank Negara Malaysia (“BNM”)’sRisk-Weighted Capital Adequacy Framework (“RWCAF”). Thisis equivalent to Basel II issued by the Basel Committee on BankingSupervision. Basel II consists of the following Pillars:
Outlines the minimum regulatory capital that banking institutions must hold against the credit, market and operational risks assumed.
Outlines the minimum disclosure requirements of information on the risk management practices and capital adequacy of bankinginstitutions. The Pillar ’s aim is to enhance transparency and market discipline in regulating the risk-taking behaviours of bankinginstitutions. In turn, this will contribute to BNM’s supervisory monitoring efforts and strengthen incentives for thebanking institutionsto implement robust risk management systems.
Focuses on strengthening the supervisory review process indeveloping more rigorous risk management framework and techniques.The purpose of this Pillar is for banking institutions to implement an effective and rigorous internal capital adequacyassessmentprocess that commensurates with the scale, nature and complexity of its operations. It sets out the requirements to assess risks in aholistic manner and beyond the capital requirements for Pillar 1 risks.
The approaches adopted by Industrial and Commercial Bank of China (Malaysia) Berhad (“the Bank”), are shown in table below:
Capital Requirement AssessmentStandard risk-weights
Approach Adopted
Basic Indicator Approach (BIA)Standardised ApproachStandardised Approach
Standard risk-weights
The Bank is principally engaged in the provision of conventional banking and other related financial services. The Bank’s Pillar 3Disclosure is in compliance with the BNM’s Risk-Weighted Capital Adequacy Framework (Basel II) - Disclosure Requirements (Pillar 3). The information provided herein has been reviewed and certified by the Bank’s Chief Executive Officer.
Fixed percentage over average gross income for a fixed number of years
Capital Management and Capital Adequacy
The Bank ’ s lead regulator, BNM, sets and monitors capital requirement for the Bank. The Bank is required to comply with theprovisions of the Basel II framework in respect of regulatory capital adequacy.

2(Company No. 839839 M)
2.0
(i)
(ii)
(a) Capital Adequacy Ratio 30 Jun 2015 31 Dec 2014
CET1 capital ratio 17.861% 17.895%Tier 1 capital ratio 17.861% 17.895%Total capital ratio 19.333% 18.968%
Capital adequacy ratios of the Bank are computed in accordance with BNM’s Capital Adequacy Framework. The minimum regulatorycapital adequacy requirement is 8% on the risk-weighted assets (“RWA”) for total capital at all times. Commencing 1 January 2015,the minimum CET1 Capital and Tier 1 Capital ratio will be set at 4.5% and 6.0% respectively (excluding conservation buffer). Thefollowing information presents the capital adequacy ratios of the Bank and the breakdown of RWA:
The Bank’s regulatory capital are analysed as follows:
Tier 2 Capital includes collective impairment allowances (excluding collective impairment allowances attributableto financingclassified as impaired) and regulatory reserve.
• Common Equity Tier 1 (“CET1”) Capital, which includes ordinary share capital, share premium, retained earnings (net ofdividends declared), statutory reserve and other regulatory adjustments relating to items that are included in equitybut are treateddifferently for capital adequacy purpose.
• Additional Tier 1 Capital, which consists of instruments that are issued and paid-up, subordinated to depositors and perpetual innature (amongst all other criteria) which are not included in CET1 Capital, the share premium arising from issuance of suchinstruments as well as the regulatory adjustments in relation to the calculation of Additional Tier 1 Capital.
Capital Management and Capital Adequacy (continued)
The Bank undertakes stress test exercise on half yearly basis to assess the Bank’s capability to withstand the adverse environment. The stress test will at least cover the exceptional but plausible event and the worst case scenario. The possible impact to the Bank due tooccurrence of adverse events, i.e. significant deterioration in borrowers’ credit profile, decline in collateral value, erosion in the Bank’snet interest margin and sizeable foreign exchange loss willbe examined. The results of the stress test together with theproposedmitigating actions shall be tabled to the Senior Management and the Board of Directors for deliberations.
Tier 1 Capital, which comprises the followings:
Internal capital assessment is carried out to determine thelevel of internal capital required by the Bank based on the Pillar 1 and 2requirements as well as actual results of the preceding financial year (as the base case). Capital plan, business plan and budget areapproved by the Board of Director on annual basis. The business plan in particular would set out the Bank’s risk appetite to be in linewith the lending direction and business strategies for the coming year. Senior Management is responsible in ensuring a smoothdevelopment and implementation of the ICAAP policy as well as effective systems and processes are in place. The Bank ’ sperformance against the internal capital levels is reviewed on a regular basis by the Senior Management. Should there bea need forcapital raising exercise, it will be presented to the Board of Directors for approval.

3(Company No. 839839 M)
2.0
(b)
Risk type Risk-Gross Net Weighted Capital
Exposures Exposures Assets RequirementRM’000 RM’000 RM’000 RM’000
Credit RiskOn-Balance Sheet ExposuresSovereigns/Central Banks 764,081 764,081 - - Banks, Development Financial Institutions and MDBs 720,072 720,072 153,163 12,253 Corporates 2,387,209 2,387,209 1,251,196 100,096 Regulatory Retail 73,289 73,289 63,664 5,093 Residential Mortgages 43,480 43,480 16,164 1,293 Other Assets 15,789 15,789 10,633 851
Total On-Balance Sheet Exposures 4,003,920 4,003,920 1,494,820 119,586
Off-Balance Sheet ExposuresCredit-related off-balance sheet exposures 590,764 590,764 399,818 31,985 OTC derivatives 11,604 11,604 4,635 371
Total Off-Balance Sheet Exposures 602,368 602,368 404,453 32,356 Total On and Off-Balance Sheet Exposures 4,606,288 4,606,288 1,899,273 151,942
Large exposure risk requirement* - - - -
Market Risk Long Short Position Position
Foreign currency risk 706 2,877 2,877 2,877 230
Operational Risk - - - 135,451 10,836
Total RWA and Capital Requirements 2,037,601 163,008
Note:
MDBs - Multilateral Development Banks
OTC - Over the counter
The breakdown of RWA by exposures in each major risk category under standardised approach are as follows:
30 Jun 2015
Capital Management and Capital Adequacy (continued)
*The Bank does not need to fulfill the capital requirement for Large Exposure Risk as there is no amount in excess of the lowest threshold arising from equity holdings as specified in the BNM’s RWCAF.

4(Company No. 839839 M)
2.0
Risk type Risk-Gross Net Weighted Capital
Exposures Exposures Assets RequirementRM’000 RM’000 RM’000 RM’000
Credit RiskOn-Balance Sheet ExposuresSovereigns/Central Banks 845,321 845,321 - - Banks, Development Financial Institutions and MDBs 957,163 957,163 191,433 15,315 Corporates 2,179,278 2,179,278 1,324,467 105,957 Regulatory Retail 11,069 11,069 10,468 837Residential Mortgages 36,596 36,596 13,596 1,088Other Assets 17,947 17,947 12,811 1,025
Total On-Balance Sheet Exposures 4,047,374 4,047,374 1,552,775 124,222
Off-Balance Sheet ExposuresCredit-related off-balance sheet exposures 555,831 555,831 391,408 31,313 OTC derivatives 13,647 13,647 3,589 287
Total Off-Balance Sheet Exposures 569,478 569,478 394,997 31,600 Total On and Off-Balance Sheet Exposures 4,616,852 4,616,852 1,947,772 155,822
Large exposure risk requirement* - - - -
Market Risk Long Short Position Position
Foreign currency risk 592 1,968 1,968 1,968 157
Operational Risk - - - 123,544 9,884
Total RWA and Capital Requirements 2,073,284 165,863
Note:
MDBs - Multilateral Development Banks
OTC - Over the counter
Capital Management and Capital Adequacy (continued)
31 Dec 2014
*The Bank does not need to fulfill the capital requirement for Large Exposure Risk as there is no amount in excess of the lowest threshold arising from equity holdings as specified in the BNM’s RWCAF.

5(Company No. 839839 M)
3.0 Capital Structure
30 Jun 2015 31 Dec 2014Common Equity Tier 1 (“CET1”) Capital RM’000 RM’000
Paid-up share capital 331,000 331,000 Retained earnings 11,160 18,346 Statutory reserve 26,227 26,227 Regulatory reserve 18,237 11,051Unrealised losses on financial investments available-for-sale (439) (278)
386,185 386,346Less: Regulatory adjustments applied in calculation of CET1 Capital - Intangible asset (1,084) (1,344) - Deferred tax assets (2,930) (2,930) - Regulatory reserve attributable to loans, advances and financing (18,237) (11,051)
(22,251) (15,325)
Total CET1 Capital 363,934 371,021
Tier 2 Capital
Collective impairment allowance 11,766 11,189 Regulatory reserve 18,237 11,051
Total Tier 2 Capital 30,003 22,240
Total Capital 393,937 393,261
4.0 Risk Management Framework
The Board Audit Committee, supported by Internal Audit Department, provides an independent assessment of the adequacyandreliability of the risk management processes and system of internal controls, and compliance with risk policies and regulatoryrequirements.
• Liquidity risk
The bank’s total capital according to Bank Negara Malaysia’s Capital Adequacy Framework (Capital Components) are as follows:
MRMC has been established for active Senior Management oversight, understanding, and dialogue on policies, profiles,and activitiespertaining to the relevant risk types. All major risk policies have to be deliberated at MRMC level prior to escalation toBRMC andBoard of Directors for approval.
The Board of Directors establishes the Bank’s risk appetiteand risk principles. The Board Risk Management Committee (“BRMC”) isthe principal board committee that oversees the Bank’s riskmanagement. It reviews the Bank’s overall risk management frameworksand major risk policies. The BRMC is supported by both Management Risk Management Committee (“MRMC”) at management leveland Risk Management Department.
The Bank’s risk management policies are established to identify the risks faced by the Bank, to set appropriate risk limits and controls,and to monitor risks and adherence to limits. Unsecured exposures are managed in a prudent manner and collaterals are takenwhenever required as risk mitigation measures. The Bank’s unsecured exposures are diversified to a larger pool of clients to promote amore effective use of capital. Risk management policies andsystems are reviewed regularly to reflect changes in the market condition,products and services offered. Periodic credit review is performed on the Bank’s loan portfolio to assess the impact of changes ineconomic environment to the Bank’s exposures and the collaterals taken. The Bank, through its training and management standardsand procedures, aims to develope a disciplined and constructive control environment, in which all employees understand their rolesand obligations.
• Credit risk• Market risk• Operational risk
The Bank has exposure to the following risks, amongst others, from financial instruments:

6(Company No. 839839 M)
5.0 Credit Risk
• Ensuring prudent underwriting standards/lending direction• Recommending approval on credit requests
• Formulating and reviewing credit policies
• Monitoring and controlling exposures.
The Board of Directors has delegated responsibility for theoversight of credit risk to the Credit Committee and MRMC. Bothcommittees are supervised by the Senior Management Committee.
The Bank employs a credit risk grading system as a tool for determining the credit risk profile of borrowers using appropriate form ofscorecards. The credit grades are used as a basis to support the underwriting of credit and are mapped accordingly to the credit ratingscales of major international credit rating agencies.
The methodology adopted for collective impairment assessment and the list of trigger events for individual impairment assessment will be reviewed on a regular basis to suit with the Bank’s policy and the traits of its loan portfolio.
Credit risk is the risk of financial loss to the Bank due to failure of the Bank’s customers or counterparties in meeting their contractualfinancial obligation. The credit risk comes primarily fromthe Bank’s cash and deposits/placements, direct lending, trade finance andfunding activities.
A collective impairment allowance is performed on “collective basis” on the Bank’s loan portfolio using statistical techniques with thenecessary adjustments to the credit grades and probabilityof defaults of the respective credit grade band of the loans in order to guardagainst the risk of judgement error in the credit grading process. Although the credit grading process would involve qualitativeassessment which is subject to judgement error, the loans within the same credit grade band generally share the similar credit riskcharacteristics for collective assessment. Given the lackof historical loss experience, the relevant market data will be taken forconsideration to derive the model risk adjustment.
The functions of the MRMC are as follows:
• Review and recommend credit risk appetite of the Bank• Ensure effective credit risk management is in place
In the case of individual assessment, a loan is deemed as impaired if there is objective evidence of impairment which is triggered bycertain events. In general, loans that are not repaid on timeas they come due, be it the principal or interest, will be monitored closely asthe likelihood of impairment from these past due loans is expected to be higher. Individual impairment allowances are made for loans,advances and financing which have been individually reviewed and specifically identified as impaired. Individual impairmentallowances are provided if the recoverable amount (presentvalue of estimated future cash flows discounted at originaleffective interestrate) is lower than the carrying value of the loans, advancesand financing (outstanding amount of loans, advances and financing, netof individual impairment allowance). The expected cash flows are based on projections of liquidation proceeds, realisation of assets orestimates of future operating cash flows.
The functions of the Credit Committee are as follows:
(Company No. 839839 M) 7
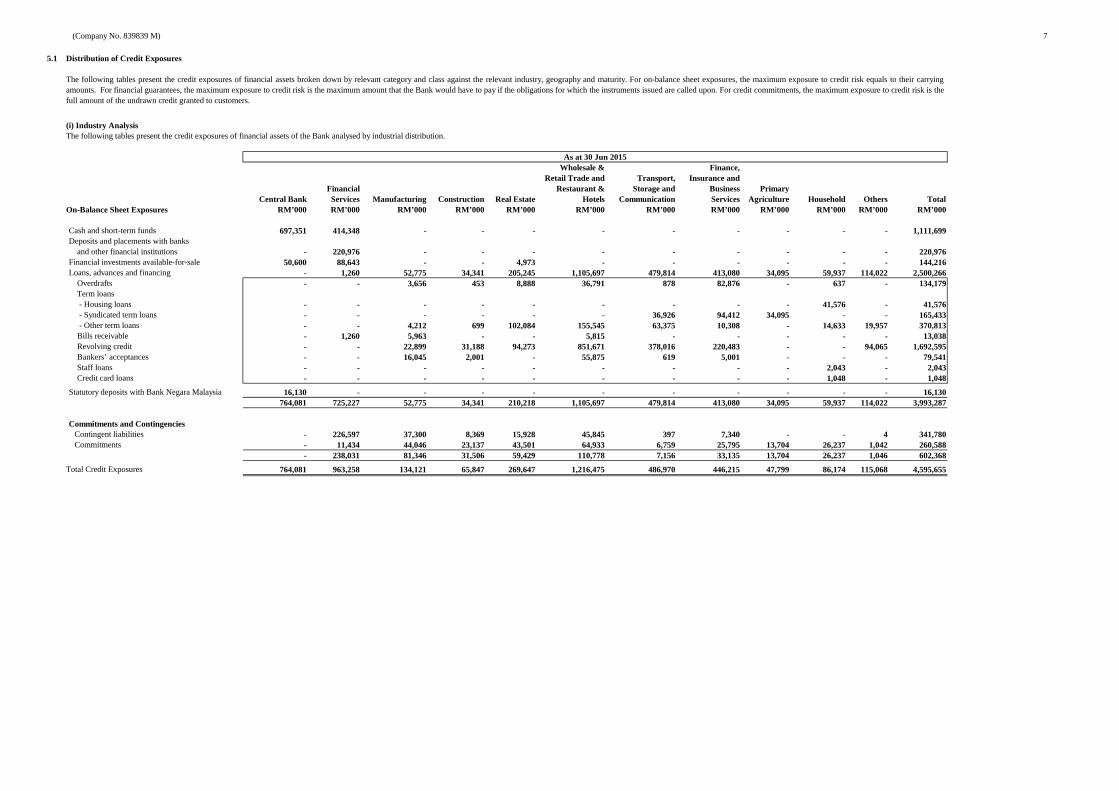
5.1 Distribution of Credit Exposures
Wholesale & Finance,Retail Trade and Transport, Insurance and
Financial Restaurant & Storage and Business PrimaryCentral Bank Services Manufacturing Construction Real Estate Hotels Communication Services Agriculture Household Others Total
On-Balance Sheet Exposures RM’000 RM’000 RM’000 RM’000 RM’000 RM’000 RM’000 RM’000 RM’000 RM’000 RM’000 RM’000
Cash and short-term funds 697,351 414,348 - - - - - - - - - 1,111,699Deposits and placements with banks and other financial institutions - 220,976 - - - - - - - - - 220,976Financial investments available-for-sale 50,600 88,643 - - 4,973 - - - - - - 144,216Loans, advances and financing - 1,260 52,775 34,341 205,245 1,105,697 479,814 413,080 34,095 59,937 114,022 2,500,266 Overdrafts - - 3,656 453 8,888 36,791 878 82,876 - 637 - 134,179 Term loans - Housing loans - - - - - - - - - 41,576 - 41,576 - Syndicated term loans - - - - - - 36,926 94,412 34,095 - - 165,433 - Other term loans - - 4,212 699 102,084 155,545 63,375 10,308 - 14,633 19,957 370,813 Bills receivable - 1,260 5,963 - - 5,815 - - - - - 13,038 Revolving credit - - 22,899 31,188 94,273 851,671 378,016 220,483 - - 94,065 1,692,595 Bankers’ acceptances - - 16,045 2,001 - 55,875 619 5,001 - - - 79,541 Staff loans - - - - - - - - - 2,043 - 2,043 Credit card loans - - - - - - - - - 1,048 - 1,048
Statutory deposits with Bank Negara Malaysia 16,130 - - - - - - - - - - 16,130 764,081 725,227 52,775 34,341 210,218 1,105,697 479,814 413,080 34,095 59,937 114,022 3,993,287
Commitments and ContingenciesContingent liabilities - 226,597 37,300 8,369 15,928 45,845 397 7,340 - - 4 341,780Commitments - 11,434 44,046 23,137 43,501 64,933 6,759 25,795 13,704 26,237 1,042 260,588
- 238,031 81,346 31,506 59,429 110,778 7,156 33,135 13,704 26,237 1,046 602,368
Total Credit Exposures 764,081 963,258 134,121 65,847 269,647 1,216,475 486,970 446,215 47,799 86,174 115,068 4,595,655
The following tables present the credit exposures of financial assets broken down by relevant category and class against the relevant industry, geography and maturity. For on-balance sheet exposures, the maximum exposure to credit risk equals to their carryingamounts. For financial guarantees, the maximum exposure tocredit risk is the maximum amount that the Bank would have to pay if the obligations for which the instruments issued are called upon. For credit commitments, the maximum exposure to credit risk is thefull amount of the undrawn credit granted to customers.
(i) Industry Analysis
As at 30 Jun 2015
The following tables present the credit exposures of financial assets of the Bank analysed by industrial distribution.

(Company No. 839839 M) 8
5.1 Distribution of Credit Exposures (continued)
Wholesale & Finance,Retail Trade and Transport, Insurance and
Financial Restaurant & Storage and Business PrimaryCentral Bank Services Manufacturing Construction Real Estate Hotels Communication Services Agriculture Household Others Total
On-Balance Sheet Exposures RM’000 RM’000 RM’000 RM’000 RM’000 RM’000 RM’000 RM’000 RM’000 RM’000 RM’000 RM’000
Cash and short-term funds 784,796 854,699 - - - - - - - - - 1,639,495Deposits and placements with banks and other financial institutions - 107,600 - - - - - - - - - 107,600Financial investments available-for-sale 50,185 - - - 4,971 - - - - - - 55,156Loans, advances and financing - - 41,460 41,337 221,591 970,045 416,813 396,749 23,481 47,666 62,831 2,221,973 Overdrafts - - 3,607 3,009 11,097 22,030 - 77,817 - 592 - 118,152 Term loans - Housing loans - - - - - - - - - 34,895 - 34,895 - Syndicated term loans - - - - - - 34,221 87,484 23,481 - - 145,186 - Other term loans - - 5,544 607 111,098 348,079 31,804 99,479 - 9,128 17,779 623,518 Bills receivable - - 2,156 - - - - - - - - 2,156 Trust receipt - - - 320 - - - - - - - 320 Revolving credit - - 18,276 35,904 99,396 553,184 349,722 121,969 - - 45,052 1,223,503 Bankers’ acceptances - - 11,877 1,497 - 46,752 1,066 10,000 - - - 71,192 Staff loans - - - - - - - - - 1,867 - 1,867 Credit card loans - - - - - - - - - 1,184 - 1,184
Statutory deposits with Bank Negara Malaysia 10,340 - - - - - - - - - - 10,340 845,321 962,299 41,460 41,337 226,562 970,045 416,813 396,749 23,481 47,666 62,831 4,034,564
Commitments and ContingenciesContingent liabilities - - 78,469 45,404 12,392 43,846 82,662 47,995 - - - 310,768Commitments - 13,584 33,836 22,849 38,588 86,256 6,636 22,762 1,424 24,220 8,555 258,710
- 13,584 112,305 68,253 50,980 130,102 89,298 70,757 1,424 24,220 8,555 569,478
Total Credit Exposures 845,321 975,883 153,765 109,590 277,542 1,100,147 506,111 467,506 24,905 71,886 71,386 4,604,042
(i) Industry Analysis (continued)As at 31 Dec 2014

(Company No. 839839 M) 9
5.1 Distribution of Credit Exposures (continued)
(ii) Geographical Analysis
Within OutsideMalaysia Malaysia Total
On-Balance Sheet Exposures RM’000 RM’000 RM’000
Cash and short-term funds 844,889 266,810 1,111,699Deposits and placements with banks and other financial institutions 182,653 38,323 220,976Financial investments available-for-sale 55,573 88,643 144,216Loans, advances and financing 1,359,946 1,140,320 2,500,266 Overdrafts 134,179 - 134,179 Term loans - Housing loans 41,576 - 41,576 - Syndicated term loans - 165,433 165,433 - Other term loans 132,265 238,548 370,813 Bills receivable 11,778 1,260 13,038 Revolving credit 957,516 735,079 1,692,595 Bankers’ acceptances 79,541 - 79,541 Staff loans 2,043 - 2,043 Credit card loans 1,048 - 1,048Statutory deposits with Bank Negara Malaysia 16,130 - 16,130
2,459,191 1,534,096 3,993,287
Commitments and ContingenciesContingent liabilities 105,379 236,401 341,780Commitments 196,539 64,049 260,588
301,918 300,450 602,368
Total Credit Exposures 2,761,109 1,834,546 4,595,655
Within OutsideMalaysia Malaysia Total
On-Balance Sheet Exposures RM’000 RM’000 RM’000
Cash and short-term funds 1,050,366 589,129 1,639,495Deposits and placements with banks and other financial institutions - 107,600 107,600Financial investments available-for-sale 55,156 - 55,156Loans, advances and financing 1,097,753 1,124,220 2,221,973 Overdrafts 118,152 - 118,152 Term loans - Housing loans 34,895 - 34,895 - Syndicated term loans - 145,186 145,186 - Other term loans 98,656 524,862 623,518 Bills receivable 2,156 - 2,156 Trust receipt 320 - 320 Revolving credit 769,331 454,172 1,223,503 Bankers’ acceptances 71,192 - 71,192 Staff loans 1,867 - 1,867 Credit card loans 1,184 - 1,184Statutory deposits with Bank Negara Malaysia 10,340 - 10,340
2,213,615 1,820,949 4,034,564
Commitments and ContingenciesContingent liabilities 114,034 196,734 310,768Commitments 188,722 69,988 258,710
302,756 266,722 569,478
Total Credit Exposures 2,516,371 2,087,671 4,604,042
As at 30 Jun 2015
As at 31 Dec 2014
The following tables present the credit exposures of financial assets analysed by geographical distribution based on the geographicallocation where the credit risk resides.

(Company No. 839839 M) 10
5.1 Distribution of Credit Exposures (continued)
(iii) Maturity Analysis
Up to 1 >1 - 3 >3 - 12month months months 1 - 5 years Over 5 years Total
On-Balance Sheet Exposures RM’000 RM’000 RM’000 RM’000 RM’000 RM’000
Cash and short-term funds 1,111,699 - - - - 1,111,699Deposits and placements with banks and other financial institutions - 215,313 5,663 - - 220,976Financial investments available-for-sale - 59,407 29,236 55,573 - 144,216Loans, advances and financing 894,152 405,989 609,069 472,083 118,973 2,500,266 Overdrafts 134,179 - - - - 134,179 Term loans - Housing loans 279 243 1,140 7,042 32,872 41,576 - Syndicated term loans 26 290 - 131,173 33,944 165,433 - Other term loans 10,575 156,661 80,972 72,053 50,552 370,813 Bills receivable 3,047 7,606 2,385 - - 13,038 Revolving credit 718,837 207,624 504,643 261,491 - 1,692,595 Bankers’ acceptances 26,145 33,546 19,850 - - 79,541 Staff loans 16 19 79 324 1,605 2,043 Credit card loans 1,048 - - - - 1,048Statutory deposits with Bank Negara Malaysia - - - - 16,130 16,130
2,005,851 680,709 643,968 527,656 135,103 3,993,287
Commitments and ContingenciesContingent liabilities 57,346 4,564 72,505 207,365 - 341,780Commitments 1,590 3,810 188,569 66,619 - 260,588
58,936 8,374 261,074 273,984 - 602,368
Total Credit Exposures 2,064,787 689,083 905,042 801,640 135,103 4,595,655
Up to 1 >1 - 3 >3 - 12month months months 1 - 5 years Over 5 years Total
On-Balance Sheet Exposures RM’000 RM’000 RM’000 RM’000 RM’000 RM’000
Cash and short-term funds 1,639,495 - - - - 1,639,495Deposits and placements with banks and other financial institutions - 65,023 42,577 - - 107,600Financial investments available-for-sale - - - 55,156 - 55,156Loans, advances and financing 1,068,050 500,088 319,333 236,973 97,529 2,221,973 Overdrafts 118,152 - - - - 118,152 Term loans - Housing loans 230 210 925 5,305 28,225 34,895 - Syndicated term loans 177 152 - 121,482 23,375 145,186 - Other term loans 106,039 122,769 240,349 109,839 44,522 623,518 Bills receivable 188 1,158 810 - - 2,156 Trust receipt - 320 - - - 320 Revolving credit 823,953 342,019 57,531 - - 1,223,503 Bankers’ acceptances 18,112 33,442 19,638 - - 71,192 Staff loans 15 18 80 347 1,407 1,867 Credit card loans 1,184 - - - - 1,184Statutory deposits with Bank Negara Malaysia - - - - 10,340 10,340
2,707,545 565,111 361,910 292,129 107,869 4,034,564
Commitments and ContingenciesContingent liabilities 11,877 41,909 72,906 184,077 - 310,769Commitments 100 9,605 196,660 52,344 - 258,709
11,977 51,514 269,566 236,421 - 569,478
Total Credit Exposures 2,719,522 616,625 631,476 528,550 107,869 4,604,042
As at 31 Dec 2014
As at 30 Jun 2015
The following tables present the residual contractual maturity for major types of gross credit exposures for on and off-balance sheet exposures of financialassets.

(Company No. 839839) 11
5.2 Credit Quality of Loans, Advances and Financing
(i) Impaired loans, advances and financing30 Jun 2015 31 Dec 2014
RM’000 RM’000
Wholesale & retail trade and restaurant & hotels 2,029 2,029 Household 51 51
(ii) Past due but not impaired loans30 Jun 2015 31 Dec 2014
RM’000 RM’000
Household 65 176
(iii) Collective impairment provision broken down by geographical location
Within OutsideMalaysia Malaysia TotalRM’000 RM’000 RM’000
Loans, advances and financing 6,684 5,082 11,766 Overdrafts 707 - 707 Term loans - Housing loans 182 - 182 - Syndicated term loans - 2,089 2,089 - Other term loans 1,077 680 1,757 Bills receivable 14 - 14 Revolving credit 3,736 2,313 6,049 Bankers’ acceptances 939 - 939 Staff loans 11 - 11 Credit card loans 18 - 18
6,684 5,082 11,766
Within OutsideMalaysia Malaysia TotalRM’000 RM’000 RM’000
Loans, advances and financing 4,969 6,220 11,189 Overdrafts 646 - 646 Term loans - Housing loans 153 - 153 - Syndicated term loans - 1,869 1,869 - Other term loans 724 2,284 3,008 Bills receivable 5 - 5 Trust receipt 3 - 3 Revolving credit 2,637 2,067 4,704 Bankers’ acceptances 783 - 783 Staff loans 11 - 11 Credit card loans 7 - 7
4,969 6,220 11,189
31 Dec 2014
The following tables present the collective impairment provision of loans, advances and financing analysed by geographicaldistribution based on the geographical location where the credit risk resides.
30 Jun 2015
All impaired loans and past due loans were from customers residing in Malaysia.

(Company No. 839839 M) 12
5.2 Credit Quality of Loans, advances and Financing (continued)
(iv) Collective impairment provision broken down by sector
Wholesale & Finance,Retail Trade and Transport, Insurance and
Restaurant & Storage and Business PrimaryManufacturing Construction Real Estate Hotels Communication Services Agriculture Household Others Total
On-Balance Sheet Exposures RM’000 RM’000 RM’000 RM’000 RM’000 RM’000 RM’000 RM’000 RM’000 RM’000
Loans, advances and financing 622 330 1,247 4,683 1,352 2,735 281 315 201 11,766 Overdrafts 78 13 73 305 16 221 - 1 - 707 Term loans - Housing loans - - - - - - - 182 - 182 - Syndicated term loans - - - - 1,029 779 281 - - 2,089 - Other term loans 35 4 497 607 307 169 - 103 35 1,757 Bills receivable 14 - - - - - - - - 14 Revolving credit 152 257 677 3,272 - 1,525 - - 166 6,049 Bankers’ acceptances 343 56 - 499 - 41 - - - 939 Staff loans - - - - - - - 11 - 11 Credit card loans - - - - - - - 18 - 18
622 330 1,247 4,683 1,352 2,735 281 315 201 11,766
Wholesale & Finance,Retail Trade and Transport, Insurance and
Restaurant & Storage and Business PrimaryManufacturing Construction Real Estate Hotels Communication Services Agriculture Household Others Total
On-Balance Sheet Exposures RM’000 RM’000 RM’000 RM’000 RM’000 RM’000 RM’000 RM’000 RM’000 RM’000
Loans, advances and financing 428 428 1,345 4,964 1,009 2,480 194 231 110 11,189 Overdrafts 72 84 92 173 - 224 - 1 - 646 Term loans - Housing loans - - - - - - - 153 - 153 - Syndicated term loans - - - - 953 722 194 - - 1,869 - Other term loans 46 3 534 1,458 56 821 - 59 31 3,008 Bills receivable 5 - - - - - - - - 5 Trust receipt - 3 - - - - - - - 3 Revolving credit 117 296 719 2,863 - 630 - - 79 4,704 Bankers’ acceptances 188 42 - 470 - 83 - - - 783 Staff loans - - - - - - - 11 - 11 Credit card loans - - - - - - - 7 - 7
428 428 1,345 4,964 1,009 2,480 194 231 110 11,189
The following tables present the collective impairment provision of loans, advances and financing of the Bank analysed by industrial distribution.
As at 31 Dec 2014
As at 30 Jun 2015
(Company No. 839839) 13
5.2 Credit Quality of Loans, advances and Financing (continued)
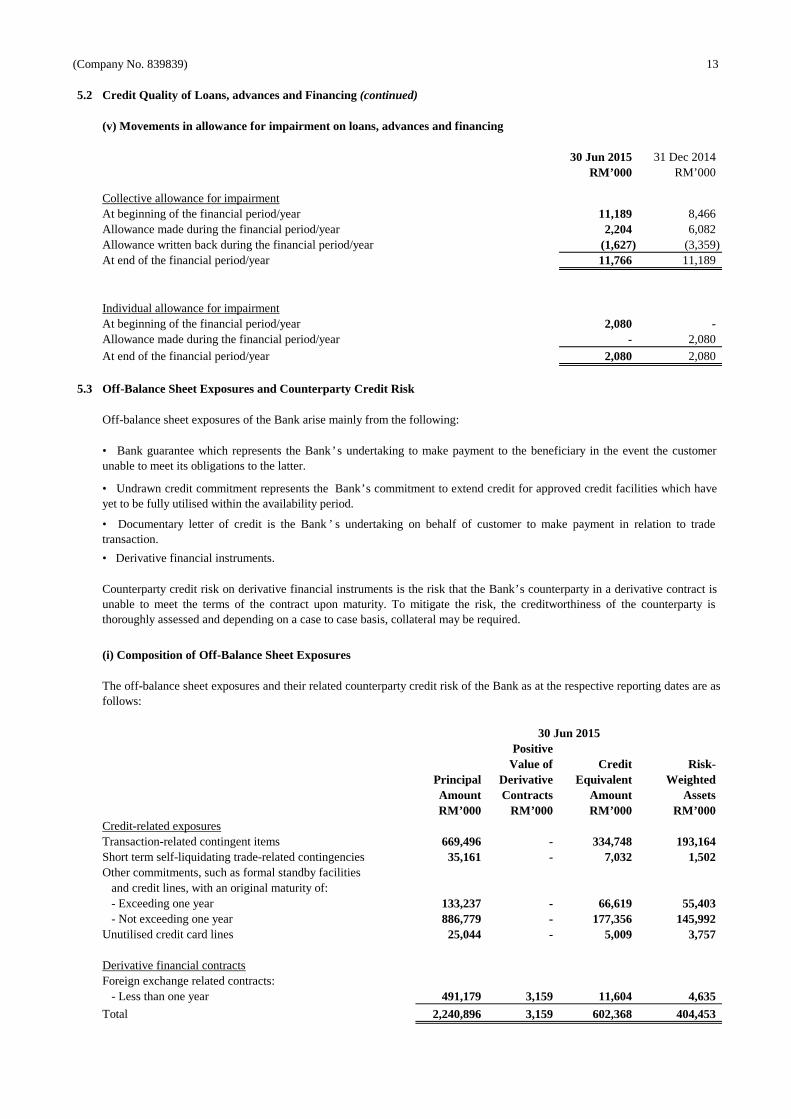
(v) Movements in allowance for impairment on loans, advances and financing
30 Jun 2015 31 Dec 2014RM’000 RM’000
Collective allowance for impairmentAt beginning of the financial period/year 11,189 8,466 Allowance made during the financial period/year 2,204 6,082 Allowance written back during the financial period/year (1,627) (3,359) At end of the financial period/year 11,766 11,189
Individual allowance for impairmentAt beginning of the financial period/year 2,080 - Allowance made during the financial period/year - 2,080 At end of the financial period/year 2,080 2,080
5.3 Off-Balance Sheet Exposures and Counterparty Credit Risk
(i) Composition of Off-Balance Sheet Exposures
PositiveValue of Credit Risk-
Principal Derivative Equivalent WeightedAmount Contracts Amount AssetsRM’000 RM’000 RM’000 RM’000
Credit-related exposuresTransaction-related contingent items 669,496 - 334,748 193,164 Short term self-liquidating trade-related contingencies 35,161 - 7,032 1,502 Other commitments, such as formal standby facilities and credit lines, with an original maturity of: - Exceeding one year 133,237 - 66,619 55,403 - Not exceeding one year 886,779 - 177,356 145,992 Unutilised credit card lines 25,044 - 5,009 3,757
Derivative financial contractsForeign exchange related contracts: - Less than one year 491,179 3,159 11,604 4,635
Total 2,240,896 3,159 602,368 404,453
Off-balance sheet exposures of the Bank arise mainly from the following:
Counterparty credit risk on derivative financial instruments is the risk that the Bank’s counterparty in a derivative contract isunable to meet the terms of the contract upon maturity. To mitigate the risk, the creditworthiness of the counterparty isthoroughly assessed and depending on a case to case basis, collateral may be required.
• Bank guarantee which represents the Bank’s undertaking tomake payment to the beneficiary in the event the customerunable to meet its obligations to the latter.
• Undrawn credit commitment represents the Bank’s commitment to extend credit for approved credit facilities which haveyet to be fully utilised within the availability period.
The off-balance sheet exposures and their related counterparty credit risk of the Bank as at the respective reporting dates are asfollows:
• Documentary letter of credit is the Bank ’ s undertaking on behalf of customer to make payment in relation to tradetransaction.
• Derivative financial instruments.
30 Jun 2015

(Company No. 839839) 14
5.3 Off-Balance Sheet Exposures and Counterparty Credit Risk (continued)
(i) Composition of Off-Balance Sheet Exposures (continued)
PositiveValue of Credit Risk-
Principal Derivative Equivalent WeightedAmount Contracts Amount AssetsRM’000 RM’000 RM’000 RM’000
Credit-related exposuresTransaction-related contingent items 620,391 - 310,196 177,732 Short term self-liquidating trade-related contingencies 2,864 - 573 147 Other commitments, such as formal standby facilities and credit lines, with an original maturity of: - Exceeding one year 104,691 - 52,346 40,744 - Not exceeding one year 942,825 - 188,565 169,671 Unutilised credit card lines 20,757 - 4,151 3,114
Derivative financial contractsForeign exchange related contracts: - Less than one year 806,800 592 13,647 3,589
Total 2,498,328 592 569,478 394,997
5.4 Credit Risk Mitigation
There is no netting arrangement in place for the Bank’s existing on and off-balance sheet exposures. The netting arrangementwill be considered on as-and-when basis to minimise the Bank’s risk exposures.
Proper legal documentations are in place to ensure that the Bank’s interests are protected and CRM are enforceable in theevent of default by the customer. The value and status of CRM will be reviewed periodically (at least once a year) to ensuretheBank’s exposures remain adequately covered. For collateral that its value fluctuates in a more frequent and volatile manner,such as quoted securities, the collateral value is marked tomarket on weekly basis for close monitoring. Top up of collataralmay be required to bring the loan-to-value ratio back to satisfactory level in the event of sharp deterioration in the collateralvalue.
In order to manage any potential concentration risk within the mitigation taken, there is a credit risk management report whichis prepared on a monthly basis, and any undue CRM concentration will be reported to the Board Risk Management Committee.Thus, the CRM concentration risk is appropriately managed whilst the Bank ’ s loan portfolio continues growing anddiversifying.
Prior to accepting the CRM, proper assessment on the aspect of legal enforceability and guarantor ’ s credibility will beundertaken to arrive at reasonable security coverage. Valuation on the property taken as CRM is required prior to the loan’sdrawdown.
The Bank takes prudent approach in granting credit facilities to customers. The main considerations in the credit assessmentprocess are assessing customer’s credit-worthiness, reliability of source of repayment and debt servicing ability. Credit RiskMitigates (“CRM”) such as collateral and guarantee providefurther comfort to the Bank’s exposures but these are deemedasthe secondary safeguard measure. Depending on the credit standing of the customer, the Bank may provide facilities tocustomer on a clean basis. It is the interest of the Bank to diversify its unsecured exposures to a larger pool of clients that carrygood credit grade.
31 Dec 2014
As at the respective reporting dates, the main types of collateral obtained to mitigate credit risks are in the form of cash deposit,bank guarantee, standby letter of credit, quoted shares andproperty. Corporate guarantee and personal guarantee are oftentaken to enhance the risk profile of the customer.

(Company No. 839839) 15
5.4 Credit Risk Mitigation (continued)
TotalExposures
Total Covered byTotal Exposures Eligible
Exposures Covered by FinancialBefore CRM Guarantees Collateral
Credit Risk RM’000 RM’000 RM’000
On-Balance Sheet ExposuresSovereigns/Central Banks 764,081 - - Banks, Development Financial Institutions and MDBs 720,072 - - Corporates 2,387,209 720,982 728,877Regulatory Retail 73,289 19,957 1,555Residential Mortgages 43,480 - 270Other Assets 15,789 - -
Total On-Balance Sheet Exposures 4,003,920 740,939 730,702
Off-Balance Sheet ExposuresCredit-related off-balance sheet exposures 590,764 229,764 67,931 OTC derivatives 11,604 - -
Total Off-Balance Sheet Exposures 602,368 229,764 67,931
Total On and Off-Balance Sheet Exposures 4,606,288 970,703 798,633
TotalExposures
Total Covered byTotal Exposures Eligible
Exposures Covered by FinancialBefore CRM Guarantees Collateral
Credit Risk RM’000 RM’000 RM’000
On-Balance Sheet ExposuresSovereigns/Central Banks 845,321 - - Banks, Development Financial Institutions and MDBs 957,163 - - Corporates 2,179,278 823,040 479,079Regulatory Retail 11,069 - 264 Residential Mortgages 36,596 - 552 Other Assets 17,947 - -
Total On-Balance Sheet Exposures 4,047,374 823,040 479,895
Off-Balance Sheet ExposuresCredit-related off-balance sheet exposures 555,831 203,454 47,012 OTC derivatives 13,647 - -
Total Off-Balance Sheet Exposures 569,478 203,454 47,012
Total On and Off-Balance Sheet Exposures 4,616,852 1,026,494 526,907
Note:
MDBs - Multilateral Development Banks
OTC - Over the counter
30 Jun 2015
31 Dec 2014
The following tables present the credit exposures covered by guarantee (bank guarantees) and eligible financial collateral(fixed deposits) as at the respective reporting dates:

(Company No. 839839) 16
5.5 Assignment of Risk Weights for Portfolios Under The Standardised Approach
(a) Standard & Poor’s Rating Services (“S&P”)(b) Moody’s Investors Service (“Moody’s”)(c) Fitch Ratings (“Fitch”)(d) RAM Rating Services Berhad (“RAM”)(e) Malaysian Rating Corporation Berhad (“MARC”)(f) Rating and Investment Information, Inc. (“R&I”).
(a) Sovereigns/Central Banks(b) Banking institutions(c) Corporates
Rated and Unrated Counterparties
The Bank refers to the credit ratings assigned by credit rating agencies in its calculation of credit risk-weighted assets. Thefollowing are the External Credit Assessment Institutions(“ECAI”) ratings used by the Bank and are recognised by BNM inthe RWCAF:
The issue rating i.e. the rating specific to the credit exposure is used. If there is no specific rating available, the credit ratingassigned to the issuer or counterparty of the particular credit exposure is used. In cases where an exposure has neither an issuenor issuer rating, it is deemed as unrated.
• Where 3 or more recognised external ratings are available,the lower of the highest 2 ratings will be used for capitaladequacy calculation purposes.
• Where 2 recognised external ratings are available, the lower rating is to be applied; or
The ECAI ratings accorded to the following counterparty exposure classes are used in the calculation of risk-weighted assetsfor capital adequacy purposes:

(Company No. 839839) 17
5.5 Assignment of Risk Weights for Portfolios Under The Standardised Approach (continued)
RatingCategory
S&P Moody’s Fitch R&I Risk Weight
1 AAA to AA- Aaa to Aa3 AAA to AA- AAA to AA- 0%2 A+ to A- A1 to A3 A+ to A- A+ to A- 20%3 BBB+ to BBB- Baa1 to Baa3 BBB+ to BBB- BBB+ to BBB- 50%4 BB+ to B- Ba1 to B3 BB+ to B- BB+ to B- 100%5 CCC+ to D Caa1 to C CCC+ to D CCC+ to C 150%
Unrated 100%
RatingCategory
S&P Moody’s Fitch R&I RAM MARC Risk Weight
1 AAA to AA- Aaa to Aa3 AAA to AA- AAA to AA- AAA to AA3 AAA to AA- 20%2 A+ to A- A1 to A3 A+ to A- A+ to A- A1 to A3 A+ to A- 50%3 BBB+ to BBB- Baa1 to Baa3 BBB+ to BBB- BBB+ to BBB- BBB1 to BBB3 BBB+ to BBB- 50%4 BB+ to B- Ba1 to B3 BB+ to B- BB+ to B- BB1 to B3 BB+ to B- 100%5 CCC+ to D Caa1 to C CCC+ to D CCC+ to C C1 to D C+ to D 150%
Unrated 50%
RatingCategory
Risk Weight(original
maturity of ≤6 months)
Risk Weight(original
maturity of ≤3 months)
1 20%2 20%3 20% 20%4 50%5 150%
Unrated 20%
RatingCategory
S&P Moody’s Fitch R&I RAM MARC Risk Weight
1 AAA to AA- Aaa to Aa3 AAA to AA- AAA to AA- AAA to AA3 AAA to AA- 20%2 A+ to A- A1 to A3 A+ to A- A+ to A- A1 to A3 A+ to A- 50%3 BBB+ to BB- Baa1 to Ba3 BBB+ to BB- BBB+ to BB- BBB1 to BB3 BBB+ to BB- 100%4 B+ to D B1 to C B+ to D B+ to D B1 to D B+ to D 150%
Unrated 100%
Corporate
Banking Institutions
Sovereigns/Central Banks
The following is a summary of the risk weights and rating categories used in assigning credit quality to each exposure underthe Standardised Approach.
In cases where the credit exposures are secured by guarantees issued by eligible or rated guarantors, the risk weights similar tothat of the guarantor are assigned.
Banking Institutions

(Company No. 839839 M) 18
5.5 Assignment of Risk Weights for Portfolios Under The Standardised Approach (continued)
(i) Rated Exposures As Per ECAIs
1 2 3 4 5 Unrated TotalRM’000 RM’000 RM’000 RM’000 RM’000 RM’000 RM’000
On and Off-Balance Sheet ExposuresSovereigns/Central Banks - - - - - 764,081 764,081
1 2 3 4 5 Unrated TotalRM’000 RM’000 RM’000 RM’000 RM’000 RM’000 RM’000
On and Off-Balance Sheet ExposuresBanks, MDBs and DFIs - 782,718 64,694 24,581 - 86,109 958,102
1 2 3 4 Unrated TotalRM’000 RM’000 RM’000 RM’000 RM’000 RM’000
On and Off-Balance Sheet ExposuresCorporates 124,528 138,173 248,730 67,580 2,132,695 2,711,706
1 2 3 4 Unrated TotalRM’000 RM’000 RM’000 RM’000 RM’000 RM’000
On and Off-Balance Sheet ExposuresRegulatory Retail - - 19,957 - 75,229 95,186
1 2 3 4 Unrated TotalRM’000 RM’000 RM’000 RM’000 RM’000 RM’000
On and Off-Balance Sheet ExposuresResidential Mortgages - - - - 61,424 61,424
1 2 3 4 5 Unrated TotalRM’000 RM’000 RM’000 RM’000 RM’000 RM’000 RM’000
On and Off-Balance Sheet ExposuresSovereigns/Central Banks - - - - - 845,321 845,321
1 2 3 4 5 Unrated TotalRM’000 RM’000 RM’000 RM’000 RM’000 RM’000 RM’000
On and Off-Balance Sheet ExposuresBanks, MDBs and DFIs - 970,747 - - - - 970,747
1 2 3 4 Unrated TotalRM’000 RM’000 RM’000 RM’000 RM’000 RM’000
On and Off-Balance Sheet ExposuresCorporates 114,132 301,434 275,618 257,287 1,762,481 2,710,952
1 2 3 4 Unrated TotalRM’000 RM’000 RM’000 RM’000 RM’000 RM’000
On and Off-Balance Sheet ExposuresRegulatory Retail - - - - 17,024 17,023
1 2 3 4 Unrated TotalRM’000 RM’000 RM’000 RM’000 RM’000 RM’000
On and Off-Balance Sheet ExposuresResidential Mortgages - - - - 54,862 54,863
Note:
MDBs - Multilateral Development Banks
DFIs - Development Financial Institutions
The following tables present the credit exposures, categorised according to the credit quality rating as at 31 December 2014:
Ratings of Regulatory Retail
Ratings of Residential Mortgages
The following tables present the credit exposures, categorised according to the credit quality rating as at 30 June 2015:
Ratings of Sovereigns/Central Banks
Ratings of Banking Institutions
Ratings of Corporates
Ratings of Residential Mortgages
Ratings of Sovereigns/Central Banks
Ratings of Banking Institutions
Ratings of Corporates
Ratings of Regulatory Retail

(Company No. 839839 M) 195.5 Assignment of Risk Weights for Portfolios Under The Standardised Approach (continued)
(ii) Assignment of Risk Weights for Portfolios Under The Standardised Approach
Sovereign/ Total Exposures After Total Risk-Central Banks, Regulatory Residential Other Netting & Credit Weighted
30 Jun 2015 Banks MDBs and DFIs Corporates Retail Mortgages Assets Risk Mitigation AssetsRisk Weights RM’000 RM’000 RM’000 RM’000 RM’000 RM’000 RM’000 RM’000
0% 764,081 - 793,453 4,911 270 5,156 1,567,871 - 20% - 689,576 132,078 - - 4,178 825,832 165,166 35% - - - - 52,999 - 52,999 18,550 50% - 30,496 819,628 19,957 7,624 7,255 884,960 442,480 75% - - - 6,196 - - 6,196 4,647
100% - - 1,192,973 64,122 531 10,804 1,268,430 1,268,430 Total Exposures 764,081 720,072 2,938,132 95,186 61,424 27,393 4,606,288 1,899,273 Risk-Weighted Assets by Exposures - 153,163 1,629,203 78,747 22,893 15,267 1,899,273 Average Risk Weight 0.0% 21.3% 55.5% 82.7% 37.3% 55.7% 41.2%Deduction from Capital Base - - - - - - -
Sovereign/ Total Exposures After Total Risk-Central Banks, Regulatory Residential Other Netting & Credit Weighted
31 Dec 2014 Banks MDBs and DFIs Corporates Retail Mortgages Assets Risk Mitigation AssetsRisk Weights RM’000 RM’000 RM’000 RM’000 RM’000 RM’000 RM’000 RM’000
0% 845,321 - 525,817 538 552 5,137 1,377,365 - 20% - 957,163 121,126 - - 10,886 1,089,175 217,835 35% - - - - 46,740 - 46,740 16,359 50% - - 767,505 - 7,037 2,697 777,239 388,620 75% - - - 5,501 - - 5,501 4,126
100% - - 1,296,440 10,985 533 12,874 1,320,832 1,320,832 Total Exposures 845,321 957,163 2,710,888 17,024 54,862 31,594 4,616,852 1,947,772
Risk-Weighted Assets by Exposures - 191,433 1,704,418 15,110 20,411 16,400 1,947,772 Average Risk Weight 0.0% 20.0% 62.9% 88.8% 37.2% 51.9% 42.2%
Deduction from Capital Base - - - - - - -
Note:
MDBs - Multilateral Development Banks
DFIs - Development Financial Institutions
Exposures after Netting and Credit Risk Mitigation
The following tables present the breakdown of credit exposures by risk weights as at the respective reporting dates:
Exposures after Netting and Credit Risk Mitigation

(Company No. 839839) 20
6.0 Market Risk
6.1 Interest Rate Risk in the Banking Book (IRRBB)
-100 bps +100 bps -100 bps +100 bpsRM’000 RM’000 RM’000 RM’000
Impact on net interest incomeRinggit Malaysia (6,658) 6,658 (6,817) 6,817 United States Dollar (4,115) 4,115 (2,644) 2,644
Chinese Renminbi 363 (363) 64 (64) Others 496 (496) 57 (57)
Total (9,914) 9,914 (9,340) 9,340
Impact on economic valueRinggit Malaysia (3,172) 3,172 (2,715) 2,715United States Dollar (3,952) 3,952 (2,321) 2,321Chinese Yuan Renminbi 220 (220) 41 (41)Others (166) 166 (112) 112
Total (7,070) 7,070 (5,107) 5,107
The projection, by using the repricing gap method, assumes that interest rate moves up and down parallelly by 100 basis points(“bps”) across all maturities for all the interest bearing assets and liabilities. It is further assumed that all positions are repricedat the mid-point of each time band and will run to maturity. The repricing profile of loan that does not have maturity is basedon the earliest possible repricing dates. The impact on earnings and economic value is measured on a quarterly basis.
The table below illustrates the impact under a 100 bps parallel upward interest rate shock on the Bank’s earnings and economicvalue.
31 Dec 201430 Jun 2015
Market risk is the risk of loss arising from movements in market variables, such as interest rates, credit spreads and foreignexchange rates. The Bank ’s market risk management is the process of identifying, measuring, monitoring, controlling andreporting market risk for the purposes of setting up and enhancing the market risk management system, specifyingresponsibilities and process, determining and standardising the measurement approaches, limit management indicators andmarket risk reports, controlling and mitigating market risk and improving the level of market risk management. The objectiveof market risk management is to manage and control market risk exposures within a tolerable level and maximise risk-adjustedreturn according to the Bank’s risk preference.
The types of market risk faced by the Bank mainly include interest rate risk and exchange rate risk. For derivative contractsthat the Bank enters into with its counterparty, the Bank will square its position by entering into offsetting trades with otherfinancial institutions. The netting arrangements, if required and to be considered on case-to-case basis, will be in place tominimise the credit risk of its derivative counterparties as the cash flows are netted on the settlement date. For interest rate risk,the Bank conducts gap analysis through sensitivity testingand seeks to minimise the interest rate sensitivity gap. TheAsset andLiabilities Committee (“ALCO”) plays a critical role in monitoring the Bank’s overall interest rate risk profile and the Bank’searnings sensitivity in an interest rate changing environment.
The Bank does not engage in any proprietary trading activities. Exposures arising from normal banking activities (deposits,loans, foreign exchange, etc) are hedged accordingly to minimise and preferably eliminate exposure to market risk. Allrisksrelated to treasury money market activities will be managed according to, and within the authorised risk limits.
The minimum regulatory capital requirement on market risk exposures for the financial period is disclosed in note 2.0 (b).

(Company No. 839839) 21
7.0 Operational Risk
• requirement for appropriate segregation of duties, including the independent authorisation of transactions• requirements for the reconciliation and monitoring of transactions• compliance with regulatory and other legal requirements• documentation of controls and procedures• development of contingency plans• training and professional development• ethical and business standards• risk mitigation, including insurance where applicable
8.0 Liquidity Risk
The minimum regulatory capital requirement on operational risk exposures for the financial period is disclosed in note 2.0 (b).
It is imperative for the Bank to continuously seek and maintain new sources of funding to increase and diversify its fundingbase. The Bank also endeavours to maintain an optimum liquidity position at all times in order to meet the requirement onBasel III's liquidity standards imposed by BNM over the coming years.
The management of liquidity and funding is mainly carried out in compliance with BNM ’ s liquidity coverage ratio; andpractices and limits set by parent company, and the Assets and Liabilities Committee (“ALCO”). The Bank maintains a strongliquidity position and constantly manage the liquidity profile of its assets, liabilities and commitments to ensure that cash flowrequirements are appropriately balanced and all obligations are met accordingly.
Liquidity risks are the risks when the Bank fails to raise funds to meet the present or future demand of customers orcounterparties at a reasonable cost. The potential liquidity risks of the Bank include mainly customers ’ premature andcollective withdrawal, overdue payment of the debtors, mismatched asset-liability maturity structure and difficulties inrealisation of assets.
Operational risk is the risk of direct or indirect loss arising from a wide variety of causes associated with the Bank’s processes,personnel, technology and infrastructure, and from external factors other than credit, market and liquidity risk.
The primary responsibility for the development and implementation of controls to address operational risk is assignedto SeniorManagement within each department. The responsibility is supported by the development of a Bank-wide standard for themanagement of operational risk in the following areas: