Embed Size (px)
Citation preview
INDUS RIVER SYSTEM AUTHORITY(IRSA)
“Inter Provincial Water Distribution and the Need for Reservoirs”
Rao Irshad Ali KhanMember IRSA PunjabDecember 19, 2014
Presentation to LEAD Pakistan’s F-7 Markaz, Islamabad
S.N: 01
3
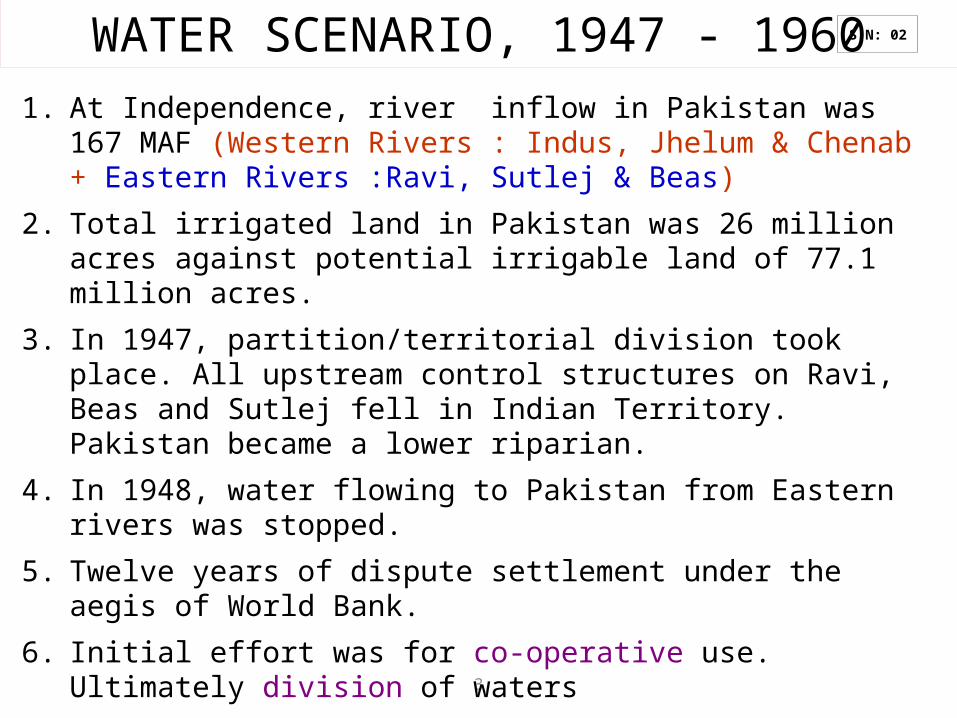
WATER SCENARIO, 1947 - 19601. At Independence, river inflow in Pakistan was 167 MAF (Western
Rivers : Indus, Jhelum & Chenab + Eastern Rivers :Ravi, Sutlej & Beas)
2. Total irrigated land in Pakistan was 26 million acres against potential irrigable land of 77.1 million acres.
3. In 1947, partition/territorial division took place. All upstream control structures on Ravi, Beas and Sutlej fell in Indian Territory. Pakistan became a lower riparian.
4. In 1948, water flowing to Pakistan from Eastern rivers was stopped.
5. Twelve years of dispute settlement under the aegis of World Bank.
6. Initial effort was for co-operative use. Ultimately division of waters
7. For Pakistan: Indus, Jhelum and Chenab. For India: Ravi, Sutlej and Beas. Transfer of Water from Western to Eastern rivers was necessitated.
S.N: 02
The Water Agreements
Indus Waters Treaty 1960
Water Apportionment Accord 1991
S.N: 03
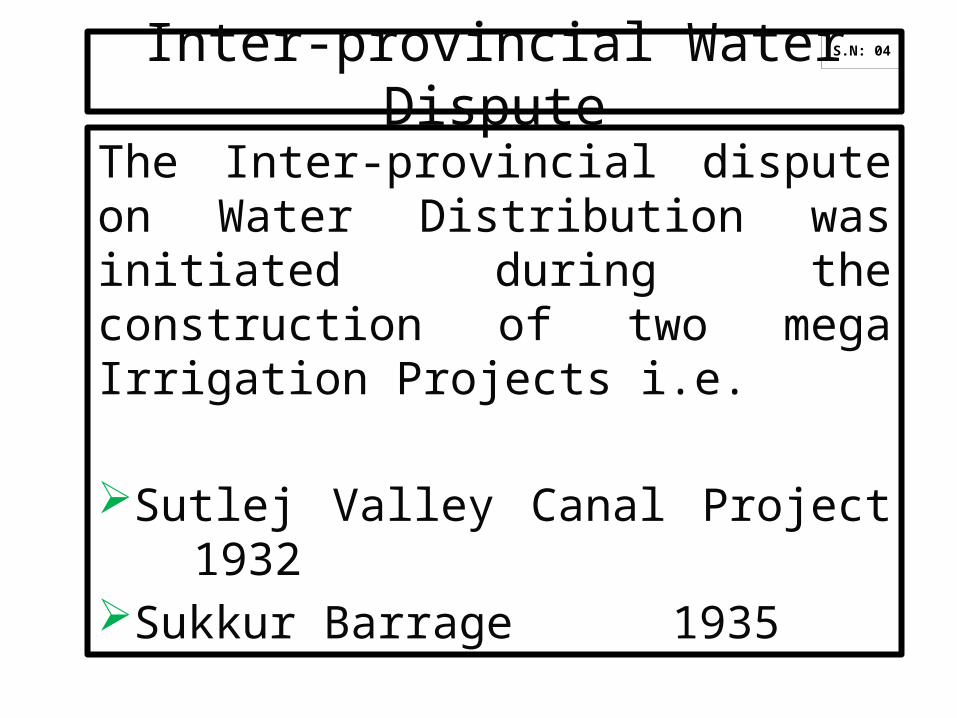
Inter-provincial Water Dispute
The Inter-provincial dispute on Water Distribution was initiated during the construction of two mega Irrigation Projects i.e.
Sutlej Valley Canal Project 1932Sukkur Barrage 1935
S.N: 04
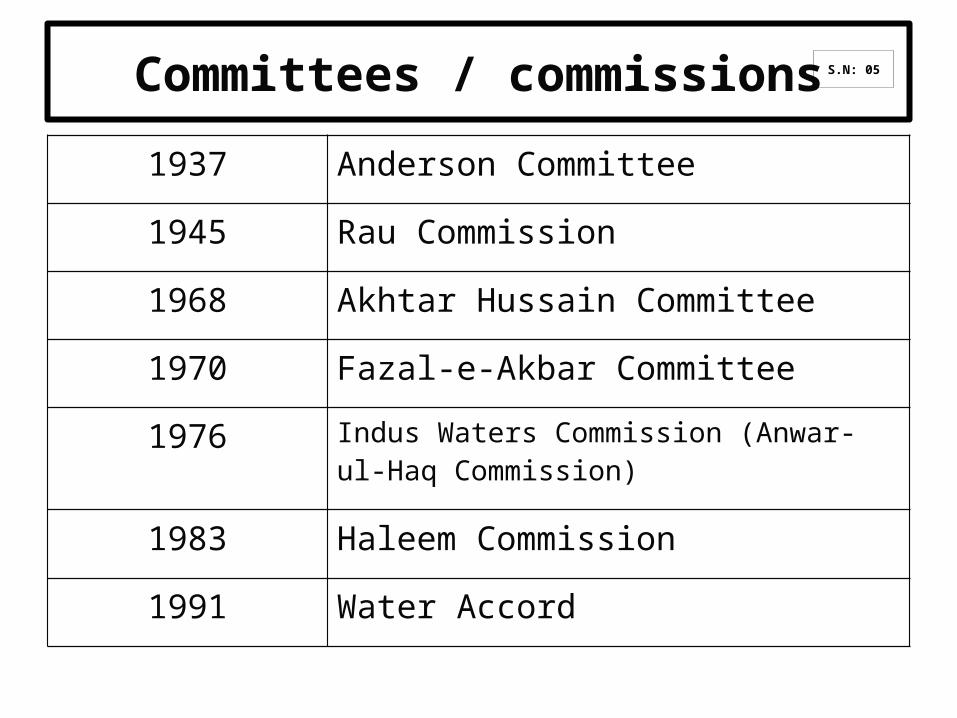
Committees / commissions
1937 Anderson Committee
1945 Rau Commission
1968 Akhtar Hussain Committee
1970 Fazal-e-Akbar Committee
1976 Indus Waters Commission (Anwar-ul-Haq Commission)
1983 Haleem Commission
1991 Water Accord
S.N: 05
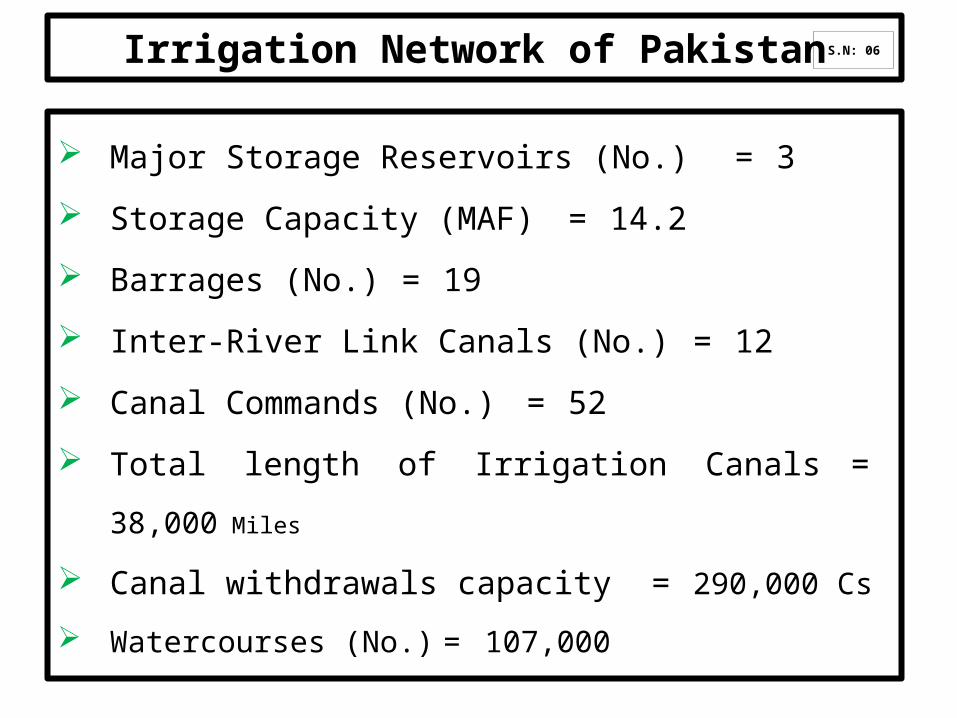
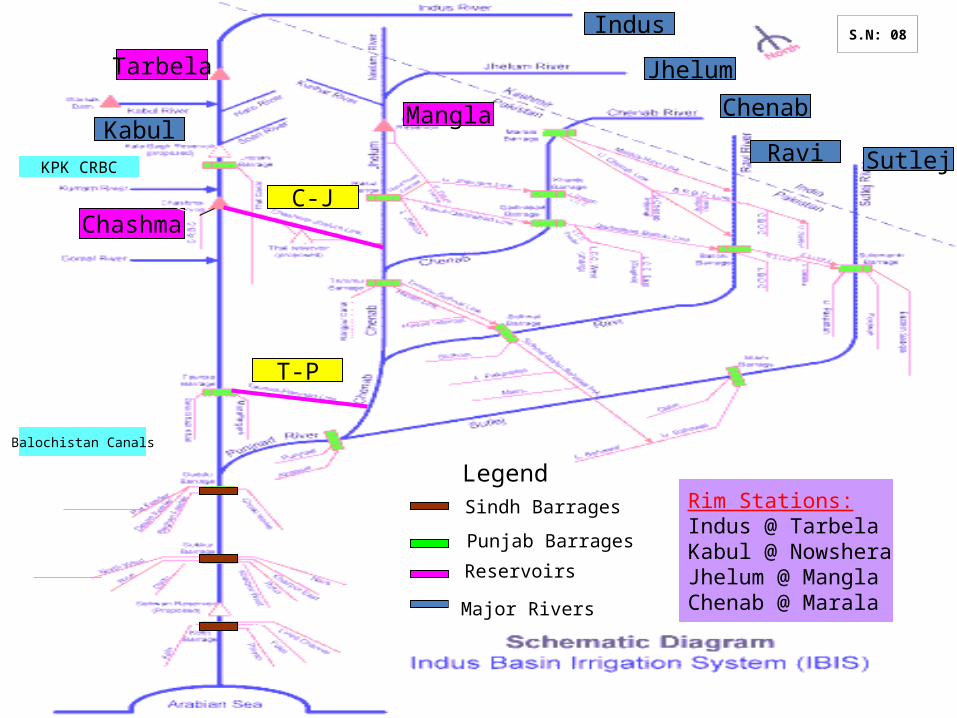
Irrigation Network of Pakistan
Major Storage Reservoirs (No.) = 3 Storage Capacity (MAF) = 14.2 Barrages (No.) = 19 Inter-River Link Canals (No.) = 12 Canal Commands (No.) = 52 Total length of Irrigation Canals = 38,000 Miles
Canal withdrawals capacity =
290,000 Cs Watercourses (No.) = 107,000
S.N: 06
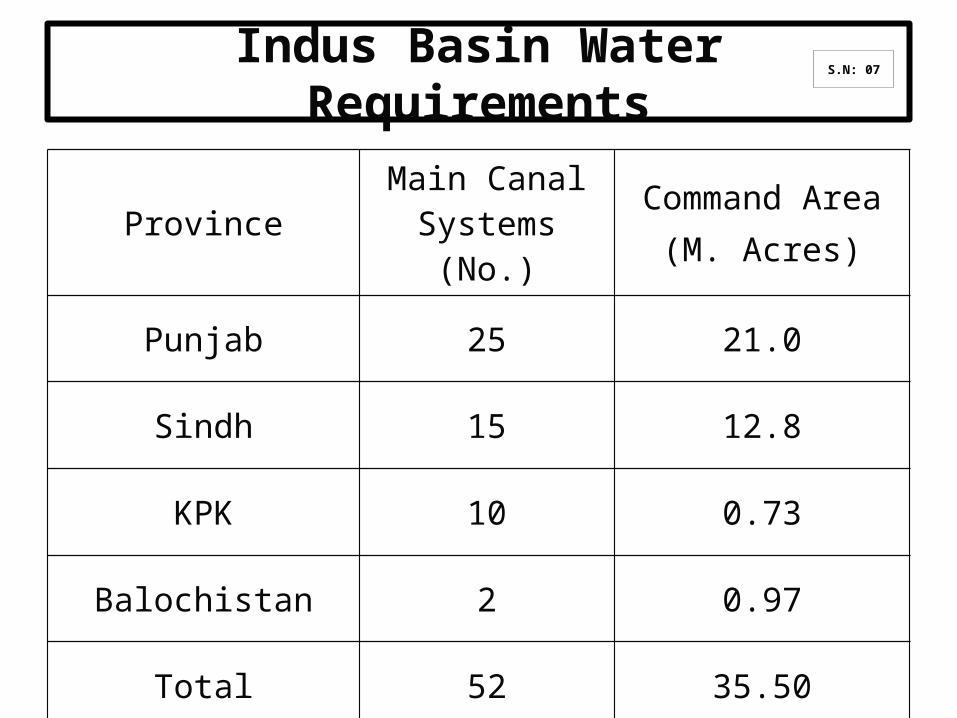
Indus Basin Water Requirements
Province Main Canal Systems (No.)
Command Area(M. Acres)
Punjab 25 21.0
Sindh 15 12.8
KPK 10 0.73
Balochistan 2 0.97
Total 52 35.50
S.N: 07
9
Rim Stations:Indus @ TarbelaKabul @ NowsheraJhelum @ ManglaChenab @ Marala
Tarbela
ManglaKabul
Indus
Jhelum
Chenab
Ravi Sutlej
ChashmaC-J
T-P
Sindh Barrages
Legend
Punjab Barrages
Balochistan Canals
KPK CRBC
Reservoirs
Major Rivers
S.N: 08
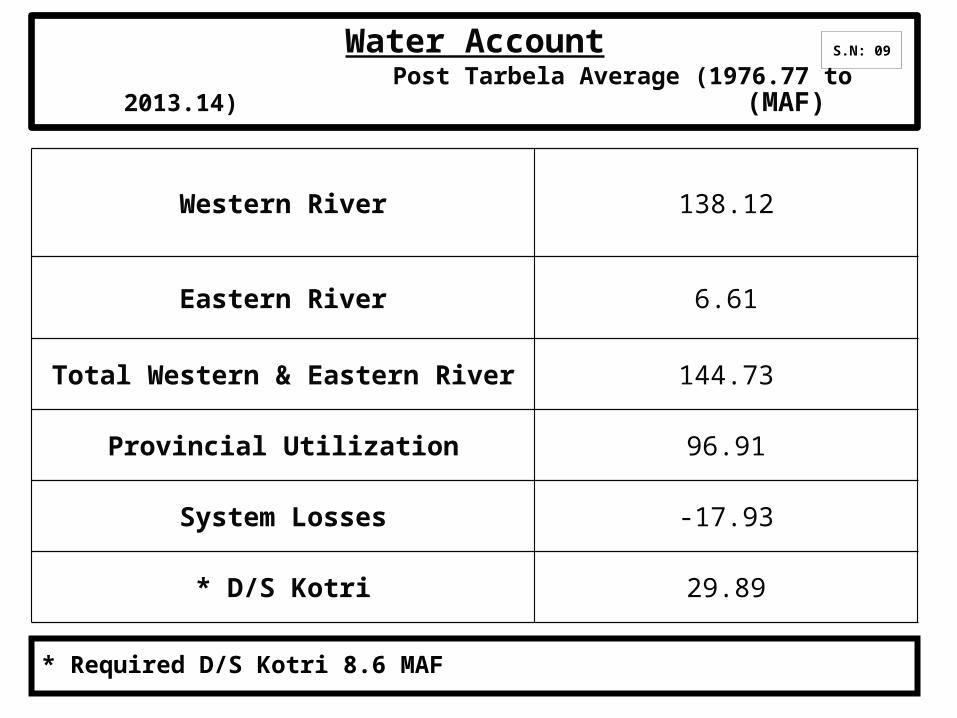
Water Account Post Tarbela Average (1976.77 to 2013.14)
(MAF)
Western River 138.12
Eastern River 6.61
Total Western & Eastern River 144.73
Provincial Utilization 96.91
System Losses -17.93
* D/S Kotri 29.89
* Required D/S Kotri 8.6 MAF
S.N: 09
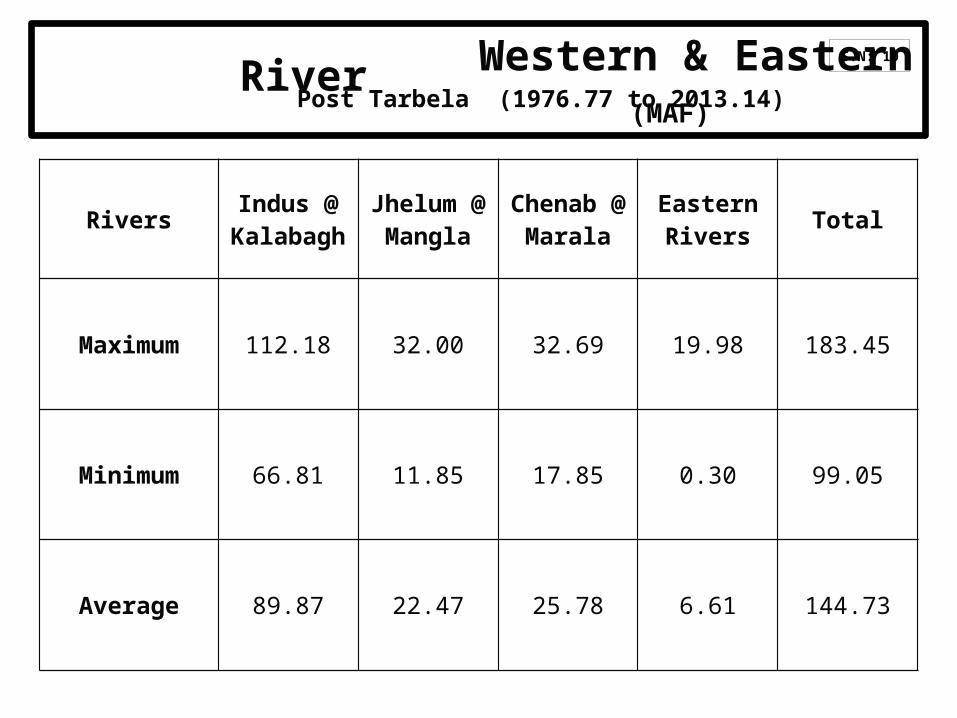
Western & Eastern River Post Tarbela (1976.77 to 2013.14) (MAF)
RiversIndus @
KalabaghJhelum @
ManglaChenab @
MaralaEastern Rivers
Total
Maximum 112.18 32.00 32.69 19.98 183.45
Minimum 66.81 11.85 17.85 0.30 99.05
Average 89.87 22.47 25.78 6.61 144.73
S.N: 10
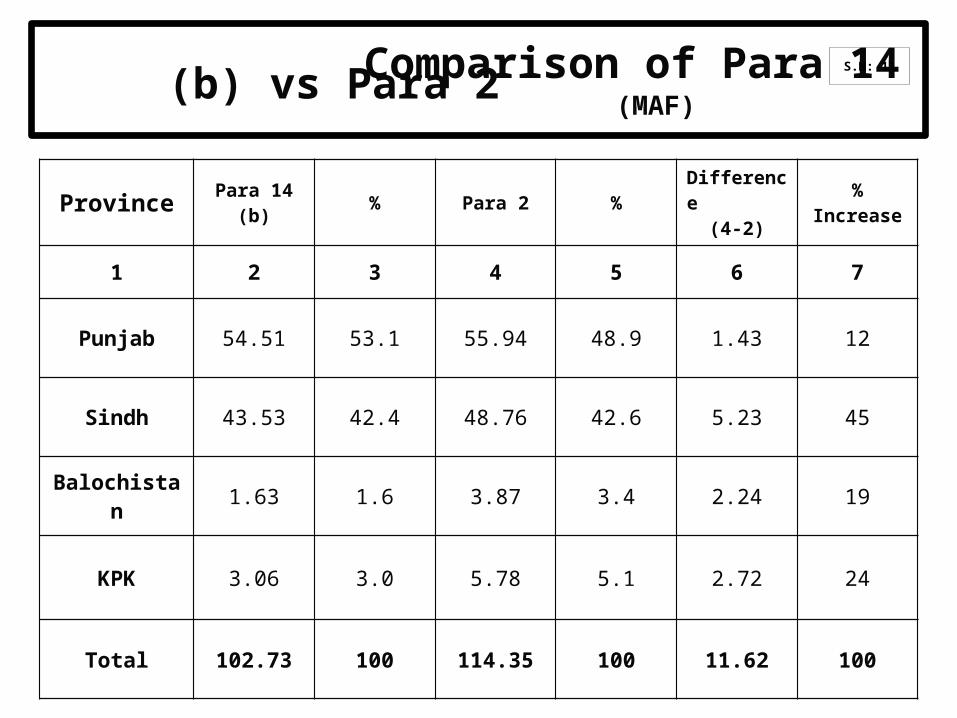
Comparison of Para 14 (b) vs Para 2 (MAF)
Province Para 14 (b) % Para 2 %Difference (4-2)
% Increase
1 2 3 4 5 6 7
Punjab 54.51 53.1 55.94 48.9 1.43 12
Sindh 43.53 42.4 48.76 42.6 5.23 45
Balochistan 1.63 1.6 3.87 3.4 2.24 19
KPK 3.06 3.0 5.78 5.1 2.72 24
Total 102.73 100 114.35 100 11.62 100
S.N: 11
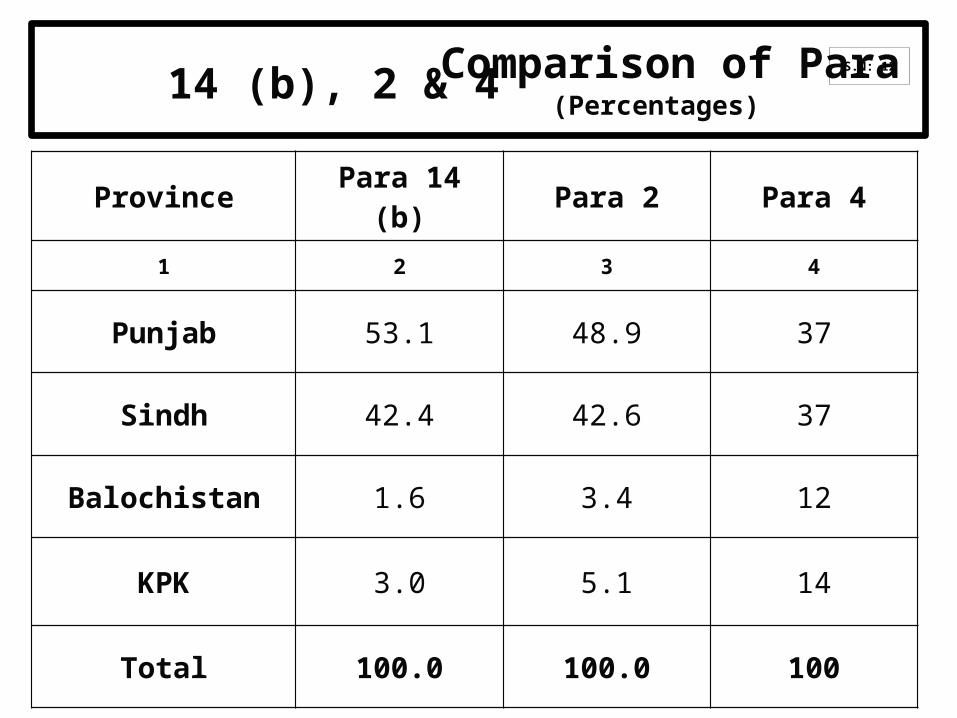
Comparison of Para 14 (b), 2 & 4 (Percentages)
Province Para 14 (b) Para 2 Para 4
1 2 3 4
Punjab 53.1 48.9 37
Sindh 42.4 42.6 37
Balochistan 1.6 3.4 12
KPK 3.0 5.1 14
Total 100.0 100.0 100
S.N: 12
14
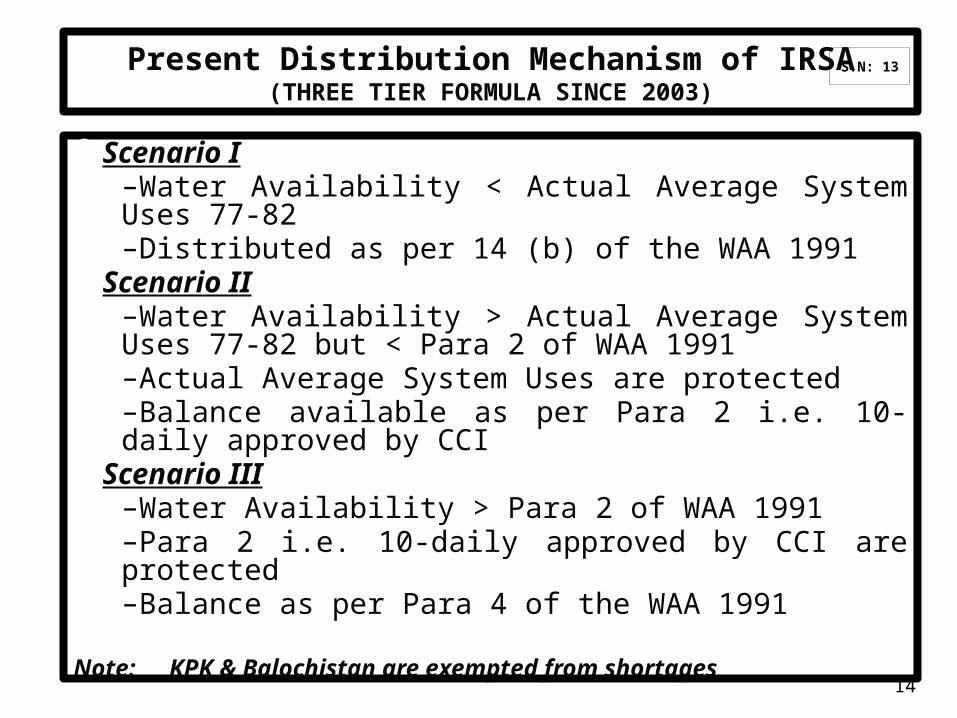
Present Distribution Mechanism of IRSA(THREE TIER FORMULA SINCE 2003)
Scenario I–Water Availability < Actual Average System Uses 77-82–Distributed as per 14 (b) of the WAA 1991
Scenario II–Water Availability > Actual Average System Uses 77-82 but < Para 2 of WAA 1991–Actual Average System Uses are protected–Balance available as per Para 2 i.e. 10-daily approved by CCI
Scenario III–Water Availability > Para 2 of WAA 1991–Para 2 i.e. 10-daily approved by CCI are protected–Balance as per Para 4 of the WAA 1991
Note: KPK & Balochistan are exempted from shortages
S.N: 13
15
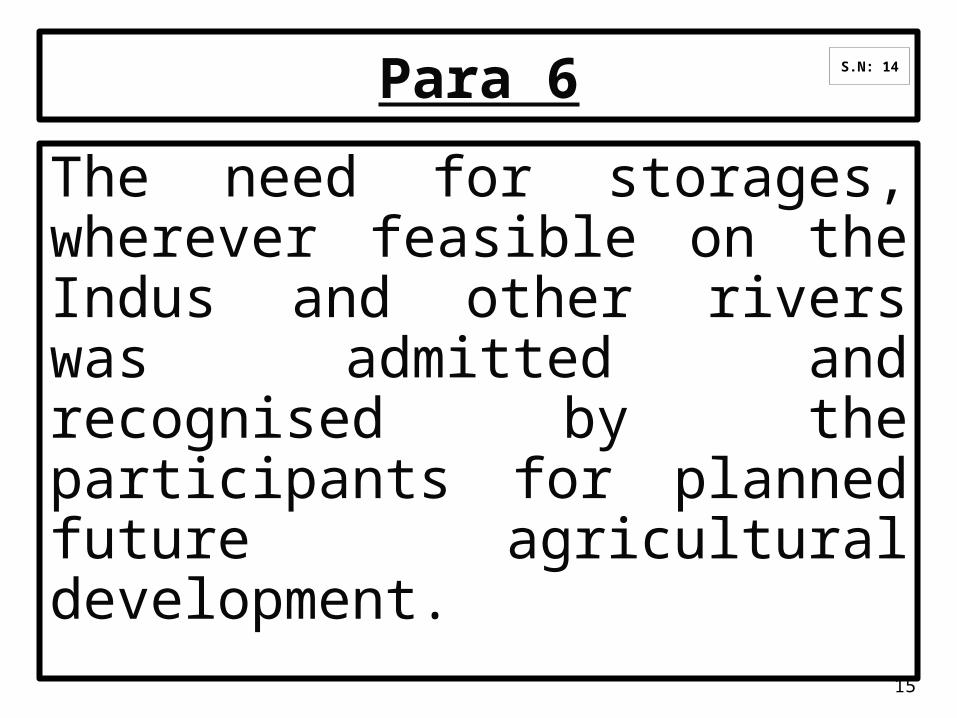
Para 6
The need for storages, wherever feasible on the Indus and other rivers was admitted and recognised by the participants for planned future agricultural development.
S.N: 14
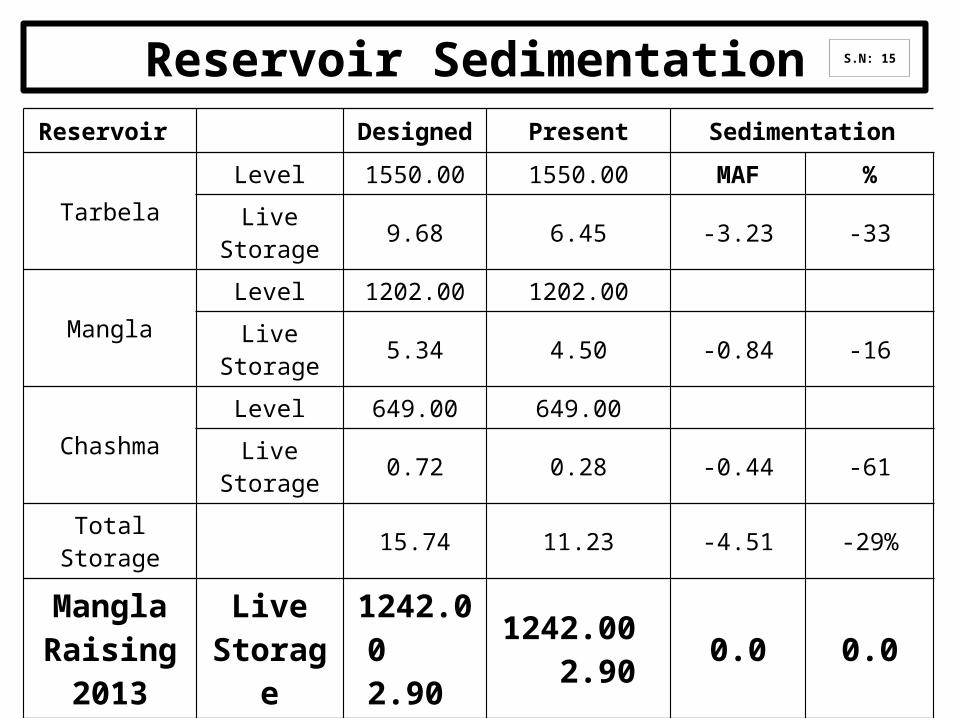
Reservoir SedimentationReservoir Designed Present Sedimentation
TarbelaLevel 1550.00 1550.00 MAF %
Live Storage
9.68 6.45 -3.23 -33
ManglaLevel 1202.00 1202.00
Live Storage
5.34 4.50 -0.84 -16
ChashmaLevel 649.00 649.00
Live Storage
0.72 0.28 -0.44 -61
Total Storage 15.74 11.23 -4.51 -29%
Mangla Raising
2013
Live Storage
1242.00 2.90
1242.00 2.90 0.0 0.0
Total 18.64 14.13 -4.51 -24
S.N: 15
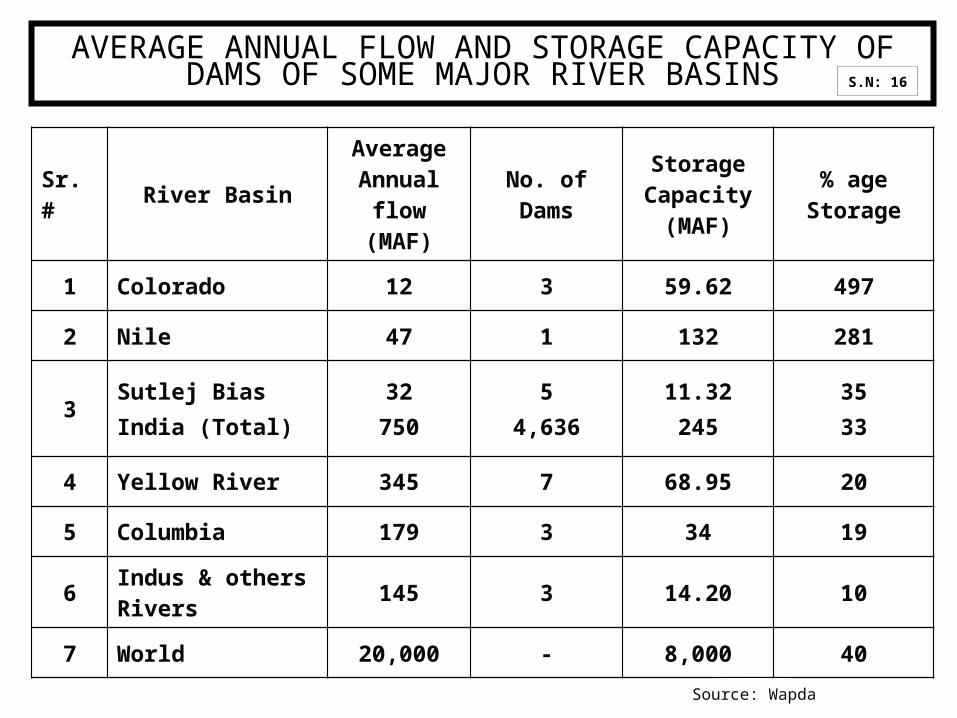
Sr. # River BasinAverage Annual
flow (MAF)No. of Dams
Storage Capacity
(MAF)
% age Storage
1 Colorado 12 3 59.62 497
2 Nile 47 1 132 281
3Sutlej BiasIndia (Total)
32750
54,636
11.32245
3533
4 Yellow River 345 7 68.95 20
5 Columbia 179 3 34 19
6Indus & others Rivers
145 3 14.20 10
7 World 20,000 - 8,000 40
AVERAGE ANNUAL FLOW AND STORAGE CAPACITY OF DAMS OF SOME MAJOR RIVER BASINS
Source: Wapda
S.N: 16
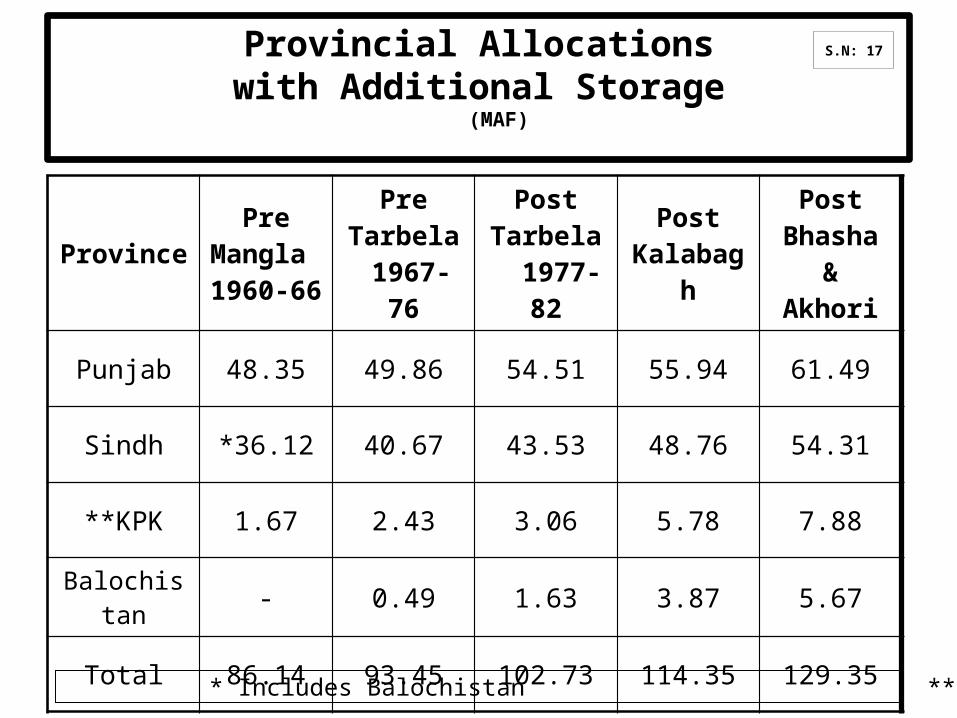
Provincial Allocationswith Additional Storage
(MAF)
ProvincePre
Mangla 1960-66
Pre Tarbela 1967-76
Post Tarbela 1977-82
Post Kalabagh
Post Bhasha &
Akhori
Punjab 48.35 49.86 54.51 55.94 61.49
Sindh *36.12 40.67 43.53 48.76 54.31
**KPK 1.67 2.43 3.06 5.78 7.88
Balochistan - 0.49 1.63 3.87 5.67
Total 86.14 93.45 102.73 114.35 129.35
* Includes Balochistan ** Excluding Un-gauged Civil Canals
S.N: 17
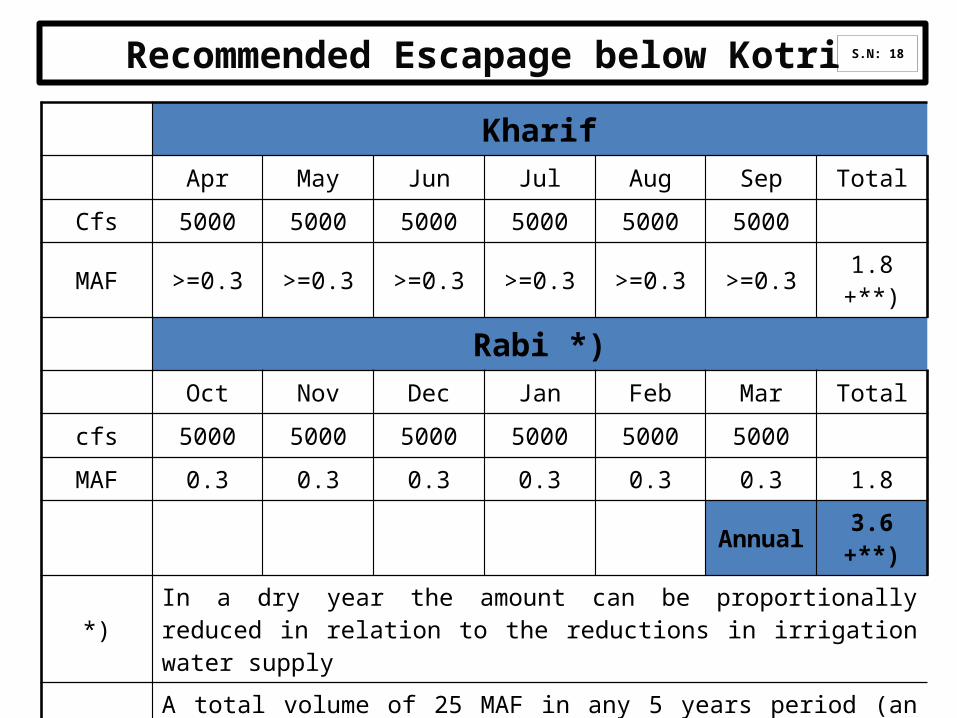
Recommended Escapage below Kotri
KharifApr May Jun Jul Aug Sep Total
Cfs 5000 5000 5000 5000 5000 5000
MAF >=0.3 >=0.3 >=0.3 >=0.3 >=0.3 >=0.3 1.8 +**)
Rabi *)Oct Nov Dec Jan Feb Mar Total
cfs 5000 5000 5000 5000 5000 5000
MAF 0.3 0.3 0.3 0.3 0.3 0.3 1.8
Annual 3.6 +**)
*)In a dry year the amount can be proportionally reduced in relation to the reductions in irrigation water supply
**)
A total volume of 25 MAF in any 5 years period (an annual equivalent of 5 MAF) to be released in a concentrated way as flood flow (Kharif period), to be adjusted according to the ruling storage in the reservoirs and the volume discharged in the four previous years.
S.N: 18
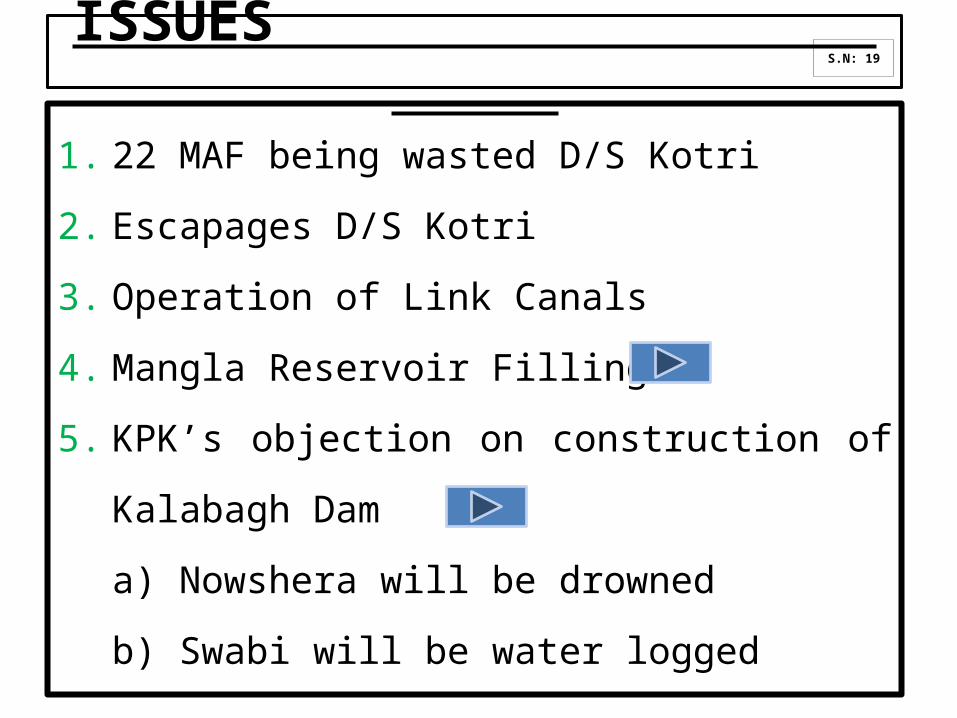
1. 22 MAF being wasted D/S Kotri
2. Escapages D/S Kotri
3. Operation of Link Canals
4. Mangla Reservoir Filling
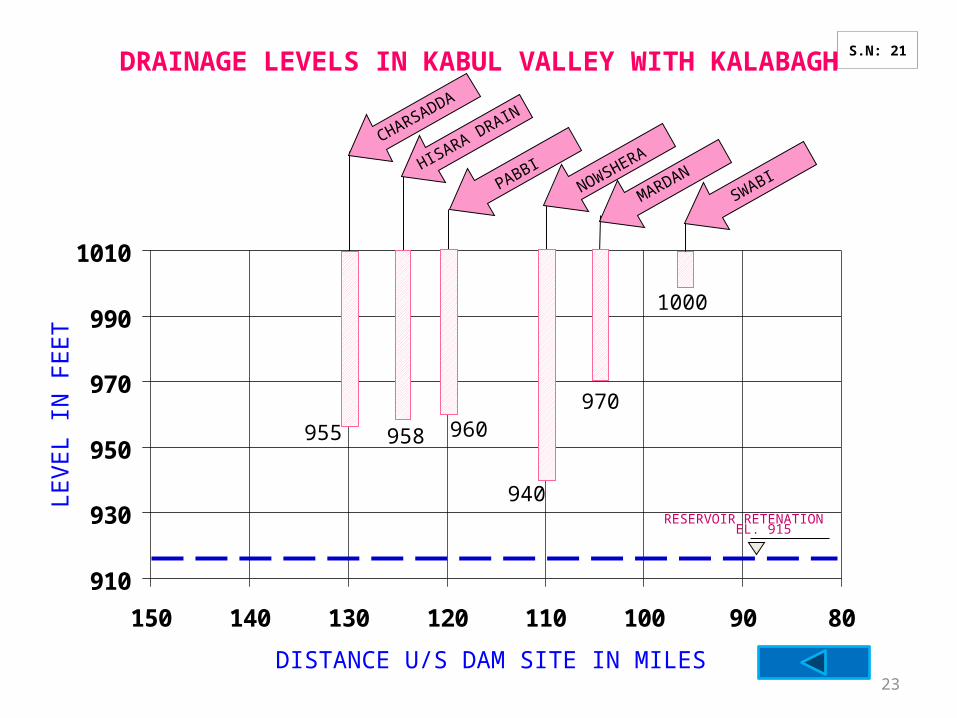
5. KPK’s objection on construction of
Kalabagh Dam
a) Nowshera will be drowned
b) Swabi will be water logged
S.N: 19ISSUES

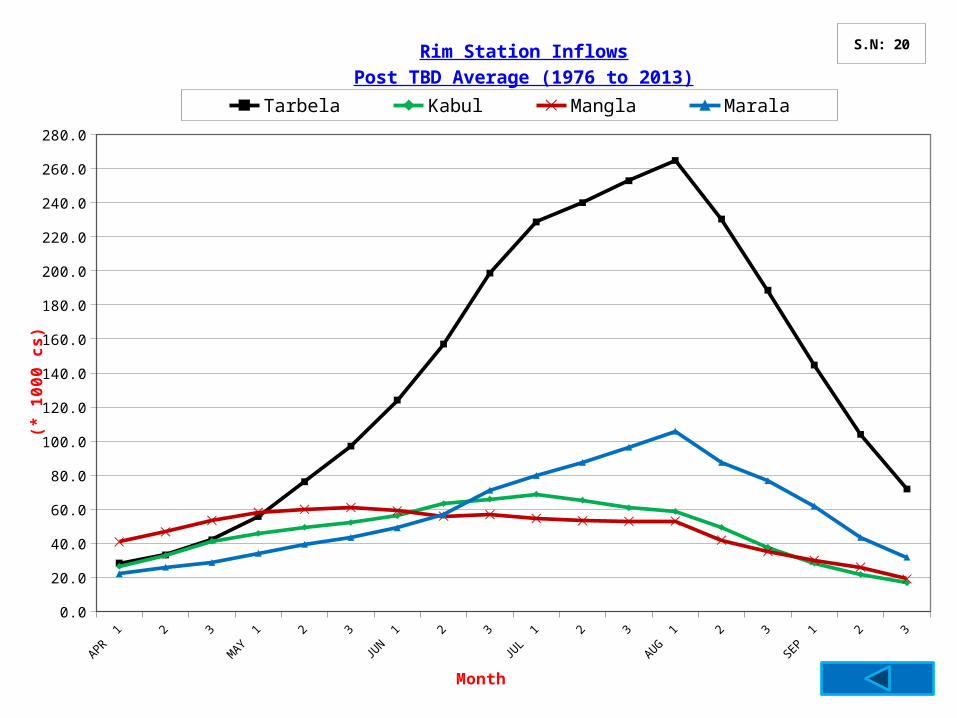
APR 1 2 3
MAY 1 2 3
JUN 1 2 3
JUL
1 2 3
AUG 1 2 3
SEP 1 2 30.0
20.0
40.0
60.0
80.0
100.0
120.0
140.0
160.0
180.0
200.0
220.0
240.0
260.0
280.0
Rim Station InflowsPost TBD Average (1976 to 2013)
Tarbela Kabul Mangla Marala
Month
(* 1
00
0 c
s)
S.N: 20
23
DRAINAGE LEVELS IN KABUL VALLEY WITH KALABAGH
910
930
950
970
990
1010
150 140 130 120 110 100 90 80
SWABI
CHARSADDA
PABBINOWSHERA
MARDAN
RESERVOIR RETENATION EL. 915
DISTANCE U/S DAM SITE IN MILES
LEVE
L IN
FEE
T
955 960
940
970
1000
958
HISARA DRAIN
S.N: 21