Embed Size (px)
Citation preview

GLOBAL COUNTRY STUDY REPORT
ON
“Textile Industries of Indonesia
W.R.T . Business Opportunities for Gujarat and Orissa”
SUBMITTED TO
Institute Code: 729
L.J. Institute of Management Studies
UNDER THE GUIDANCE OF
Prof. Dhara Shah
Assistant Professor
IN PARTIAL FULFILLMENT OF THE
REQUIREMENT OF THE AWARD FOR THE DEGREE OF
MASTER OF BUSINESS ADMINISTRATION (MBA)
Offered By
Gujarat Technological University
Ahmadabad
Prepared by:
Students of
MBA SEMESTER III
Group No. 6
November, 2015

Student’s Declaration
We, following students, hereby declare that the Global Country Study Report titled "Textile
Industries of Indonesia W.R.T .Business Opportunities for Gujarat and Orissa” is a
result of our own work and our indebtedness to other work publications, references, if any,
have been duly acknowledged. If we are found guilty of copying any other report or
published information and showing as our original work, or extending plagiarism limit, I
understand that we shall be liable and punishable by GTU, which may include ‘Fail’ in
examination, ‘Repeat study & re-submission of the report’ or any other punishment that GTU
may decide.
Enrollment no. Name Signature
147290592110 Meera I. Ramani
147290592131 Zalak D. Shah
147290592111 Jigar P. Rami
147290592122 Balaji M. Sengundher
147290592132 Monika A. Sharma
Place: Ahmedabad Date:
Institute Certificate
Certified that this Global Country Study and Report titled “Textile Industries Of Indonesia
W.R.T .Business Opportunities For Gujarat And Orissa” is the bonafide work of Jigar
Rami (Enr no. 147290592111), Balaji Sengundhar (Enr no. 147290592122), Meera Ramani
(Enr no. 147290592110), Zalak Shah (Enr no. 147290592131) and Monika Sharma (Enr no.
147290592132) who have carried out their research under my supervision. I also certify
further, that to the best of my knowledge the work reported herein does not form part of any
other project report or dissertation on the basis of which a degree or award was conferred on
an earlier occasion on this or any other candidate. I have also checked the plagiarism extent
of this report which is …………% and the separate plagiarism report in the form of html /
pdf file is enclosed with this.
Assistant Professor
Prof. Dhara Shah
Director
Dr. P. K. Mehta

PREFACE
This global country study at MBA program develops a feeling about the difficulties and
challenges in the business world. Only theoretical knowledge is not important, but practical
knowledge along with that is also important as it adds meaning to education.
Through this report we came to know the various aspects of the country, economic and
social factors surrounding INDONESIA. We came to know about the environment prevailing
in the country for trade and commerce carried out in the country.
In this report we have studied the supply chains of the retailers and wholesalers. Media
contribution and reach to the people of the country. This report even includes study of
different industries from the view point of trade between India and Indonesia. The export-
import policies related to these different industries is also studied here. Different industries
such as cement industry, textile industry, tourism industry, fishery industry, etc. have been
studied.
Thus this report is a compilation of all the different aspects of Indonesia related to trade and
commerce of the country.

ACKNOWLEDGEMENT
The successful completion of this report would not have been possible without co-operation
and support of our professor, friends, institute and the university. We forward gratitude to
respected director of our institute for giving us an opportunity to work out this report.
We are also thankful to our project guide Prof. Dhara Shah, with whose help the study was
made possible and who provided the full guidance, co-operation and valuable suggestion
about this report. The valuable ideas, recommendation and response are simply adorable.
We have been provided all possible guidance and helpful suggestion for accomplishment of
this project.
We are thankful to our college friends and all those who have helped us directly or indirectly
in the preparation of this report.

SUBJECT INDEX
CHAPTERS TITLE PAGE NO.
SUMMARY OF REPORT
1 INTRODUCTION ABOUT THE INDONESIA 2
1.1 OVERVIEW OF INDONESIA 3
1.2 GEOGRAPHICAL LOCATION 4
1.3 LANGUAGES 5
1.4 CURRENCY AND EXCHANGE RATE 6
1.5 RELIGIONS 9
1.6 NATIONAL FLAG 10
1.7 NATIONAL ANTHEM 11
1.8 ECONOIMIC SCENARIO 13
1.9 POLITICAL STABILITY 15
1.10 LATEST NEWS AND DEVELOPMENT IN INDONESIA 17
2 OVERVIEW OF INDUSTRY TRADE AND COMMERCE
IN THE INDONESIA
18
2.1 LIST OF INDUSTRIES 19
2.2 CONTRIBUTION OF EACH INDUSTRIES IN NATIONAL
GDP
20
2.3 EXPORT- IMPORT STATISTICS 22
2.4 MAJOR PLAYERS OF EACH INDUSTRY WITH THEIR
MARKET SHARE
24
3 INTRODUCTION OF TEXTILE INDUSTRY 25
3.1 OVERVIEW OF TEXTILE INDUSTRY IN INDONESIA 26
3.2 OVERVIEW OF TEXTILE INDUSTRY IN INDIA 29
3.3 JUSTIFICATION FOR SELECTING INDUSTRY IN
TERMS OF BILATERAL TRADE PRACTICES WITH
INDIA/ GUJARAT
30
3.4 OVERVIEW OF TEXTILE INDUSTRY IN GUJARAT 35
3.4.1 SUB- SEGMENT OF THE TEXTILE INDUSTRY 37
3.4.2 CONTRIBUTION OF THE TEXTILE INDUSTRY IN
NATIONAL GDP
38
3.4.3 MAJOR PLAYERS IN TEXTILE INDUSTRY AND ITS
SUB- SEGMENTS WITH THEIR MARKET SHARE
39
3.4.4 LOCAL TAXES AND DUSTIES APPLICABLE IN
TEXTILE INDUSTRY
41
3.4.5 SPECIAL BENEFITS GIVEN BY STATE GOVERNMENT
TO THE TEXTILE INDUSTRY
42
4 STEEPLED ANALYSIS 44
4.1 STEEPLED ANALYSIS OF TEXTILE INDUSTRY IN
INDONESIA
45

4.2 STEEPLED ANALYSIS OF TEXTILE INDUSTRY IN
GUJARAT
49
4.3 COMPARATIVE ANALYSIS OF STEEPLED IN
TABULAR FORM
53
5 SWOT ANALYSIS 56
5.1 SWOT ANALYSIS OF TEXTILE INDUSTRY IN
INDONESIA
57
5.2 SWOT ANALYSIS OF TEXTILE INDUSTRY IN
GUJARAT
58
6 INTRODUCTION ABOUT ORISSA 61
6.1 OVERVIEW OF ODISHA 62
6.1.1 POPULATION 62
6.1.2 OFFICIAL LANGUAGE 62
6.1.3 ETHNIC GROUPS 62
6.1.4 NATURAL RESOURCES 63
6.1.5 TRANSPORTATION CONNECTIVITY OF GUJARAT
WITH ORISSA
63
6.1.6 MAJOR INDUSTRIES IN ORISSA 63
6.1.7 CONTRIBUTION IN NATIONAL GDP 64
6.2 OVERVIEW OF TEXTILE INDUSTRY IN ODISHA 65
6.2.1 CONTRIBUTION OF TEXTILE INDUSTRY IN
NATIONAL GDP
6.2.2 MAJOR PLAYERS OF TEXTILE INDUSTRY WITH
THEIR MARKET SHARE
6.2.3 LOCAL TAXES AND DUTIES APPLICABLE IN TEXTILE
INDUSTRY
6.2.4 SPECIAL BENEFITS GIVEN BY STATE GOVERNMENT
TO TEXTILE INDUSTRY
6.3 SWOT ANALYSIS OF TEXTILE INDUSTRY IN ORISSA
FINDINGS
ANNEXURE

SUMMARY OF REPORT

1 | P a g e
CHAPTER 1INTRODUCTION
ABOUT INDONESIA
INTRODUCTION ABOUT INDONESIA
1.1 Overview of Indonesia
Indonesia is a country in Southeast Asia and Oceania. Indonesia is a comprising
approx. 17,508 islands. It has 33 states contains approx. 238 million people.
Indonesia is the world's fourth most populous country. Indonesia is a republic
country, with an elected legislature and president. The Indonesia's capital city is
Jakarta. The Indonesia shares land borders with East Timor, Papua New Guinea and
Malaysia. Indonesia’s neighboring include Australia, Singapore, Palau, Philippines,
and Andaman and Nicobar Islands of India.
Indonesia is become an independent country in August 17, 1945 from Netherlands.
Indonesia’s fiscal year is 1st April – March 31st. Indonesians national motto is “Unity in
Diversity” the greatest attraction of the Indonesia.
The Indonesian archipelago has been an important trade region since at least the 7th
century. Srivijaya traded with India and china. Indonesian rulers absorbed foreign
religious ,cultural and political models from the early centuries CE, In history Foreign
powers influenced Indonesian natural resources drawn.
2 | P a g e

1.2 Geographic Location
Figure 1.1
Indonesia is the largest archipelago in the world. Indonesia consists of 30 smaller
groups and five major islands. In Indonesia 6000 islands are inhabited from total
numbers of 17,508 islands. Indonesia’s archipelago between the Indian and the
Pacific Ocean, and connect two regions Asia and Australia.
Indonesia’s territory stretches from 6°08' N latitude to 11°15' S latitude and from
94°45' E to 141°05' E longitude. Indonesia is contains total area 1,919,440 sq. km
(Land Area: 1,826,440 sq. km; Water Area: 93,000 sq. km).
The five main islands are: Java/Madura (132,107 sq. km); Kalimantan, which contains
two-thirds of the island of Borneo (539,460 sq. km); Sumatra (473,606 sq. km); the
most fertile and densely populated islands Sulawesi (189,216 sq. km); and Irian Jaya
(421,981 sq. km) is part of the world's second largest island, New Guinea.
3 | P a g e

Indonesia is predominantly mountainous with around 400 volcanoes, from which
100 are active. The highest mountain of Indonesia is snow-capped Mandala Top
(15,300 feet) in the Jaya Wijaya mountain range of Irian Jaya. They serve as
transportation routes on islands, for example, the Barito, Kapuas, Mahakam and
Rajang rivers in Kalimantan; and the Memberamo and Digul rivers in Irian Jaya.
1.3 Languages
Indonesia’s national language is Bahasa Indonesia. There are over 725 languages
spoken in Indonesia . Here are some regional languages actively spoken in Indonesia:
Rejang (South Sumatra)
Dairi (North Sumatra)
Toraja (South Sulawesi)
Lampung (South Sumatra)
Makassarese (South Sulawesi)
TobaBatak (North Sumatra)
Sasak (Lombok)
Banjarese (South Kalimantan)
Acehnese (North Sumatra)
Balinese (Bali and Lombok)
Buginese (South Sulawesi)
Minangkabau (Central Sumatra)
Javanese (Java)
4 | P a g e

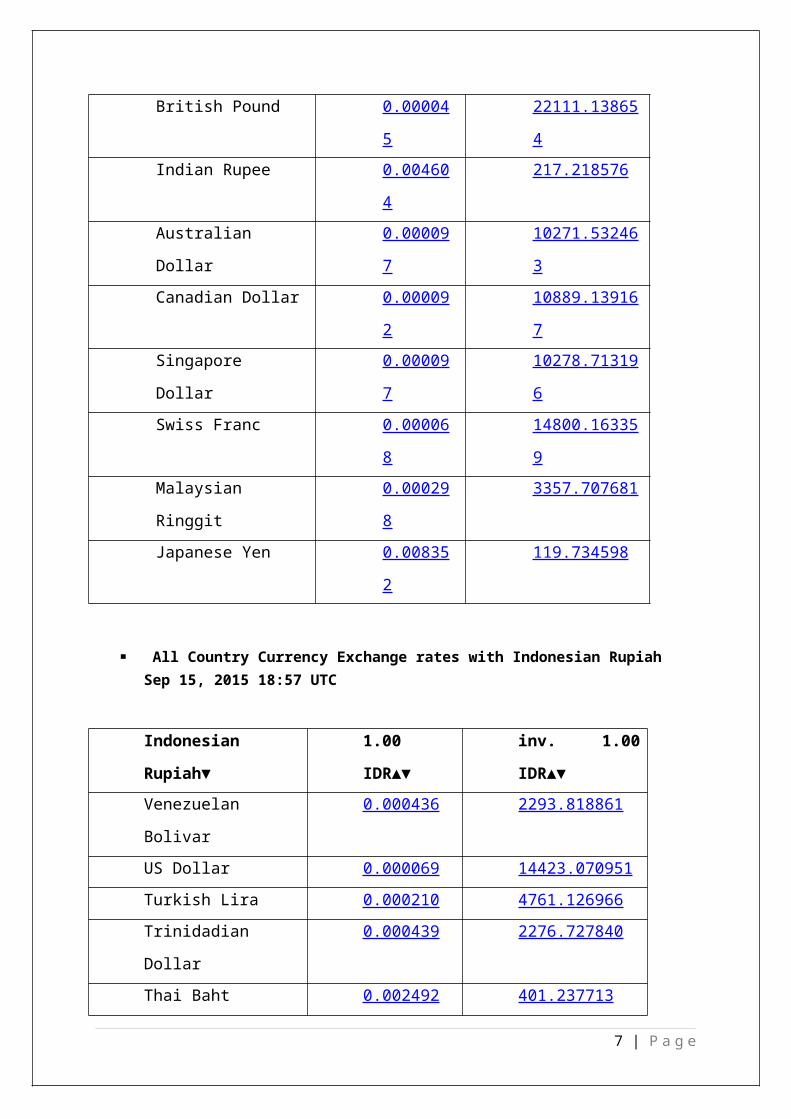
1.4 Currency & Exchange rate
The currency of Indonesia is the Rupiah (IDR). The currency rates "float" and the rate
varies along with a myriad of economic factors.
Figure 1.2
The exchange rates of the currency of Indonesia with other countries currency
shown in below table.
Indonesian Rupiah Rates tableTop 10Sep 15, 2015 18:57 UTC
Indonesian Rupiah 1.00 IDR inv. 1.00 IDR
US Dollar 0.000069 14423.070951
Euro 0.000062 16257.464491
British Pound 0.000045 22111.138654
Indian Rupee 0.004604 217.218576
Australian Dollar 0.000097 10271.532463
Canadian Dollar 0.000092 10889.139167
Singapore Dollar 0.000097 10278.713196
5 | P a g e

Swiss Franc 0.000068 14800.163359
Malaysian Ringgit 0.000298 3357.707681
Japanese Yen 0.008352 119.734598
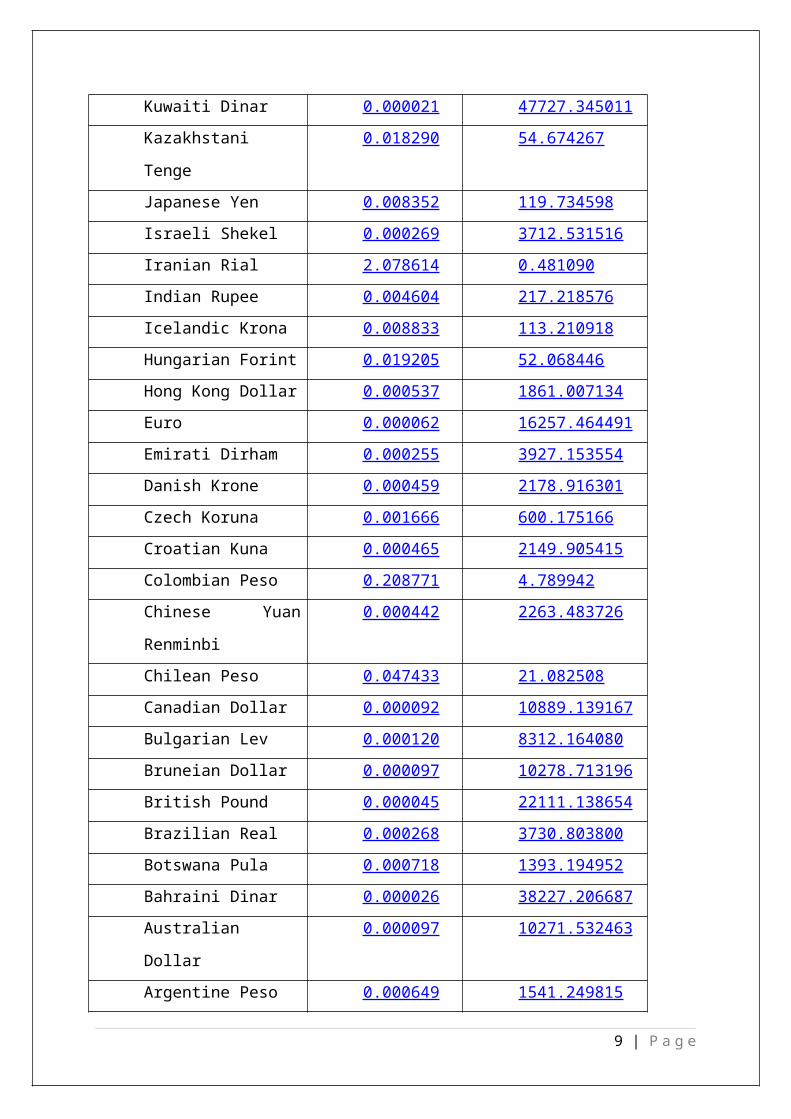
All Country Currency Exchange rates with Indonesian Rupiah Sep 15, 2015 18:57 UTC
Indonesian Rupiah▼ 1.00 IDR▲▼ inv. 1.00 IDR▲▼Venezuelan Bolivar 0.000436 2293.818861
US Dollar 0.000069 14423.070951
Turkish Lira 0.000210 4761.126966
Trinidadian Dollar 0.000439 2276.727840
Thai Baht 0.002492 401.237713
Taiwan New Dollar 0.002254 443.608808
Swiss Franc 0.000068 14800.163359
Swedish Krona 0.000576 1735.720585
Sri Lankan Rupee 0.009677 103.338419
South Korean Won 0.081769 12.229529
South African Rand 0.000934 1070.868278
Singapore Dollar 0.000097 10278.713196
Saudi Arabian Riyal 0.000260 3846.431947
Russian Ruble 0.004629 216.020707
Romanian New Leu 0.000272 3680.326713
Qatari Riyal 0.000252 3960.529789
Polish Zloty 0.000258 3869.220192
Philippine Peso 0.003239 308.745504
Pakistani Rupee 0.007238 138.152019
Omani Rial 0.000027 37472.257548
Norwegian Krone 0.000568 1760.469521
New Zealand Dollar 0.000109 9133.203463
Nepalese Rupee 0.007366 135.749944
Mexican Peso 0.001160 862.102051
Mauritian Rupee 0.002467 405.400236
Malaysian Ringgit 0.000298 3357.707681
6 | P a g e
Lithuanian Litas 0.000212 4708.487167
Libyan Dinar 0.000095 10530.076769
Latvian Lat 0.000043 23132.419595
Kuwaiti Dinar 0.000021 47727.345011
Kazakhstani Tenge 0.018290 54.674267
Japanese Yen 0.008352 119.734598
Israeli Shekel 0.000269 3712.531516
Iranian Rial 2.078614 0.481090
Indian Rupee 0.004604 217.218576
Icelandic Krona 0.008833 113.210918
Hungarian Forint 0.019205 52.068446
Hong Kong Dollar 0.000537 1861.007134
Euro 0.000062 16257.464491
Emirati Dirham 0.000255 3927.153554
Danish Krone 0.000459 2178.916301
Czech Koruna 0.001666 600.175166
Croatian Kuna 0.000465 2149.905415
Colombian Peso 0.208771 4.789942
Chinese Yuan Renminbi 0.000442 2263.483726
Chilean Peso 0.047433 21.082508
Canadian Dollar 0.000092 10889.139167
Bulgarian Lev 0.000120 8312.164080
Bruneian Dollar 0.000097 10278.713196
British Pound 0.000045 22111.138654
Brazilian Real 0.000268 3730.803800
Botswana Pula 0.000718 1393.194952
Bahraini Dinar 0.000026 38227.206687
Australian Dollar 0.000097 10271.532463
Argentine Peso 0.000649 1541.249815
Sep 15, 2015 18:57
1.5 Religions
7 | P a g e

There are six official religions recognized in Indonesia. All five of these religions are
formally recognized in Indonesia and have official national holidays commemorating
events of importance to their followers. While the country is predominantly Muslim,
the government is secular and therefore is not based on a single religion.
The below table shows the percentage share of each religion and absolute numbers
of each religion of total population.
Composition of Indonesia's Six Official Religions
Religion Percentage share
(of total population)
Absolute numbers
(in millions)
Muslim 87.2 207.2
Protestant 6.9 16.5
Catholic 2.9 6.9
Hindu 1.7 4.0
Buddhist 0.7 1.7
Confucian 0.05 0.1
Source: Statistics Indonesia (BadanPusatStatistics), Population Census 2010
1.6 National Flag
8 | P a g e
Indonesian national flag is a combination of two colours Red and White.
Red stands for Courage and Sacrifice.
White stands for purity and peace
1.7 National Anthem
9 | P a g e

Indonesia national anthem is “Indonesia Raya”, which means Great Indonesia. The
song was composed in 1928. The lyrics of national anthem in official language and
lyrics translation in English language.
Anthem Lyrics in Official Language
Indonesia Tanah Airku, Tanah TumpahDarahku,
Di sanalahakuberdiri, jadipanduibuku.
Indonesia kebangsaanku, bangsadantanahairku,
Marilahkitaberseru, Indonesia bersatu.
Hiduplahtanahku, hiduplahnegeriku,
Bangsaku, rakyatku, semuanya.
Bangunlahjiwanya, bangunlahbadannya,
Untuk Indonesia Raya.
Indonesia Raya, Merdeka, Merdeka
Tanahku, negeriku yang kucinta.
Indonesia Raya, Merdeka, Merdeka
Hiduplah Indonesia Raya.
Indonesia Raya, Merdeka, Merdeka
Tanahku, negeriku yang kucinta.
Indonesia Raya, Merdeka, Merdeka
Hiduplah Indonesia Raya.
10 | P a g e
Anthem Lyrics - English Translation
Indonesia, my native land,
My place of birth,
Where I stand guard
Over my motherland
Indonesia, my nationality,
My people and my country
Let us all cry
For united Indonesia.
Long live my land,
Long live my country,
My nation and all my people.
Arouse their spirit,
Arouse their bodies
For Great Indonesia.
Great Indonesia, free and independent,
The land, the country I love
Great Indonesia, free and independent,
Long live Indonesia.
11 | P a g e

1.8 Economic Scenario
Indonesia’s economy is on the rise and thus seeing the country take its rightful
position as a major destination for foreign direct investment (FDI). Having previously
been overlooked in favors of other countries in Asia such as India and China;
Indonesia is now hard to ignore. The country is unique in many ways as the biggest
archipelago in the world, the largest Muslim majority country, the world’s third
largest (albeit young) democracy and a leading exporter of numerous high value
commodities such as palm oil and thermal coal. Its distinct characteristics are now
coupled with political stability, self-reliance and robust economic growth which saw
the country largely shielded from the global economic crisis.
Indonesia now finds itself at a key point in its transition from that of a low income to
middle income economy and from a primary producer to a value added exporter as
well as knowledge based economy. Investment opportunities are ripe in all sectors;
ranging from infrastructure to manufacturing and services. This represents a window
of opportunity for investors to participate in a market in the world’s fastest growing
region that exhibits strong fundamentals and is poised to flourish.
Figure 1.3
12 | P a g e

In terms of future outlook, Indonesia is entering a ‘sweet spot’ as a convergence of
its young, working population with that of relatively stable inflation and sustained
economic growth is fuelling consumer spending.
The country faces many challenges ahead of itself in securing the business
environment for investors and sustaining economic growth. Core issues of
corruption and excessive bureaucracy are still hurdles for any investor while
unqualified human resources and poor infrastructure are restraining GDP growth
from reaching the levels being seen in India and China. However, slow but steady
steps are being taken to address the aforementioned obstacles. Undoubtedly,
Indonesia possesses the fundamentals to be a leading global economy over the
coming decades. This analysis aims to provide readers with a brief overview of some
of those core fundamentals that differentiate the country to provide firm
foundations for all business and investment ventures.
13 | P a g e

1.9 Political Stability
Indonesia has undergone a political transformation since the upheaval of 1998 which
saw the fall of General Suharto after 30 years of authoritarian rule and a collapse of
the Rupiah. The country is now a vibrant democracy that is continuing to strengthen
its political structures and deepen the enfranchisement of the population. Over past
decade, varied experiments with democracy has seen the rise and fall of extreme
religious parties and an equilibrium found in the direction of secular, reform minded
nationalism. The 2009 election results signaled a maturity among the electorate
through the re-election of the incumbent president, SusiloBambangYudhoyono who
became the first Indonesian president to be democratically elected for two
consecutive terms which hugely boosted global investor confidence. His firm stance
on terrorism and national security is another welcome continuation of his tenure.
Other political reforms such as decentralization of political power to regional and
provincial leaders, while still at an experimental stage, is serving to unleash the
potential of Indonesia’s less developed regions outside Java and fostering more even
participation in the country’s growth.
The political situation is not without its risks; the speed of economic and political
reform under President Yudhoyono’s coalition has come under fierce criticism for its
inertia and pandering to vested interests of coalition members. Political noises
towards greater protectionism are regular occurrences that often result in
overlapping regulations which creates investor uncertainty. In the run up to the 2014
elections, party interests are coming to prevail over that of political progression with
a stalemate over many proposed new bills. The gap between the rich and the poor is
also widening while corruption continues to be a persistent issue.
However, despite the various push and pull forces to veer of course; the country
remains on a stable track while fully acknowledging its political flaws. The deepening
politicization of the electorate is seeing greater demands and expectations being
placed upon their politicians. The relatively free media is providing the space for
open debate and discussion as well as bringing into question accepted cultural and
political norms. This is a healthy environment for the future development of
14 | P a g e

democracy and the gradual stamping out of detrimental and corrupt practices. The
political system therefore continues to be a work in progress but not without its
concerns. Yet, the events of the Arab Spring and the political turmoil that has ensued
show that seemingly stable authoritarian regimes all have an expiry date which is
brought about by the inevitable peaks and troughs of economic cycles. The over
centralization of authority is also a major flashpoint, as witnessed in countries such
as Thailand. The immediate impact of Indonesia’s decentralization has been
excessive waste and bureaucracy. However, this is part of the process of political
maturation that will eventually yield a series of coordinated regions that have
adopted policies which complement their particular attributes and commercial
strengths. From this long term perspective, investors can have confidence in
Indonesia’s stability and its political system will continue to strengthen in the
decades to come.
Indonesia’s advantages as a business and investment destination are defined by the
current global and political environment that is highlighting several key parameters
to be considered in emerging markets. The country’s natural resources, potential in
renewable energy and food security offer a sustainable buffer to the climbing prices
being seen in oil and foodstuffs which is fuelling social discontent in other markets.
Their potential as feedstock for value added manufacturing will also be vital in
steering the country through its transition to a middle income and developed
economy. The vast population that is set to grow to 288 million by 2050 will serve in
both a highly skilled productive capacity as well as consumer market as the country
reaches its predicted position of being the world’s 6th largest economy
(PricewaterhouseCoopers).
Indonesia Political stability index (-2.5 weak; 2.5 strong): For that indicator, The
World Bank (govindicators.org) provides data for Indonesia from 1996 to 2013. The
average value for Indonesia during that period was -1.28 points with a minimum of -
2.12 points in 2003 and a maximum of -0.5 points in 2013.
15 | P a g e

1.10 Latest News and Developments in Indonesia
ADB $400 Million Loan Helps Indonesia Create More Inclusive Finance Sector
ADB has approved a $400 million program loan to help Indonesia develop its
financial sector, including expanding access to financial services for poor
households.
SMI, ADB Partner to Accelerate PPP Projects in Indonesia
ADB and Indonesia’s PT Sarana Multi Infrastructures signed a memorandum of
understanding today to co-advise on public-private partnerships.
ADB New Country Director for Indonesia Looks Forward to Enhancing
Partnership
New ADB Country Director for Indonesia Steven Tabor looks forward to further
enhancing ADB's support for the Government of Indonesia’s efforts to foster
inclusive economic growth and poverty reduction.
16 | P a g e

17 | P a g e
CHAPTER 2
OVERVIEW OF
INDUSTRIES, TRADE AND
COMMERCE IN THE
INDONESIA

OVERVIEW OF INDUSTRIES, TRADE AND COMMERCE IN THE
INDONESIA
2.1 List of Industries
Agricultural
Petroleum And Natural Gas
Textiles
Automotive
Electrical Appliances
Apparel
Footwear
Mining
Cement
Medical Instruments And Appliances
Handicrafts
Chemical Fertilizers
Plywood
Rubber
Processed Food
Jewellery
Tourism
18 | P a g e

2.2 Contribution of Each Industry in National GDP
The Gross Domestic Product (GDP) in Indonesia was worth 888.54 billion US dollars
in 2014. The GDP value of Indonesia represents 1.43 percent of the world economy.
GDP in Indonesia averaged 214.72 USD Billion from 1967 until 2014, reaching an all-
time high of 917.87 USD Billion in 2012 and a record low of 5.98 USD Billion in 1967.
GDP in Indonesia is reported by the World Bank Group. GDP from Textile industry in
2013 was US$14.4 billion.
As below table shows the GDP data with highest and lowest GDP and industry GDP
of the year 2014-2015
Indonesia GDP Last Previous Highest Lowest Unit
GDP 888.54 910.48 917.87 5.98 USD
Billion
GDP Growth Rate 3.78 -0.18 3.83 -3.57 percent
GDP Annual Growth Rate 4.67 4.71 7.16 1.56 percent
GDP Constant Prices 2239300.00 2157800.00 2239300.00 340865.20 IDR
Billion
Gross National Product 701250.16 714387.33 714387.33 317687.52 IDR
Billion
GDP per capita 1865.85 1797.54 1865.85 275.78 USD
Gross Fixed Capital 709600.00 688700.00 723197.31 63970.10 IDR
19 | P a g e

Formation Billion
GDP per capita PPP 10098.66 9728.91 10098.66 4547.57 USD
GDP From Agriculture 77214.80 82354.30 87304.50 37282.50 IDR
Billion
GDP From Construction 213200.00 206800.00 219828.70 149919.00 IDR
Billion
GDP From Manufacturing 486600.00 468600.00 486600.00 371813.30 IDR
Billion
GDP From Mining 183800.00 188600.00 205408.50 171254.70 IDR
Billion
GDP From Services 36700.00 36100.00 36700.00 23736.80 IDR
Billion
GDP From Utilities 25989.00 21556.30 25989.00 14032.20 IDR
Billion
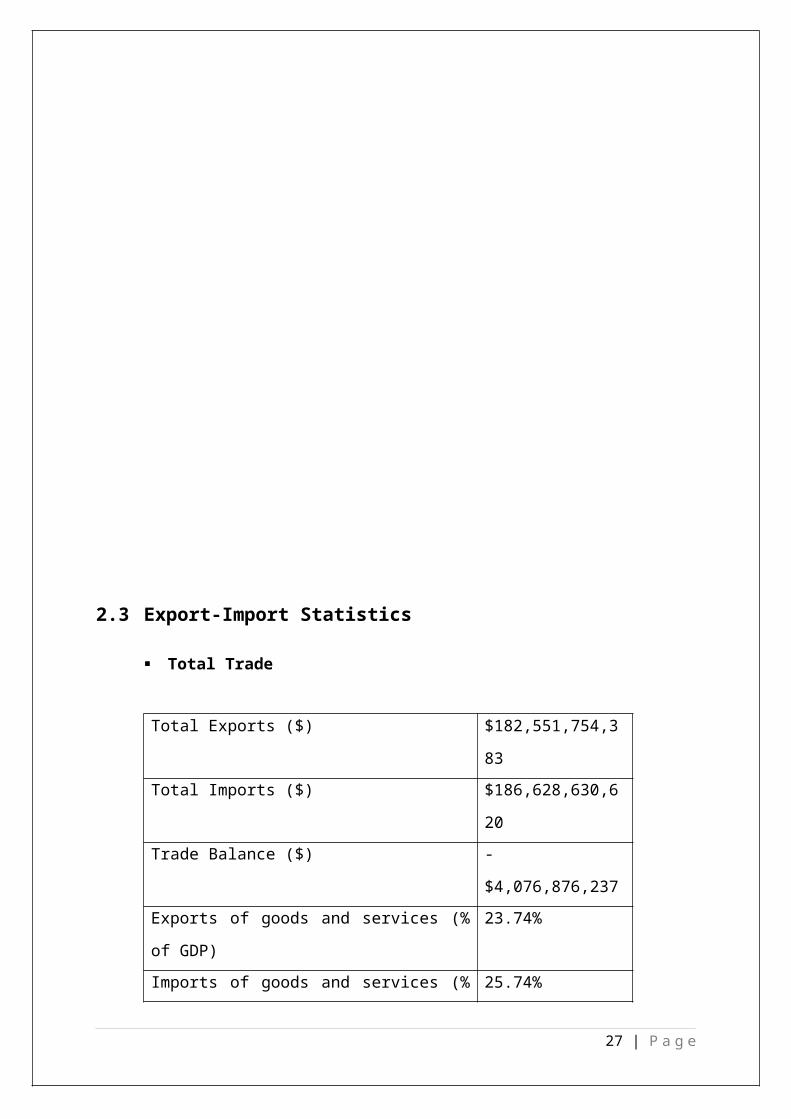
2.3 Export-Import Statistics
20 | P a g e

Total Trade
Total Exports ($) $182,551,754,383
Total Imports ($) $186,628,630,620
Trade Balance ($) -$4,076,876,237
Exports of goods and services (% of GDP) 23.74%
Imports of goods and services (% of GDP) 25.74%
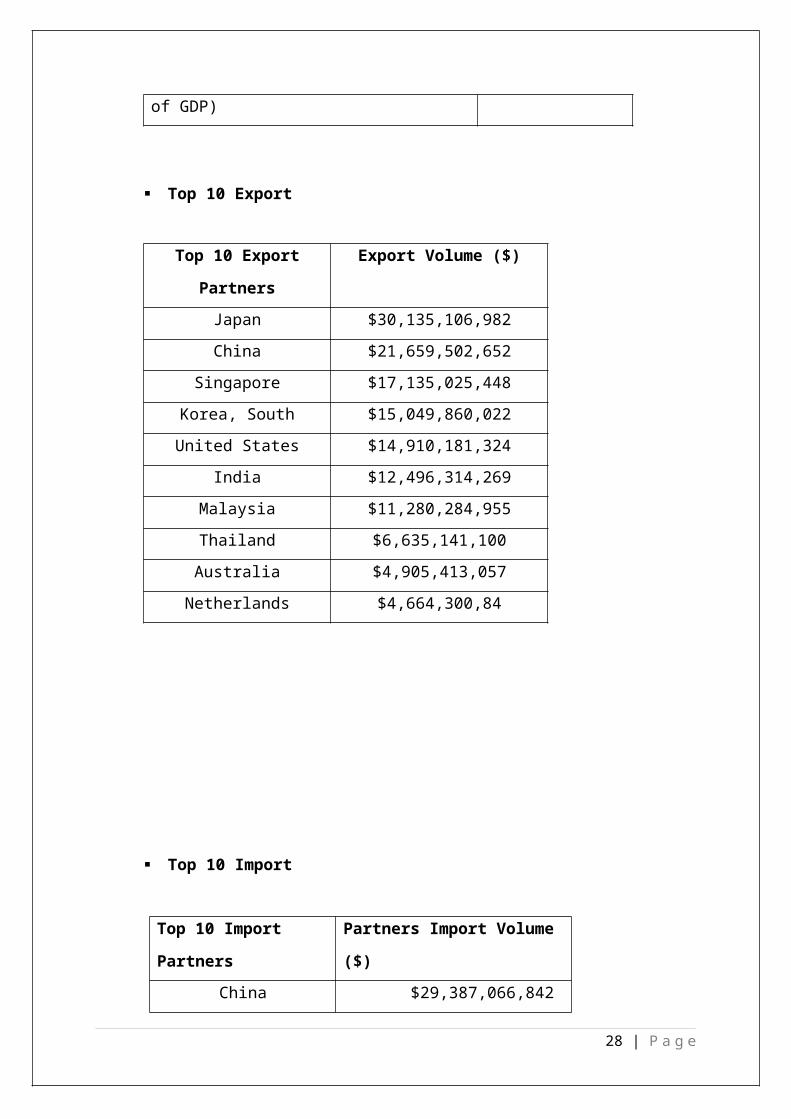
Top 10 Export
Top 10 Export
Partners
Export Volume ($)
Japan $30,135,106,982
China $21,659,502,652
Singapore $17,135,025,448
Korea, South $15,049,860,022
United States $14,910,181,324
India $12,496,314,269
Malaysia $11,280,284,955
Thailand $6,635,141,100
Australia $4,905,413,057
Netherlands $4,664,300,84
Top 10 Import
21 | P a g e
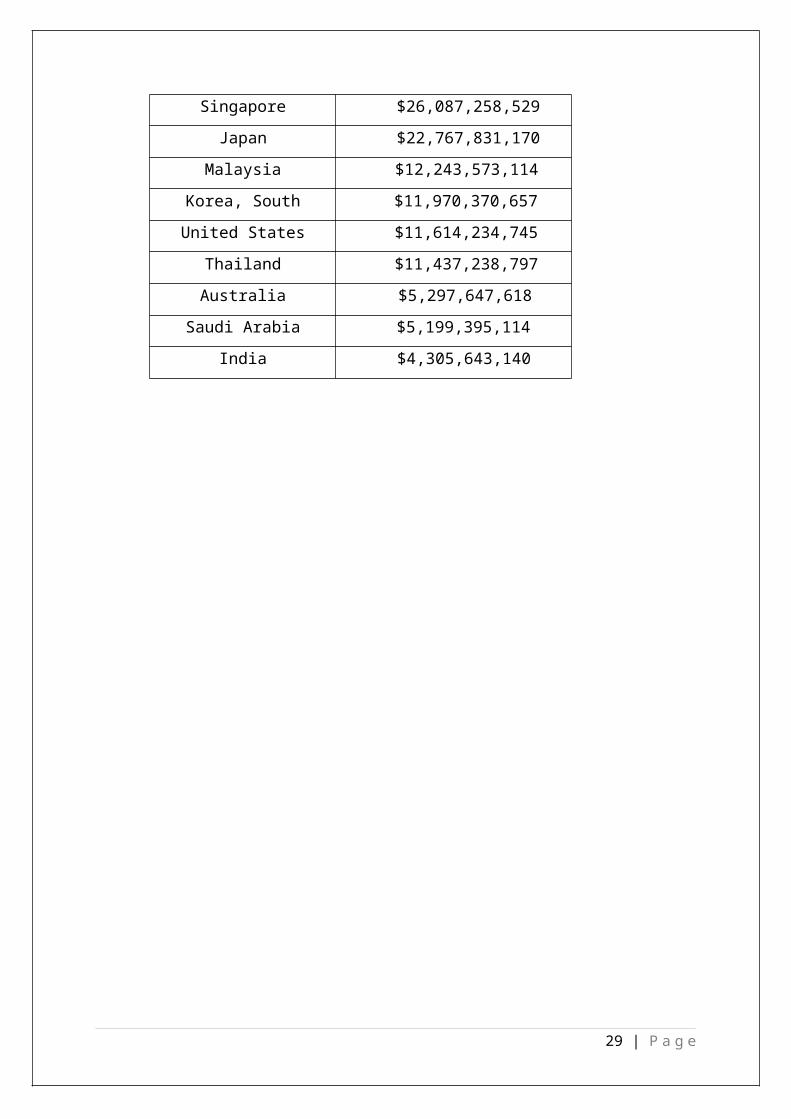
Top 10 Import Partners Partners Import Volume ($)
China $29,387,066,842
Singapore $26,087,258,529
Japan $22,767,831,170
Malaysia $12,243,573,114
Korea, South $11,970,370,657
United States $11,614,234,745
Thailand $11,437,238,797
Australia $5,297,647,618
Saudi Arabia $5,199,395,114
India $4,305,643,140
2.4 Major Players of Each Industry with their Market share
22 | P a g e

Top Companies in Indonesia and their Market Capitalization
Listed Company Name
(Ticker)
Market Capitalization
million IDR | (% of
total)
2012 Earnings
Performance %
Type of
Industry
Astra International(ASII) 307,675,004 (7.46%) 9.20% Miscellaneous
Century Textile Industry
Tbk PT
44.22 billion - Textile
HM Sampoerna(HMSP) 262,541,700 (6.36%) 23.30% Tobacco
Bank Central
Asia(BBCA)
222,116,978 (5.38%) 8.34% Banking
Bank Mandiri(BMRI) 187,110,000 (4.53%) 26.60% Banking
Telekomunikasi
Indonesia(TLKM)
182,447,993 (4.42%) 17.19% Telecom.
Bank Rakyat
Indonesia(BBRI)
169,736,169 (4.11%) 23.85% Banking
Unilever Indonesia
(UNVR)
159,085,500 (3.85%) 16.23% Consumption
Perusahaan Gas Negara
(PGAS)
111,510,938 (2.70%) 30.86% Mining
Gudang Garam (GGRM) 108,326,154 (2.62%) –19.99% Tobacco
As above table show the top ten companies in Indonesia. As table show that in
Indonesia majority of the industry is based on banking sectors. The highest market
share is the miscellaneous industry. Also in top ten industries there is not textile
industry.
23 | P a g e

24 | P a g e
CHAPTER 3 INTRODUCTION ABOUT TEXTILE
INDUSTRY

INTRODUCTION ABOUT TEXTILE INDUSTRY
3.1 Overview of Textile Industry in Indonesia
The textile industry in Indonesia has already a long standing tradition and is among
the pioneering sector in industrial manufacturing. In Indonesia the weaving industry
can be divided into two broad sectors, the modern power-driven machine sector and
the traditional hand-loom sector.
The rapid growth in textile and food production during the 1970s was driven by the
import-substitution policy pursued by the government as a strategy to provide
adequate food and clothing for the people.
The garment industry too began to emerge rapidly in the late 1970s in response to
rapidly rising demand in the domestic market and growth opportunities in the export
markets.
Indonesia’s textile industry is vertically integrated and involved in almost every
sector of the textile supply chain from the production of man-made fibers,
particularly polyester, nylon and rayon; man-made and cotton yarn spinning; and
weaving and knitting; to dyeing, printing and finishing; and apparel manufacturing.
As the largest employer in Indonesia’s industrial and manufacturing sector, the
textile industry in 2005 employed 1.8 million workers in directly related large- and
small-scale operations and 3.7 million in indirectly related operations. Textile
industry workers altogether comprised 1.9 percent of total employment in the
republic.
General Characteristics of Textile Industry in Indonesia
The geographical distribution of the Indonesian textile industry is highly
concentrated on the island of Java, and in particular in West Java. Interestingly is the
process of batik printing, a traditional way of printing cotton fabrics.
25 | P a g e
The technology in the weaving sector is very mixed, from simple locally-made
handlooms used by village people even in remote areas to modern computerized
looms and air jet looms. In general, the Indonesian textile industry is labour-intensive,
and woman workers dominate the scene.
Role of Textile Industry in Indonesia
The textile and apparel manufacturing industry of Indonesia ranks 14th in the world in
2008, the value added by textiles and clothing manufacturing dropped to 1.2%.
Industry was hard hit by the global recession of the late 2000s.
Textile industry is also the largest contributor to the foreign exchange earnings of
Indonesia.
In 2009, the textile industry contributed 12.72 percent in foreign exchange earnings
on exports of industrial products, excluding oil and gas, and 9.58 percent to total non-
oil exports, although 85 percent of cotton, as the raw materials, is imported.
That amount increased sharply from only US$ 559 million in 1985 . Besides having a
large contribution in the GDP and foreign exchange, the industry also employs many
workers, both who work directly or indirectly.
Structure of the Indonesian Textile Industries
The works weaving facet emerged in 1920.
The weaving manufacture was promoted by the government as a businessperson
of a fundamental commodity over the period 1950-65.
After 1965, turn in the weaving aspect through introducing powerfulness looms
instead of the pointer looms.
The ability tower sector began to declination apace and hand looms were replaced
with epic embedded textile mills.
The fiber industry is much more recent in origin.
26 | P a g e

Hand spinning of localized and imported fiber has protracted existed as an
occasional unit reflection in Country, but a lesser mill aspect did not produce until
the 1930.
The moving production enlarged symmetrical many rapidly than weaving because
of field revolution.
The industry seasoned a lag in the growing rate of actual creation during 1980-85.
Indicating a 12.3 % growth per annum, though it had realized 13 % annually in
1976-80.
Business activity of Indonesian cotton industry
A) Production:
• Indonesia produces only 0.5 % of their total domestic demand of cotton.
• Indonesia’s cotton production was decline to 25000 bales from 30000 bales in
2009-10.
B) Consumption:
• The Indonesian textile and textile products industry employs about 1.3 million
workers which equals to 10.6 % of the total work force in 2009.
• Textile product exports contributed 7.4 % to total Indonesian national exports.
27 | P a g e

3.2 Overview of Textile Industry in India
The Indian textile industry is one of the largest in the world with a massive raw
material and textiles manufacturing base. Our economy is largely dependent on the
textile manufacturing and trade in addition to other major industries. About 27% of
the foreign exchange earnings are on account of export of textiles and clothing
alone. The textiles and clothing sector contributes about 14% to the industrial
production and 3% to the gross domestic product of the country. Around 8% of the
total excise revenue collection is contributed by the textile industry. So much so, the
textile industry accounts for as large as 21% of the total employment generated in
the economy. Around 35 million people are directly employed in the textile
manufacturing activities. Indirect employment including the manpower engaged in
agricultural based raw-material production like cotton and related trade and
handling could be stated to be around another 60 Million
A textile is the largest single industry in India (and amongst the biggest in the world),
accounting for about 20% of the total industrial production. It provides direct
employment to around 20 million people. Textile and clothing exports account for
one-third of the total value of exports from the country. There are 1,227 textile mills
with a spinning capacity of about 29 million spindles. While yarn is mostly produced
in the mills, fabrics are produced in the power loom and handloom sectors as well.
The Indian textile industry continues to be predominantly based on cotton, with
about 65% of raw materials consumed being cotton. The yearly output of cotton
cloth was about 12.8 billion m (about 42 billion ft). The manufacture of jute products
(1.1 million metric tons) ranks next in importance to cotton weaving. Textile is one of
India’s oldest industries and has a formidable presence in the national economy
inasmuch as it contributes to about 14 per cent of manufacturing value-addition,
accounts for around one-third of our gross export earnings and provides gainful
employment to millions of people. They include cotton and jute growers, artisans
and weavers who are engaged in the organized as well as decentralized and
household sectors spread across the entire country.
28 | P a g e
3.3 Justification for Selecting Textile Industry in terms of Bilateral Trade
Opportunities with India/Gujarat
As textile is one of the most growing industries in India. India is the one of the major exporter of textile to the various countries of the world
Source: - www.texprocil.org .The Cotton Textiles Export Promotion Council
(Sponsored by Government of INDIA)
World export trade in Textiles reported a negative growth of (-) 8.60%
decreasing from US $ 144.80 billion during Jan-May 2014 to US $ 132.36 billion
during Jan-May 2015 against a growth of 3.74% during the previous year same
period.
While China, being the leading exporter, reported a decline of (-) 1.70% during
Jan-Mar 2015, India (3rd largest exporter) reported a decline of (-) 17.86%
during Jan-Mar 2015 against a growth of 9.08% during previous year.
USA being the second largest exporter, reported a decline of (-) 5.41% and
Germany (4th) reported a negative growth of (-) 16.49% followed by Italy,
South Korea, Turkey, Taiwan, Hong Kong and Pakistan
29 | P a g e
Top exporter of Clothing Industry in World
Source: - www.texprocil.org .The Cotton Textiles Export Promotion Council
(Sponsored by Government of INDIA)
World export trade in Clothing reported a negative growth of (-) 6.25%
decreasing from US $ 171.25 billion during Jan-May 2014 to US $ 160.55
billion during Jan-Mar 2015. Vietnam reported the highest growth of 10.62%
during Jan-May 2015.
Amongst the top ten suppliers, China (largest exporter) reported a negative
growth of (-) 5.60% and Bangladesh (2nd largest exporter) reported a growth
of 2.18% during Jan-May 2015.
India being the 4th largest exporter reported the 2nd highest growth of
6.89%.
Italy, Germany, Hong Kong, Turkey, Spain and France reported negative
growth during this period.
30 | P a g e
Top Importer of World
Source: - www.texprocil.org .The Cotton Textiles Export Promotion Council
(Sponsored by Government of INDIA)
As above table is showing the top 10 world import textile industry.
In year 2014-2015 US is the first country which is importing the cloths.
Indonesia is the last country which is importing the textile or clothing to
another country.
Major Importers of Cotton Fabric
Source: - www.texprocil.org .The Cotton Textiles Export Promotion Council
(Sponsored by Government of INDIA)
31 | P a g e

Overall imports of Cotton Fabrics have recorded negative growth by (-) 9.23%
decreasing from US $ 19.59 billion in Jan-May 2014 to US $ 17.78 billion in
Jan-May 2015.
Bangladesh grew by 4.09%, USA grew by 2.80%, and Indonesia by 0.60%
Vietnam, China, Hong Kong, Mexico, Germany, Italy and Turkey reported a
negative growth.
INDIA’S EXPORTS OF Textiles Sector for the Period April – July
Source: - www.texprocil.org .The Cotton Textiles Export Promotion Council
(Sponsored by Government of INDIA)
32 | P a g e

Gujarat’s Export policy
Gujarat, which accounts for about a quarter of India's total exports, is mulling
a five-year export policy to focus on value-added exports in sectors such as
textiles, agriculture and dairy.
The move by the top exporting state in the country comes on the back of
sagging efforts by the Centre to boost dwindling exports.
The first state in the country to have an export policy, Gujarat plans to
increase the share of exports from the state from 25% to 30% in five years.
As a precursor to the policy, the Federation of Indian Exports
Organization undertook a study for Gujarat on the state's export
competitiveness and identified sectors with export potential.
"We are working on improving exports from the state and will take steps to
increase the share to 35% of total India's exports by 2020," said a state
government official.
The government may announce incentives ranging from exemption from
value-added tax (VAT) in some sectors to focus market scheme and focus
product scheme to offset high freight cost and other externalities to select
international markets and promote products with high-export intensity.
Gujarat also has a comparative advantage in many commodities, like spices
and seeds, mineral and metals and cotton
33 | P a g e

3.4 Overview of Textile Industry in Gujarat
Gujarat has unique strengths with respect to the textile industry. It is now the largest
producer of cotton in India, with a share of over one-third of the total cotton
production. It is also the largest manufacturer of man-made and filament fabric and
the second largest manufacturer of cotton fabric and has a dominant share in the
production of denim with a one billion metre capacity. The State contributes to over
one-fourth of the country’s technical textiles output.
Gujarat has the highest number of medium and large textile processing houses and is
home to more than 50 per cent of India’s processing machinery manufacturers and
90 percent of weaving machinery manufacturers.
The State’s progress across various segments in the textile value chain has not been
uniform. In 2011-12, Gujarat produced the highest cotton output of 120 lakh bales (1
bale = 170 kg) in India. In spite of this, the State ranked sixth in cotton yarn
production because of inadequate spinning capacities. Consequently, more than 90
per cent of its cotton output is sent out to other States for value addition.
The State also lags behind in garment production because of unavailability of skilled
manpower. These factors limit the ability of the textile industry in Gujarat to
capitalise on abundant raw material availability and also its ability to earn higher per
unit realisation on value-added products.
To attract higher investments and to bridge the existing gaps in the textile value
chain, the State Government announced the Gujarat Textile Policy-2012 in
September 2012. This policy laid down an integrated approach from Fibre to Fashion
to transform its cotton industry as a leader in manufacturing of yarn, fabric and
garment. It stressed development of the 5Fs – Farm, Fibre, Fabric, Fashion (Garment)
and Foreign (Export). The policy has schemes that provide assistance for developing
infrastructure, enhancing skills and modernising technology to make the textile
industry competitive both in domestic and international markets.
34 | P a g e

Under the new textile policy, the State Government has announced a credit linked
interest subsidy scheme. New spinning units or the existing units (100 per cent
cotton, blended or spun yarn) undertaking expansion, diversification or
modernisation can avail a maximum subsidy of seven per cent. Readymade garment
and made-up units are also eligible for similar subsidy. Other textile weaving and
processing units are eligible for subsidy of five per cent. Spinning units will also be
eligible for power tariff concession of a rupee amount and assured supply of lignite
(for units having captive power plant) for a period of five years.
The policy provides VAT concession to units across the textile value chain from
cotton to garment to made-ups in Gujarat for the entire value of the eligible fixed
capital investments in plant and machinery. It also offers interest subsidy for units
manufacturing technical textiles.
Technical textiles being niche products, preferred for their technical performance
and specific functional properties, command premium realisations. The State has
around 900 units engaged in 12 sub-sectors of technical textiles.
Under the policy, the Government has also devised various schemes to enhance the
supply of skilled manpower. These schemes include financial assistance to apparel
training institutions and trainees and assistance for training to power loom sector.
35 | P a g e
There are schemes that provide financial assistance for energy and water
conservation and environmental compliance, in addition to assistance for acquiring
and upgrading technology.
To expand the textile manufacturing base, the policy also provides support for
establishing textile and apparel parks in the State.
To leverage on availability and proximity of cotton, comfortable power supply and to
bring in the latest technology, the textile industry in the State pitched itself as a
favourable destination for investments. A few Chinese textile firms have evinced
interest in setting up units in the State. This move is strategic for the State given that
China is the single largest exporter of textile goods to the US with a share of over
one-third in the global fabric and apparel market.
The announcement of the new textile policy and other pro-industry steps taken by
the State Government will go a long way in unlocking the full potential of Gujarat’s
textile industry. However, it will be some time before the real impact of these
measures become evident.
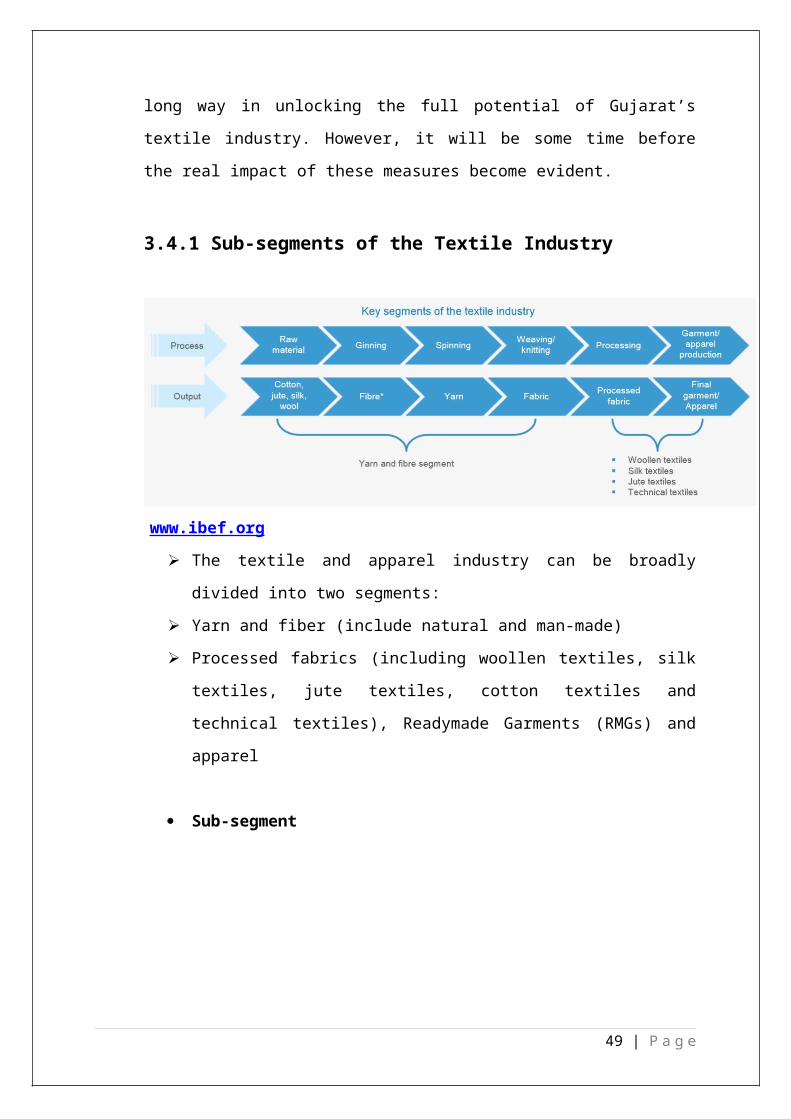
3.4.1 Sub-segments of the Textile Industry
www.ibef.org
The textile and apparel industry can be broadly divided into two segments:
Yarn and fiber (include natural and man-made)
36 | P a g e
Processed fabrics (including woollen textiles, silk textiles, jute textiles, cotton
textiles and technical textiles), Readymade Garments (RMGs) and apparel
Sub-segment
73% of the textile companies are operating in the cotton sub segment.
Approximately 8% companies deal in the manmade segment and 11% of the
companies deal in blended segment. 6% of companies deal in the silk sub
segment. 35% of the textile companies operating in cotton segment generate
100% revenue from exports.
3.4.2 Contribution of Textile Industry in National GDP
The Worth of Indian textiles industry is currently estimated at around US$ 108
billion and expected to reach US$ 223 billion by 2021. The Indian textile
industry is provides second largest employment after agriculture. Textile
industry providing employment to 45 million people directly and 60 million
people indirectly. The Indian Textile Industry contributes approximately 5 per
cent to India’s gross domestic product (GDP), and 14 per cent to overall Index
of Industrial Production (IIP).
37 | P a g e
3.4.3 Major Players of Textile Industry and its sub-segments with their
Market share
Top companies of the textile industry and logo of the companies and overview
of the company shown below
1 Arvind Limited
Tel: +91-79-2220-8000
Naroda Road, Ahmadabad, Gujarat 380025, India
Flagship company of the Lalbhai Group and one of the top three denim
producers in the world; based in Ahmadabad, Gujarat.
Products: denim, shirt material, khakis, knitwear, voiles & readymade
garments (shirts, jeans).
The current market capitalization stands at Rs 7,115.89 crore.
2 Garden Silk Mills Ltd
Manufacturers of high-fashion fabric & polyester yarn based in Surat
(Gujarat); makes fine filament & micro filament polyester fabrics, including
georgettes, chiffons, failles & jacquards (dyed & printed).
The current market capitalization stands at Rs 107.52 crore.
3 Ashima Group
Tel: +91-79-2277-3513
Excellence Complex, Khokhra-Mehmedabad Road, Ahmadabad, Gujarat
380021, India
Leading manufacturer of cotton fabrics based in Ahmadabad, Gujarat;
products include denims, yarn dyeing shirtings, piece dyed shirting, piece dyed
khaki, etc.
38 | P a g e

4 Chiripal Group
Tel: +91-79-2673-4660
Satellite, Ahmadabad, Gujarat
Business group in Ahmadabad involved in petrochemicals, textiles (spinning,
weaving, knitting, fabric processing), chemicals, infrastructure, & educational
sectors; comprises Chiripal Industries Ltd, Nandan Exim Ltd, and Vishal Fabrics
Pvt Ltd etc.
5 Nandan Exim Limited
Tel: 098258-00199
Pirana Road, Piplej, Ahmadabad, Gujarat 382405, India
Manufacturers & exporters of grey cotton fabrics, khakis & denims based in
Ahmadabad, Gujarat; part of the Chiripal Group; has a production capacity of
7 million meters of cotton & blended fabric & 10 million meters of denim per
year.
6 Soma Textiles & Industries Ltd
Textile Company based in Ahmadabad, Gujarat; product range includes yarn
(100% cotton combed, polyester-viscose), shirting & bottom wear fabrics
(cotton & poly cotton) & denims; has 55,000 spindles, 72 high-speed looms
etc.
The current market capitalization stands at Rs 14.11 crore.
7 Anjani Synthetics Ltd
Textile Company based in Ahmadabad, Gujarat; product range includes bed
sheets, dress materials, shirting, scarves, flannel, curtains & seersucker fabric.
8 Blue Blends (India) Ltd
Manufacturers & exporters of denim fabric for men's, ladies & children's wear;
its manufacturing unit is located at Piplej, Gujarat; uses slashed dyeing
technology and air-jet weaving machines.
39 | P a g e

9 Digjam Ltd
Company in the S.K. Birla group that manufactures fabrics for suiting under
the brand name Digjam; has been awarded ISO 9001 & Wool mark
certifications for Digjam products.
10 Duck Tarpaulins
ISI certified company in Vadodara engaged in the manufacture & export of
tarpaulins in Gujarat; promoted by the DVT group; its PE tarpaulins are
unaffected by UV rays & chemicals; exports its products to Europe, U.S.A.,
Middle East, Africa etc.
3.4.4 Local Taxes and Duties applicable in Textile Industry
Basically three types of taxes applicable to textile industry in Gujarat. The
owner and employees of the textile industries have pays income tax
1. Excise Duty
Excise duty is applicable to those textile industries who export the textile
products. Excise duty varies from state by state.
2. VAT
The current VAT tax is 4%. Textile industries have to pay this tax.
3. Service tax
3.4.5 Special Benefits given by State government to Textile Industry
The Indian government has provides a number of export promotion policies
for the textiles sector. Indian Government has allowed 100 per cent FDI in the
Indian textiles sector under the automatic route.
The Gujarat Government thinking to introduce new textile industry policies
which aims to create new employment opportunities.
Gujarat government provides subsidies on machinery and infrastructure.
40 | P a g e

Indian Government has implemented several export promotion measure like
focus product scheme, focus market scheme, market linked focus product
scheme for increasing textile exports.
Indian government has also extend 24/7 customs clearance facility at 14 sea
ports and 13 airports which helpful to faster clearance of import export.
All benefits given by Indian government is also helpful to Gujarat textile
industry
41 | P a g e

42 | P a g e
CHAPTER 4 STEEPLED ANALYSIS

STEEPLED ANALYSIS
4.1 STEEPLED analysis of Textile Industry in Indonesia
STEEPLED analysis is helpful for analyzing the factors of the country. As we known
SWOT analysis is popular for analyzing internal factors, the STEEPLE is analyzing or
we can say that handles macro-environmental external factors. The Steeple analysis
offers practical insight into seven major factors that affect your business.
1. S - Social Factors
Social aspect of textile industry considers the following aspects education, religion,
wages, gender etc. As we study in technological change in Indonesian textile industry
require specialised skills means it requires higher educational skills. Indonesia’s
education literacy rate is 90.4% which is good for Indonesian textile industry.
Indonesia is a multi religion country. In Indonesia 87.2% of the population is Muslim
religion so textile industry has to consider the requirements of the Muslim
population and also requires managing Muslim population culture in textile
products. Any textile product that harms Muslim culture has creates the problems
for the textile industry in Indonesia.
In Indonesia major part of employment is given by the textile industry and textile
industry major employers are labours. Indonesia is labour abundant country have
comparative advantage in textile industry as they can compete on lower wages
which creates a negative social impact.
2. T -Technological Factor
In this factor we analyse that overall change in the textile industry in Indonesia.
Advance technology has challenged the textile industry manufacturers in Indonesia
by undermining their cost advantage and presenting them with new parameters of
competition. The implementation of new technology requires specialized skills in
textile engineering, design, maintenance, computer knowledge etc. The new
technology increase cost of implementing and technology change require the skills
to run new technology. The change in technologies requires a complementary
change in textile organizations and management. Indonesian textile industry adopts
43 | P a g e

new technology to survive in international market but new technology
implementation increase the automation in manufacturing process which reduces
the employment level. Indonesian textile industry gives maximum employment
compare to other industries so change in technology reduces this employment level
which is not good for Indonesia.
3. E - Economical Factor
In this factor we analyze the overall economic situation of the Indonesia and
Indonesian textile industry. The textile industry occupies an important role in
Indonesian economy and textile industry is the second largest source of foreign
earnings. Indonesia also has a huge domestic market for textile thanks to rising
prosperity and a spread of wealth. This has helped the textile sector to avoid the
worst effects of the recent global recession, but it also target for foreign suppliers
and illegal imports. Indonesia’s textile industry exports have grown consistently at
around 5% to 6 % annually. Indonesia textile industry is the highest importance in
the nation’s economic development.
4. E - Environmental Factor
Indonesia’s geographical location environment is one of the most complexes and
varied in the world. Indonesia has situated in South-Eastern Asia between the Indian
Ocean and the Pacific Ocean. It has total 1,904,569 sq km area in that land is
1,811,569 sq km and water is 93,000 sq km. Basically it is hot and humid country.
Indonesia has faced many natural disasters such as 9.0 earthquakes, tsunami in
Indian Ocean. Humid environment of the Indonesia is affecting the raw cotton
production and the uncertain natural disasters will also affects the textile industry.
Textile industry requires raw cotton as raw material which is Avery important and a
base of textile industry. Environmental changes and natural disasters will affect and
decrease the production of raw cotton and also its humid environment decreases
the quality of cotton.
44 | P a g e

5. P- Political Factor
Political factors depend on changes in the government policy of country. These
changes affect the growth of any business directly or indirectly. Indonesia is the
republic country. In Indonesia every five year elections is being contested for
president and vice president post by direct vote of Indonesian citizens. Indonesian
government provides subsidies of 11% for reimbursement of machinery and
equipment which increase cost efficiency and cost competitiveness in the textile
industry. Indonesian government is dependent on the imported raw materials in
textile industry which increase the production cost of textile product. Joko Widodo is
the 7 th and current president of the Indonesia on 20 October 2014.
6. L – Legal
Indonesian legal rules and regulations are based on Roman – Dutch law. In Indonesia
domestic cost of doing business is rising which decentralization of by product with
local government. The taxes paid to the central government, adding numerous levies
and charges both legal and illegal. Indonesian government gives freedoms to
organize and engage in collective bargaining, these new freedoms opposed by labor
unions and have resulted in numerous industrial disputes and lost man-days. Higher
labor costs in post-crisis Indonesia arise from sharp increases in minimum wages and
laws entitling workers to generous severance pay.
7. E – Ethical
Ethical factors refer to the social values that govern business behaviour. There are
major ethical issues that have come up in Indonesian textile industry are explained
below.
The production of the raw cotton entails the use of a large amount of pesticides
which harmful to the environment and to people. The workers who works in cotton
field and people leave around the cotton field are adversely affected by the use of
pesticides in cotton production. The chemical dyes used in the garment production
are also harmful to the workers in textile industry.
45 | P a g e

8. Demographic Factor
Demographic factor are contain the study of populations. Demographic factors
consider the population age structure and the demands of the different age
structure. Indonesia has a very large population. It is on the 5 th position all over the
world. Indonesia is considered as a youth nation. 66% of the people are considered
as the age between 15 to 45 years. Textile and garment industry has to consider the
age structure because each age structure requirements are different. Age factor is
very important for Indonesian textile industry because different age group people
requirements are also different and each and every textile industry has to focus on
different age group people requirements.
46 | P a g e

4.2 STEEPLED analysis of Textile Industry in Gujarat
STEEPLED analysis is helpful for analyzing the factors of the country. As we known
SWOT analysis is popular for analyzing internal factors, the STEEPLE is analyzing or
we can say that handles macro-environmental external factors. The Steeple analysis
offers practical insight into seven major factors that affect your business.
1. S - Social Factors
The social step of the STEEPLE analysis will prompt you to take a close look at the
social and cultural changes occurring in your business environment. This step
typically requires market research so that you can see trends and patterns. Whether
we are analyzing population growth, age structure, consumer attitudes or lifestyle
changes, analyzing the social environment of firm may point out current faults in
strategy or provide new ideas for the future.
As we talking about social factors in Gujarat. Gujarat has an approximate population
of 6.4 carores people so the requirement of 6.4 carores people for cloths is higher.
So Gujarat have a good market for textile industry. As we known majority of the
population are young. 50% population age is lies between 0 to 25 ages.
2. T -Technological Factor
Today’s business world behaves very differently from the business world of the past.
Many of these changes in behaviour result from technological changes throughout
the world. The significance of technological change depends on the market of your
business.
Changes in production methods can provide new opportunities for improving your
profit margin, but can also require large initial investments. Technological changes
can also have a huge impact on demand. New markets and new opportunities can be
created by advancements in technology. By keeping a close eye on the technology
industry, you may be able to capitalize more effectively on changes.
In Gujarat day to day the technology are improved. The technological knowhow and
expertise will also enter the Gujarat market with an increase in competition.
European technology entering the Indian beer market increased production and
47 | P a g e

lowering cost of production could play a major role in the Indian beer market. As we
talking about last year in Gujarat computer and laptops are everywhere, the internet
connect is everywhere , the IT companies are making lot of software , smart
machines are used in each industry etc. Thus we can say that technologies are
improving in the Gujarat.
3. E - Economical Factor
In this factor we analyzing the overall economic situation of the environment will
change many times. By analyzing current levels of inflation, unemployment,
economic growth and international trade, we can maintain our strategic plan more
effectively.
The economic factors in Gujarat are improving continuously. This will lead to higher
buying power in the Hands of the Gujarat consumers. In India inflation is 4.35% in
august 2015. Current inflation India (CPI India) is based upon the Indian consumer
price index. This index is a measure of the average price which consumers spend on
a market-based "basket" of goods and services. Youth Unemployment Rate in India
has decreased to 12.90percent in 2013 from 18.10 percent in 2012. India’s Gross
Domestic Product (GDP) growth slowed to 7.0% in the first quarter of financial year
(FY) 2015 (ending 31 March 2016) from 7.5% in the last quarter of FY2014. The
deceleration was broad-based, with private consumption, manufacturing, and
services all experiencing slower growth. However, expansion in fixed investment
picked up to 4.9% from 4.1% in the previous quarter, indicating a continuing gradual
recovery in capital expenditure.
4. E - Environmental Factor
Every country has impacts its environment in one way or another. This impact can be
negative in cases of costly pollution or waste, but it can also be positive when a firm
provides benefits for its environment such as processing and cleaning waste.
Environmental factors include the weather & climate changes of the country,
Changes in temperature can impact on many industries including farming, tourism &
insurance. The growing desire to protect the environment is having an impact on
many industries.
48 | P a g e

In Gujarat due to low rain there is decrease in the growing vegetables. Agriculture
grew by 1.9%, but monsoon rainfall that has been 12% below normal crimped the
summer crop planted area.
5. P- Political Factor
Political factors depend on changes in the government policy of country. These
changes can be economic, social, legal or any combination of the three. Government
may be increase taxes for some businesses while reducing taxes in other areas.
These can have a direct impact on your business so it is important to stay up-to-date
with political factors. In some cases government interventions like interest rate
policy changes can have an impact on your demand patterns.
In Gujarat, the political Situation in the state is more stable. Overall India currently
has a coalition led government BJP. Low global oil prices, a positive base effect, and
tight monetary policy kept consumer price inflation benign at an average of 4.8% in
the first 4 months of FY2015. Also Financial Minister Arun Jaitley is cut down
corporate tax from 30% to 25%.
6. L – Legal
Legal restraints and regulations prevent negative behaviours and increase costs in
many industries. To legally operate in the environment, the business must comply
with laws focusing on everything from health and safety to employment and
competition. Many countries are more focusing on the legal rule and regulation
behind the industry.
In Gujarat government is more focusing on the health and safety measure of the
workers. In Gujarat government is providing major acts related to the wages and
remuneration like minimum wages act. Also government is stricter on the Disability
discrimination legislation, an increase in the Minimum wage & greater requirements
for firms to recycle. Legal changes can affect a firm‘s costs & demand. The
Government of Gujarat is mulling on reforming the interest subsidy regime across
several sectors, including the textile sector, according to media reports.
49 | P a g e

7. E – Ethical
Ethical factors refer to the social values that govern business behaviour and provide
a foundation for what is right and what is wrong. The chemical dyes that are used in
the production of garments in Gujarat lead to skin problems. Problems such as
eczema, rashes and skin irritation have been noted among people on account of
dangerous toxins in the clothes worn by them. These factors affecting to the textile
industry in Gujarat.
8. Demographic Factor
Demographics are the study of populations. A demographic analysis looks at a
specific population to describe the population and its characteristics, such as average
education level, average age, income level, ethnic distribution, and other
characteristics. A demographic analysis is useful in a business plan, to describe the
population where the business is located. Population is very important for any
business. In Gujarat population contains different cultures and different culture
requires different clothing so if textile industry can’t consider these requirement
than it will affect their business. So demographic factors are very important for
textile industry.
50 | P a g e
4.3 Comparative analysis of STEEPLED in tabular form
Country
Steepled Analysis
Gujarat Indonesia
Socio-culture Analysis Gujarat has an approximate
population of 6.4 carores people
so the requirement of 6.4 carores
people for cloths is higher. So
Gujarat have a good market for
textile industry.
Indonesia’s education leteracy
rate is 90.4% which is good for
indonesian textile industry.
Indonesia is a multi religion
country. In Indonesia 87.2% of
the population is muslim religion
so textile industry has to consider
the requirements of the muslim
population and also requires to
manage muslim population
culture in textile products.
Technology Analysis In Gujarat textile industry,
technological changes have a huge
impact on demand. New markets
and new opportunities can be
created by advancements in
technology.
Advance technology has
challenged the textile industry
manufacturers in Indonesia by
undermining their cost
advantage and presenting them
with new parameters of
competition.
Economic Analysis Economic factor in Gujarat are
improving continuosly. This will
lead to higher buying power in
hands of the Gujarat consumers
which is good for textile industry.
The textile industry occupies an
important role in indonesian
economy and textile industry is
the second largest source of
foreign earnings. Indonesia also
has a huge domestic market for
textile thanks to rising prosperity
and a spread of wealth.
Environmental Analysis In Gujarat changes in temperature
can impact on the textile industry
Indonesia’s geographical location
environment is one of the most
51 | P a g e

because textile industry requires a
cotton raw material
complexes and varied in the
world. Humid environment of the
Indonesia is affecting the raw
cotton production and the
uncertain natural disasters will
also affects the textile industry.
Political Analysis In Gujarat, the political Situation
in the state is more or less stable.
Low global oil prices, a positive
base effect, and tight monetary
policy kept consumer price
inflation benign at an average of
4.8% in the first 4 months of
FY2015. Also Financial Minister
of India Arun Jaitley is cut down
corporate tax from 30% to 25%
which is pplicable to gujarat also
so it is beneficial for textile
industry
Indonesian government provides
subsidies of 11% for
reimbursement of machinery and
equipment which increase cost
efficiency and cost
competitiveness in the textile
industry. Indonesian government
is dependent on the imported
raw materials in textile industry
which increase the production
cost of textile product.
Legal analysis In Gujarat government is more
focusing on the health and safety
measure of the workers. In
Gujarat government is providing
major acts related to the wages
and remuneration like minimum
wages act.
Indonesian government gives
freedoms to organize and engage
in collective bargaining, this new
freedom opposed by labor
unions and have resulted in
numerous industrial disputes and
lost man-days.
Ethical analysis The chemical dyes that are used in
the production of garments in
Gujarat lead to skin problems.
Problems such as eczema, rashes
and skin irritation have been
noted among people on account
The production of the raw cotton
entails the use of a large amount
of pesticides which harmful to
the environment and to people.
The workers who work in cotton
field and people leave around the
52 | P a g e
of dangerous toxins in the clothes
worn by them.
cotton field are adversely
affected by the use of pesticides
in cotton production.
Demographic analysis Population is very important for
any business. In Gujarat
population contains different
cultures and different culture
requires different clothing so if
textile industry can’t consider
these requirement than it will
affect their business.
Indonesia has a very large
population. It is on the 5 th
position all over the world.
Indonesia is considered as a
youth nation. 66% of the people
are considered as the age
between 15 to 45 years. Textile
and garment industry has to
consider the age structure
because each age structure
requirements are different.
53 | P a g e
54 | P a g e
CHAPTER 5SWOT ANALYSIS

SWOT ANALYSIS
5.1 SWOT analysis of Textile Industry in Indonesia
STRENGTHS
1. A primary strength - vertically integrated garment and textile industry.
2. It Has a large domestic Market helps in offsetting any export slump
3. Indonesia Is politically stable and is developing policies to attract foreign
investment
4. Indonesia has a large labor supply so the manufacturing in the Indonesia is
effective.
5. The natural resources are abundance.
6. Indonesia’s banking sector remains healthy so Credit is abundant
7. In Indonesia no government bailouts
WEAKNESSES
1. In Indonesia Aging machinery that limits production and saps energy
2. There is rising energy costs so manufacturing in Indonesia is more difficult.
3. In Indonesia Relatively higher interest rates than many of its neighbors so
financing cannot be easy taken.
4. In Indonesia Lack of supportive infrastructure
5. Absolute dependence on imported cotton for both its export and domestic needs
OPPORTUNITIES
1. Indonesia continues to develop as a textile and garment Manufacturing hub, so
opportunities for global and regional exports should improve
2. The government is beginning to pay more attention to the sector such as a
modernization scheme s so major sector should developing their plan in
Indonesia
3. The country’s massive domestic market offers an obvious opportunity
THREATS
55 | P a g e

1. Indonesia Rampant Smuggling in the Region
2. The Lower-Priced Products from China Poses Serious Competition
5.2 SWOT analysis of Textile Industry in Gujarat
Strengths
1. As we know that India is the Strong cotton base country. Gujarat is one of the
largest producers of natural and man-made fibers. It produces almost 16% of the
India production of raw cotton.
2. Gujarat is Strong entrepreneurial class in textile industry. Large number of
industry are manufacturing different types of cloth with different style as well as
fashion of cloth and export to the another country.
3. Gujarat textile industry provides Flexibility in production of small order lots.
4. In Gujarat Skilled labor is easily available. Manufacturing capacity present across
the entire range and across entire value chain yarn, fabric, process house and
garments is highest. Also adequate labour supply at relatively competitive wages.
5. The Ability to handle value additions, embellishments, etc. is easily available
6. Gujarat provides Good ‘cultural’ comfort with US and Europe country.
7. Gujarat is Growing domestic market
Weaknesses1. In Gujarat due to the poor work practices resulting in higher labour cost
component in many staple garments, in spite of low labour cost.
2. In Gujarat there is very Rigid government labour policy and lack of
rationalization of duties in MMF
3. High transaction and power cost so there is high level of cost incurred in
manufacturing and exporting the cloths.
4. Gujarat is more emphasis on cotton, synthetic fiber base which is not equally
developed.
5. In Gujarat there is problem in Technological obsolescence and lower efficiencies
due to this more work is done by the workers.
56 | P a g e

6. There is Lack of strong linkages between raw material supplier and the apparel
manufacturer.
7. In Gujarat less attention on man power training and due to this manufacturing
of the cloths are Poor quality standards.
8. There is Lack of professionalism and integration of supply chain Gujarat cannot
be more exporting the goods.
9. In Gujarat very low investment on R&D and also limited exploitation of
economies of scale.
Opportunities
1. Due to Good political equation with EU and US the opportunity of exporting the
cloths would increase in different country.
2. India can try to Improvements in infrastructure, regulations, ‘Supply Chain
Management’ and ‘Information Technology’ in apparel manufacturing.
Availability of EDI (Electronic Data Interchange) makes communication fast, easy,
transparent and reduces duplication.
3. Improving into the Research and product development in Textile industry by
improving quality and design of cloths.
4. Understanding buyers’ need because of language advantage
Threats
1. As known due to the Greece crisis there is Rupee appreciation in last few months
so the exporting is more costly.
2. There is treats of trade blocs and partnerships at the exclusion of India
3. Many time there is problem of the Location disadvantage like long transit time to
key markets
4. Many times there are threats of pricing pressure of the different company
exporting same goods with different prices.
5. Enhanced competition from other countries similarly constrained by quotas.
6. There has been an increase in seasons per year which has resulted in shortening
of the fashion cycle.
57 | P a g e

7. Change in the world trade scenario. Existence of bilateral agreements would
result in significant disadvantage for Indian exports.
58 | P a g e

59 | P a g e
CHAPTER 6 INTRODUCTION ABOUT ORISSA

Introduction About Odisha
6.1 Overview of Odisha
Odisha (formerly Orissa), an eastern Indian state on the Bay of Bengal, is known for
its tribal cultures and its many ancient Hindu temples. The capital, Bhubaneswar, is
home to hundreds of temples, notably the Nagara-style Mukteswar and the Lingaraj,
both built in the 11th century and set around sacred Bindusagar Lake. The Odisha
State Museum is dedicated to the area’s indigenous history. The state has an area of
155,707 km2 and extends for 800 kilometres from north to south and 500 kilometres
from east to west. Its coastline is 480 kilometre long. The state is divided into 30
districts which are further subdivided into 314 blocks.
6.1.1 Population
The total population of Odisha is 43.73 million (2014).
6.1.2 Official Language
The official language of odisha is Oriya. It is spoken by about 84 per cent of the
population of Odisha. Hindi, Urdu, Bengali and Telugu are widely understood
and sometimes spoken. English is spoken by the educated few.
6.1.3 Ethnic Groups
There are several ethnic groups in Odisha are listed below
Dongria Kondh
Bonda
Gaddava
Gond
Saora
Paroja
60 | P a g e

6.1.4 Natural Resources
There are several natural resourses available in Odisha. The resources found in
Odisha are water, wild life, forest and mineral resources and these natural resources
are very essential for growth and development of the state.
6.1.5 Transportation Connectivity of Gujarat with Orissa
Orissa has 238,000 kilometres of roads including 3,508 kilometres of National
Highways. 5,102 of state Highways and 30 kilometres of State Expressways.
Some of the prestigious projects are the Bhubaneswar-Cuttack highway,
Talcher-Gopalpur highway and the construction of the 4-Lane Cuttack-
Paradeep highway.
Civil Aviation
1. A domestic airport is located at the state capital Bhubaneswar
2. There are 13 Airstrips and 16 Helipads at different Places of the state
Railways
1. At the end of 2005-06, total railway route length in Orissa was 2340 kms
2. Orissa is a link between eastern and western India through railway network
of South-Eastern and East-coast Railways
3. With the commissioning of the Talcher-Sambalpur Railway a vital link has
been established between Coastal and western Orissa
6.1.6 Major Industries in Orissa
The Odisha Industry is going places with excellent industrial infrastructure and
presence of top national and international companies. The state has
witnessed an industrial upsurge due to the favourable industrial atmosphere
61 | P a g e
in the state. The state government of Odisha has invited major industrial
houses of the country and abroad to invest in the state. It has achieved a
considerable amount of success and several prime companies have set up
their plants in the state.
The industrial structure of Orissa mainly consists of four categories:
• Medium industries
• Cottage industries
• Large scale heavy industries
• Large scale industries
The large scale medium and large scale heavy industries include the:
• Cement industry
• Ceramic Glass plants
• Refractory units
• Ferro Manganese plants
• Aluminium industry
• Fertilizer plants
• Agro based industries
• Chemical industries
• Tyre factories
• Aeronautical industry
The state is rich in forest resources, which has prompted the growth of several
forest based industrial plants. The cottage industry of Orissa includes the;
• Sericulture industry
• Cotton textile mills
• Sugar mills
• Rice mills
The small scale industries of Orissa include:
• Brass industry
• Tobacco industry
62 | P a g e

• Bevarage
• Molasses
• Aluminium utensil making plants
The iron and steel industry of Orissa has played a major role in bringing the
industrial boom in the state. Presence of steel giants like the SAIL, POSCO,
NINL, Jindal Steel etc. is a proof of the industrial importance of the state. The
Rourkela Steel Plant is one the best in the country.
6.1.7 Contribution in National GDP
The Indian economy has recorded a sluggish growth of 5.5 per cent in the
current fiscal year. The Odisha Government has projected a growth of 9.14 per
cent for the 2012-2013 financial years.
The services and industry sectors have contributed significantly to the growth
of the State’s economy. The services sector has become increasingly
pronounced in recent years and its share to the Gross State Domestic Product
(GSDP) is expected to be 58.28 per cent while the contribution of industry
sector will be 24.23 per cent during the current fiscal (2012-13).
6.2 Overview of Textile Industry in Odisha
Textile industry is one of the largest contributors to India exports with approximately
11 percent of total exports.
The distinctive hand-woven textiles of Odisha (Orissa) in unusual patterns and
vibrant colors have supported a thriving cottage industry employing thousands.
Odisha (Orissa) is famous for its silk ikat weaves created by an intricate process
called the "bandha" in which warp and weft threads are tie-dyed to produce the
pattern on the loom while weaving.
63 | P a g e
Sambalpur, Berhampur, Mayurbhanj and Nuapatna produce a striking range in tassar
silk with a brilliance, glaze and texture that are unmatched. The rare silk fabric
produced at Nuapatna in Cuttack district embellished with verses from the
Gitagovinda is used to dress the idols at the Jagannath Temple.
6.2.1 Contribution of Textile Industry in National GDP
According to 2014-15 economic survey, Odisha's gross state domestic
product (GSDP) was expected to grow at 8.78% in the 2014-15 fiscal year
Odisha has an agriculture-based economy which is in transition towards
an industry and service-based economy
Expected to grow at a rate of 8.1% during 2015-2020. Odisha is also one
of the top FDI destinations in India
Contribution of each sector to the GSDP (in percent)
Service (51%)
Agriculture (15.4%)
Industry (33.6%)
6.2.2 Major Players of Textile Industry with their Market Share
There are only three textile industries in Orissa
1. New Mayurbhanj Textiles Mills, Baripada
2. Bhaskar Textiles Mills Ltd., Jharsuguda
3. Odisha Textiles Mills (OTM), Choudwar
6.2.3 Local Taxes and Duties applicable in Textile Industry
Basically three types of taxes applicable to textile industry in Odisha. The
owner and employees of the textile industries have pays income tax
1. Excise Duty
Excise duty is applicable to those textile industries who export the textile
products. Excise duty varies from state by state.
2. VAT
64 | P a g e

The current VAT tax is 4%. Textile industries have to pay this tax.
3. Service tax
6.2.4 Special Benefits given by State government to Textile Industry
The Indian government has provides a number of export promotion policies
for the textiles sector. Indian Government has allowed 100 per cent FDI in the
Indian textiles sector under the automatic route.
Promotion of Textile Industries: Rs 11.24 lakh have been provided for
exposure visit of entrepreneurs, and formulation of State Textile Policy.
Marketing & Export promotion: 22 DLEs, 1 National Expo and 1 special Expo
have been organized, besides two special exhibitions out of Cluster
Development programme.
6.3 SWOT analysis of Textile Industry in Orissa
Strength
1. Labour Easily Available2. Good Transportation Facility By All Means Water, Road And Air
Weakness
1. Liquidation Of Textile Companies 2. Lack Of Support From State Government To The Industry3. Unavailability Of Raw Materials
Opportunity
1. Indian Government Provide Subsidy For Textile Machinery And Plants 2. Improvement In Infrastructure And Information Technology
Threat
1. Trade Scenario2. Competition In The Market
65 | P a g e

FINDINGS IN TERMS OF COMPARATIVE ANALYSIS OF TEXTILE
INDUSTRY IN INDONESIA, GUJARAT, ORISSA OF STUDY W.R.T.
SPECIFIC BILATERAL TRADE OPPORTUNITY
Indonesia Gujarat OrissaThere is a very high demand
of cotton yarn and cotton
clothes.
Indonesia’s total import of
textile products for the year
2015 is MUS $3460.42.
Major Importer of cotton
clothes from various part of
the world.
Infrastructure and
transportation facilities of
Indonesia are well
developed.
Top producer of cotton
compared to other states of
India.
Gujarat’s total export of
textile products for the year
2015 is MUS $11663.21.
Major firms exporting of
cotton clothes are located in
Gujarat.
Use of technology in textile
sector are advanced and
Gujarat textile industry use
latest technology and
automated machines for
production.
Production of cotton and
cotton clothes are very less.
There are no major exporter
of textile products.
Textile industries are facing
losses and at the stage of
liquidation.
Technology advancement
are not that good in the
state.
66 | P a g e

ANNEXURE1. http://www.thejakartapost.com/news/2014/07/02/
2. http://www.nrigujarati.co.in/Topic/579/1/textile-industry-in-gujarat.html
3. www.texprocil.org .
4. www.indonesiainvestment.com
5. CIA World Fact Book
6. www.ibef.org
7. www.indianrailinfo.com
8. www.odishatax.gov.in
67 | P a g e
68 | P a g e