Embed Size (px)
Citation preview

KEMENTERIAN PEKERJAAN UMUM
by Ir. Rudy A Arifin, M.Sc.
INDONESIAN NATIONAL POLICY & STRATEGY
ON ENVIRONMENTAL SANITATION
MANAGEMENT
MINISTRY OF PUBLIC WORKS INDONESIA
1
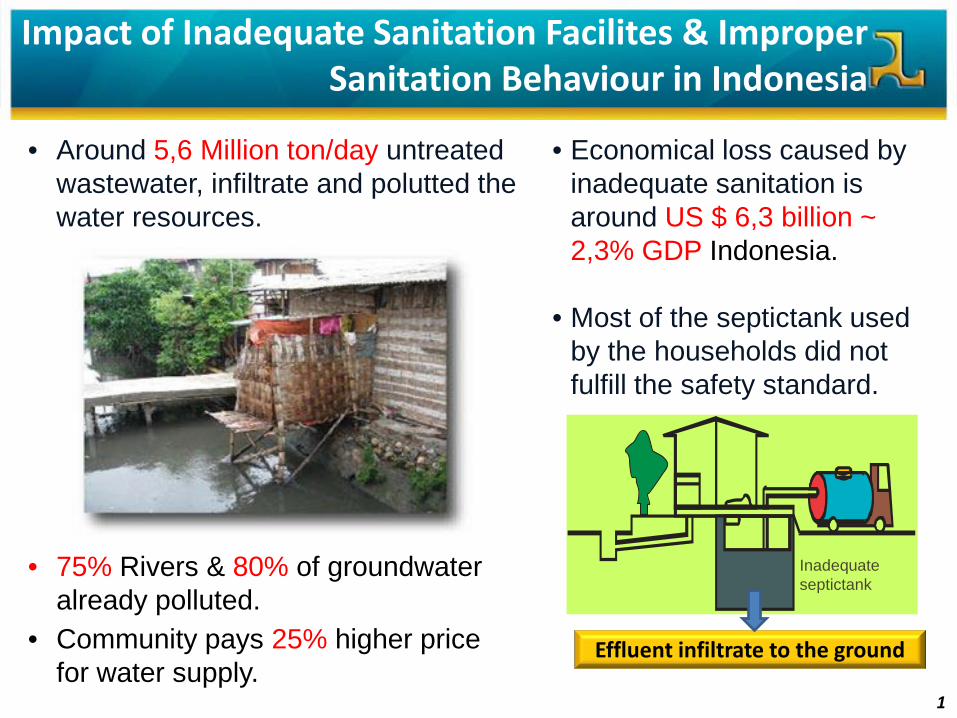
Impact of Inadequate Sanitation Facilites & Improper Sanitation Behaviour in Indonesia
• Around 5,6 Million ton/day untreated wastewater, infiltrate and polutted the water resources.
• 75% Rivers & 80% of groundwater already polluted.
• Community pays 25% higher price for water supply.
Effluent infiltrate to the ground
Inadequate septictank
• Economical loss caused by inadequate sanitation is around US $ 6,3 billion ~ 2,3% GDP Indonesia.
• Most of the septictank used by the households did not fulfill the safety standard.

2
Current Sanitation Status in Indonesia
Onsite (70,48%) 72,78% Urban population
38,47% Rural population
Basic Sanitation (55,60%)
Offsite (2,3%)
Onsite (38,47%)
Offsite (0%)
(taken from the Indonesian MDGs Roadmap, 2011)
Public access to adequate
sanitation services remains
challenging
A breaktrough and efficient solution needs to
be impemented to accelerate the development
3
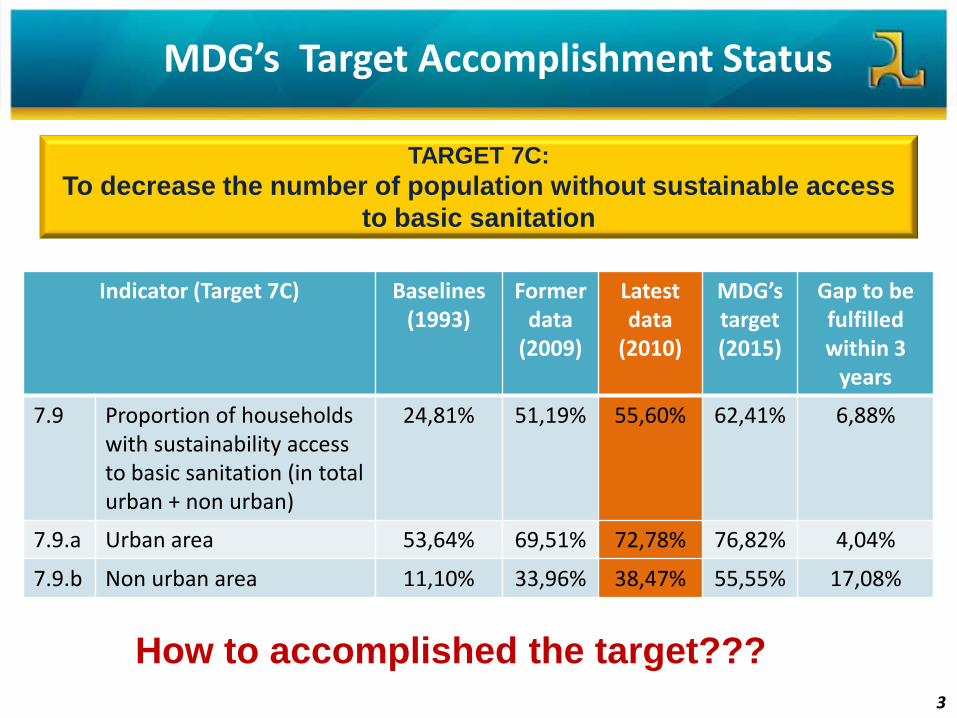
MDG’s Target Accomplishment Status
TARGET 7C: To decrease the number of population without sustainable access
to basic sanitation
Indicator (Target 7C) Baselines (1993)
Former data
(2009)
Latest data
(2010)
MDG’s target (2015)
Gap to be fulfilled within 3
years
7.9 Proportion of households with sustainability access to basic sanitation (in total urban + non urban)
24,81% 51,19% 55,60% 62,41% 6,88%
7.9.a Urban area 53,64% 69,51% 72,78% 76,82% 4,04%
7.9.b Non urban area 11,10% 33,96% 38,47% 55,55% 17,08%
How to accomplished the target???
4
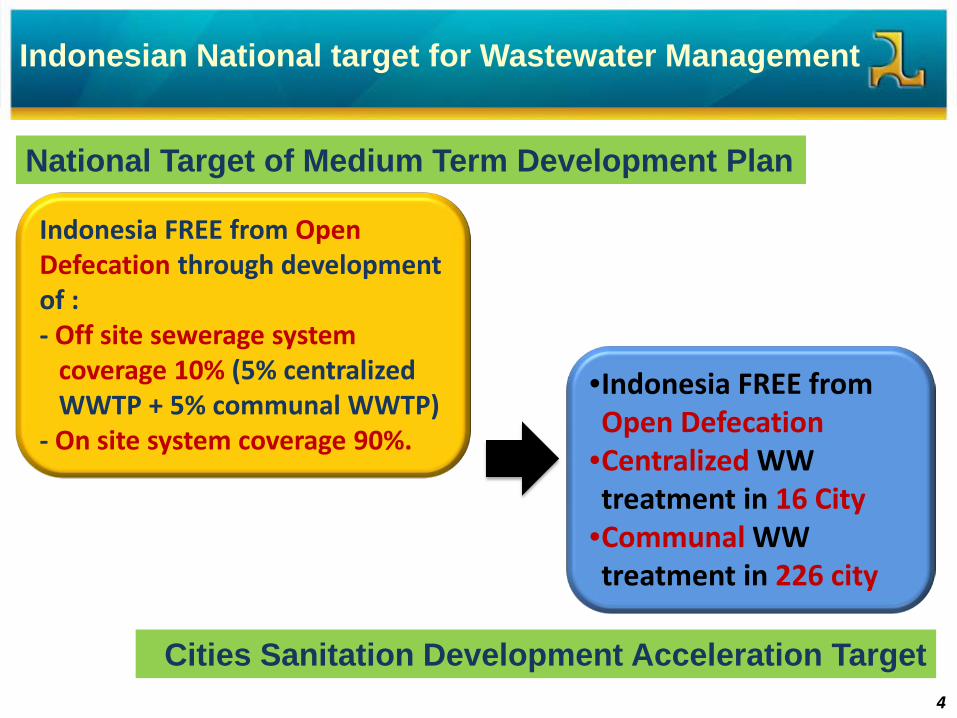
Indonesian National target for Wastewater Management
Indonesia FREE from Open Defecation through development of : - Off site sewerage system
coverage 10% (5% centralized WWTP + 5% communal WWTP)
- On site system coverage 90%.
•Indonesia FREE from Open Defecation
•Centralized WW treatment in 16 City
•Communal WW treatment in 226 city
National Target of Medium Term Development Plan
Cities Sanitation Development Acceleration Target
5
LESSONS LEARNED FROM THE EXPERIENCE WITH SANITATION SERVICES DEVELOPMENT
• Bottom up planning (for community and neigbourhood scale) and Top down planning (for city wide and regional scale) NEED TO BE COMBINED to accomplish significant number of public access to sanitation infrastructure.
• Providing only sanitation infrastructure WILL
NOT SOLVE THE PROBLEM. Public campaign to raise public awareness about sanitation is an essential point too.
6
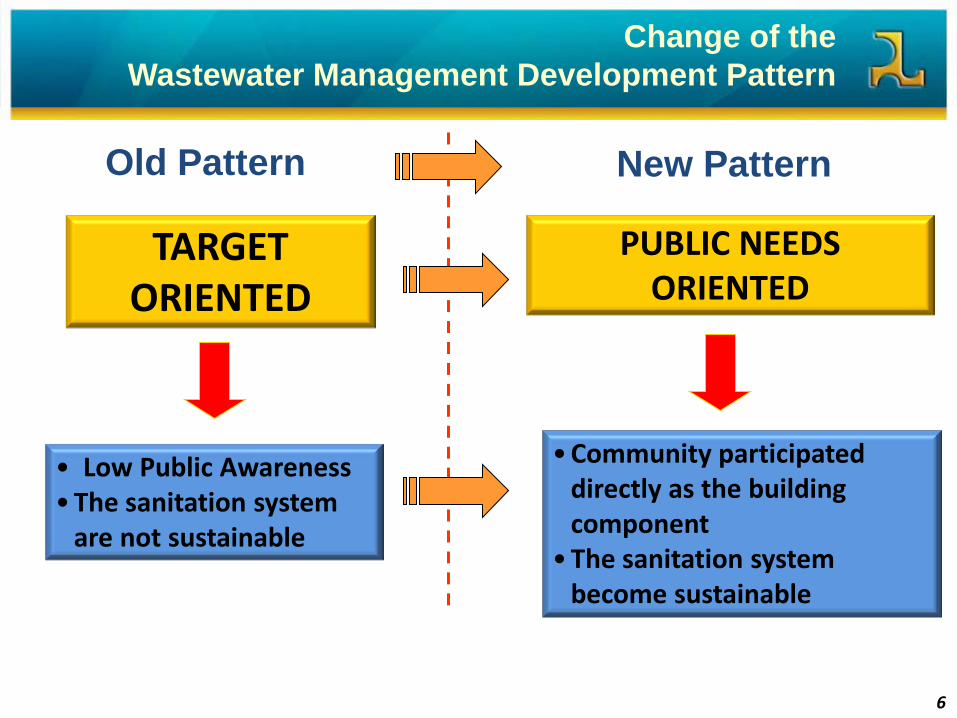
Old Pattern
TARGET ORIENTED
• Low Public Awareness •The sanitation system
are not sustainable
PUBLIC NEEDS ORIENTED
•Community participated directly as the building component
•The sanitation system become sustainable
Change of the Wastewater Management Development Pattern
New Pattern
7
PROGRAM DEVELOPMENT PRINCIPLES
•Pro poor orientation in the environmental sanitation infrastructures development.
•Pro community health improvement and environment protection/ conservation.
•Community based development approaches for all of the step of environmental sanitation infrastructures development and management.
•Demand responsive approaches for city wide environmental sanitation infrastructures development.
8
POLICY AND STRATEGY OF WASTEWATER SECTOR (Ministerial Regulation PU 16/PRT/M/2008)
1. INCREASE THE ACCESS, accessibility to sanitation facilities both on-site and off-site systems in urban and rural areas have to be increased for community health improvement
2. COMMUNITY AND PRIVATE PARTICIPATION, improve the quality services with community and private active participation/involvement
3. LAW AND REGULATIONS, strengthening of law enforcement and
developing regulations of municipal wastewater management.
4. INSTITUTION, strengthen the institution and capacity building of municipal waste water management
5. FUNDING, enhance the financial capacity and alternative source for
wastewater infrastructures development

9
Wastewater Management Approach
Neighborhood City Wide Regional/National
Institutional Based Community Based
Level
Approach
Wastewater infrastructure services based on demand responsive approach
Wastewater infrastructures development support inter cities/region coordination to protect watershed from human waste pollution
Adequate Sanitation: 1. Rural 2. Slum area
Metropolitan & Large Cities Off site/sewerage system
Medium & Small Cities - Integrated system of existing on-site and new off-site sanitation
- Improved Septage Treatment Plant (IPLT) and sludge services
- Shallow/small bore sewer or small scale sewerage integrated to municipal sewage system to support revitalization program for old cities.
New Town - Develop small sewage system for Low
Cost Housing area - Encourage sewerage development for
new town
Clean River Program
(PROKASIH) or similar program
On- Site sanitation and Small Scale Community Sewerage System (SANIMAS)
10
INSTITUTIONAL BASED SANITATION APPROACH
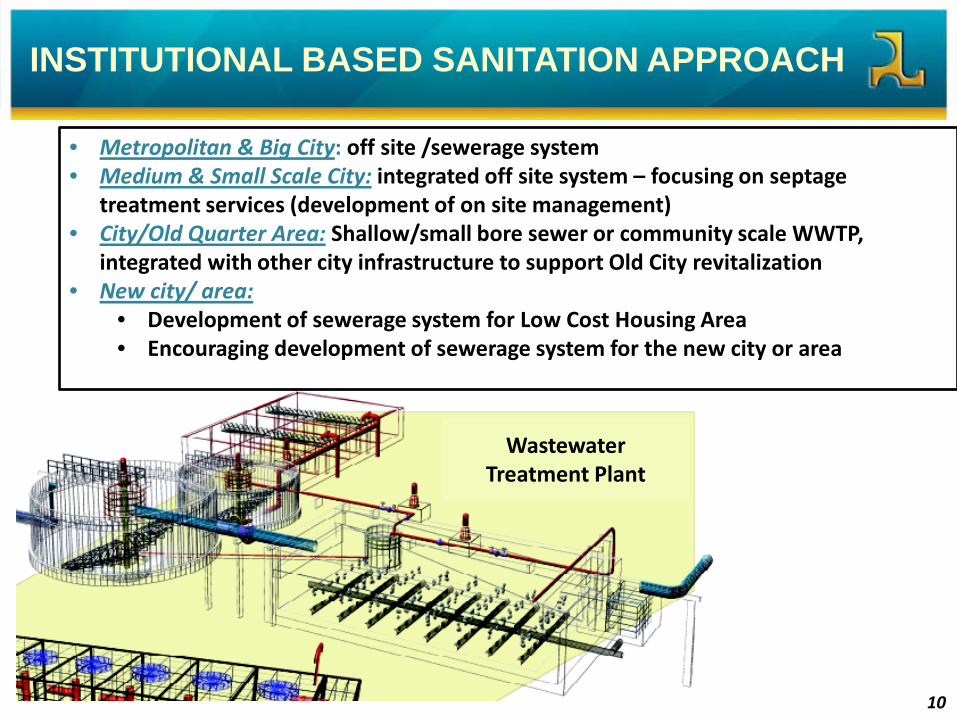
• Metropolitan & Big City: off site /sewerage system • Medium & Small Scale City: integrated off site system – focusing on septage
treatment services (development of on site management) • City/Old Quarter Area: Shallow/small bore sewer or community scale WWTP,
integrated with other city infrastructure to support Old City revitalization • New city/ area:
• Development of sewerage system for Low Cost Housing Area • Encouraging development of sewerage system for the new city or area
Wastewater Treatment Plant

11
INVESTMENT PROPORTION FOR THE CENTRALIZED WASTEWATER SYSTEM
TREATMENT UNITS
National Budget Local Government Budget
CENTRALIZED SYSTEM COMPONENTS
PRIMARY & SECONDARY
PIPE
LATERAL PIPE
HOUSE CONNECTIONS
O &M

12
WWTP Suwung, Bali
WWTP Sewon, Yogyakarta
WWTP on Cirebon
SEWERAGE SYSTEM ON 13 METOPOLITAN/ BIG SCALE CITY IN INDONESIA
Bandung: WWTP Bojongsoang Cirebon: WWTP Ade Irma, Kesenden, Perumnas Utara Yogyakarta: WWTP Sewon Surakarta: WWTP Mojosongo & Semanggi Bali: WWTP Suwung Medan: WWTP Pulo Brayan Prapat: WWTP Aji Bata Balikpapan: WWTP Margasari Banjarmasin: WWTP HKSN, Lambung Mangkurat, Pekapuran Raya, Basiri Jakarta: WWTP Setiabudi & Malaka Sari Tangerang: WWTP Sukasari Manado: WWTP Boulevard Batam: WWTP Batam Center
13
SEWERAGE IN INDONESIA (2011)
City System Total Capacity
(m3/day) Used Capacity (m3/day)
House Connections
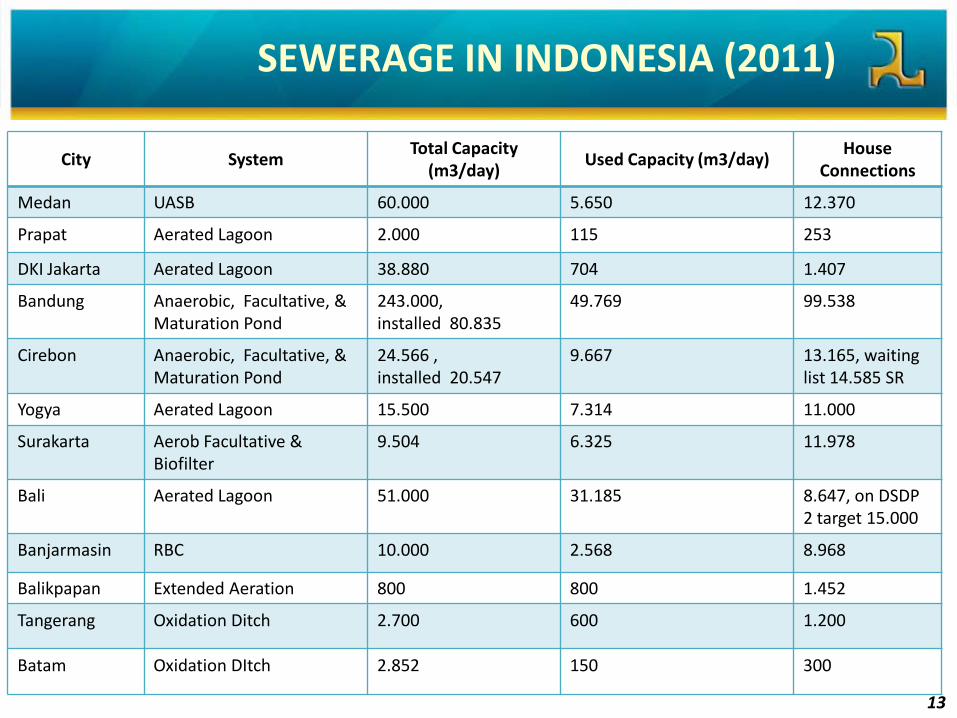
Medan UASB 60.000 5.650 12.370
Prapat Aerated Lagoon 2.000 115 253
DKI Jakarta Aerated Lagoon 38.880 704 1.407
Bandung Anaerobic, Facultative, & Maturation Pond
243.000, installed 80.835
49.769 99.538
Cirebon Anaerobic, Facultative, & Maturation Pond
24.566 , installed 20.547
9.667 13.165, waiting list 14.585 SR
Yogya Aerated Lagoon 15.500 7.314 11.000
Surakarta Aerob Facultative & Biofilter
9.504 6.325 11.978
Bali Aerated Lagoon 51.000 31.185 8.647, on DSDP 2 target 15.000
Banjarmasin RBC 10.000 2.568 8.968
Balikpapan Extended Aeration 800 800 1.452
Tangerang Oxidation Ditch 2.700 600 1.200
Batam Oxidation DItch 2.852 150 300
14
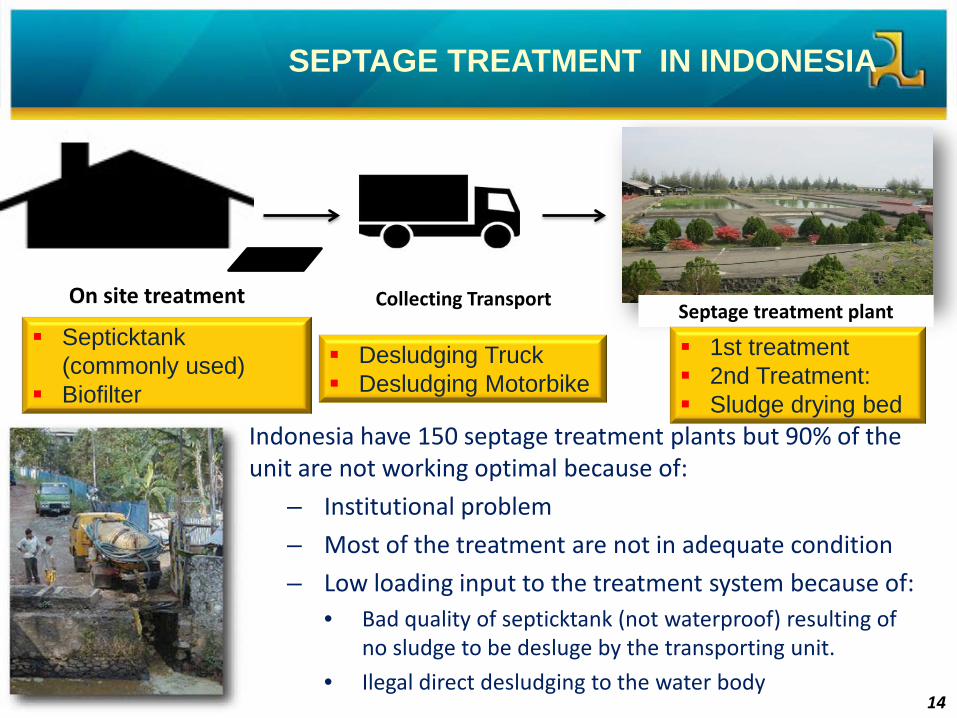
SEPTAGE TREATMENT IN INDONESIA
On site treatment Septage treatment plant
Septicktank (commonly used)
Biofilter Desludging Truck Desludging Motorbike
1st treatment 2nd Treatment: Sludge drying bed
Collecting Transport
Indonesia have 150 septage treatment plants but 90% of the unit are not working optimal because of:
– Institutional problem
– Most of the treatment are not in adequate condition
– Low loading input to the treatment system because of: • Bad quality of septicktank (not waterproof) resulting of
no sludge to be desluge by the transporting unit.
• Ilegal direct desludging to the water body
15
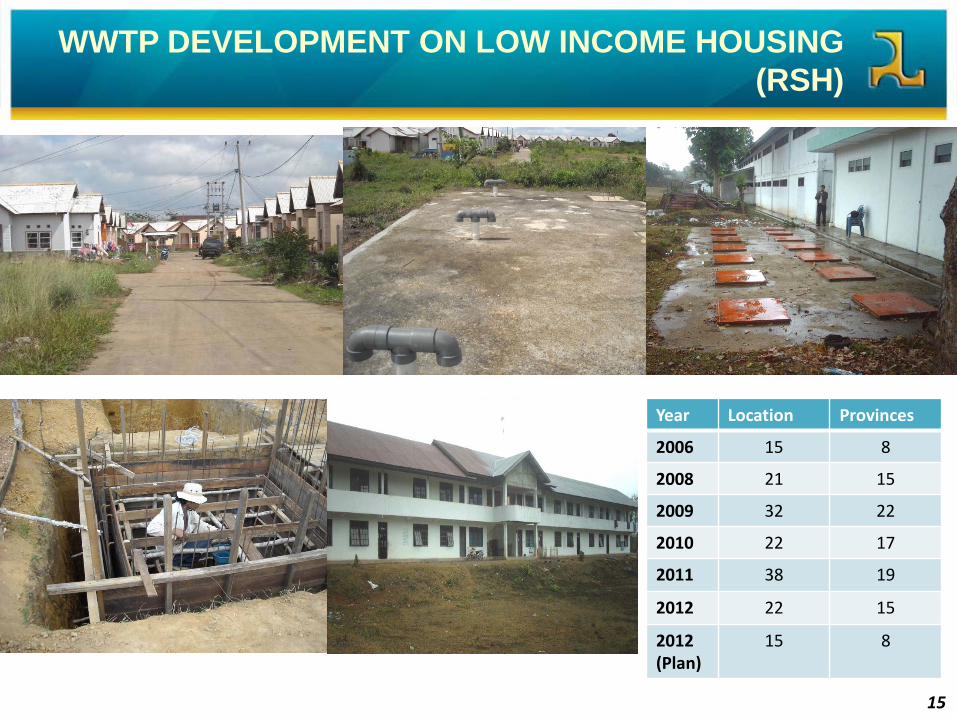
WWTP DEVELOPMENT ON LOW INCOME HOUSING (RSH)
Year Location Provinces
2006 15 8
2008 21 15
2009 32 22
2010 22 17
2011 38 19
2012 22 15
2012 (Plan)
15 8
16
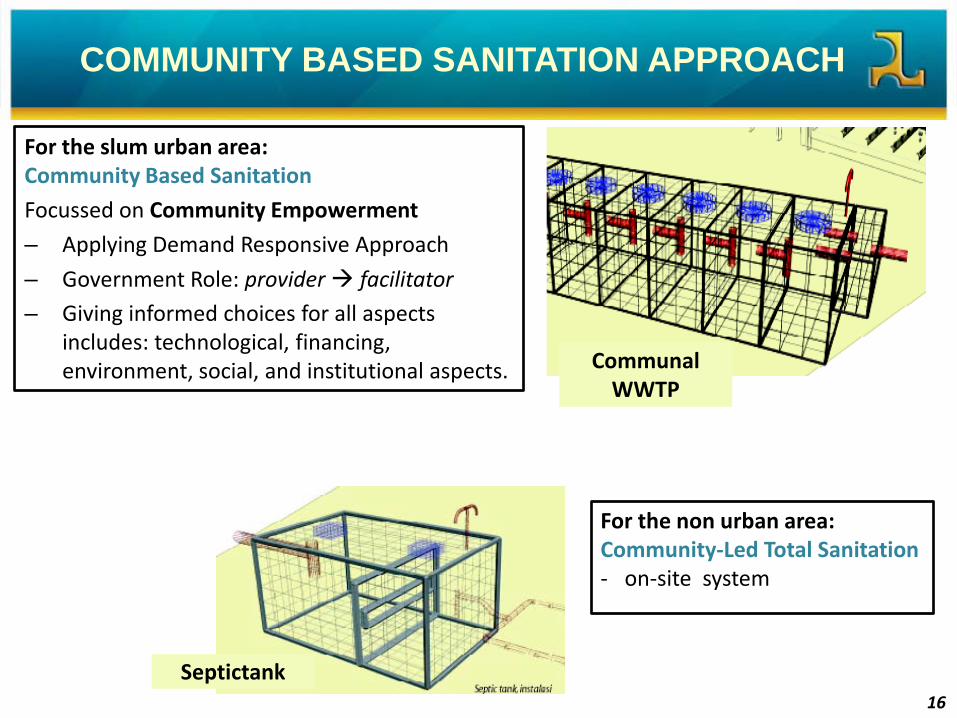
COMMUNITY BASED SANITATION APPROACH
For the slum urban area: Community Based Sanitation
Focussed on Community Empowerment
– Applying Demand Responsive Approach
– Government Role: provider facilitator – Giving informed choices for all aspects
includes: technological, financing, environment, social, and institutional aspects. Communal
WWTP
Septictank
For the non urban area: Community-Led Total Sanitation - on-site system

17
• OBJECTIVE: to improve sanitation condition for poor people based on comunity demand and choice.
• SANIMAS help community and local government on improving sanitation facilities with technology choices that can be managed by the community itself.
• Technology choice for SANIMAS based on:
low cost efficiency simple operation & maintanance limit of energy appropriate technology
COMMUNITY BASED SANITATION PROGRAM (SANIMAS)

18
COMMUNAL SHALLOW
SEWERS FOR 100 FAMILIES
COMMUNAL BATH-WASH-TOILET Plus (with
biodigester)
2 models of URBAN COMMUNITY BASED SANITATION
19
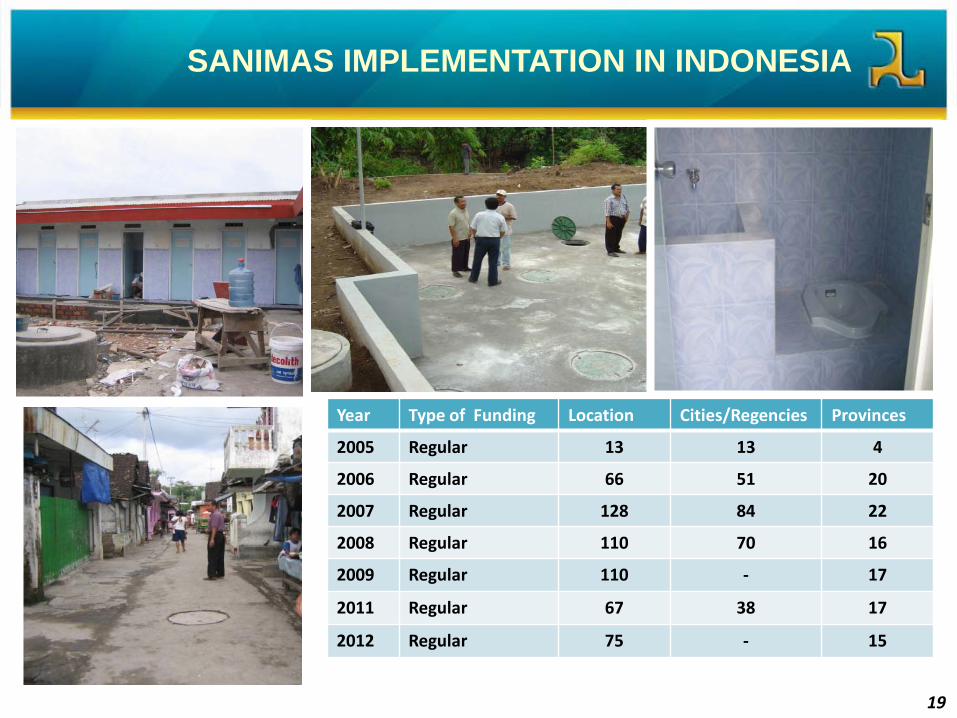
SANIMAS IMPLEMENTATION IN INDONESIA
Year Type of Funding Location Cities/Regencies Provinces
2005 Regular 13 13 4
2006 Regular 66 51 20
2007 Regular 128 84 22
2008 Regular 110 70 16
2009 Regular 110 - 17
2011 Regular 67 38 17
2012 Regular 75 - 15
20
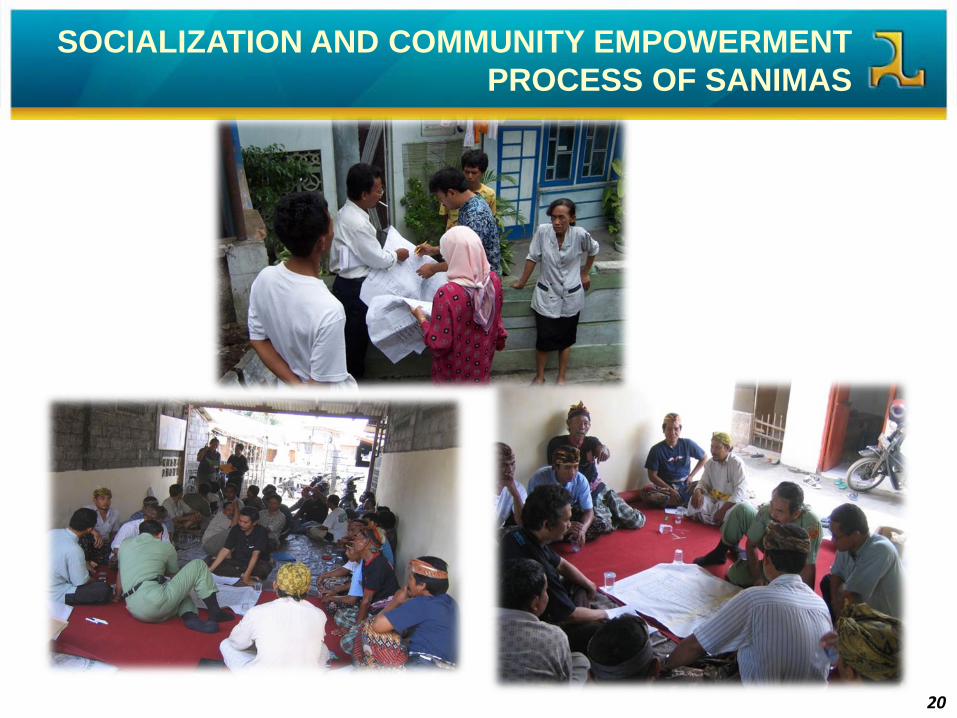
SOCIALIZATION AND COMMUNITY EMPOWERMENT PROCESS OF SANIMAS
21
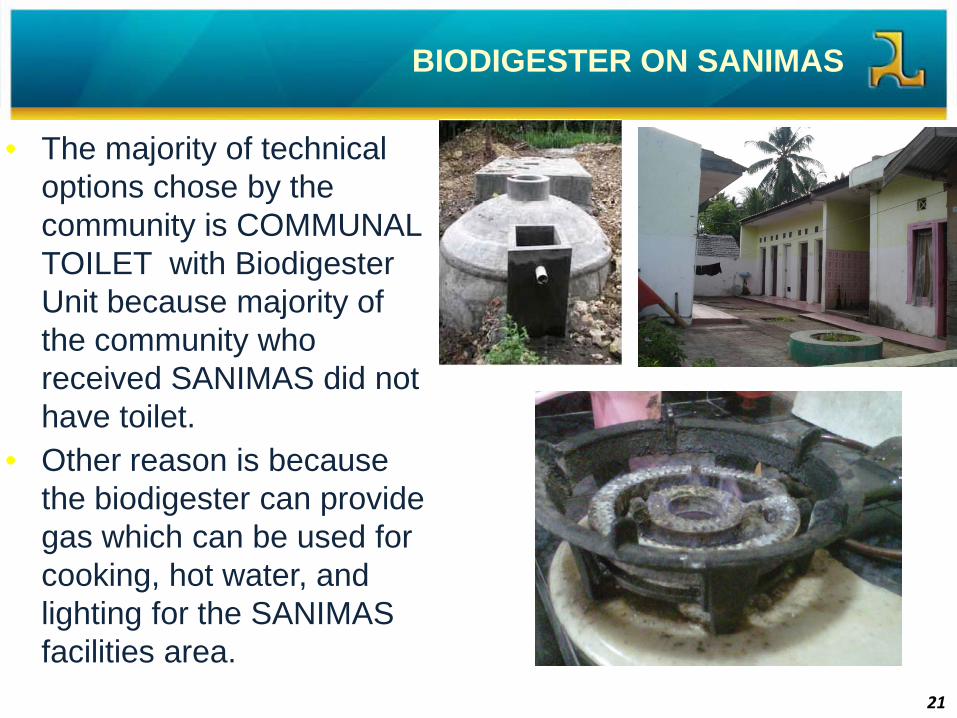
BIODIGESTER ON SANIMAS • The majority of technical
options chose by the community is COMMUNAL TOILET with Biodigester Unit because majority of the community who received SANIMAS did not have toilet.
• Other reason is because the biodigester can provide gas which can be used for cooking, hot water, and lighting for the SANIMAS facilities area.
22
Potential Reduction of CO2 with Biodigester Unit
• The potential reduction of CO2 with Biodigester Unit is as
follows: Number of Sanimas built until 2014 (estimated): 5000 locations Percentage of Biodigester unit implemented (estimated): 80% CO2 reduction until 2014: 0.000368 Gigatonnes CO2 equivalent
• For every biodigester unit (100 households = 500 people) With assumption:
BOD: 40 gram/person/day CH4: 0,024 kg/person/day = 8,76 kg/person/year CO2: 184 kg/person/year Reduction of CO2 per unit digester is: 62 ton CO2 equivalent/year

23
THANK YOU FOR THE ATTENTION