Embed Size (px)
Citation preview
Indonesia: The Emerging Secret?
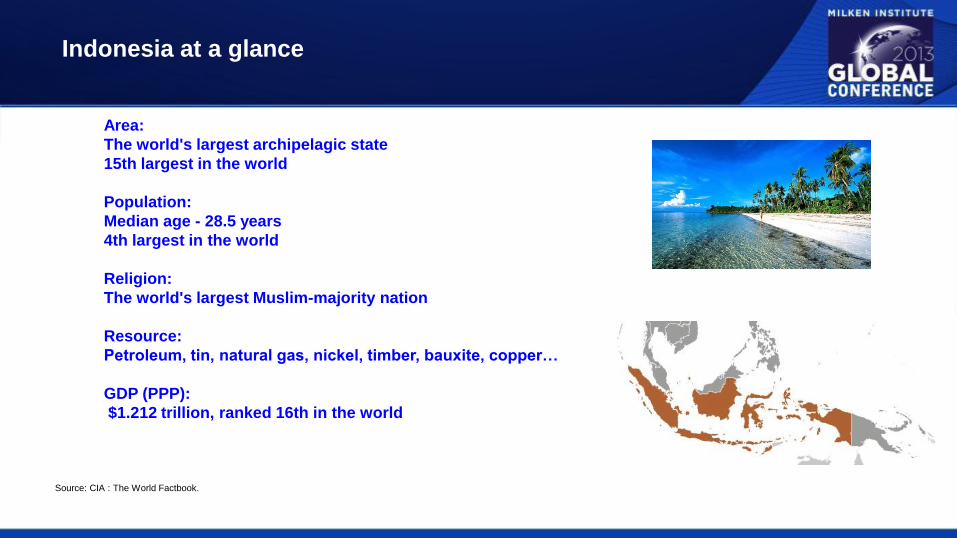
Indonesia at a glance
Source: CIA : The World Factbook.
Area:
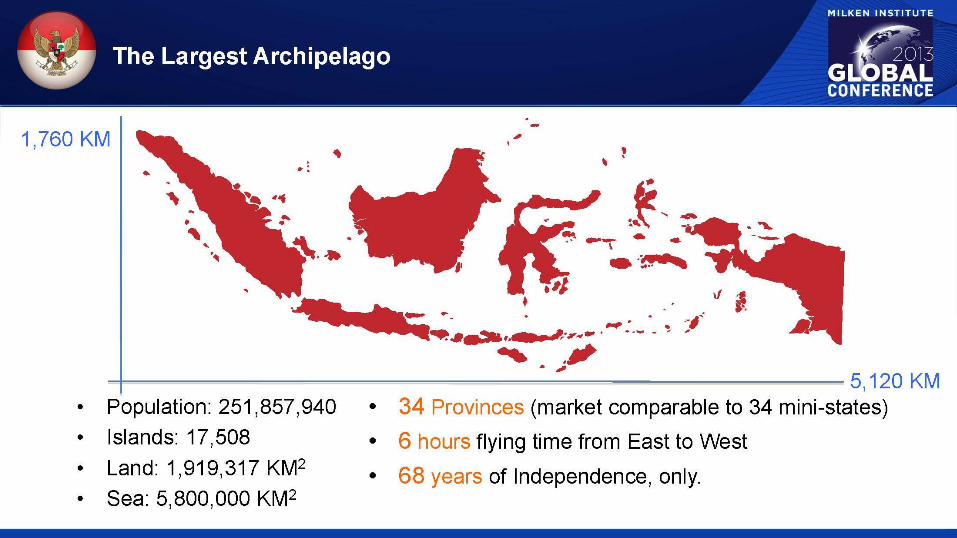
The world's largest archipelagic state
15th largest in the world
Population:
Median age - 28.5 years
4th largest in the world
Religion:
The world's largest Muslim-majority nation
Resource:
Petroleum, tin, natural gas, nickel, timber, bauxite, copper…
GDP (PPP):
$1.212 trillion, ranked 16th in the world
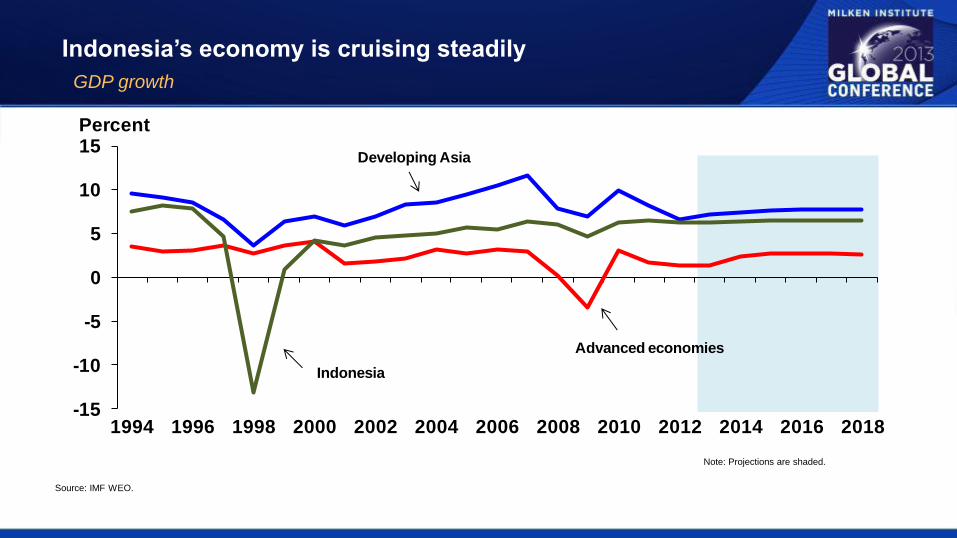
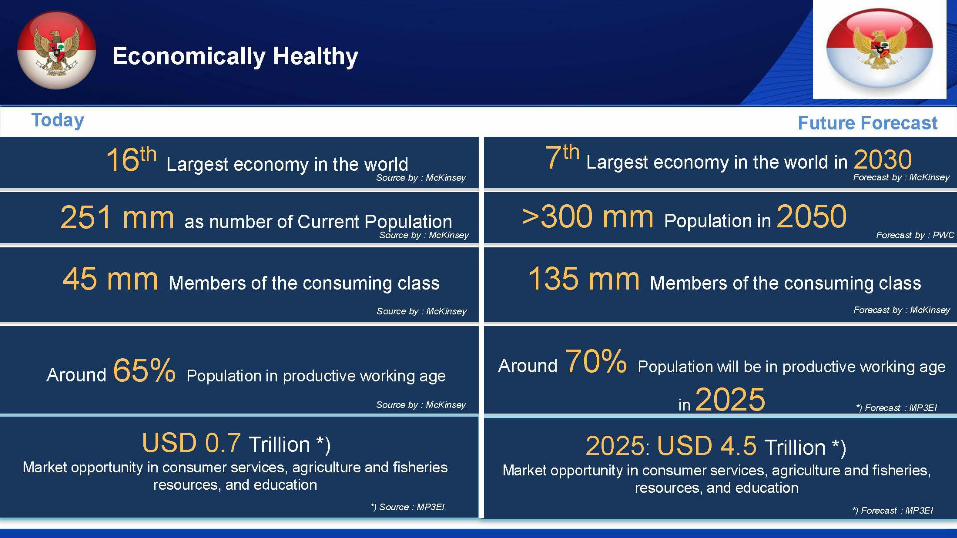
Indonesia’s economy is cruising steadily
GDP growth
Source: IMF WEO.
Note: Projections are shaded.
-15
-10
-5
0
5
10
15
1994 1996 1998 2000 2002 2004 2006 2008 2010 2012 2014 2016 2018
Percent
Developing Asia
Advanced economies
Indonesia
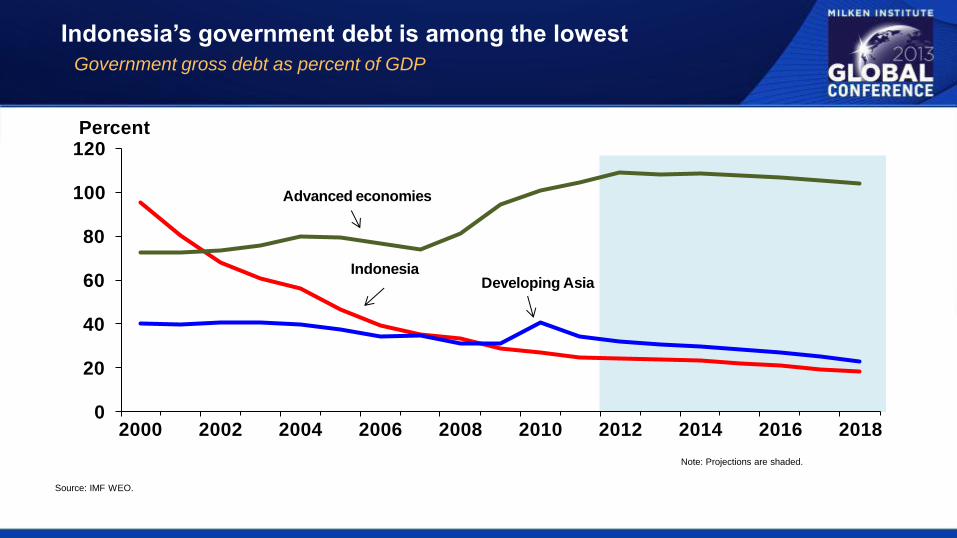
Indonesia’s government debt is among the lowest
Government gross debt as percent of GDP
Source: IMF WEO.
Note: Projections are shaded.
0
20
40
60
80
100
120
2000 2002 2004 2006 2008 2010 2012 2014 2016 2018
Percent
Advanced economies
Developing AsiaIndonesia
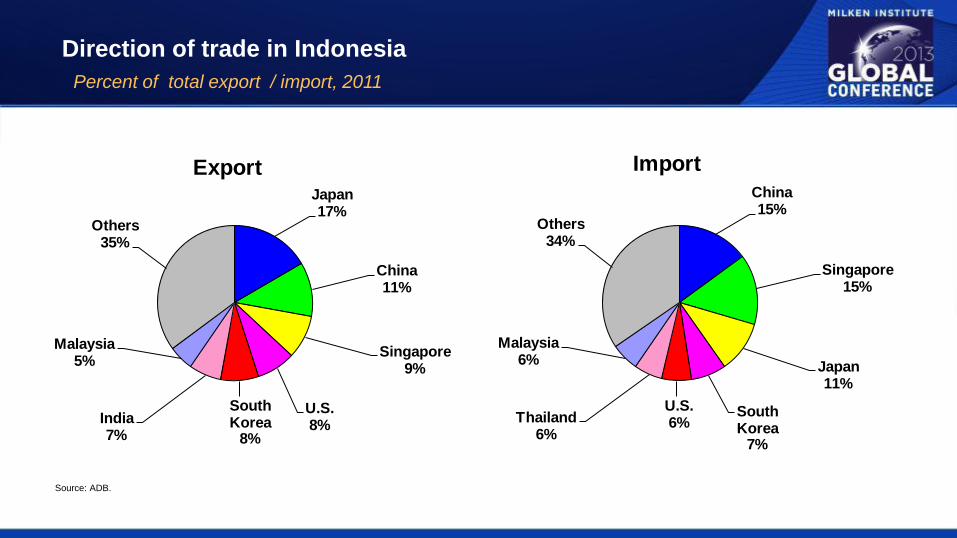
Direction of trade in Indonesia
Percent of total export / import, 2011
Source: ADB.
Japan17%
China11%
Singapore9%
U.S.8%
South Korea
8%
India7%
Malaysia5%
Others35%
ExportChina15%
Singapore15%
Japan11%
South Korea
7%
U.S.6%Thailand
6%
Malaysia6%
Others34%
Import
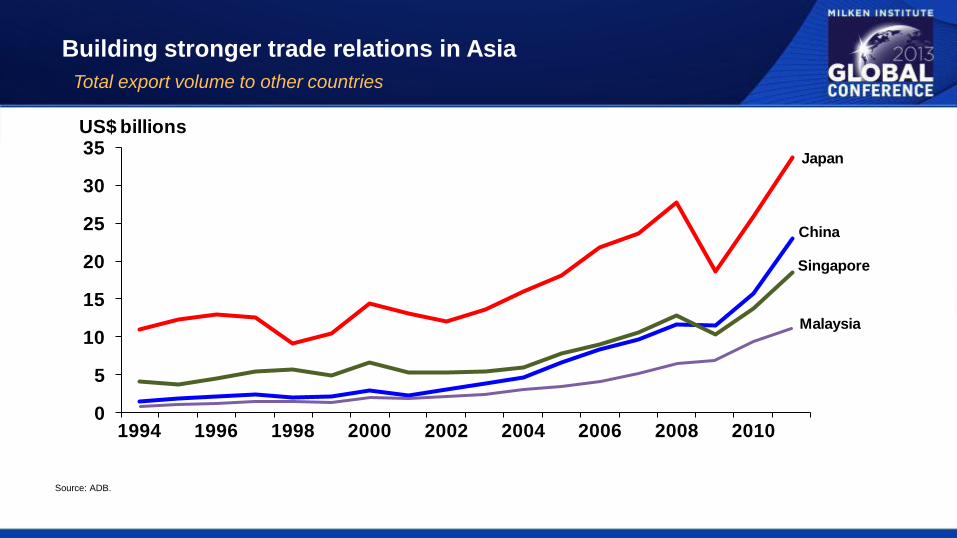
Building stronger trade relations in Asia
Total export volume to other countries
Source: ADB.
0
5
10
15
20
25
30
35
1994 1996 1998 2000 2002 2004 2006 2008 2010
US$ billions
Singapore
Malaysia
Japan
China
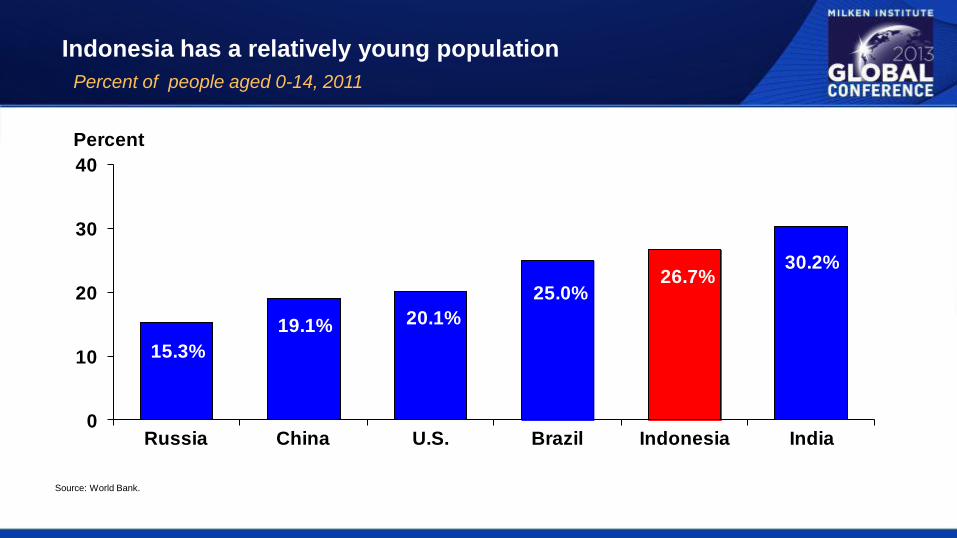
Indonesia has a relatively young population
Percent of people aged 0-14, 2011
Source: World Bank.
15.3%
19.1% 20.1%
25.0%26.7%
30.2%
0
10
20
30
40
Russia China U.S. Brazil Indonesia India
Percent
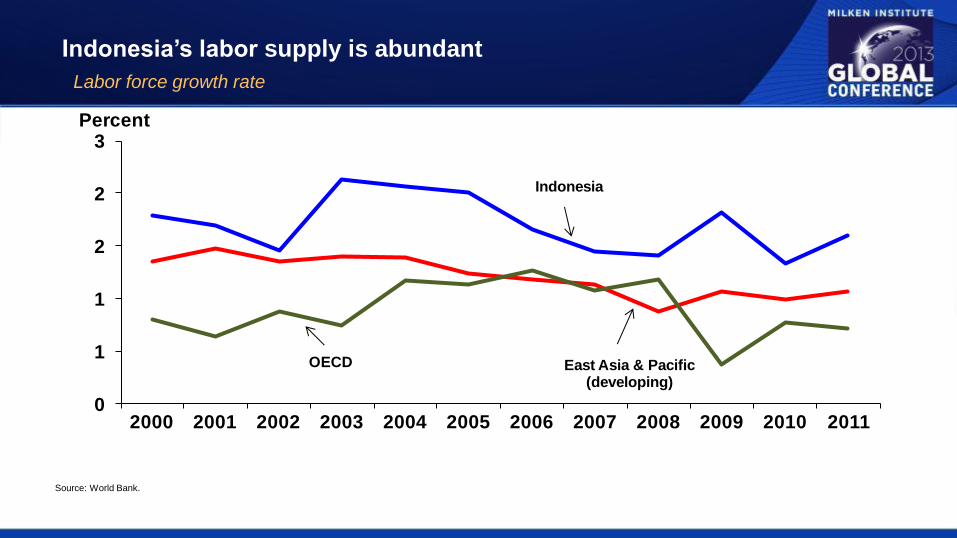
Indonesia’s labor supply is abundant
Labor force growth rate
Source: World Bank.
0
1
1
2
2
3
2000 2001 2002 2003 2004 2005 2006 2007 2008 2009 2010 2011
Percent
Indonesia
East Asia & Pacific (developing)
OECD
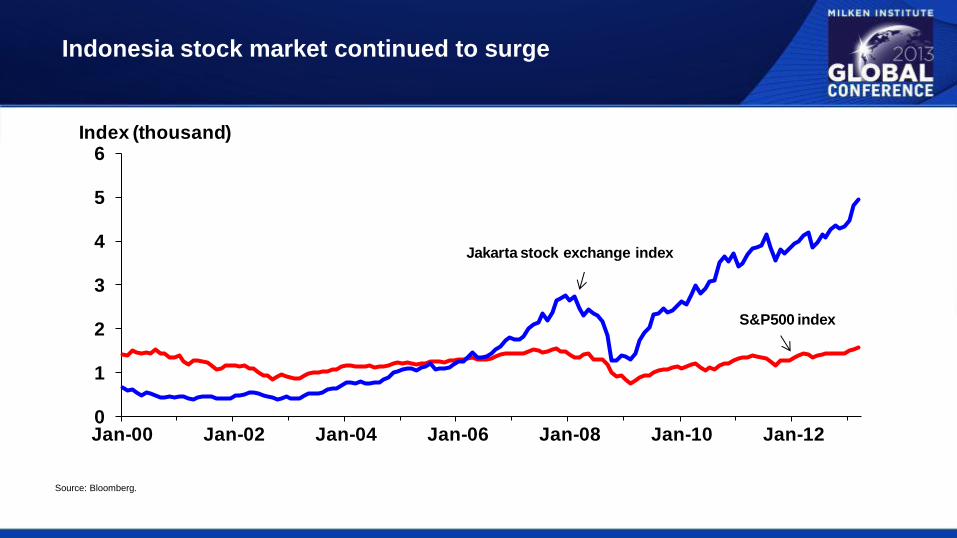
Indonesia stock market continued to surge
Source: Bloomberg.
0
1
2
3
4
5
6
Jan-00 Jan-02 Jan-04 Jan-06 Jan-08 Jan-10 Jan-12
Index (thousand)
Jakarta stock exchange index
S&P500 index
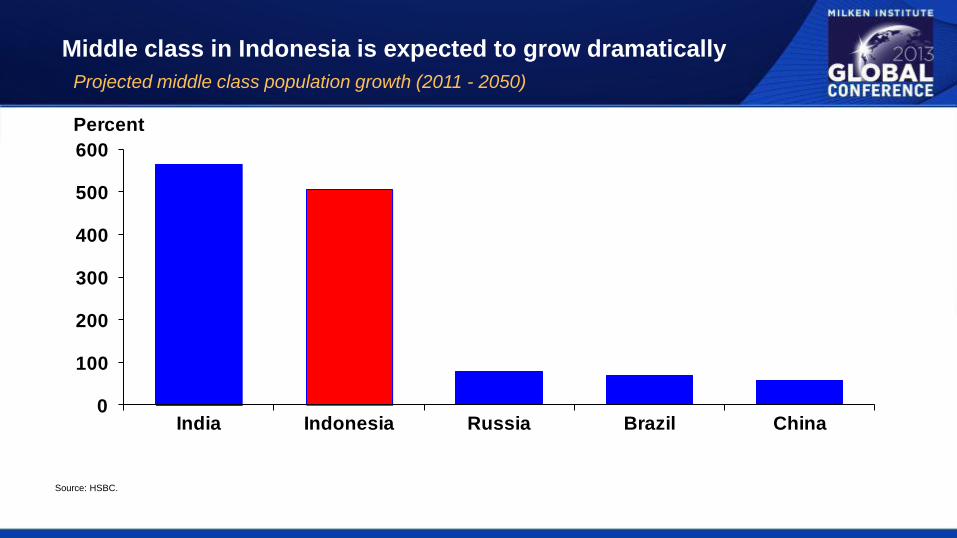
Middle class in Indonesia is expected to grow dramatically
Projected middle class population growth (2011 - 2050)
Source: HSBC.
0
100
200
300
400
500
600
India Indonesia Russia Brazil China
Percent
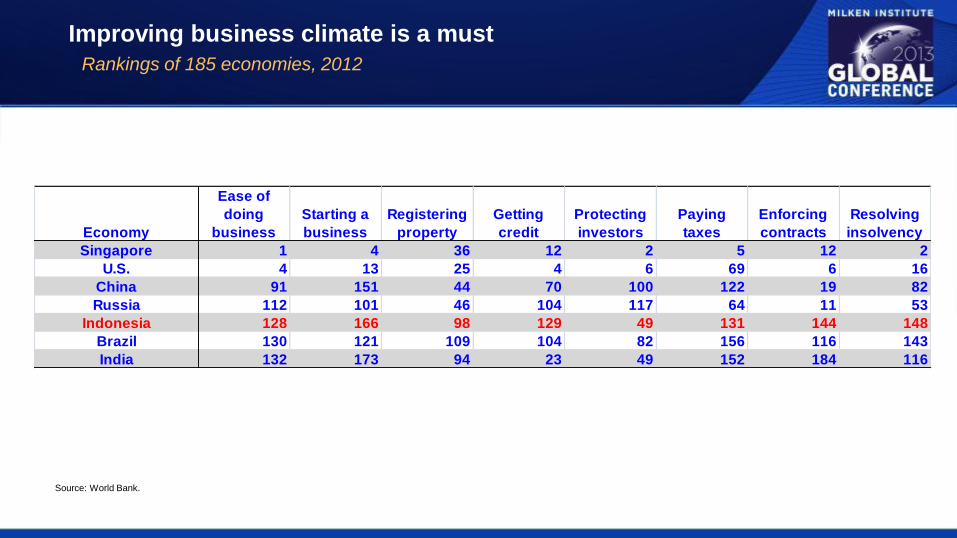
Improving business climate is a must
Rankings of 185 economies, 2012
Source: World Bank.
Economy
Ease of
doing
business
Starting a
business
Registering
property
Getting
credit
Protecting
investors
Paying
taxes
Enforcing
contracts
Resolving
insolvency
Singapore 1 4 36 12 2 5 12 2
U.S. 4 13 25 4 6 69 6 16
China 91 151 44 70 100 122 19 82
Russia 112 101 46 104 117 64 11 53
Indonesia 128 166 98 129 49 131 144 148
Brazil 130 121 109 104 82 156 116 143
India 132 173 94 23 49 152 184 116
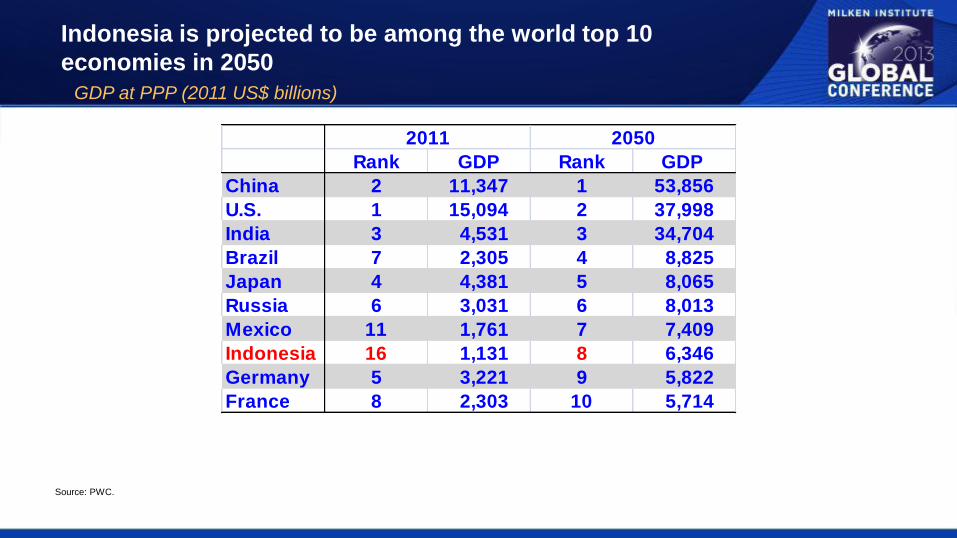
Indonesia is projected to be among the world top 10
economies in 2050
GDP at PPP (2011 US$ billions)
Source: PWC.
Rank GDP Rank GDP
China 2 11,347 1 53,856
U.S. 1 15,094 2 37,998
India 3 4,531 3 34,704
Brazil 7 2,305 4 8,825
Japan 4 4,381 5 8,065
Russia 6 3,031 6 8,013
Mexico 11 1,761 7 7,409
Indonesia 16 1,131 8 6,346
Germany 5 3,221 9 5,822
France 8 2,303 10 5,714
2011 2050

Slides from Luhut Pandjaitan
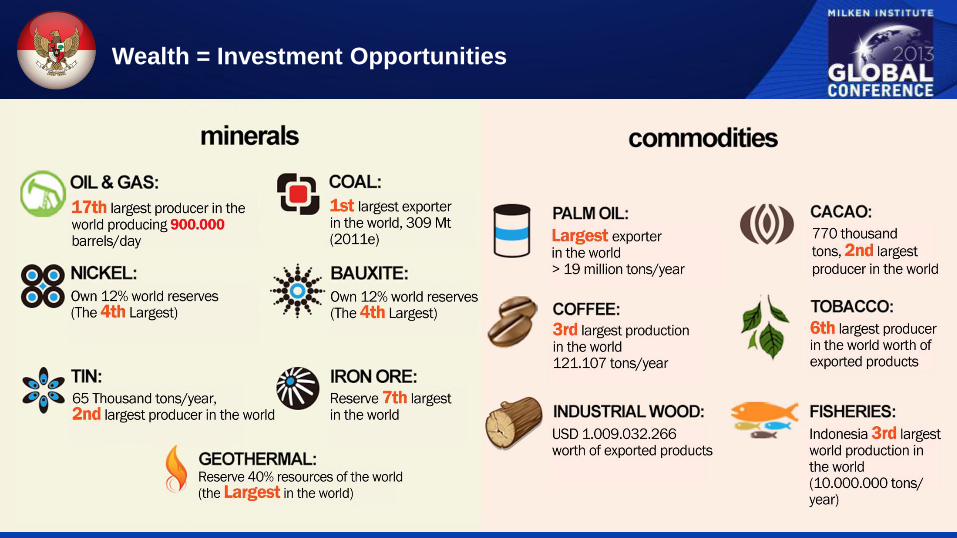
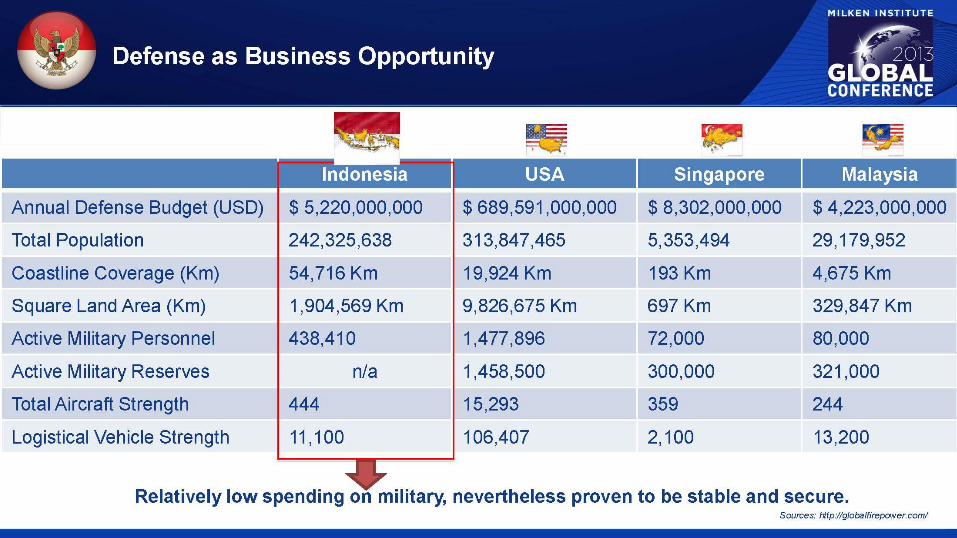
Wealth = Investment Opportunities
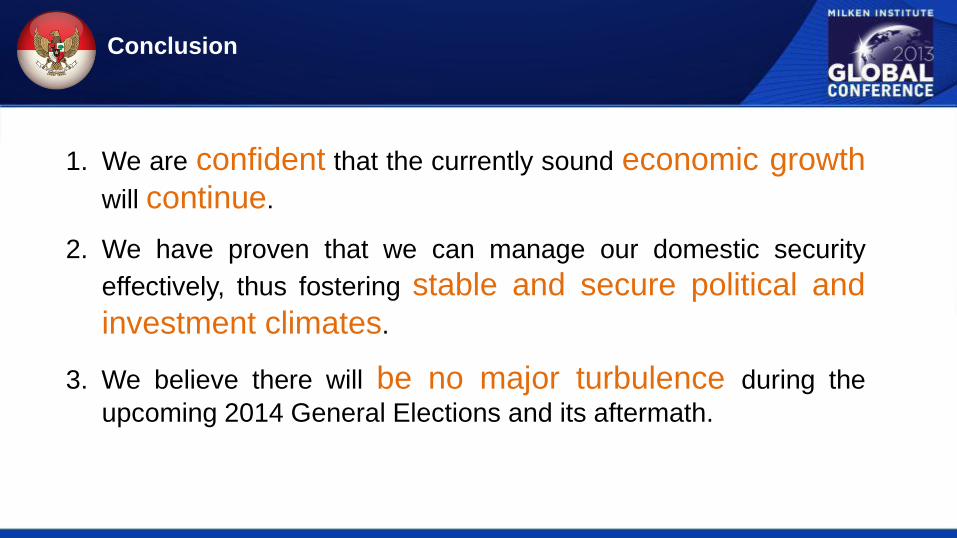
1. We are confident that the currently sound economic growth
will continue.
2. We have proven that we can manage our domestic security
effectively, thus fostering stable and secure political and
investment climates.
3. We believe there will be no major turbulence during the
upcoming 2014 General Elections and its aftermath.
Conclusion

Slides from Achmad Kurniadi
The Investment Coordinating Board of the Republic of Indonesia
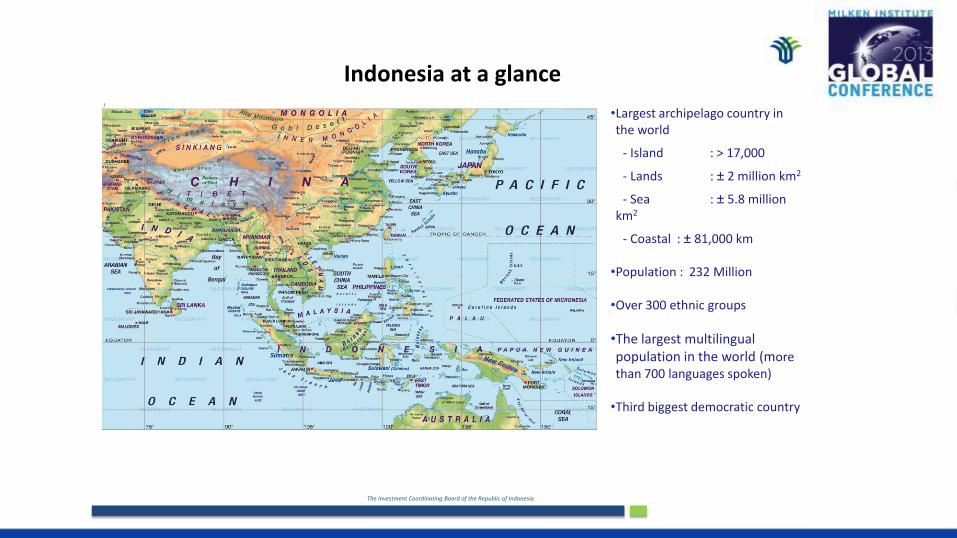
Indonesia at a glance
•Largest archipelago country in the world
- Island : > 17,000
- Lands : 2 million km2
- Sea : 5.8 million km2
- Coastal : 81,000 km
•Population : 232 Million
•Over 300 ethnic groups
•The largest multilingual population in the world (more than 700 languages spoken)
•Third biggest democratic country
The Investment Coordinating Board of the Republic of Indonesia
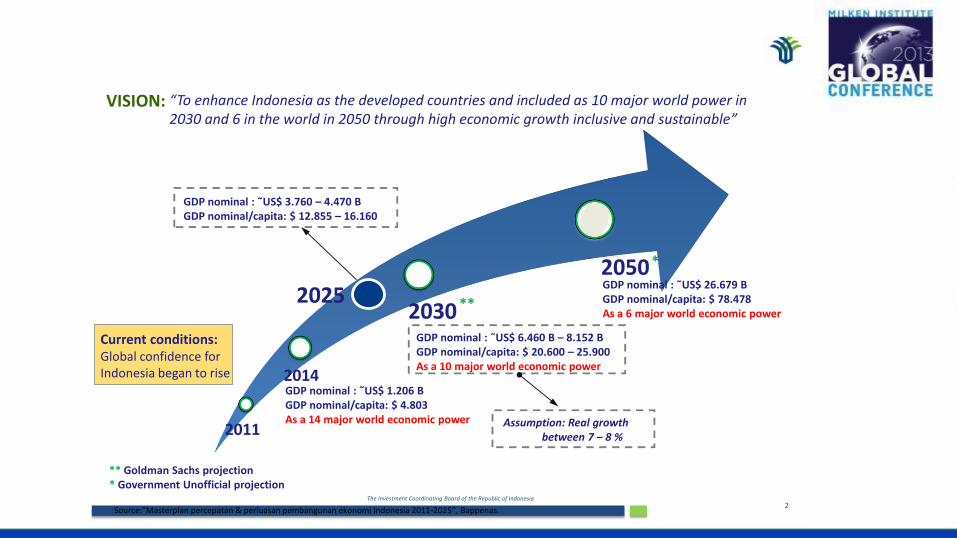
Current conditions:Global confidence for Indonesia began to rise 2014
GDP nominal : ˜US$ 6.460 B – 8.152 BGDP nominal/capita: $ 20.600 – 25.900As a 10 major world economic power
2030
2011
GDP nominal : ˜US$ 1.206 BGDP nominal/capita: $ 4.803As a 14 major world economic power
2025
Assumption: Real growth between 7 – 8 %
**
GDP nominal : ˜US$ 3.760 – 4.470 BGDP nominal/capita: $ 12.855 – 16.160
2050GDP nominal : ˜US$ 26.679 BGDP nominal/capita: $ 78.478As a 6 major world economic power
*
“To enhance Indonesia as the developed countries and included as 10 major world power in 2030 and 6 in the world in 2050 through high economic growth inclusive and sustainable”
VISION:
National Economic Growth Projection
** Goldman Sachs projection* Government Unofficial projection
Source:”Masterplan percepatan & perluasan pembangunan ekonomi Indonesia 2011-2025”, Bappenas. 2
The Investment Coordinating Board of the Republic of Indonesia
3
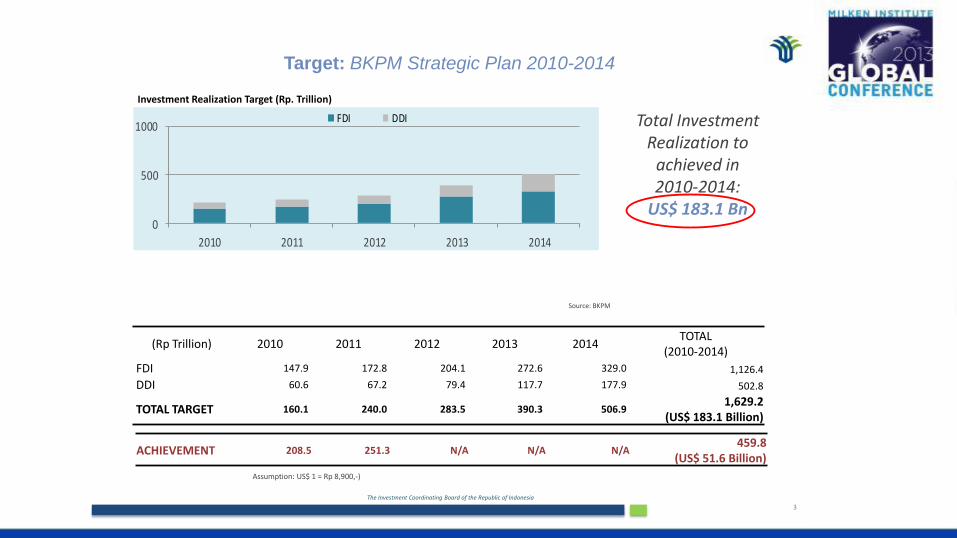
(Rp Trillion) 2010 2011 2012 2013 2014TOTAL
(2010-2014)
FDI 147.9 172.8 204.1 272.6 329.0 1,126.4
DDI 60.6 67.2 79.4 117.7 177.9 502.8
TOTAL TARGET 160.1 240.0 283.5 390.3 506.9 1,629.2
(US$ 183.1 Billion)
Assumption: US$ 1 = Rp 8,900,-)
Target: BKPM Strategic Plan 2010-2014
0
500
1000
2010 2011 2012 2013 2014
FDI DDI
Investment Realization Target (Rp. Trillion)
Total Investment Realization to
achieved in2010-2014:
US$ 183.1 Bn
Source: BKPM
ACHIEVEMENT 208.5 251.3 N/A N/A N/A459.8
(US$ 51.6 Billion)
The Investment Coordinating Board of the Republic of Indonesia
4
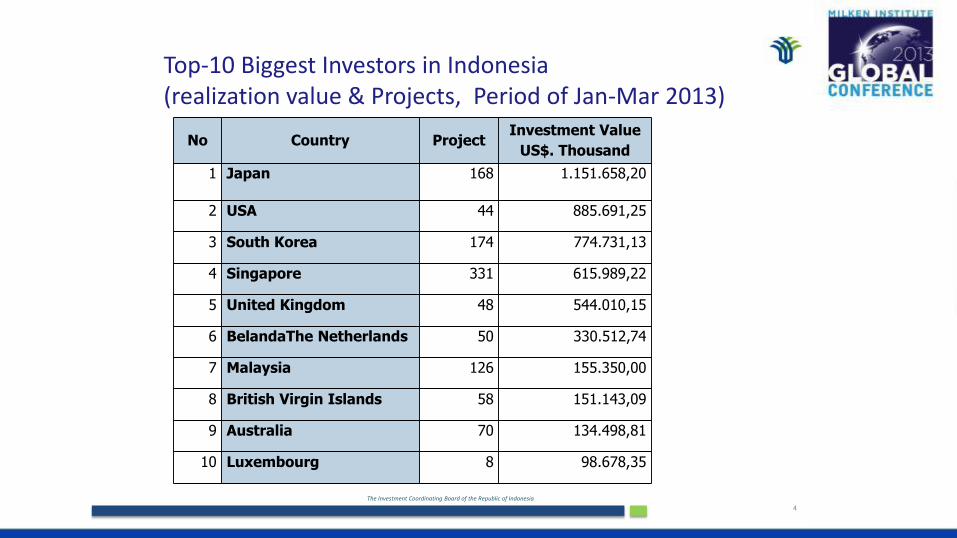
No Country ProjectInvestment Value
US$. Thousand
1 Japan 168 1.151.658,20
2 USA 44 885.691,25
3 South Korea 174 774.731,13
4 Singapore 331 615.989,22
5 United Kingdom 48 544.010,15
6 BelandaThe Netherlands 50 330.512,74
7 Malaysia 126 155.350,00
8 British Virgin Islands 58 151.143,09
9 Australia 70 134.498,81
10 Luxembourg 8 98.678,35
Top-10 Biggest Investors in Indonesia (realization value & Projects, Period of Jan-Mar 2013)
The Investment Coordinating Board of the Republic of Indonesia
5
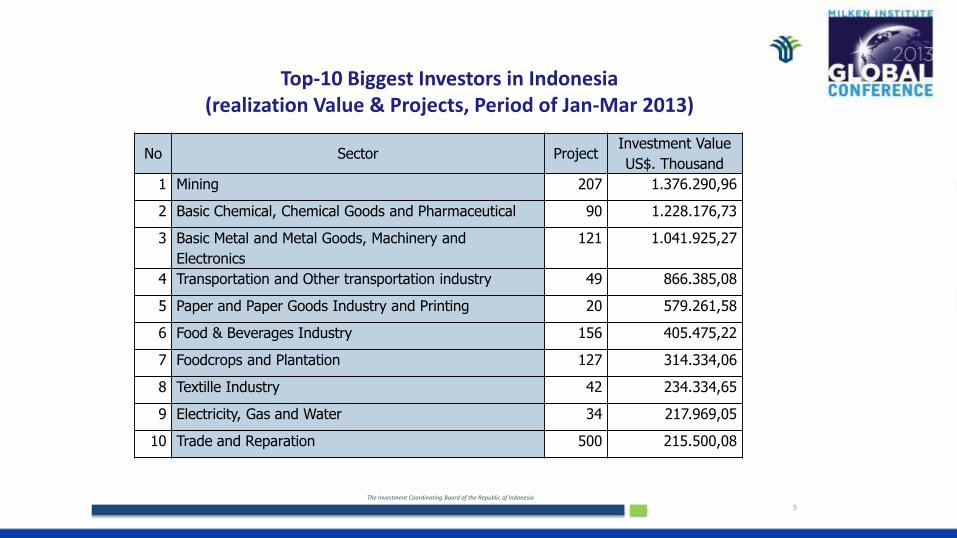
No Sector ProjectInvestment Value
US$. Thousand
1 Mining 207 1.376.290,96
2 Basic Chemical, Chemical Goods and Pharmaceutical 90 1.228.176,73
3 Basic Metal and Metal Goods, Machinery and
Electronics
121 1.041.925,27
4 Transportation and Other transportation industry 49 866.385,08
5 Paper and Paper Goods Industry and Printing 20 579.261,58
6 Food & Beverages Industry 156 405.475,22
7 Foodcrops and Plantation 127 314.334,06
8 Textille Industry 42 234.334,65
9 Electricity, Gas and Water 34 217.969,05
10 Trade and Reparation 500 215.500,08
Top-10 Biggest Investors in Indonesia (realization Value & Projects, Period of Jan-Mar 2013)
The Investment Coordinating Board of the Republic of Indonesia
6
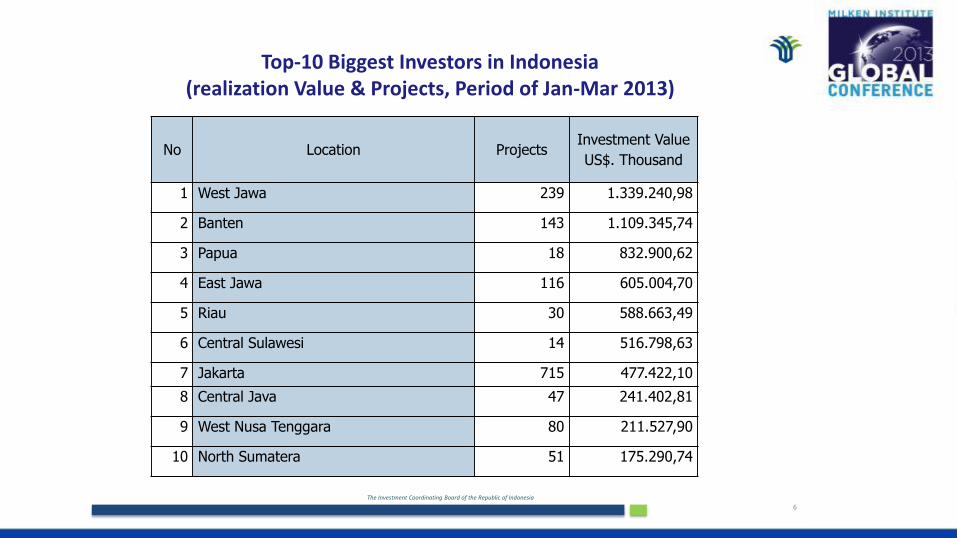
No Location ProjectsInvestment Value
US$. Thousand
1 West Jawa 239 1.339.240,98
2 Banten 143 1.109.345,74
3 Papua 18 832.900,62
4 East Jawa 116 605.004,70
5 Riau 30 588.663,49
6 Central Sulawesi 14 516.798,63
7 Jakarta 715 477.422,10
8 Central Java 47 241.402,81
9 West Nusa Tenggara 80 211.527,90
10 North Sumatera 51 175.290,74
Top-10 Biggest Investors in Indonesia (realization Value & Projects, Period of Jan-Mar 2013)
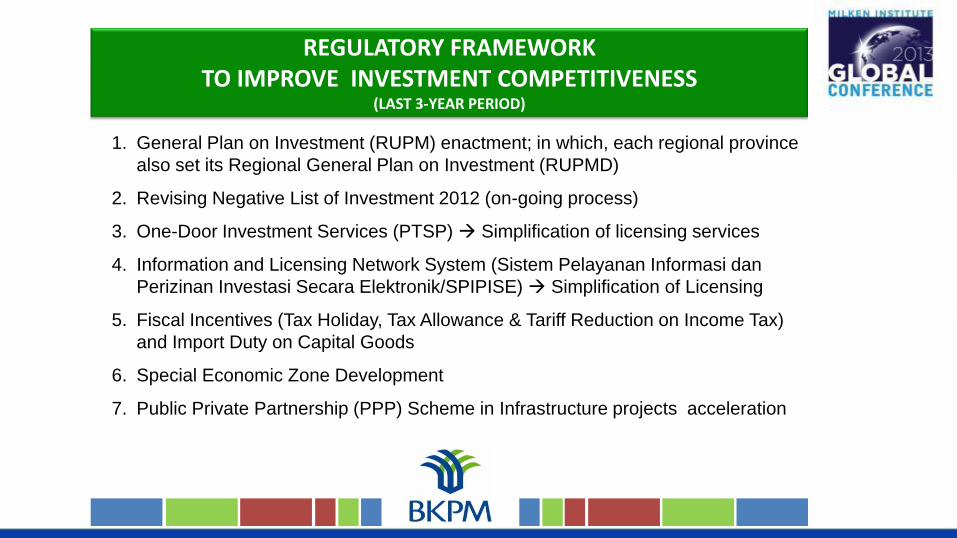
REGULATORY FRAMEWORKTO IMPROVE INVESTMENT COMPETITIVENESS
(LAST 3-YEAR PERIOD)
1. General Plan on Investment (RUPM) enactment; in which, each regional province
also set its Regional General Plan on Investment (RUPMD)
2. Revising Negative List of Investment 2012 (on-going process)
3. One-Door Investment Services (PTSP) Simplification of licensing services
4. Information and Licensing Network System (Sistem Pelayanan Informasi dan
Perizinan Investasi Secara Elektronik/SPIPISE) Simplification of Licensing
5. Fiscal Incentives (Tax Holiday, Tax Allowance & Tariff Reduction on Income Tax)
and Import Duty on Capital Goods
6. Special Economic Zone Development
7. Public Private Partnership (PPP) Scheme in Infrastructure projects acceleration
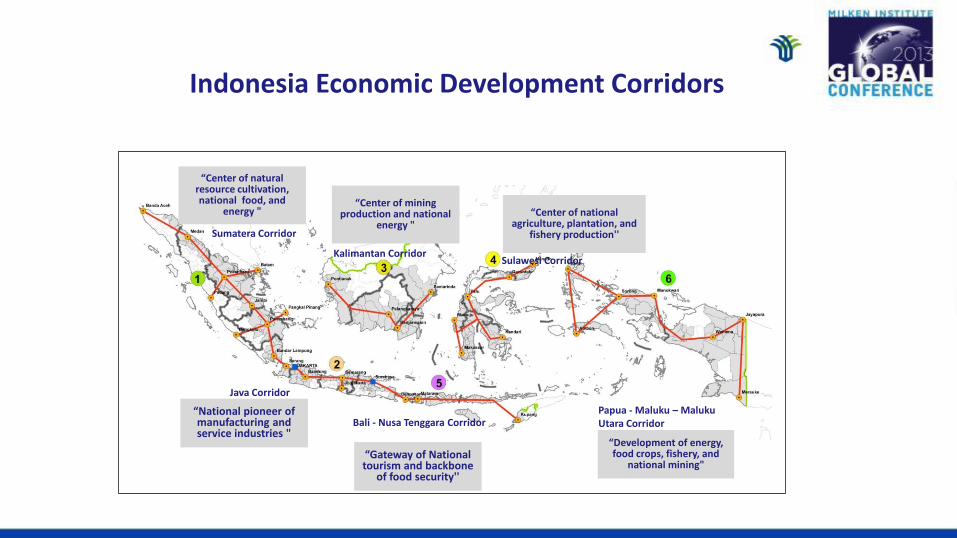
Indonesia Economic Development Corridors
“Center of mining production and national
energy "“Center of national
agriculture, plantation, and fishery production''Sumatera Corridor
Kalimantan CorridorSulawesi Corridor
“Gateway of National tourism and backbone
of food security''
“National pioneer of manufacturing and service industries "
“Development of energy, food crops, fishery, and
national mining"
Java Corridor
Bali - Nusa Tenggara CorridorPapua - Maluku – Maluku Utara Corridor
“Center of natural resource cultivation, national food, and
energy "
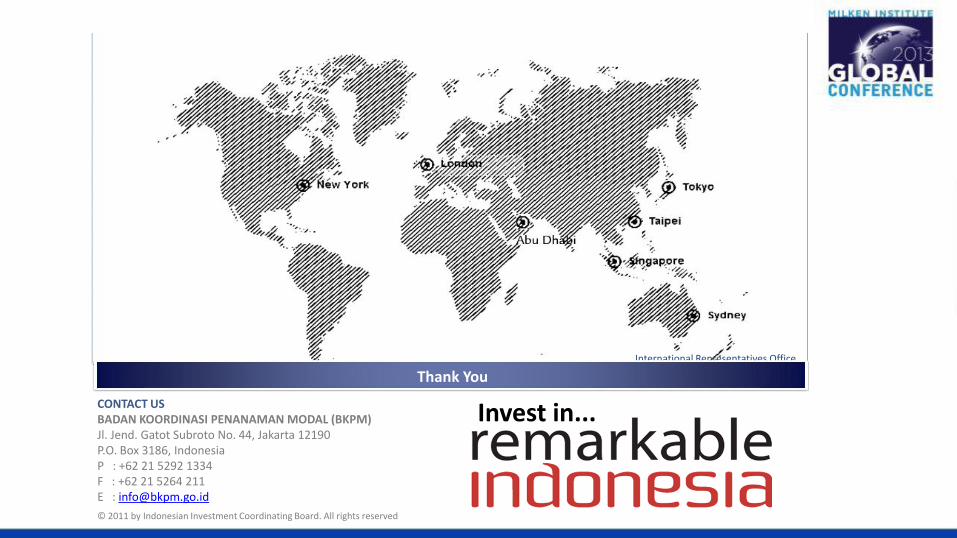
Invest in...
© 2011 by Indonesian Investment Coordinating Board. All rights reserved
CONTACT USBADAN KOORDINASI PENANAMAN MODAL (BKPM)Jl. Jend. Gatot Subroto No. 44, Jakarta 12190P.O. Box 3186, IndonesiaP : +62 21 5292 1334F : +62 21 5264 211E : [email protected]
International Representatives Office
Thank You