Embed Size (px)
Citation preview

- HERMAWAN KARTAJAYA -TAufiK
MElATi AsTRi MAHARANi - lEviNA YuliANTiPRiYANKA sHEKHAWAT
INDONESIA:STILL A FRIENDLY PLACE FOR
JAPANESE BRANDS?

AbouT MARKPlus, iNc.MarkPlus is the premiere and highly-focused marketing strategy consulting firm in Indonesia. it was established 24 years ago by Hermawan Kartajaya, co-author of five international marketing books with Prof. Philip Kotler, the father of Modern Marketing at the Kellogg school, Northwestern university. Today, MarkPlus ranks among the top consulting firms in indonesia. MarkPlus is able to provide a comprehensive service to its clients without the need to engage third-party vendors. MarkPlus consists of three main divisions; MarkPlus consulting, MarkPlus insight, and MarkPlus institute of Marketing, which aim to provide clients with solution, insight and Knowledge respectively. MarkPlus operates in 18 major cities and owns research network in 33 provinces in Indonesia. in 2004, MarkPlus established AsEAN operations in Kuala lumpur and singapore. Headquartered in Jakarta, indonesia, MarkPlus is strategically positioned to provide south East Asian companies with marketing expertise and breakthrough insights.

INDONESIA
More than a year ago, several financial analysts in the Western hemisphere put Indonesia in a group of countries dubbed as “fragile five (emerging countries)”. One of the reasons cited was Indonesia’s vulnerability towards external shock. Coupled with the uncertainty that usually exists in a country facing a political transition, in mid-2014, Indonesia recorded its lowest GDP growth rate in the last seven years.
Nevertheless, other investors, especially those based in Asia, still retain high confidence in the Archipelago’s growth potential. Japanese investors, in particular, are very keen in exploring business opportunities in the Indonesian market.
1
sTill A fRiENDlY PlAcEfoR JAPANESE bRANDs?
FIGURE 1. TOP CONSUMER ELECTRONICS BRANDS IN INDONESIA BASED ON
COUNTRy OF ORIGIN
PURCHASED( % )
ALL AWARENESS( % )
JAPAN
KOREA
INDONESIA
CHINA
ITALY
OTHERS
93.8
93.4
52.0
28.8
19.7
17.3
JAPAN
KOREA
INDONESIA
CHINA
ITALY
OTHERS
39.4
50.1
7.8
5.8
0.8
0.8
PURCHASED( % )
ALL AWARENESS( % )
JAPAN
KOREA
INDONESIA
CHINA
ITALY
OTHERS
96.4
91.5
60.8
10.6
15.8
17.0
JAPAN
KOREA
INDONESIA
CHINA
ITALY
OTHERS
58.7
31.9
9.7
0.9
0.6
0.3
PURCHASED( % )
ALL AWARENESS( % )
JAPAN
KOREA
INDONESIA
CHINA
HOLLAND
OTHERS
96.4
94.0
64.1
16.4
18.2
4.1
JAPAN
KOREA
INDONESIA
CHINA
HOLLAND
OTHERS
48.2
42.7
13.3
2.0
0.4
1.8
They even put Indonesia as their number one place to invest in the world, when asked to rank top investment destinations.
What makes Asian investors, especially Japanese, believe in Indonesia? One of the reasons is their long-standing presence in the country, which makes them more familiar with the Indonesian market, compared to competitors from other countries. Moreover, it’s not only Indonesia’s resiliency against various structural economic problems over a long period of time but also emergence of new strong competitors to their brands, which makes Japanese investors even more interested in exploring the market further.
Source: MarkPlus Consumer Study 2014, n=21,283

Nowadays, South Korean and even Chinese brands are gaining popularity in various industry categories, including the categories once dominated by Japanese brands. For instance, in consumer electronics (see figure 1), which until a decade ago was largely controlled by Japanese brands. Indonesian consumers have experienced a shift in preferences away from Japanese brands, and towards South Korean and Chinese brands. It is largely because of changing consumer perceptions about South Korean and Chinese brands, which offer not only more affordable prices but also more sophisticated, good quality products.
Even then, automotive is one industry category where Japanese brands have successfully built rock-solid fortresses, hindering penetration from competitors belonging to other countries. Japanese automotive brands, as shown in figure 2, continue to appeal to the Indonesian consumers as their preferred choice even though rivals from other regions
have improved product quality and launched competitively-priced models. The dominance of Japanese brands in automotive industry is a strong indication that Indonesian market remains a friendly place for Japanese brands.
Nevertheless, having both success and failure stories will not guarantee Japanese brands to return to their glorious day of the past. In addition to the emergence of new
players, Indonesian market itself is undergoing rapid transformation, where rivals from other countries have even built presence in areas unthinkable before. For instance, a South Korean bank has opened its branch in a small city like Salatiga in Central Java, which has a small Korean population and no high-profile South Korean business community. No Japanese bank has done anything similar, so far.
This phenomenon is taking place everywhere across the country, where South Korean companies are not the only ones making bold moves in areas which promise not so good returns over the short term. There is increasing effort from Chinese, Malaysian, Thai and even Indian companies to gather a deeper, more detailed understanding of the changing Indonesian market and explore the plenty of opportunities it offers.
2
FIGURE 2. TOP AUTOMOTIVE BRANDS IN INDONESIABASED ON COUNTRy OF ORIGIN
For the last three years, MarkPlus Insight has been consulted by both international research agencies and companies looking for more detailed information about the Indonesian market. They no longer seek only general information on the Indonesian market. Also, queries are not limited to country-level topics or high-growth, urban centers such as Greater Jakarta region. Clients are increasingly becoming
PURCHASED( % )
ALL AWARENESS( % )
JAPAN
KOREA
GERMANY
USA
OTHERS
100.0
18.7
69.2
25.2
3.1
JAPAN
KOREA
GERMANY
USA
OTHERS
95.9
3.6
3.0
1.4
0.3
PURCHASED( % )
ALL AWARENESS( % )
JAPAN
INDIA
ITALY
OTHERS
99.8345
5.0399
1.8204
2.36
JAPAN
INDIA
ITALY
OTHERS
99.08
0.90
0.45
0.41
Source: MarkPlus Consumer Study 2014, n=21,283

3
interested in exploring the market in other smaller, rapidly growing cities, at the same time, paying attention to understanding the changing dynamics of other regions with high growth potential.
This report is aimed to provide detailed information and updates about key changes in the Indonesian market, with respect to the growing middle class, emergence of youth women netizen (YWN) sub-cultures, new centers of economic growth across the archipelago, and the changing lifestyles of middle class consumers which spur growth in various industries. The report also presents a broad picture on the competitive situation in Indonesia, especially the entry of new and relatively lesser-known international brands. Last but not the least, the report contains updates about MarkPlus Consumer Survey 2014, based on the latest survey involving 21283 respondents in 18 cities across Indonesia.
Changes in Indonesia: from Asian Crisis 1998 to Global Financial Crisis 2008
Unlike South Korea or even Thailand which rose up rather fast after being hammered by the Asian crisis in 1998, Indonesia took a relatively longer path towards economic recovery; it was not until 2005 that GDP growth exceeded 5%, as shown in figure 3. Interestingly, Indonesia started to appear more prominently in the radar of global investors starting 2009, in the aftermath of the 2008 global financial crisis. This was due to the fact that post 2009, Indonesia was one of the very few countries which were able to record high economic growth rates at a time when almost all developed economies continued struggling with the crisis.
Why did the country take so long to recover? It was because Indonesia experienced a multidimensional crisis, not only economical but it also underwent a political crisis. Indonesia was even predicted to follow the fate of Yugoslavia or USSR, due to strong secessionist movements in various regions in order to capitalize on the departure of strong centralistic-style government.
FIGURE 3. INDONESIA GDP GROwTh FROM 2004 - 2013
Source: Worldbank
Figure 4 Indonesia GDP Growth from 1990 - 2014
1161 1273 1601
1871 2178 2272
2947
3470 3551 3475
5
5.7 5.5
6.3 6
4.6
6.2 6.5
6.3
5.8
0
1
2
3
4
5
6
7
8
0
1000
2000
3000
4000
5000
6000
7000
2004 2005 2006 2007 2008 2009 2010 2011 2012 2013
GDP per capita at current price (USD) GDP growth rate (%)
4
After successfully conducting a free and fair general election in 1999 again – the first since 1955 –Indonesia gradually managed to prove that all doomsday predictions about its future were wrong. The tsunami that caused heavy destruction in some areas in Western Indonesia at the end of 2004 even turned out to be a blessing in disguise for the country. The tragedy helped encourage a peaceful resolution in Aceh province, hardest-hit by the tsunami and long marked by the bloodshed from the wars between Indonesian military and the secessionist movement, by granting it a status of special autonomy region.
The central government’s strategy of dealing with secessionists even acts as a case study for other countries, especially the ones experiencing similar armed secessionist movements. The architects of the solution have been nominated as Nobel laureates. Nevertheless, the most important thing is that the province is still a part of Indonesia, a country foreseen to have immense growth potential, going forward.
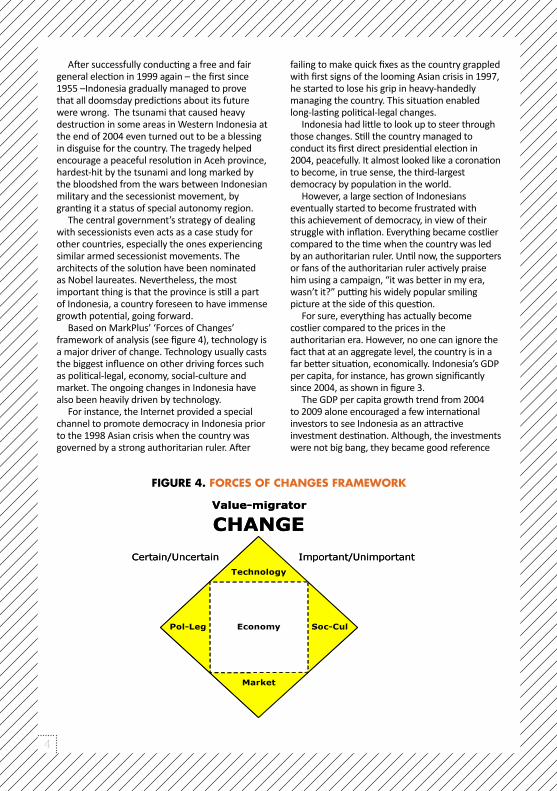
Based on MarkPlus’ ‘Forces of Changes’ framework of analysis (see figure 4), technology is a major driver of change. Technology usually casts the biggest influence on other driving forces such as political-legal, economy, social-culture and market. The ongoing changes in Indonesia have also been heavily driven by technology.
For instance, the Internet provided a special channel to promote democracy in Indonesia prior to the 1998 Asian crisis when the country was governed by a strong authoritarian ruler. After
failing to make quick fixes as the country grappled with first signs of the looming Asian crisis in 1997, he started to lose his grip in heavy-handedly managing the country. This situation enabled long-lasting political-legal changes.
Indonesia had little to look up to steer through those changes. Still the country managed to conduct its first direct presidential election in 2004, peacefully. It almost looked like a coronation to become, in true sense, the third-largest democracy by population in the world.
However, a large section of Indonesians eventually started to become frustrated with this achievement of democracy, in view of their struggle with inflation. Everything became costlier compared to the time when the country was led by an authoritarian ruler. Until now, the supporters or fans of the authoritarian ruler actively praise him using a campaign, “it was better in my era, wasn’t it?” putting his widely popular smiling picture at the side of this question.
For sure, everything has actually become costlier compared to the prices in the authoritarian era. However, no one can ignore the fact that at an aggregate level, the country is in a far better situation, economically. Indonesia’s GDP per capita, for instance, has grown significantly since 2004, as shown in figure 3.
The GDP per capita growth trend from 2004 to 2009 alone encouraged a few international investors to see Indonesia as an attractive investment destination. Although, the investments were not big bang, they became good reference
FIGURE 4. FORCES OF ChANGES FRAMEwORk
5
points for other investors, as Indonesia was increasingly being looked at with far greater interest by potential global investors. The race to invest in Indonesia picked up more aggressively starting 2010, as the country’s GDP per capita at nominal level almost touched the USD3000-level.
Rising Middle Class in Indonesia
Since then, the GDP per capita growth beyond USD3000, although little noted before, has now become a turbo jet accelerator for the Indonesian economy. After helping to put the country officially on the global investment radar, it has encouraged investors all over the world to explore potential opportunities available in the country. One of the biggest opportunities lies in Indonesia’s growing middle class.
Even though Indonesia’s middle class population started to grow significantly bigger during the last five years of the authoritarian era, the interest in capitalizing on the opportunities it offered could be considered small at that time. Nevertheless, Indonesia, by then, was already put in the investment grade territory by top global rating agencies. The country had also been dubbed as one of the ‘Next Newly Industrialized’ countries.
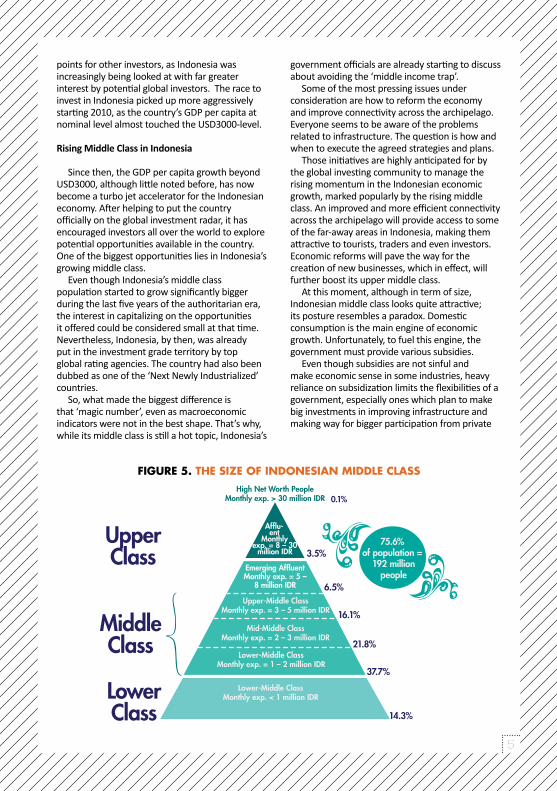
So, what made the biggest difference is that ‘magic number’, even as macroeconomic indicators were not in the best shape. That’s why, while its middle class is still a hot topic, Indonesia’s
FIGURE 5. ThE SIZE OF INDONESIAN MIDDLE CLASS
government officials are already starting to discuss about avoiding the ‘middle income trap’.
Some of the most pressing issues under consideration are how to reform the economy and improve connectivity across the archipelago. Everyone seems to be aware of the problems related to infrastructure. The question is how and when to execute the agreed strategies and plans.
Those initiatives are highly anticipated for by the global investing community to manage the rising momentum in the Indonesian economic growth, marked popularly by the rising middle class. An improved and more efficient connectivity across the archipelago will provide access to some of the far-away areas in Indonesia, making them attractive to tourists, traders and even investors. Economic reforms will pave the way for the creation of new businesses, which in effect, will further boost its upper middle class.
At this moment, although in term of size, Indonesian middle class looks quite attractive; its posture resembles a paradox. Domestic consumption is the main engine of economic growth. Unfortunately, to fuel this engine, the government must provide various subsidies.
Even though subsidies are not sinful and make economic sense in some industries, heavy reliance on subsidization limits the flexibilities of a government, especially ones which plan to make big investments in improving infrastructure and making way for bigger participation from private
High Net Worth PeopleMonthly exp. > 30 million IDR
Upper-Middle ClassMonthly exp. = 3 – 5 million IDR
Mid-Middle ClassMonthly exp. = 2 – 3 million IDR
Lower-Middle ClassMonthly exp. = 1 – 2 million IDR
Lower-Middle ClassMonthly exp. < 1 million IDR
Emerging Af�uentMonthly exp. = 5 –
8 million IDR
Af�u-ent
Monthly exp. = 8 – 30
million IDR
MiddleClass
UpperClass
LowerClass
75.6% of population =
192 millionpeople
0.1%
3.5%
6.5%
16.1%
21.8%
37.7%
14.3%
6
investment in the economy. In order to relieve some of the government’s burden of subsidies, Indonesian middle class must play an active role in triggering reduction of government subsidies. As they have been instrumental in the peaceful political transition in Indonesia, middle class should be able to do so in economic reforms as well.
It may not be easy however as the current structure of Indonesian middle class, as shown in figure 5, is dominated by the lower middle class, which barely fulfils the minimum requirement and is able to spend USD2 per day. In developed countries, this value of money may be equivalent to a one-way ticket for train or subway - a popular and affordable mode of public transport. In many areas in the developing countries, that value of money can be sufficient to buy staple foods and some portion of it can also be accumulated on monthly basis to create savings.
Businesses aiming to leverage on the large size of the lower middle class are also watchful of its limited buying power. They usually make products affordable or attractive to this segment by means of smaller product packages or small denominations. Even then, they are able to make big profits.
For instance, BRI, an Indonesian state-owned bank which is also known as a pioneer for offering banking services to people in the lower middle class, with loan values starting from IDR 25,000
– less than USD 2.5. Since 2000, BRI has been named as the largest and the most profitable microfinance institution in the world. This has also encouraged other banks to find fortune at the bottom of the pyramid. One of them is BTPN, an Indonesian bank partly owned by a big Japanese bank, SMBC.
Banking is not the only industry that can benefit from the lower middle class segment. Big or small companies from other industries, such as FMCG, retail, and telecommunication, can also make sizeable profits by doing business with the lower middle class in Indonesia. Even then, BRI continues to be known as the most successful industry player to leverage on the potential of the country’s lower middle class.
Lately, BRI is aiming to limit reliance on its old but hard-to-copy business model and also starting to use technology to widen its banking services. Small traders in the wet market and farmers in rural areas can also do banking from their locations as the bank will send staff equipped with mobile EDC or simple mobile banking gadgets. This is also proof of how lower middle class segment not only boosts profits but also encourages technology-based service innovation for businesses.
As lower middle class continues to prove itself as an attractive segment, many investors think that higher segments of Indonesian middle class
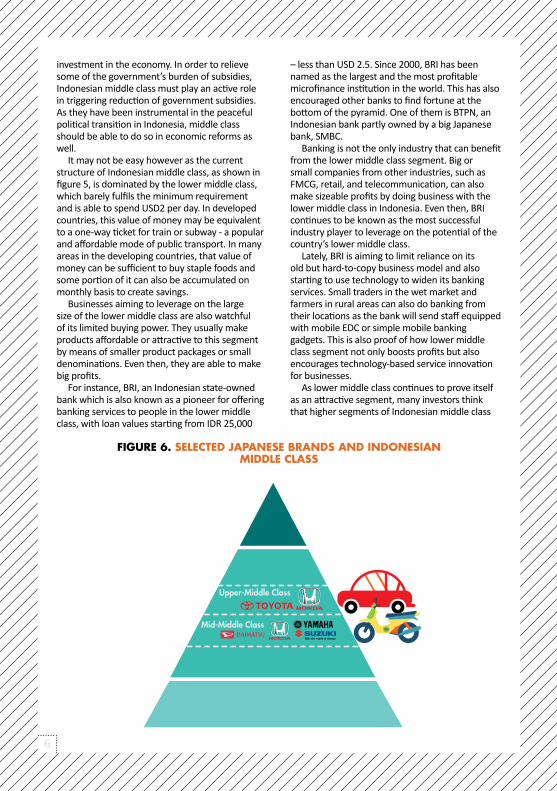
FIGURE 6. SELECTED JAPANESE BRANDS AND INDONESIAN MIDDLE CLASS
Upper-Middle Class
Mid-Middle Class

7
should also be more attractive. So far, that does not look like a myth but a fact. Companies doing business with higher segments of middle class are making bold moves and big investments as shown by capital expenditure in industries from airlines to hotels, motorcycles to cars, convention centers, toll road and airport industries.
Companies investing heavily to benefit from growing higher segments of Indonesian middle class are not only the ones with long standing presence in Indonesia. New foreign players from China or India are also making inroads into the Indonesian market. Further, businesses dealing with higher segments of Indonesian middle class have contributed significantly to put private investment as the second engine of the country’s economic growth. This phenomenon provides a good indication that the Indonesian middle class, long pampered by the government through various subsidies, is now ready to take a role in economic reform and can help avoid the ‘middle income trap’.
What are the positions of Japanese brands in the Indonesian market catering to the middle class? For lower middle class, in general, we do not see a Japanese brand in the top-three positions in all industry categories. For higher middle class segments, Japanese brands such Toyota, Honda, Daihatsu, Suzuki, Yamaha, Bridgestone, GS Yuasa are still preferred brands, as shown in figure 6.
Another Japanese brand, 7-Eleven, is gaining
FIGURE 7. BASIC MONThLy SPENDING IN 17 PROVINCES OF INDONESIA
popularity in line with the increasing purchasing power of the Indonesian middle class. 7-Eleven has successfully repositioned in Indonesia as a hangout place and is also seen as a benchmark for convenience store businesses in Indonesia. The brand is particularly popular among higher segments of Indonesian middle class.
Indonesian Middle Class: Stories across the Country
The growth of the Indonesian middle class is not limited to the Greater Jakarta region but a nation-wide phenomenon. With higher incomes, middle class families across Indonesia are willing to spend more for eat-outs or buying fashion apparels (see figure 8 and 9). They are also willing to travel to other cities for what is generally referred to as culinary travelling in Indonesia trips planned to try popular cuisines or newly created foods and beverage from other cities.
The emergence of low cost carriers (LCCs), either local or foreign brands, has enabled middle class consumers to venture out of town, travelling to even the far away cities in Indonesia more frequently. Some of them also take overseas trips frequently, including to Japan, for leisure, mostly using budget carriers.
The push in local tourism in view of changing habits and behaviors of the Indonesian middle class has encouraged investors to build new hotels, from 2-star to 5-star, across the country.

8
The availability of natural or man-made tourist attractions is no longer a major consideration for investors building accommodations. Simply having a unique traditional or new variety of cuisines, which attract many visitors, would encourage investors to build new hotels in a city.
The LCCs and hotel investors are not the only ones that can grow business with the growing Indonesian middle class. Land transportation business, either intra and intercity, has grown in many cities of Indonesia, as indicated by entry of new players or increasing fleets of existing players. More and more people in the Indonesian middle class segment are now willing to pay a higher price for land transportation.
These new habits and behaviors of Indonesian middle class materialize into business opportunities for not only industry sectors that directly support those new habits and behaviors but also relevant industries. For example, middle class consumers can travel either by relying on comfortable inter-city land transportation providers or their own vehicles.
Rising middle class income has also pushed demand in the automotive sector. It has been three years since the Indonesian new car market crossed the one million per year threshold. This has encouraged global automotive brands to build new manufacturing facilities in Indonesia, allowing them to meet growing demand in the future. Vehicle distributors are also willing to significantly increase their dealer outlets and workshop networks across the country to facilitate expansion by carmakers.
FIGURE 8. SPENDING ALLOCATION IN 17 CITIES OF INDONESIA
Education business, in the past considered as a taboo phrase, is now being viewed as an acceptable reality. From main cities to small cities across the country, demand for premium education institutions has grown significantly for all segments from, toddlers to youngsters seeking higher education, including the ones with international network. However, some observers view the growth phenomenon in this sector cautiously, as the higher segments of Indonesian middle class tend to have a small family.
In some cities, the growth of population in the higher segments of middle class is turning out to be very slow. This has, in turn, affected classroom utilization, as number of pupils grows at a relatively flat rate or even witness a decline. In wake of this trend, some of the affected schools are trying to position themselves as institutions with better teacher per student ratio.
Another sector also considered a taboo business in the past is hospital industry. Much like the phenomena in education business, the demand for premium hospitals, ranging from general to specific treatment hospitals, has grown significantly across the country (see figure 9). Hospitals owned by national or local governments have also built a premium service to allow them to compensate for the loss-making standard services.
Foreign hospital chains have made significant investments in the healthcare business in Indonesia. They have done so mostly through mergers and acquisitions. This way, they gain
Source: MarkPlus Consumer Study 2014, n=21,283
9
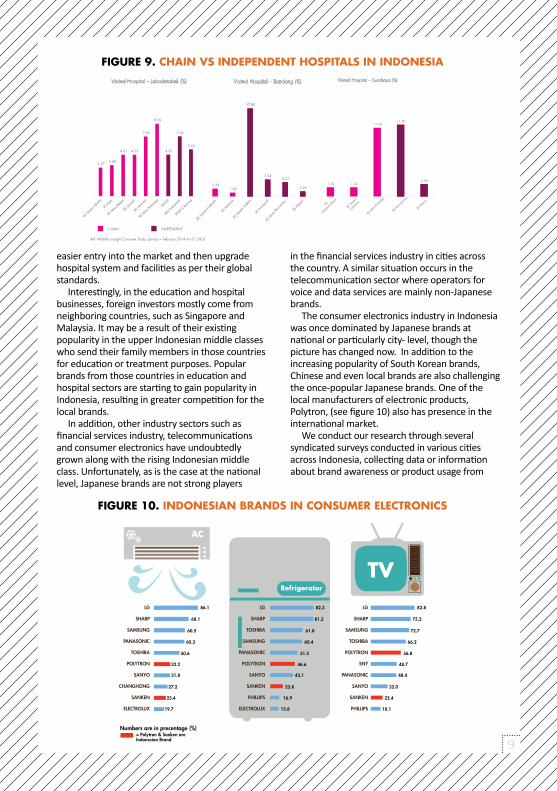
FIGURE 9. ChAIN VS INDEPENDENT hOSPITALS IN INDONESIA
FIGURE 10. INDONESIAN BRANDS IN CONSUMER ELECTRONICS
easier entry into the market and then upgrade hospital system and facilities as per their global standards.
Interestingly, in the education and hospital businesses, foreign investors mostly come from neighboring countries, such as Singapore and Malaysia. It may be a result of their existing popularity in the upper Indonesian middle classes who send their family members in those countries for education or treatment purposes. Popular brands from those countries in education and hospital sectors are starting to gain popularity in Indonesia, resulting in greater competition for the local brands.
In addition, other industry sectors such as financial services industry, telecommunications and consumer electronics have undoubtedly grown along with the rising Indonesian middle class. Unfortunately, as is the case at the national level, Japanese brands are not strong players
in the financial services industry in cities across the country. A similar situation occurs in the telecommunication sector where operators for voice and data services are mainly non-Japanese brands.
The consumer electronics industry in Indonesia was once dominated by Japanese brands at national or particularly city- level, though the picture has changed now. In addition to the increasing popularity of South Korean brands, Chinese and even local brands are also challenging the once-popular Japanese brands. One of the local manufacturers of electronic products, Polytron, (see figure 10) also has presence in the international market.
We conduct our research through several syndicated surveys conducted in various cities across Indonesia, collecting data or information about brand awareness or product usage from
Refrigerator
TV
AC
LG
SHARP
SAMSUNG
TOSHIBA
POLYTRON
SNY
PANASONIC
SANYO
SANKEN
PHILLIPS
LG
SHARP
TOSHIBA
SAMSUNG
PANASONIC
POLYTRON
SANYO
SANKEN
PHILLIPS
ELECTROLUX
82.8
75.2
72.7
66.2
56.8
48.7
48.4
32.0
22.4
18.1
82.3
81.2
61.8
60.4
51.5
46.6
43.1
23.8
16.9
15.8
LG
SHARP
SAMSUNG
PANASONIC
TOSHIBA
POLYTRON
SANYO
CHANGHONG
SANKEN
ELECTROLUX
86.1
68.1
60.5
60.3
50.6
32.2
31.8
27.2
23.4
19.7
MOST POPULAR CONSUMER ELECTRONIC PRODUCTS
Numbers are in precentage (%)= Polytron & Sanken areIndonesian Brand
1.50 1.50
11.00 11.50
2.00
RS
Muham
madiya
h
RS Si
loam
Surab
aya
RS M
itra Ke
luarga
RSI W
onok
romo
RS D
armo
Visited Hospital – Surabaya (%)
Ref: MarkPlus Insight Consumer Study, January – February 2014 (n=21,283)
3.37 3.68
4.91 4.91
7.06
8.59
4.91
7.06
5.52
3.39 1.69
37.85
7.34 6.21
2.26
Visited Hospital – Jabodetabek (%) Visited Hospital – Bandung (%)
CHAIN INDEPENDENT
10
respondents. Our survey includes about 1000 respondents each in 18 cities across Indonesia annually, from Banda Aceh (in the West-End of Indonesia), Medan, Padang, Pekanbaru, Palembang, Jakarta, Bandung, Semarang, Solo, Jogjakarta, Surabaya, Pontianak, Banjarmasin, Balikpapan, Manado (in the North-End of Indonesia), Makasar, Denpasar (in the South-End of Indonesia) and Jayapura (in the East-End of Indonesia). This year, we conducted a consumer study in 18 cities of Indonesia including 21,282 respondents, in addition to industry-based syndicated surveys.
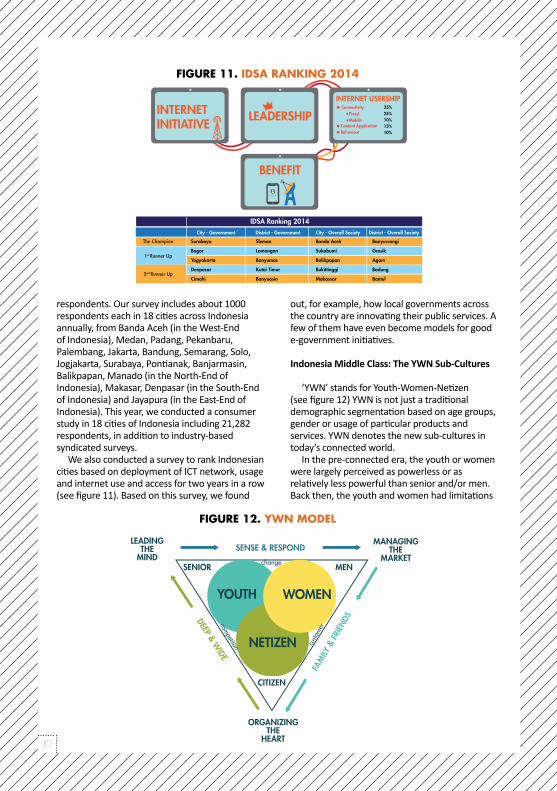
We also conducted a survey to rank Indonesian cities based on deployment of ICT network, usage and internet use and access for two years in a row (see figure 11). Based on this survey, we found
out, for example, how local governments across the country are innovating their public services. A few of them have even become models for good e-government initiatives.
Indonesia Middle Class: The YWN Sub-Cultures
‘YWN’ stands for Youth-Women-Netizen (see figure 12) YWN is not just a traditional demographic segmentation based on age groups, gender or usage of particular products and services. YWN denotes the new sub-cultures in today’s connected world.
In the pre-connected era, the youth or women were largely perceived as powerless or as relatively less powerful than senior and/or men. Back then, the youth and women had limitations
FIGURE 11. IDSA RANkING 2014
FIGURE 12. ywN MODEL
IDSA Ranking 2014City - Government District - Government City - Overall Society District - Overall Society
The Champion
1st Runner Up
2nd Runner Up
Surabaya
Bogor
Yogyakarta
Denpasar
Cimahi
Sleman
Lamongan
Banyumas
Kutai Timur
Banyuasin
Banda Aceh
Sukabumi
Balikpapan
Bukittinggi
Makassar
Banyuwangi
Gresik
Agam
Badung
Bantul
INTERNETINITIATIVE
LEADERSHIP
INTERNET USERSHIPConnectivity
Content ApplicationBehaviour
FixedMobile
35%25%10%15%10%
BENEFIT
LEADINGTHE
MINDSENSE & RESPOND
SENIOR
CITIZEN
change
custo
mer
competiton
MEN
YOUTH WOMEN
NETIZEN
FAM
ILY &
FRIE
NDS
MANAGINGTHE
MARKET
ORGANIZINGTHE
HEART
DEEP & WIDE

11
FIGURE 13. VERBATIM FROM LATEST wOMEN FGD
in terms of buying power and naturally had little influence, overall.
The expansion of Internet availability and especially Web 2.0 and social media proliferation has completely changed that situation. Youth and Women are able to stay easily connected, not only with their old friends and acquaintances from the same cities, schools, universities, and organizations but they also build a large online network of new friends from all over the world, and have virtually unlimited interactions on Web 2.0 and social media. By sharing information and thoughts, giving feedbacks on products/services, chatting with a global audience, and online transactions, the youth and women today demonstrate a strong ability to actively or passively influence others.
Active influence can come from direct feedbacks, such as product reviews or recommendations. They can also create a passive influence through collective activities, simple or big. Such collective activities done in groups may simply provide specific data or information or become inspiration for others.
Even though the youth and women may not connect with each other on a daily basis or use Internet or social media for less than an hour per day, they can still exert influence on others. Netizens are described as those who use Internet for at least three hours per day, either for web browsing or checking emails or simply updating activities on social media. Three hours may not look like a lot of time but the data and information shared by netizens remain available to an entire global network, beyond local or regional borders, creating a source of information and influence.
In response to the increasing connectivity amongst YWN sub cultures, players from various industries such as banking, transportation, hotel, apparel and etc, various counter parties such B2C, C2C and B2B, use data and information to deepen and broaden their internet-based services and adopt more innovation in their products and services.
Those not belonging to the YWN also get influenced from the data and information from the YWN available via Internet. They will use this information to start conversations, positive or negative. As a result, the discussions and interactions in the YWN subcultures over Internet will influence themselves or others to act/buy/consume and recommend particular brands.
Realizing their power and potential, since 2010, we have been conducting surveys dedicated to YWN. We aim to explore their anxieties and desires, needs and expectations and habits and behaviors. We also keep track of their favorite brands in various industries.
The study about YWN’s anxieties and desires helps us understand the types of products and services that they need, prefer and expect. For example, anxieties about future security felt by women leads to needs and expectations for better household financial planning and management, especially on how to allocate money for monthly regular expenditures as well as special needs in the near or long term. Today, women needs are not limited to having more than one bank accounts, but also advice on how to optimize cash flow or generate good returns. (See figure 13).

12
Their banking preferences, in turn, will depend on those needs, whether to do conventional transactions or entirely move to electronic banking. In the conventional setting, for example, they may go to the bank’s premises and meet the bank’s staffs. For electronic banking setting, they may go only to the bank’s ATM for cash withdrawal while rests of the banking activities are done through indirect interactions with the bank’s staffs.
Each of YWN sub-cultures has unique anxieties and desires that lead to specific needs and expectations. In effect, those needs and expectations influence their habits and behaviors.
Brands with a better understanding of YWN’s anxieties and desires will be able to explore and address their needs and expectations more effectively. The YWN will consider products and services based on such explorations are created especially for them. They will like them, adopt them and recommend them.
In terms of favorite brands among various industries, YWN does not have very different preferences compared to other segments of the Indonesian middle class. It could mean two things. Either they actually don’t have different preferences or so far, no brands have really tried to explore their uniqueness. We believe it’s the latter. Therefore, we recently conducted an industry oriented FGD (focus group discussion) to understand what it could mean for YWN to have banking services customized to their preferences. What we found is that they really have unique anxieties and desires, either as YWN in general or as banking customers.
For instance, the Youth who desire to be the center of attraction and very confident about
FIGURE 14. VERBATIM FROM yOUTh FGD
themselves are anxious about the way banks approach them. (See figure 15) They are not treated special as they don’t have so much money to deposit in banks. On the other hand, in other industries, they are treated special and even offered special products even though they have limited buying power.
The Women are generally very anxious with their multiple roles and interactions: me and myself; me and my family; and me and my friends. They desire that others will understand without asking when they are in a particular role and interaction. It can be imagined how difficult it can be really approach them.
YWN are also realistic about needs and expectations. For instance, the Youth expects that they be offered a possibility to customize the look of the homepage of their Internet banking which fits with different moods or personalities. The women want to share their ATM cards with family members but want to be notified by the banks whenever there is a banking transaction carried out through ATM.
The above-mentioned findings from the FGD should act as inspirations for Japanese brands, whether they are in a strong or weak position or r trying to enter the Indonesian market. It’s important for them to have a better understanding of YWN. Indonesia’s 2014 Presidential election should also be put as another important reference to how the YWN helped Jokowi win the race, even though he was supported by a coalition of minority political parties.

13
FIGURE 15. INDONESIA
BANk LOyALTy INDEX 2014
Industry Focused Syndicated Survey
At MarkPlus, we utilize two options for syndicated surveys: multi-industry study or an industry-focused study. When aiming to understand application of a marketing concept in various industries, we conduct a multi-industry study. In order to understand the application of a marketing concept in a particular industry, we conduct an industry-focused study.
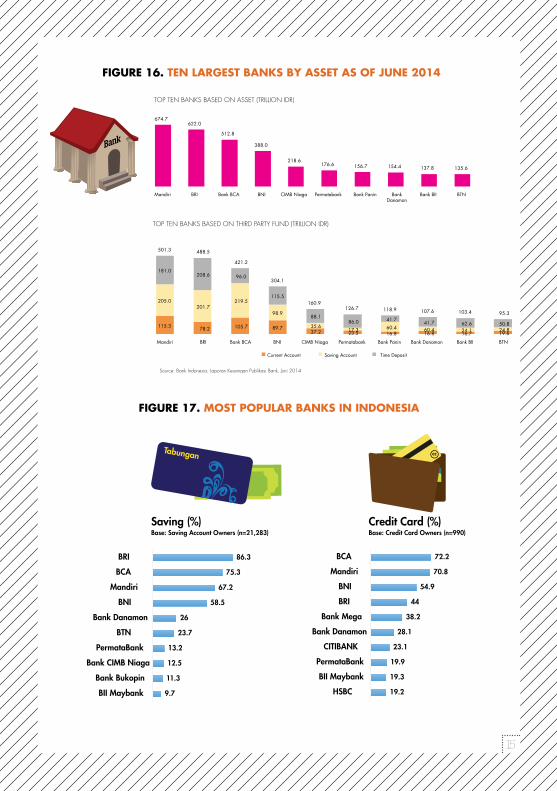
Since 2004, we have been conducting service and loyalty survey in Indonesia’s banking industry, as shown in figure 16, for 10 years in a row. This
study has enabled us to understand the service and loyalty performance in this industry. Three categories are selected for evaluation through this survey: savings product of conventional banking, savings product of Islamic banking and credit card.
The idea is quite simple. If a bank ranks high on service and loyalty index, it means it can easily maintain its existing (good) customer. Several banks in Indonesia have used our survey results as a good reference point to evaluate business units and their banking teams.
We also conduct industry-focused Indonesia brand champion survey. It was developed to ascertain brand popularity and usage in a particular industry. We discuss the findings from this survey, among other things, at a monthly event we call ‘monthly industry update’.
Our various industry-focused syndicated surveys also address generic questions about the competitive situation in a particular industry, such as providing data on top performing brands in a particular industry. In addition, it helps us to determine the factors influencing customer
consideration in a particular industry. Generally speaking, we do not put ‘country
of origin’ as a key topic in our industry-focused syndicated surveys, though we have done so for ad-hoc projects. For example, we conducted an ad-hoc survey commissioned by a Singapore-based hospital chain. The Singapore-based client wanted to know about the perception of hospital chains in Indonesia from neighboring countries, type of associations from different country players within the healthcare industry, and strength of those associations in the minds of Indonesian patients, who had undergone treatments in those selected countries.
A similar approach can surely be applied when conducting a syndicated survey. Unfortunately, going by the priority of topics to be covered in our syndicated surveys, country of origin does not factor in our most covered topics. However, several foreign companies who have previously contacted us for information had asked us whether we could provide this information.
Nevertheless, based on our observation and interaction with different types of Indonesian middle class from 18 cities of Indonesia, we take into account that ‘country of origin’ could also be a factor affecting selection of brands by consumers brand in a particular industry. For example, a country considered unfriendly towards Indonesians, such as the country’s migrant workers or even tourists, will cast a negative perception on locals. In effect, it could discourage a significant number of customers to use brands from that country.
Having said that, it is also true that Indonesians tend to have a short memory. A lot of Indonesians are known to be strong supporters of the
14
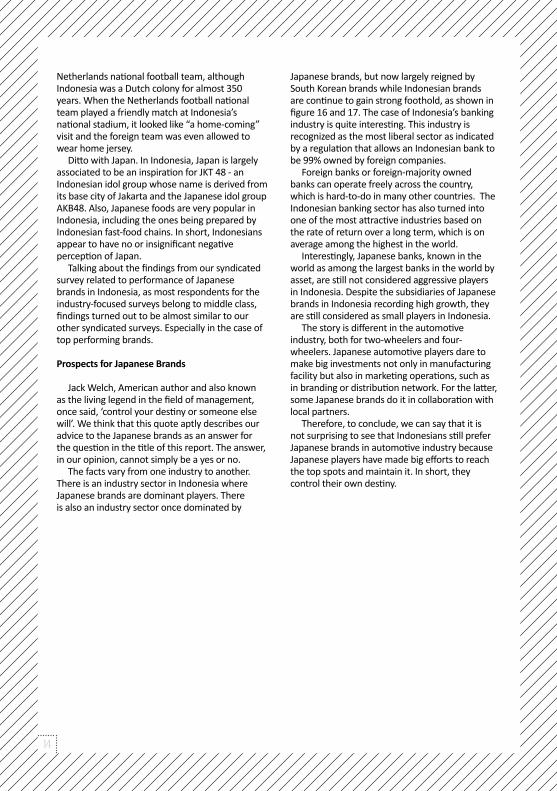
Netherlands national football team, although Indonesia was a Dutch colony for almost 350 years. When the Netherlands football national team played a friendly match at Indonesia’s national stadium, it looked like “a home-coming” visit and the foreign team was even allowed to wear home jersey.
Ditto with Japan. In Indonesia, Japan is largely associated to be an inspiration for JKT 48 - an Indonesian idol group whose name is derived from its base city of Jakarta and the Japanese idol group AKB48. Also, Japanese foods are very popular in Indonesia, including the ones being prepared by Indonesian fast-food chains. In short, Indonesians appear to have no or insignificant negative perception of Japan.
Talking about the findings from our syndicated survey related to performance of Japanese brands in Indonesia, as most respondents for the industry-focused surveys belong to middle class, findings turned out to be almost similar to our other syndicated surveys. Especially in the case of top performing brands.
Prospects for Japanese Brands
Jack Welch, American author and also known as the living legend in the field of management, once said, ‘control your destiny or someone else will’. We think that this quote aptly describes our advice to the Japanese brands as an answer for the question in the title of this report. The answer, in our opinion, cannot simply be a yes or no.
The facts vary from one industry to another. There is an industry sector in Indonesia where Japanese brands are dominant players. There is also an industry sector once dominated by
Japanese brands, but now largely reigned by South Korean brands while Indonesian brands are continue to gain strong foothold, as shown in figure 16 and 17. The case of Indonesia’s banking industry is quite interesting. This industry is recognized as the most liberal sector as indicated by a regulation that allows an Indonesian bank to be 99% owned by foreign companies.
Foreign banks or foreign-majority owned banks can operate freely across the country, which is hard-to-do in many other countries. The Indonesian banking sector has also turned into one of the most attractive industries based on the rate of return over a long term, which is on average among the highest in the world.
Interestingly, Japanese banks, known in the world as among the largest banks in the world by asset, are still not considered aggressive players in Indonesia. Despite the subsidiaries of Japanese brands in Indonesia recording high growth, they are still considered as small players in Indonesia.
The story is different in the automotive industry, both for two-wheelers and four-wheelers. Japanese automotive players dare to make big investments not only in manufacturing facility but also in marketing operations, such as in branding or distribution network. For the latter, some Japanese brands do it in collaboration with local partners.
Therefore, to conclude, we can say that it is not surprising to see that Indonesians still prefer Japanese brands in automotive industry because Japanese players have made big efforts to reach the top spots and maintain it. In short, they control their own destiny.
15
FIGURE 16. TEN LARGEST BANkS By ASSET AS OF JUNE 2014
FIGURE 17. MOST POPULAR BANkS IN INDONESIA
Saving (%)
Tabungan
Base: Saving Account Owners (n=21,283)
cc
Credit Card (%)Base: Credit Card Owners (n=990)
9.7
11.3
12.5
13.2
23.7
26
58.5
67.2
75.3
86.3
BII Maybank
Bank Bukopin
Bank CIMB Niaga
PermataBank
BTN
Bank Danamon
BNI
Mandiri
BCA
BRI
19.2
19.3
19.9
23.1
28.1
38.2
44
54.9
70.8
72.2
HSBC
BII Maybank
PermataBank
CITIBANK
Bank Danamon
Bank Mega
BRI
BNI
Mandiri
BCA

16

AbouT THE AuTHoR:• Hermawan Kartajaya is the Managing Partner
of MarkPlus consulting. He has over 21 years of consulting experience. Hermawan was dubbed as “one of the 50 Gurus Who Have shaped the future of Marketing” by chartered institute of Marketing, united Kingdom
• Taufik is a senior vice President & coo of MarkPlus,inc. He has over 16 years of consulting experience. Taufik has an MbA from the Nanyang fellows Programme (Nanyang Technological university and MiT sloan school of Management).
• Melati Astri Maharani is a chief operations MarkPlus insight with over 6 years of consulting experience
• Levina Yulianti is a chief operations MarkPlus insight with over 6 years of research experience.
• Priyanka Shekhawat is an Analyst at MarkPlus insight with over 5 years of research experience.

Copyright ® MarkPlus, Inc. 2014 All rights reserved.
for inquiries, Please contact:
Taufik([email protected])
Levina yulianti([email protected])
Melati Astri Maharani([email protected])
EightyEight@Kasablanka, 8th floorJl. casablanca Raya Kav. 88Jakarta 12870, indonesiaPhone : +62 21 5790 2338fax : +62 21 5790 2339
General Disclaimer:This paper has been prepared for general guidance on matters of interest only, and does not constitute professional advice. You should not act upon the information contained in this paper.