Embed Size (px)
Citation preview
INDONESIALiteracy for Life Skills and
EntrepreneurshipUNESCO Bangkok OfficeAsia and Pacific Regional Bureau for Education
Mom Luang Pin Malakul Centenary Building920 Sukhumvit Road, Prakanong, KlongtoeyBangkok 10110, ThailandEmail: [email protected]: www.unesco.org/bangkokTel: +66-2-3910577 Fax: +66-2-3910866 CASE STUDY
Indonesia: Literacy for Life Skills and EntrepreneurshipProm
ising EFA Practices in the Asia-Pacific Region
INDONESIALiteracy for Life Skills and
Entrepreneurship
CASE STUDY
iv
Published in 2015 by the United Nations Educational, Scientific and Cultural Organization 7, place de Fontenoy, 75352 Paris 07 SP, France
and
UNESCO Bangkok Office
© UNESCO 2015
ISBN: 978-92-9223-515-4 (Print version) ISBN: 978-92-9223-507-9 (Electronic version)
This publication is available in Open Access under the Attribution-ShareAlike 3.0 IGO (CC-BY-SA 3.0 IGO) license (http://creativecommons.org/licenses/by-sa/3.0/igo/). By using the content of this publication, the users accept to be bound by the terms of use of the UNESCO Open Access Repository (http://www.unesco.org/open-access/terms-use-ccbysa-en).
The designations employed and the presentation of material throughout this publication do not imply the expression of any opinion whatsoever on the part of UNESCO concerning the legal status of any country, territory, city or area or of its authorities, or concerning the delimitation of its frontiers or boundaries.
The ideas and opinions expressed in this publication are those of the authors; they are not necessarily those of UNESCO and do not commit the Organization.
Coordinator: Malisa SantigulEditor: Ellie MeleiseaGraphic designer: Filippo Monti
TH/APL/018/14/150
v
TABLE OF CONTENTS
Acronyms viii
Preface ix
Acknowledgements x
Executive Summary 1
1 Introduction 31.1 Background . . . . . . . . . . . . . . . . . . . . . . . . . . . . . . . . . . . . . . . . . . . . . . . . . 31.2 Overview of the study . . . . . . . . . . . . . . . . . . . . . . . . . . . . . . . . . . . . . . . . . . . 41.3 Research methods . . . . . . . . . . . . . . . . . . . . . . . . . . . . . . . . . . . . . . . . . . . . . 4
2 Progress in Indonesia towards achieving the EFA Goals 112.1 Introduction . . . . . . . . . . . . . . . . . . . . . . . . . . . . . . . . . . . . . . . . . . . . . . . . 11
3 Literacy in Indonesia: Achievements and challenges 293.1 Literacy achievements . . . . . . . . . . . . . . . . . . . . . . . . . . . . . . . . . . . . . . . . . 293.2 Remaining challenges . . . . . . . . . . . . . . . . . . . . . . . . . . . . . . . . . . . . . . . . . . 293.3 Literacy indicators . . . . . . . . . . . . . . . . . . . . . . . . . . . . . . . . . . . . . . . . . . . . 303.4 Strategies for literacy education . . . . . . . . . . . . . . . . . . . . . . . . . . . . . . . . . . . . 363.5 Indonesia’s adult literacy programmes. . . . . . . . . . . . . . . . . . . . . . . . . . . . . . . . 383.6 Stages of literacy and learning in the LLSE programme . . . . . . . . . . . . . . . . . . . . . 403.7 Literacy programme costs and budgets . . . . . . . . . . . . . . . . . . . . . . . . . . . . . . . 423.8 Monitoring and evaluation of literacy programmes . . . . . . . . . . . . . . . . . . . . . . . 44
4 The Literacy for Life Skills and Entrepreneurship programme 464.1 Introduction to the LLSE programme . . . . . . . . . . . . . . . . . . . . . . . . . . . . . . . . 464.2 Findings of the case study . . . . . . . . . . . . . . . . . . . . . . . . . . . . . . . . . . . . . . . 474.3 Findings based on the research questions . . . . . . . . . . . . . . . . . . . . . . . . . . . . . 52
5 Summary of the findings 615.1 Question 1: The contribution of learners’ literacy skills to poverty alleviation . . . . . . . . 615.2 Question 2: Strategies to motivate and engage learners to preserve their literacy skills . 675.3 Question 3: Improving tutors’ competencies . . . . . . . . . . . . . . . . . . . . . . . . . . . . 695.4 Question 4: The capacity of institutions . . . . . . . . . . . . . . . . . . . . . . . . . . . . . . . 705.5 Question 5: Government actions . . . . . . . . . . . . . . . . . . . . . . . . . . . . . . . . . . . 73
6 Conclusions and recommendations 756.1 Conclusions . . . . . . . . . . . . . . . . . . . . . . . . . . . . . . . . . . . . . . . . . . . . . . . . 756.2 Recommendations . . . . . . . . . . . . . . . . . . . . . . . . . . . . . . . . . . . . . . . . . . . . 75
References 76
vi
List of FiguresFigure 1.1: The data collection process . . . . . . . . . . . . . . . . . . . . . . . . . . . . . . . . . . . 6Figure 2.1: Indonesian population (in millions), by age group (2010) . . . . . . . . . . . . . . . 12Figure 2.2: Preparing the “Golden Generation”. . . . . . . . . . . . . . . . . . . . . . . . . . . . . . 13Figure 2.3: Geographical variation in GER for ECE, and GER between 2010 and 2014 . . . . . 14Figure 2.4: GER and NER by education level (2004–2012). . . . . . . . . . . . . . . . . . . . . . . 16Figure 2.5: Junior secondary school GER, by districts/cities (2012/2013) . . . . . . . . . . . . . 16Figure 2.6: Overview of Indonesia’s Basic Education programme. . . . . . . . . . . . . . . . . . 17Figure 2.7: Population, by age and education level (2010) . . . . . . . . . . . . . . . . . . . . . . 18Figure 2.8: Life Skills Education . . . . . . . . . . . . . . . . . . . . . . . . . . . . . . . . . . . . . . . 19Figure 2.9: Adult illiteracy (2004–2012) . . . . . . . . . . . . . . . . . . . . . . . . . . . . . . . . . . 21Figure 2.10: Literacy rates by province . . . . . . . . . . . . . . . . . . . . . . . . . . . . . . . . . . . 22Figure 2.11: Percentage of cities/districts implementing gender mainstreaming in
education (2010–2013) . . . . . . . . . . . . . . . . . . . . . . . . . . . . . . . . . . . . . 24Figure 2.12: Teacher qualifications and student-class ratios, by education level (2000–2011) . 28Figure 3.1: Number, percentage and gender disparity of adult illiterates (2004–2012) . . . . 30Figure 3.2: Male and female youth literacy rates (2004–2013) . . . . . . . . . . . . . . . . . . . . 30Figure 3.3: Youth literacy rates, by sex . . . . . . . . . . . . . . . . . . . . . . . . . . . . . . . . . . . 31Figure 3.4: Percentage of illiterates, by province (2012) . . . . . . . . . . . . . . . . . . . . . . . . 31Figure 3.5: Number of adult illiterates, by province (2012) . . . . . . . . . . . . . . . . . . . . . . 32Figure 3.6: Districts with over 50,000 illiterate people (2011). . . . . . . . . . . . . . . . . . . . . 32Figure 3.7: Illiteracy and poverty, by province (2010) . . . . . . . . . . . . . . . . . . . . . . . . . 33Figure 3.8: Illiteracy and poverty in West Java, by district/city . . . . . . . . . . . . . . . . . . . . 34Figure 3.9: Illiteracy and poverty in North Sumatera, by district/city . . . . . . . . . . . . . . . . 34Figure 3.10: Illiteracy and poverty in South Sulawesi, by district/city . . . . . . . . . . . . . . . . 35Figure 3.11: Illiteracy by province and income quintile . . . . . . . . . . . . . . . . . . . . . . . . . 35Figure 3.12: Percentage and number of adult literacy learners (2005–2012) . . . . . . . . . . . . 42Figure 4.1: LLSE activities . . . . . . . . . . . . . . . . . . . . . . . . . . . . . . . . . . . . . . . . . . . 47Figure 4.2: Occupations of the parents of SEL learners . . . . . . . . . . . . . . . . . . . . . . . . 48Figure 4.3: Occupations of the parents of LSE learners . . . . . . . . . . . . . . . . . . . . . . . . 49Figure 4.4: Occupations of the parents of PEI learners. . . . . . . . . . . . . . . . . . . . . . . . . 51Figure 5.1: LLSE learners by programme and sex . . . . . . . . . . . . . . . . . . . . . . . . . . . . 61Figure 5.2: LLSE participants, by level of education and sex . . . . . . . . . . . . . . . . . . . . . 62Figure 5.3: Occupations of the parents of LLSE learners. . . . . . . . . . . . . . . . . . . . . . . . 62Figure 5.4: Weaving ikat/songket. . . . . . . . . . . . . . . . . . . . . . . . . . . . . . . . . . . . . . 63Figure 5.5: Calculating profit. . . . . . . . . . . . . . . . . . . . . . . . . . . . . . . . . . . . . . . . . 64Figure 5.6: Illiteracy and poverty rates, by province . . . . . . . . . . . . . . . . . . . . . . . . . . 64Figure 5.7: Illiteracy and poverty rates in the three case study sites . . . . . . . . . . . . . . . . 65Figure 5.8: Adult illiteracy by economic group and province . . . . . . . . . . . . . . . . . . . . 66Figure 5.9: LLSE activities and products. . . . . . . . . . . . . . . . . . . . . . . . . . . . . . . . . . 68Figure 5.10: A confident learner . . . . . . . . . . . . . . . . . . . . . . . . . . . . . . . . . . . . . . . 68Figure 5.11: Tutor and needlework students. . . . . . . . . . . . . . . . . . . . . . . . . . . . . . . . 70Figure 5.12: PEI programme . . . . . . . . . . . . . . . . . . . . . . . . . . . . . . . . . . . . . . . . . . 72Figure 5.13: Working together effectively to accomplish goals . . . . . . . . . . . . . . . . . . . . 72Figure 5.14: PP-PAUDNI Office in Lembang, West Java . . . . . . . . . . . . . . . . . . . . . . . . . 74
vii
List of TablesTable 1.1: Research questions, methods, tools and types of data collected. . . . . . . . . . . . . 8Table 1.2: The research questions and their respective sub-questions. . . . . . . . . . . . . . . . 8Table 2.1: Students, by gender and education level (2010/2011) . . . . . . . . . . . . . . . . . . 24Table 2.2: Percentage and number of principals, by gender and education level
(2010/2011). . . . . . . . . . . . . . . . . . . . . . . . . . . . . . . . . . . . . . . . . . . . . 25Table 2.3: Percentage and number of teachers, by gender and education level (2010/2011) 25Table 2.4: GPI of NER, by education level (2006/2007–2010/2011) . . . . . . . . . . . . . . . . . 26Table 2.5: GPI of graduates, by education level (2006/2007–2010/2011) . . . . . . . . . . . . . 26Table 3.1: Basic literacy competencies. . . . . . . . . . . . . . . . . . . . . . . . . . . . . . . . . . . 41Table 3.2: Self-Entrepreneurship Literacy competencies . . . . . . . . . . . . . . . . . . . . . . . 41Table 3.3: Number of learners enrolled in selected adult literacy programmes (2008–2013) 42Table 3.4: Unit cost per learner and learning outputs of the literacy programmes . . . . . . . 42Table 3.5: Expenditure on literacy programmes (2004–2009) . . . . . . . . . . . . . . . . . . . . 43Table 3.6: Adult literacy funding 2013–2015 . . . . . . . . . . . . . . . . . . . . . . . . . . . . . . . 43Table 3.7: Number of beneficiaries of literacy programmes (2012–2015) . . . . . . . . . . . . . 44Table 4.1: SEL/LSE/PEI skills of adult learners . . . . . . . . . . . . . . . . . . . . . . . . . . . . . . . 53Table 4.2: Summary of interviews and FGDs on tutor training. . . . . . . . . . . . . . . . . . . . 56Table 4.3: LLSE core competencies and expected learning outcomes. . . . . . . . . . . . . . . 57
List of DiagramsDiagram 3.1: Transition of the literacy programme from a national to a community
movement . . . . . . . . . . . . . . . . . . . . . . . . . . . . . . . . . . . . . . . . . . 37Diagram 3.2: Stages of literacy education . . . . . . . . . . . . . . . . . . . . . . . . . . . . . . . 40
viii
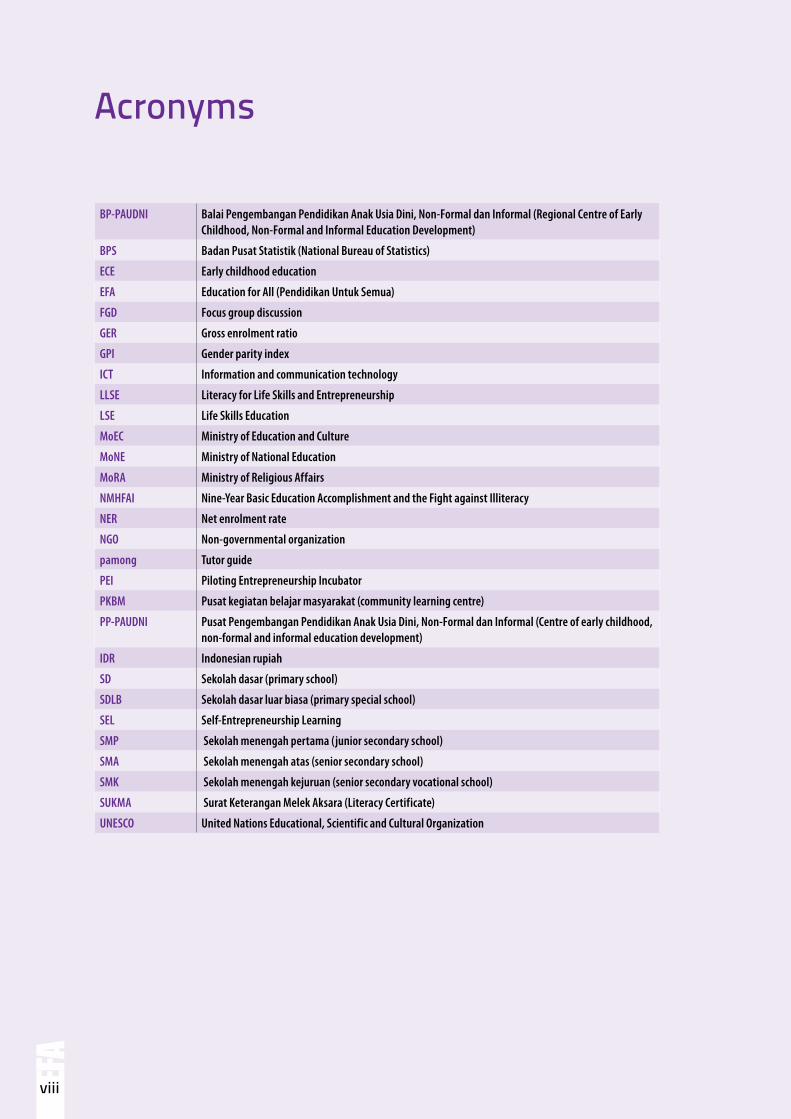
Acronyms
BP-PAUDNI Balai Pengembangan Pendidikan Anak Usia Dini, Non-Formal dan Informal (Regional Centre of Early Childhood, Non-Formal and Informal Education Development)
BPS Badan Pusat Statistik (National Bureau of Statistics)
ECE Early childhood education
EFA Education for All (Pendidikan Untuk Semua)
FGD Focus group discussion
GER Gross enrolment ratio
GPI Gender parity index
ICT Information and communication technology
LLSE Literacy for Life Skills and Entrepreneurship
LSE Life Skills Education
MoEC Ministry of Education and Culture
MoNE Ministry of National Education
MoRA Ministry of Religious Affairs
NMHFAI Nine-Year Basic Education Accomplishment and the Fight against Illiteracy
NER Net enrolment rate
NGO Non-governmental organization
pamong Tutor guide
PEI Piloting Entrepreneurship Incubator
PKBM Pusat kegiatan belajar masyarakat (community learning centre)
PP-PAUDNI Pusat Pengembangan Pendidikan Anak Usia Dini, Non-Formal dan Informal (Centre of early childhood, non-formal and informal education development)
IDR Indonesian rupiah
SD Sekolah dasar (primary school)
SDLB Sekolah dasar luar biasa (primary special school)
SEL Self-Entrepreneurship Learning
SMP Sekolah menengah pertama (junior secondary school)
SMA Sekolah menengah atas (senior secondary school)
SMK Sekolah menengah kejuruan (senior secondary vocational school)
SUKMA Surat Keterangan Melek Aksara (Literacy Certificate)
UNESCO United Nations Educational, Scientific and Cultural Organization
ix
Preface
There has been significant progress towards the six EFA goals, however, all available indicators are pointing to a bitter reality that EFA will be an “unfinished business”. The 2013/4 EFA Global Monitoring Report has concluded that with less than two years until the 2015 deadline, the world is not on track. Amidst the many challenges, many countries have demonstrated how achievements can be made with the commitment from government, expanded partnerships, innovative thinking and efficient use of resources. There are lessons to be learned.
At the Global EFA Meeting (GEM) in Paris in November 2012, Ministers, heads of delegations, leading officials of multilateral and bilateral organizations, and senior representatives of civil society and private sector organizations, including those from Asia-Pacific, committed to the “Big Push”. The GEM participants called upon governments and EFA partners to identify successful initiatives and innovative practices and to adapt, replicate, or scale-up such initiatives to speed up EFA progress.
Subsequently, the 13th Regional Meeting of National EFA Coordinators: The Big Push, which was organized in Bangkok, Thailand on 26-27 February 2013 as a follow up to the GEM, underscored the need for increased knowledge on innovative and creative ways of addressing EFA challenges so as to inform policy-making and programme development on EFA. To this end, the meeting requested UNESCO Bangkok to document innovative approaches and effective practices from countries that have succeeded in transforming EFA goals into concrete realities and to disseminate this knowledge for the benefit of all countries.
The Asia-Pacific region is full of successful initiatives, with stories of good practices in almost every country. Over the years, UNESCO has documented these practices to share them with a wider audience. These five country case studies provide in-depth understanding of promising initiatives that are critical in EFA acceleration in Asia-Pacific. While this research attempts to gather evidence on successful initiatives that have helped countries to accelerate EFA progress, it should be noted that these case studies are some examples selected from a vast pool of equally promising EFA practices in this region.
x
Acknowledgements
The Country Case Studies on Promising EFA Practices in Asia-Pacific have been published with the support from the Japanese Funds-in-Trust (JFIT).
We would like to thank the following experts and their respective institutes for preparing the five country case studies on promising EFA practices in Bangladesh, Cambodia, India, Indonesia and the Philippines respectively: Dr. Manzoor Ahmed, Mahmuda Akhter, Dr. Anisuzzaman, and Mahfuzar Rahman Jewel of the Institute of Child and Human Development (ICHD), Bangladesh; Sitha Chhinh, Sarom Mok, Chhang Roth and Youhan Hor of the Royal Phnom Penh University (RUPP), Cambodia; Anuradha De and Meera Samson of Collaborative Research and Dissemination (CORD), India; Dr. Ella Yulaelawati, MA, Ph.D, Dr. Faisal Madani, M.Sc. Ed, Aryo Radiyo Sawung, M.Ed, Cecep Somantri, S.S, and Dr. Suryadi Nomi of the Indonesian National Commission for UNESCO, Ministry of Education and Culture (MoEC) of the Republic of Indonesia; and Elaissa Marina Mendoza and the Research Studies Unit of the Southeast Asian Ministers of Education Organization Regional Centre for Innovation and Technology (SEAMEO INNOTECH).
Thank you to the following colleagues who provided their support in liaising with the respective governments and institutes in the preparation of these country case studies on promising EFA practices: Anwar Alsaid, Mee Young Choi and Nurhajati Sugianto, UNESCO Office in Jakarta; Santosh Khatri, UNESCO Office in Phnom Penh; Kiichi Oyasu and Shereen Akhter, UNESCO Office in Dhaka; Alisher Umarov and Girish Joshi, UNESCO Office in New Delhi; and Shailendra Sigdel, UNESCO Institute for Statistics (UIS) New Delhi Cluster Office.
Our appreciation also goes to reviewers of the case studies: Min Bista, Gwang-Chol Chang, David Clarke, Ginger Gruters, Hyunjeong Lee, Sun Lei, Tanvir Muntasim, Malisa Santigul, Nurhajati Sugianto, Bertrand Tchatchoua, Nyi Nyi Thaung and Marlene Cruz Zegarra.
Indo
nesi
a: L
itera
cy fo
r Life
Ski
lls a
nd E
ntre
pren
eurs
hip
1
Executive Summary
This case study on promising Education for All (EFA) initiatives in Indonesia was commissioned by UNESCO Bangkok with support from the Japanese Funds-in-Trust (JFIT) as one of five country case studies from the Asia-Pacific region. The Asia-Pacific region is full of successful and innovative initiatives that have helped governments accelerate EFA progress at the country level. Governments in the region and beyond can learn from these experiences. It is in this context UNESCO Bangkok has embarked on the documentation of such practices.
Among the policies and strategies in Indonesia that have contributed to progress made towards the achievement of the EFA goals, the Literacy for Life Skills and Entrepreneurship (LLSE) programme is highlighted in this study and is viewed as a promising practice for accelerating efforts to achieve EFA Goal 4. The case study examines the LLSE intervention and explores its role in terms of national literacy achievements, particularly the EFA goal on adult literacy. The study also explores the relationship between literacy and increased entrepreneurship competencies of adults.
The case study involved the collection of quantitative data utilizing questionnaires and the collection of qualitative data from observations, semi-structured interviews, and analysis of quantitative data sources on poverty levels and literacy rates.
In 2006, the Presidential Decree 5/2006 or the “National Movement to hasten Compulsory Nine-Year Basic Education and the Right against Illiteracy” was issued with the goal of accelerating efforts towards achieving EFA Goal 4. In pursuing this goal, Indonesia developed basic and functional literacy education programmes intended to increase adult literacy. The LLSE programme, also known as the “Improving Quality of Literacy Education through Entrepreneurship Literacy, Reading Culture and Tutor Training” programme was launched. This initiative received the UNESCO King Sejong Literacy Prize in 2012.
The LLSE programme aims to develop a literate, skilled, reading-oriented and gender-aware society. It was initiated in recognition that literacy is a doorway to a knowledge-based economy, as literacy enables the building of the skills and attitudes needed in such an economy. The LLSE programme seeks to provide the foundation for a skilled, confident and competent workforce. Since its inception in 2008, it has reached over four million people, with over three million learners obtaining a government literacy certificate. As part of the LLSE programme, training is provided to tutors and managers including how to manage programmes appropriate to different individual needs and aspirations of learners in the context of their socio-economic status and how to facilitate learning support and maintain records. As a result, the programme has also trained over 3,500 tutors and managers.
This study of the LLSE programme found that, overall, the programme has been successful in achieving its goals, whereby it has enabled new-literates to gain the skills needed to increase their incomes and thus lift themselves and their families out of poverty and has motivated learners enrolled in the LLSE programme, when tutors provide high quality teaching-learning experiences that are appropriate to their needs and expectations. The study also found that tutor competency can be improved through better support from the institutions they work with and from the government; specifically, through providing tutors with more training and
Indo
nesi
a: L
itera
cy fo
r Life
Ski
lls a
nd E
ntre
pren
eurs
hip
2
through the facilitation of networks for knowledge-sharing. Further improvements in the quality of the services provided can be made to the institutions implementing the LLSE programme (mainly CLCs). The government can provide further support and facilitate the implementation of the programme through encouraging CLCs to develop networks and partnerships with other education institutions, developing standards for the CLCs, collecting feedback from learners, equipping CLCs with community reading centres, initiating programmes to maintain the abilities of LLSE graduates, strengthening inter-ministerial networks and partnerships, and establishing a tutor forum and building the capacity of institutions implementing the LLSE programme.
Based on the conclusions, the recommendations for CLCs concerning the LLSE programme are to improve management capacity, support tutors to improve their knowledge and skills, particularly in the area of business development and develop networks and cooperation with other CLCs to facilitate knowledge sharing and capacity building of all CLCs.
The recommendations for the government regarding the LLSE programme are to facilitate the networking of CLCs with other education institutions and partnerships to increase knowledge-sharing and capacity building of CLCs, develop standards for the CLCs, collect feedback from learners, equip CLCs with community reading centres, establish a tutor forum and support the capacity building of tutors to ensure they have the required level of knowledge in and skills in business development, initiate programmes to maintain the abilities of LLSE graduates and strengthen inter-ministerial coordination and cooperation.
Indo
nesi
a: L
itera
cy fo
r Life
Ski
lls a
nd E
ntre
pren
eurs
hip
3
Introduction
1.1 BackgroundFollowing the Dakar World Education Forum in 2000, the Government of the Republic of Indonesia initiated numerous policies and programmes towards achieving the Education for All (EFA) Goals. These measures included a decree in 2003 by the Ministry of Welfare (B.10/MENKOKESRA/I/2003) for the effective coordination of EFA policies and programmes between ministries, non-governmental organizations (NGOs) and other stakeholders. This was followed by the Education Law 20/2003 which provided a legislative and regulatory framework of powers and responsibilities for the planning and management of EFA initiatives.
Significant progress was made between 2000 and 2005 in terms of achieving the EFA Goals and there were good prospects for reaching many of them by 2015. Concerns remained, however, regarding Goal 4: Achieving a 50 per cent of improvement in adult literacy by 2015, especially for women, and providing equitable access to basic and continuing education for adults.
In 2006, the president issued Presidential Decree 5/2006, the “National Movement to hasten Compulsory Nine-Year Basic Education and the Fight against Illiteracy”, with the goal of accelerating efforts towards achieving EFA Goal 4. In pursuing this goal, Indonesia developed various basic and functional literacy education programmes intended to increase adult literacy. One key initiative launched by the Directorate of Community Education Development was the “Literacy for Life Skills and Entrepreneurship” (LLSE) programme, also known as the “Improving Quality of Literacy Education through Entrepreneurship Literacy, Reading Culture and Tutor Training” programme. This initiative has been recognized as a success, receiving the UNESCO King Sejong Literacy Prize in 2012.
The LLSE programme seeks to develop a literate, skilled, reading-oriented and gender-aware society. It was initiated in recognition that literacy is a doorway to a knowledge-based economy, as literacy enables the building of the skills and attitudes needed in such an economy. The LLSE programme seeks to provide the foundation for a skilled, confident and competent workforce. Since its inception in 2008, it has reached over four million people, with over three million learners obtaining a government literacy certificate. The programme has also trained over 3,500 tutors and managers.
Given that the LLSE programme is viewed as a promising practice for accelerating efforts to achieve EFA Goal 4, it was selected as the topic of this case study, which is one of five country case studies commissioned by UNESCO as part of its collection of “Promising EFA Practices in the Asia-Pacific Region”.
1
Indo
nesi
a: L
itera
cy fo
r Life
Ski
lls a
nd E
ntre
pren
eurs
hip
4
1.2 Overview of the studyThis case study was commissioned by UNESCO Bangkok with support from the Japanese Funds-in-Trust (JFIT) as one of five country case studies from the Asia-Pacific region. The study examines the LLSE intervention and explores the role of the initiative in terms of national literacy achievements, particularly the EFA adult literacy goal.
The study also explores the relationship between literacy and increased entrepreneurship competencies of adults. It is clear that there is some sort of relationship between literacy achievement and entrepreneurship skills, but, there is a lack of information in Indonesia regarding the following questions:
• Whether literacy improves the entrepreneurship skills of adults.
• Whether literacy skills proficiencies improve quality of life.
• Whether there is a link between the level of literacy skill and earnings in later life.
To provide a better understanding of the link between literacy and entrepreneurship, the study therefore also seeks answers to the above-listed questions.
Furthermore, the study examines the extent of the programme’s benefits in alleviating poverty and also seeks to determine how the LLSE programme can be improved so as to improve learner outcomes. In particular, the study asks the following questions.
• How do learners’ new literacy skills contribute to alleviation of their poverty?
• How can we motivate and engage learners to preserve their literacy skills?
• How can we improve the competency of literacy tutors?
• What is the capacity of institutions that are implementing literacy education programmes?
• How can the government further support and facilitate the implementation of the LLSE in future?
1.3 Research methodsThe case study involved the collection of quantitative data utilizing questionnaires, the collection of qualitative data from observations and semi-structured interviews, and analysis of quantitative data sources on poverty levels and literacy rates.
The study interviewed tutors, facilitators and heads of community learning centres (CLCs), tutor guides (pamong), learners of the LLSE programme, and local and national administrators. Tutors and facilitators of CLCs were selected to participate because they are in charge of the implementation of the LLSE and have attended non-formal education in-service training.
To save time in the fieldwork, the research team chose to study the implementation of the LLSE programme in the following three centres: two Balai Pengembangan Pendidikan Anak Usia Dini, Non-Formal dan Informal (BP-PAUDNI), which are regional centres for early childhood education (ECE), non-formal education (NFE) and informal education development – one in Medan (North Sumatera) and one in Makassar (South Sulawesi); and a Pusat Pengembangan Pendidikan Anak Usia Dini, Non-Formal dan Informal (PP-PAUDNI), which is a local centre for ECE, NFE and informal education development – in Bandung (West Java). Respondents from these centres were interviewed by pamong, utilizing questionnaires, semi structured interviews, and focus group discussions (FGD).
Indo
nesi
a: L
itera
cy fo
r Life
Ski
lls a
nd E
ntre
pren
eurs
hip
5
The case study applied the combination of qualitative and quantitative methods noted above, utilizing an ethnography research design and working with pamong from the three centres listed above, interviewing the staff of over 90 Pusat Kegiatan Belajar Masyarakat (PKBM), or CLCs, including those in Mitra Insani, Kinanti, Kejar Aster, Getbrong, Tunas Mandiri, Kejar Mawar, Pelita, Hegar Manah, Melati, and Ibnu Sina. The team also interviewed groups of “Self-Entrepreneurship Literacy” learners from Medan, Bijai, Deli Serdang, Serdang Bedagai, Tebing Tinggi, Batu Bata, Pematang Siantar, Simalungun, Tapanuli Utara, and Dairi.
The case study team (CST) was divided into three groups, the three case study sub-teams (CSST), and each CSST was sent to one of the three centres to be studied, namely: the BP-PAUDNI in Medan (North Sumatera), the BP-PAUDNI in Makassar (South Sulawesi) and the PP-PAUDNI in Bandung (West Java).
In these three locations, each case study team then selected local teams (“informants”) from among the tutor guides (pamong) at each office. A tutor guide is a PP-PAUDNI or BP-PAUDNI employee who is in charge of implementing innovative ECE, NFE and informal education initiatives.
Data collection began in August 2013 and was completed in early February 2014. The CSSTs undertook the data collection in two phases. In the first phase, each CSST talked with the leader of the local office about the objectives of the study and informed the local team (informants) about the aims of the case study and their tasks in gathering information about the LLSE programme. In the second phase, the CSSTs worked with the local teams to collect information, using the methods described below.
The case study collected information against a pre-determined checklist. Each team conducted informal and semi-structured interviews with tutors, facilitators, CLC administrators and other tutor guides (those who were not team members), as well as with various local service providers. In addition, the main study team met with local education administrators. The teams also conducted three FGDs, each with more than 25 participants, including tutor guides, local employees, sub-leaders and the heads of the local offices. Data was collected in the three locations from approximately 90 tutors, 60 facilitators and 45 tutor guides, as well as 20 NFE administrators.
Questionnaires were administered to tutors and learners participating in the programme. A total of 200 tutors completed the questionnaire, but 11 questionnaires were not included in the final analysis because the respondents had supplied insufficient information regarding their personal details or inadequate responses to the questions. Therefore, the total number of tutor questionnaires for the final analysis was 189. In addition, 180 learners (two learners from each of the 90 CLCs) completed a learners’ questionnaire.
The teams also undertook observations of the implementation of the LLSE programme, observing the LLSE learners, tutors and supervisors. The data collected in these observations were primarily qualitative, with a focus on “how” and “why” certain things were done, although the teams also collected some quantitative data during the observations. The teams made observations at over 90 CLCs and other LLSE providers.
The observations examined various aspects of the LLSE programme, including the features of the CLCs, and the relationships between internal CLC tutors and external LLSE resource persons. These observations were made in order to gain a better understanding of how the programme works, how information is shared and how decisions are made and acted upon at each site. The teams also observed the LLSE teaching-learning process and the activities of the learners. This provided insights into whether and how LLSE meets local needs.
Indo
nesi
a: L
itera
cy fo
r Life
Ski
lls a
nd E
ntre
pren
eurs
hip
6
The teams also reviewed institutional practices at the CLCs visited, including working practices, staff meetings and the PKBM forum. In addition, the teams examined local policy documents and reports, including those related to educational law, official mandates, decrees, research reports and statistical reports, and reviewed the curriculum materials.
The CSST members stayed at each location for three days and two nights. Visiting the local offices allowed the case study team members to ensure the inclusion of “silent opinions” by engaging in discussions with tutors, heads and members of the NFE task forces of local institutions, who rarely participate in such participatory studies.
During the data collection process, the research teams employed the following procedures: interviews were recorded and transcribed; questionnaires were administered and collected; and notes were taken during each observation.
The data collected by the three sub-teams, including the questionnaires, were compiled and analyzed. The three teams met together several times to share and discuss their findings (see Figure 4.1.).
In the preliminary analysis, the qualitative and quantitative data were analyzed for trends and generalities. The quantitative data were also analyzed and interpreted using a non-parametric statistical analysis method.
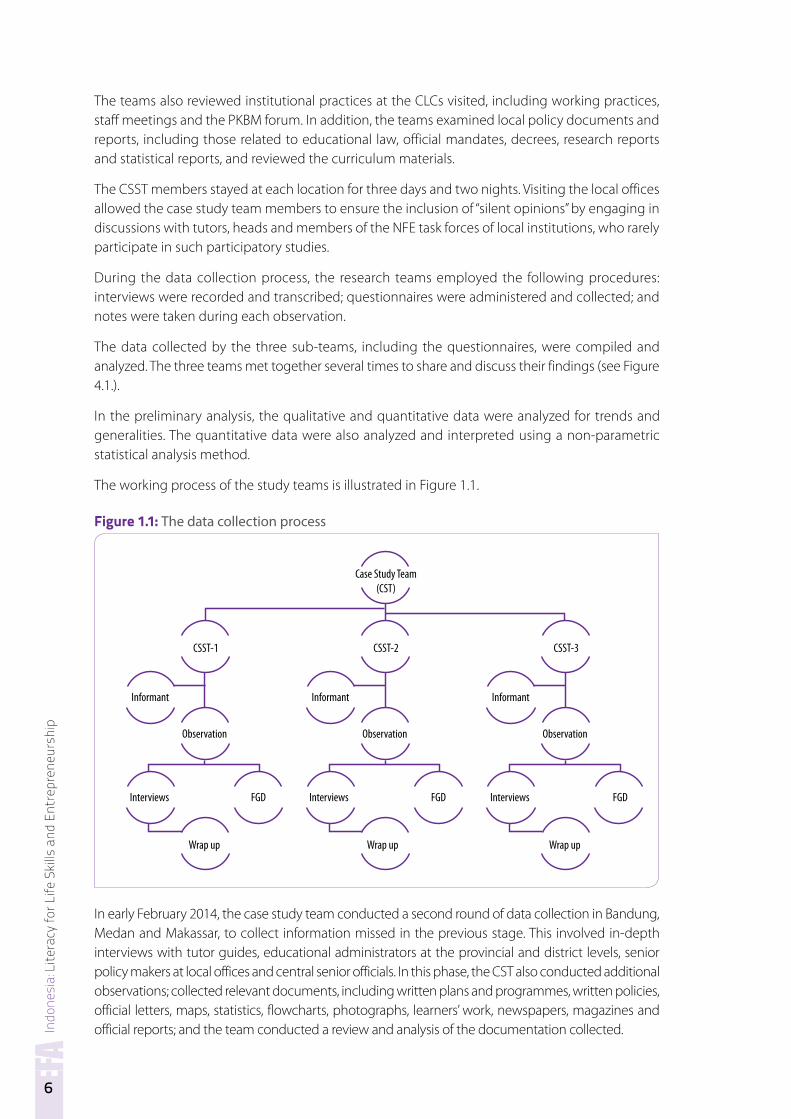
The working process of the study teams is illustrated in Figure 1.1.
Figure 1.1: The data collection process
Case Study Team(CST)
CSST-2
Wrap up
Observation
Interviews FGD
Informant
CSST-1
Wrap up
Observation
Interviews FGD
Informant
CSST-3
Wrap up
Observation
Interviews FGD
Informant
In early February 2014, the case study team conducted a second round of data collection in Bandung, Medan and Makassar, to collect information missed in the previous stage. This involved in-depth interviews with tutor guides, educational administrators at the provincial and district levels, senior policy makers at local offices and central senior officials. In this phase, the CST also conducted additional observations; collected relevant documents, including written plans and programmes, written policies, official letters, maps, statistics, flowcharts, photographs, learners’ work, newspapers, magazines and official reports; and the team conducted a review and analysis of the documentation collected.
Indo
nesi
a: L
itera
cy fo
r Life
Ski
lls a
nd E
ntre
pren
eurs
hip
7
Stages of implementationAs noted above, the study was conducted between August 2013 and February 2014. The activities were implemented in several stages, as listed below.
• Preparation: August 2013
• Semi-structured and informal interviews with senior officials and planners, administrators, and middle level policy makers at central offices: September 2013.
• First data collection phase in Bandung, Medan and Makassar: October 2013–February 2014.
• Second data collection phase: Early February 2014.
• Data analysis and report writing: September 2013 – February 2014.
ToolsSemi-structured interviews
The interviews covered three broad topics relating to the LLSE programme. The first topic was the respondents’ perceptions of the role of the LLSE programme in preserving literacy skills and in alleviating poverty. The second topic was the implementation of the LLSE programme, including professional development and the competencies of the participants. The third topic was adult education in relation to LLSE. Each interview of the education stakeholders, including teachers, principals and local and central administrators, covered all three topics.
Questionnaire
The questionnaire for the tutors collected information about three major topics: the respondents’ personal details; perceptions of the LLSE programme; and perceptions of ongoing changes in practices within LLSE implementation sites. Personal information included age, gender, experience, involvement in any in-service training programmes, academic background and the role or position in the type of institution in which they were employed. The second and third topics included sets of questions about processes and changes in the programme’s implementation.
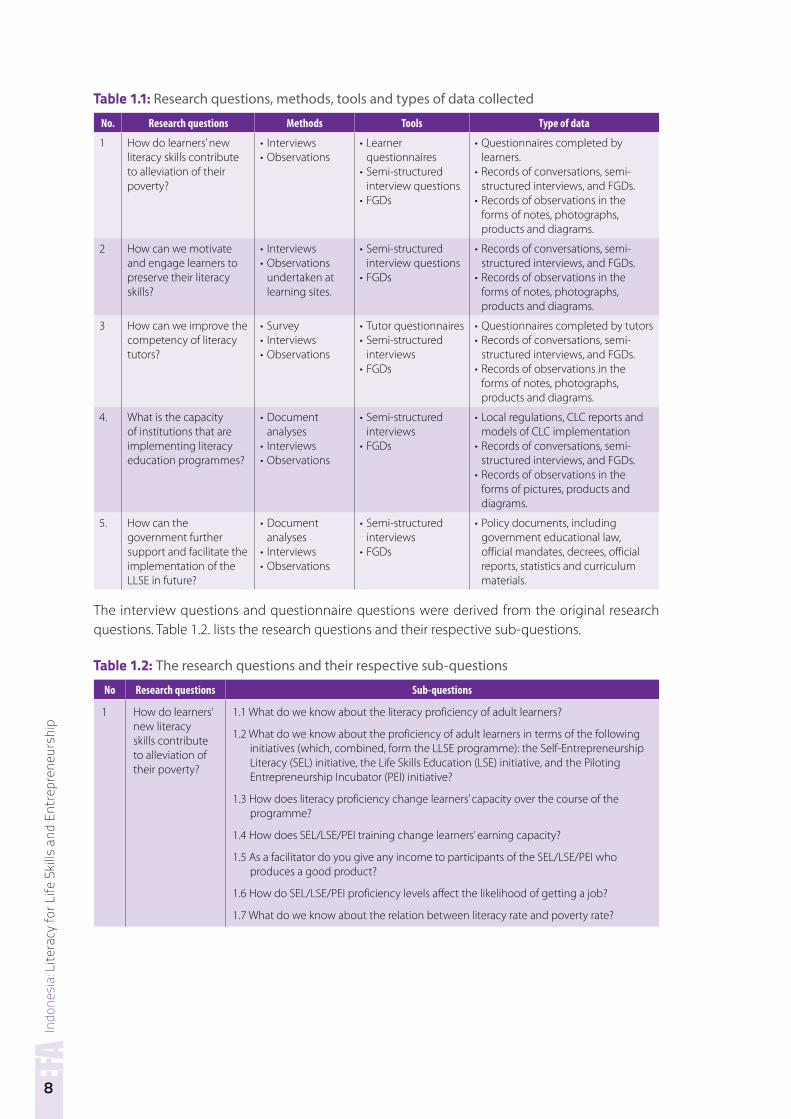
The study’s tools and methods are summarized in Table 1.1.
Indo
nesi
a: L
itera
cy fo
r Life
Ski
lls a
nd E
ntre
pren
eurs
hip
8
Table 1.1: Research questions, methods, tools and types of data collected
No. Research questions Methods Tools Type of data
1 How do learners’ new literacy skills contribute to alleviation of their poverty?
• Interviews• Observations
• Learner questionnaires
• Semi-structured interview questions
• FGDs
• Questionnaires completed by learners.
• Records of conversations, semi-structured interviews, and FGDs.
• Records of observations in the forms of notes, photographs, products and diagrams.
2 How can we motivate and engage learners to preserve their literacy skills?
• Interviews• Observations
undertaken at learning sites.
• Semi-structured interview questions
• FGDs
• Records of conversations, semi-structured interviews, and FGDs.
• Records of observations in the forms of notes, photographs, products and diagrams.
3 How can we improve the competency of literacy tutors?
• Survey • Interviews • Observations
• Tutor questionnaires • Semi-structured
interviews• FGDs
• Questionnaires completed by tutors • Records of conversations, semi-
structured interviews, and FGDs. • Records of observations in the
forms of notes, photographs, products and diagrams.
4. What is the capacity of institutions that are implementing literacy education programmes?
• Document analyses
• Interviews• Observations
• Semi-structured interviews
• FGDs
• Local regulations, CLC reports and models of CLC implementation
• Records of conversations, semi-structured interviews, and FGDs.
• Records of observations in the forms of pictures, products and diagrams.
5. How can the government further support and facilitate the implementation of the LLSE in future?
• Document analyses
• Interviews• Observations
• Semi-structured interviews
• FGDs
• Policy documents, including government educational law, official mandates, decrees, official reports, statistics and curriculum materials.
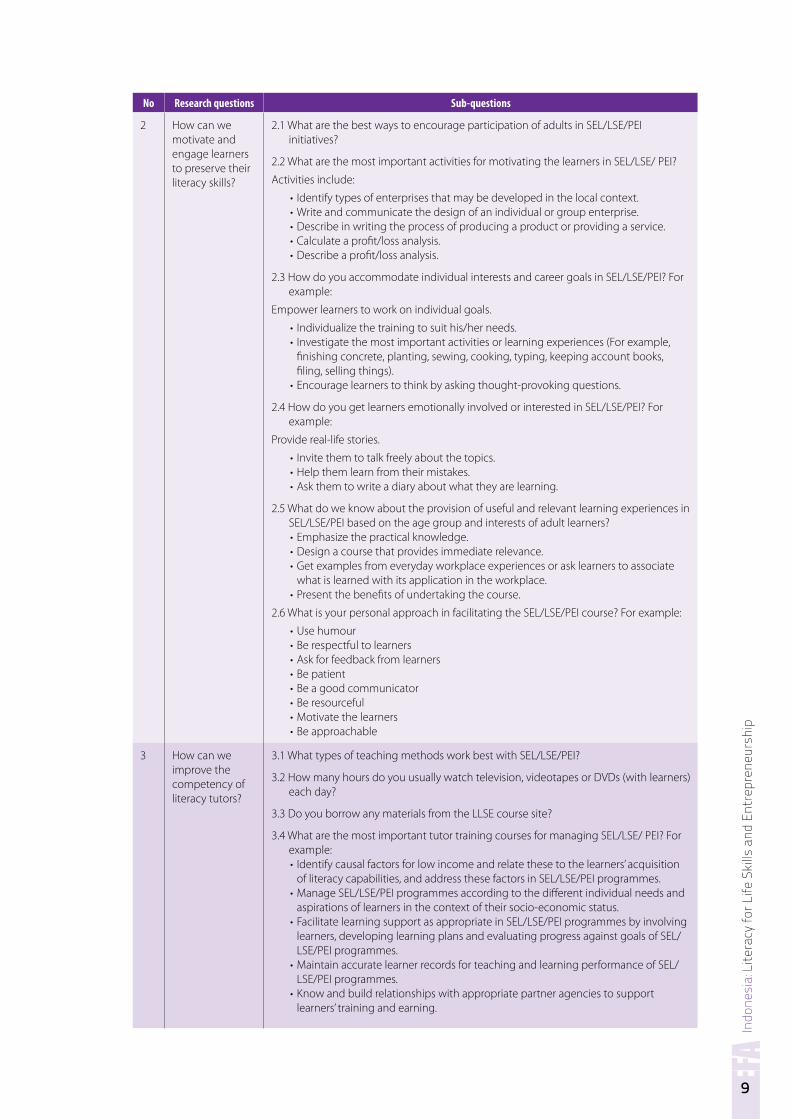
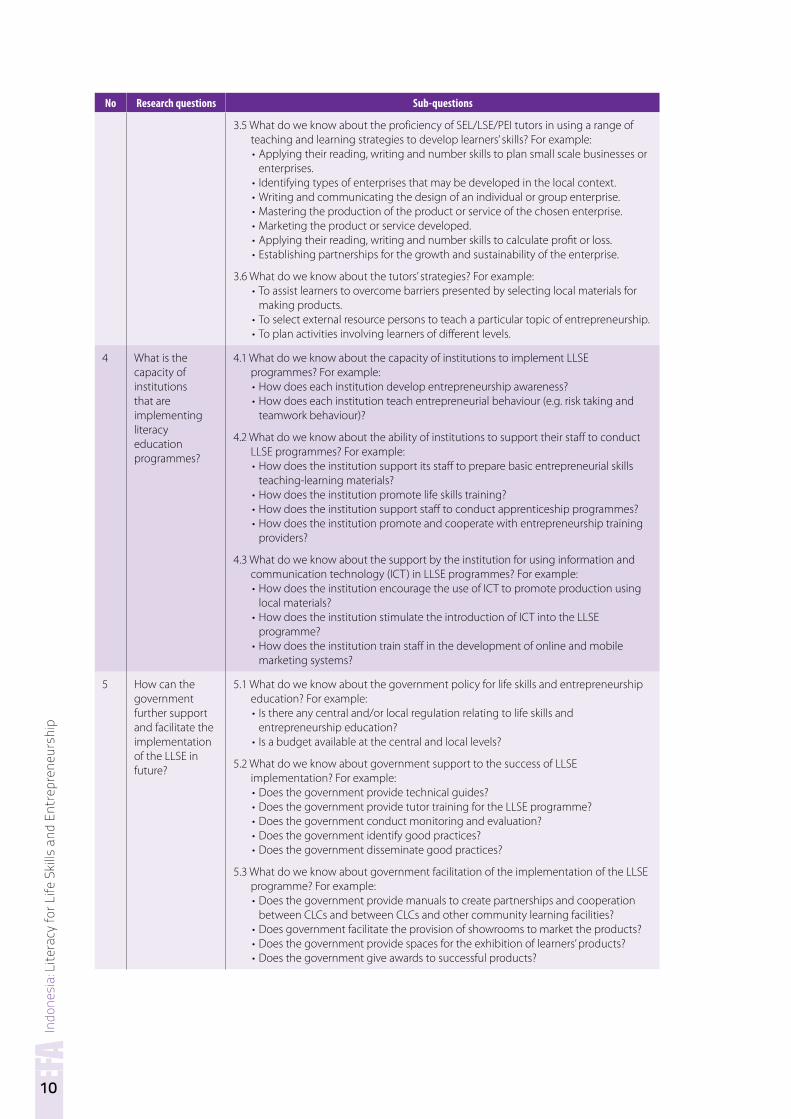
The interview questions and questionnaire questions were derived from the original research questions. Table 1.2. lists the research questions and their respective sub-questions.
Table 1.2: The research questions and their respective sub-questions
No Research questions Sub-questions
1 How do learners’ new literacy skills contribute to alleviation of their poverty?
1.1 What do we know about the literacy proficiency of adult learners?
1.2 What do we know about the proficiency of adult learners in terms of the following initiatives (which, combined, form the LLSE programme): the Self-Entrepreneurship Literacy (SEL) initiative, the Life Skills Education (LSE) initiative, and the Piloting Entrepreneurship Incubator (PEI) initiative?
1.3 How does literacy proficiency change learners’ capacity over the course of the programme?
1.4 How does SEL/LSE/PEI training change learners’ earning capacity?
1.5 As a facilitator do you give any income to participants of the SEL/LSE/PEI who produces a good product?
1.6 How do SEL/LSE/PEI proficiency levels affect the likelihood of getting a job?
1.7 What do we know about the relation between literacy rate and poverty rate?
Indo
nesi
a: L
itera
cy fo
r Life
Ski
lls a
nd E
ntre
pren
eurs
hip
9
No Research questions Sub-questions
2 How can we motivate and engage learners to preserve their literacy skills?
2.1 What are the best ways to encourage participation of adults in SEL/LSE/PEI initiatives?
2.2 What are the most important activities for motivating the learners in SEL/LSE/ PEI?
Activities include:
• Identify types of enterprises that may be developed in the local context. • Write and communicate the design of an individual or group enterprise.• Describe in writing the process of producing a product or providing a service. • Calculate a profit/loss analysis.• Describe a profit/loss analysis.
2.3 How do you accommodate individual interests and career goals in SEL/LSE/PEI? For example:
Empower learners to work on individual goals.
• Individualize the training to suit his/her needs.• Investigate the most important activities or learning experiences (For example,
finishing concrete, planting, sewing, cooking, typing, keeping account books, filing, selling things).
• Encourage learners to think by asking thought-provoking questions.
2.4 How do you get learners emotionally involved or interested in SEL/LSE/PEI? For example:
Provide real-life stories.
• Invite them to talk freely about the topics.• Help them learn from their mistakes.• Ask them to write a diary about what they are learning.
2.5 What do we know about the provision of useful and relevant learning experiences in SEL/LSE/PEI based on the age group and interests of adult learners?• Emphasize the practical knowledge.• Design a course that provides immediate relevance.• Get examples from everyday workplace experiences or ask learners to associate
what is learned with its application in the workplace.• Present the benefits of undertaking the course.
2.6 What is your personal approach in facilitating the SEL/LSE/PEI course? For example:
• Use humour • Be respectful to learners• Ask for feedback from learners• Be patient• Be a good communicator• Be resourceful• Motivate the learners• Be approachable
3 How can we improve the competency of literacy tutors?
3.1 What types of teaching methods work best with SEL/LSE/PEI?
3.2 How many hours do you usually watch television, videotapes or DVDs (with learners) each day?
3.3 Do you borrow any materials from the LLSE course site?
3.4 What are the most important tutor training courses for managing SEL/LSE/ PEI? For example: • Identify causal factors for low income and relate these to the learners’ acquisition
of literacy capabilities, and address these factors in SEL/LSE/PEI programmes.• Manage SEL/LSE/PEI programmes according to the different individual needs and
aspirations of learners in the context of their socio-economic status. • Facilitate learning support as appropriate in SEL/LSE/PEI programmes by involving
learners, developing learning plans and evaluating progress against goals of SEL/LSE/PEI programmes.
• Maintain accurate learner records for teaching and learning performance of SEL/LSE/PEI programmes.
• Know and build relationships with appropriate partner agencies to support learners’ training and earning.
Indo
nesi
a: L
itera
cy fo
r Life
Ski
lls a
nd E
ntre
pren
eurs
hip
10
No Research questions Sub-questions
3.5 What do we know about the proficiency of SEL/LSE/PEI tutors in using a range of teaching and learning strategies to develop learners’ skills? For example:• Applying their reading, writing and number skills to plan small scale businesses or
enterprises. • Identifying types of enterprises that may be developed in the local context. • Writing and communicating the design of an individual or group enterprise.• Mastering the production of the product or service of the chosen enterprise.• Marketing the product or service developed. • Applying their reading, writing and number skills to calculate profit or loss.• Establishing partnerships for the growth and sustainability of the enterprise.
3.6 What do we know about the tutors’ strategies? For example:• To assist learners to overcome barriers presented by selecting local materials for
making products.• To select external resource persons to teach a particular topic of entrepreneurship. • To plan activities involving learners of different levels.
4 What is the capacity of institutions that are implementing literacy education programmes?
4.1 What do we know about the capacity of institutions to implement LLSE programmes? For example:• How does each institution develop entrepreneurship awareness? • How does each institution teach entrepreneurial behaviour (e.g. risk taking and
teamwork behaviour)?
4.2 What do we know about the ability of institutions to support their staff to conduct LLSE programmes? For example:• How does the institution support its staff to prepare basic entrepreneurial skills
teaching-learning materials? • How does the institution promote life skills training?• How does the institution support staff to conduct apprenticeship programmes?• How does the institution promote and cooperate with entrepreneurship training
providers?
4.3 What do we know about the support by the institution for using information and communication technology (ICT) in LLSE programmes? For example:• How does the institution encourage the use of ICT to promote production using
local materials? • How does the institution stimulate the introduction of ICT into the LLSE
programme?• How does the institution train staff in the development of online and mobile
marketing systems?
5 How can the government further support and facilitate the implementation of the LLSE in future?
5.1 What do we know about the government policy for life skills and entrepreneurship education? For example:• Is there any central and/or local regulation relating to life skills and
entrepreneurship education?• Is a budget available at the central and local levels?
5.2 What do we know about government support to the success of LLSE implementation? For example:• Does the government provide technical guides?• Does the government provide tutor training for the LLSE programme?• Does the government conduct monitoring and evaluation? • Does the government identify good practices?• Does the government disseminate good practices?
5.3 What do we know about government facilitation of the implementation of the LLSE programme? For example:• Does the government provide manuals to create partnerships and cooperation
between CLCs and between CLCs and other community learning facilities?• Does government facilitate the provision of showrooms to market the products?• Does the government provide spaces for the exhibition of learners’ products?• Does the government give awards to successful products?
Indo
nesi
a: L
itera
cy fo
r Life
Ski
lls a
nd E
ntre
pren
eurs
hip
11
Progress in Indonesia towards achieving the EFA Goals
2.1 IntroductionThis section examines Indonesia’s overall achievements, so far, in terms of achieving the six EFA Goals as described in the Dakar Framework for Action (UNESCO, 2000). These goals are listed below.
Goal 1: Expanding and improving comprehensive early childhood care and education, especially for the most vulnerable and disadvantaged children
Goal 2: Ensuring that by 2015 all children, particularly girls, children in difficult circumstances and those belonging to ethnic minorities, have access to, and complete, free and compulsory primary education of good quality.
Goal 3: Ensuring that the learning needs of all young people and adults are met through equitable access to appropriate learning and life-skills programmes
Goal 4: Achieving a 50 per cent improvement in levels of adult literacy by 2015, especially for women, and equitable access to basic and continuing education for all adults.
Goal 5: Eliminating gender disparities in primary and secondary education by 2005, and achieving gender equality in education by 2015, with a focus on ensuring girls’ full and equal access to and achievement in basic education of good quality.
Goal 6: Improving all aspects of the quality of education and ensuring excellence of all so that recognized and measurable learning outcomes are achieved by all, especially in literacy, numeracy and essential life skills.
Following the World Education Forum in Dakar in 2000, the Government of Indonesia established the Education for All Coordination Forum. This forum was formed in response to requests from the governors, regents and mayors throughout Indonesia and was established by the Minister of Welfare, through Decree B.10/MENKOKESRA/I/2003, on 27 January 2003.
The Education for All Coordination Forum comprises state ministries and government agencies as well as civil society organizations. It was established to synergize, encourage, coordinate, supervise and evaluate the implementation of EFA initiatives at the national, provincial and city/district levels.
The forum has five major functions (Ministry of Public Welfare, 2003):
• To formulate programmes, stages, procedures, implementation and development of EFA activities in accordance with the situation and conditions of the working areas.
• To prepare long-, medium- and short-term EFA Action Plans.
2
Indo
nesi
a: L
itera
cy fo
r Life
Ski
lls a
nd E
ntre
pren
eurs
hip
12
• To build coordination, consolidation, socialization, dissemination and advocacy among stakeholders and with the entire community.
• To conduct monitoring and evaluation activities relating to the implementation of the six EFA goals.
• To submit periodic reports and reviews regarding the implementation of EFA initiatives at the district (or city), provincial and national levels.
The Coordination Forum has six working groups, namely the Early Childhood Education (ECE) working group, the Basic Education working group, the Life Skills Education working group, the Literacy Education working group, the Gender Mainstreaming working group and the Education Quality Improvement working group.
The following sections discuss the achievements and challenges in each of the six fields.
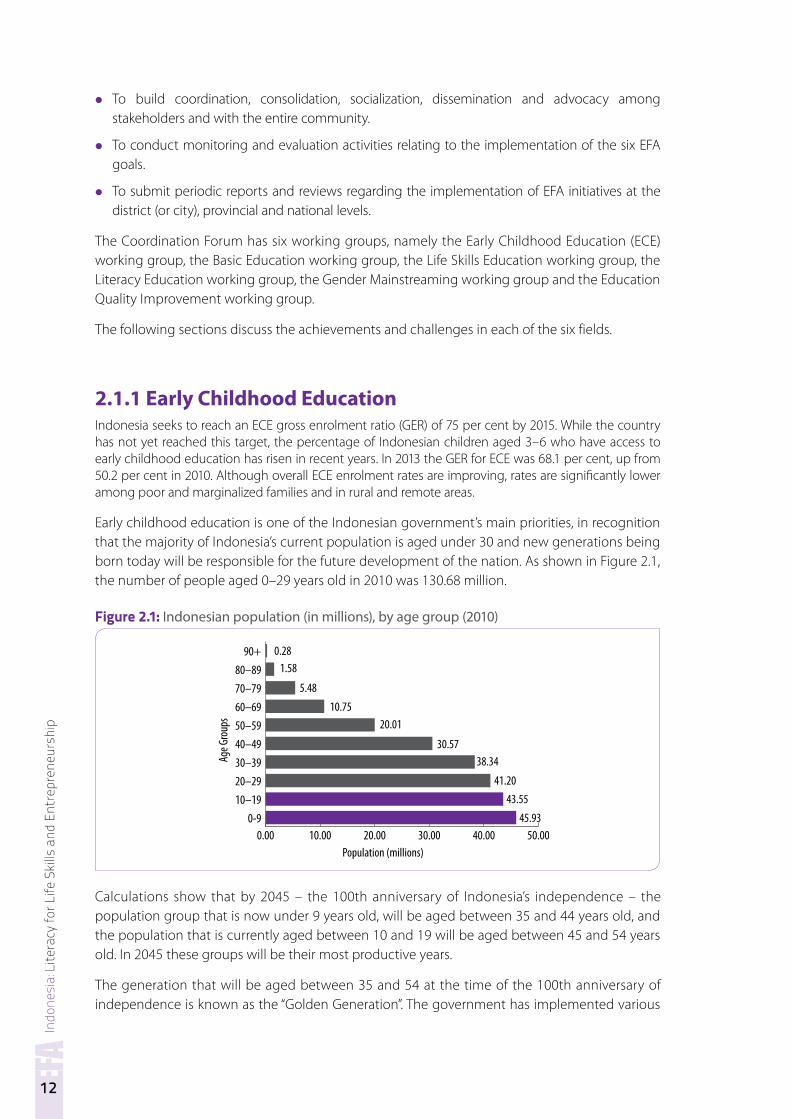
2 1 1 Early Childhood EducationIndonesia seeks to reach an ECE gross enrolment ratio (GER) of 75 per cent by 2015. While the country has not yet reached this target, the percentage of Indonesian children aged 3–6 who have access to early childhood education has risen in recent years. In 2013 the GER for ECE was 68.1 per cent, up from 50.2 per cent in 2010. Although overall ECE enrolment rates are improving, rates are significantly lower among poor and marginalized families and in rural and remote areas.
Early childhood education is one of the Indonesian government’s main priorities, in recognition that the majority of Indonesia’s current population is aged under 30 and new generations being born today will be responsible for the future development of the nation. As shown in Figure 2.1, the number of people aged 0–29 years old in 2010 was 130.68 million.
Figure 2.1: Indonesian population (in millions), by age group (2010)
0.00 10.00 20.00 30.00 40.00 50.000-9
10–1920–2930–3940–4950–5960–6970–7980–89
90+
Age G
roup
s
Population (millions)
0.281.58
5.48
10.7520.01
30.5738.34
41.2043.55
45.93
Calculations show that by 2045 – the 100th anniversary of Indonesia’s independence – the population group that is now under 9 years old, will be aged between 35 and 44 years old, and the population that is currently aged between 10 and 19 will be aged between 45 and 54 years old. In 2045 these groups will be their most productive years.
The generation that will be aged between 35 and 54 at the time of the 100th anniversary of independence is known as the “Golden Generation”. The government has implemented various
Indo
nesi
a: L
itera
cy fo
r Life
Ski
lls a
nd E
ntre
pren
eurs
hip
13
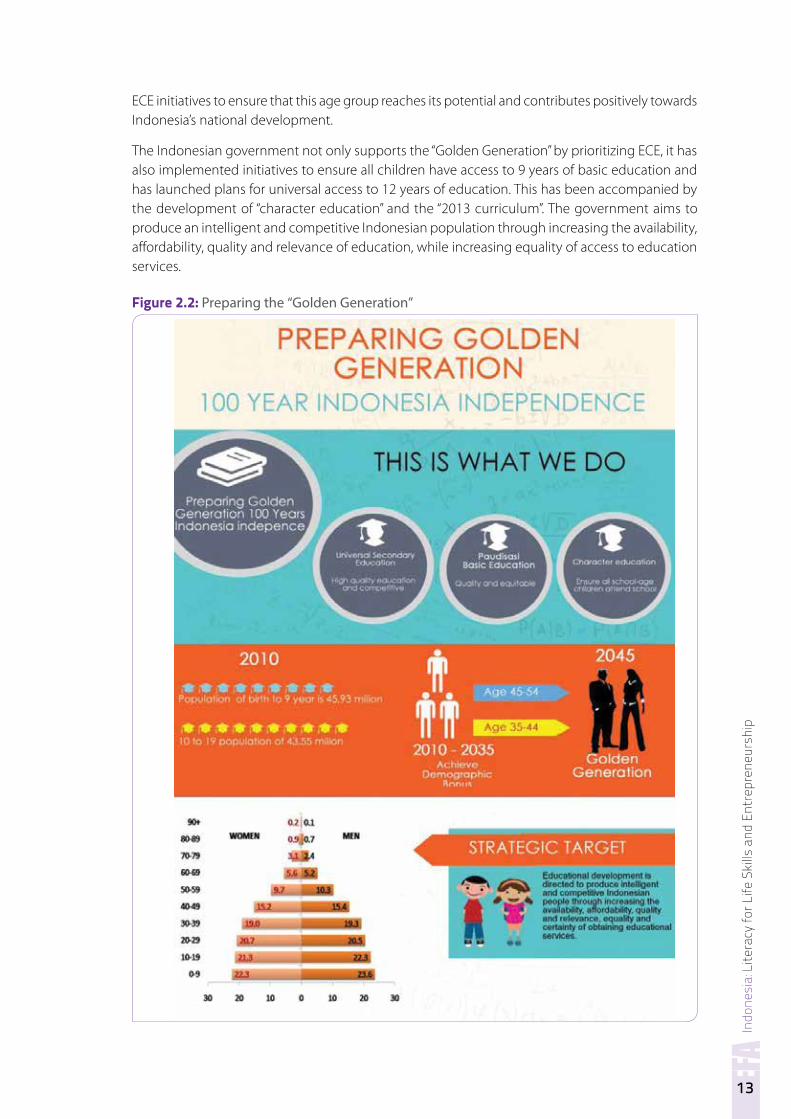
ECE initiatives to ensure that this age group reaches its potential and contributes positively towards Indonesia’s national development.
The Indonesian government not only supports the “Golden Generation” by prioritizing ECE, it has also implemented initiatives to ensure all children have access to 9 years of basic education and has launched plans for universal access to 12 years of education. This has been accompanied by the development of “character education” and the “2013 curriculum”. The government aims to produce an intelligent and competitive Indonesian population through increasing the availability, affordability, quality and relevance of education, while increasing equality of access to education services.
Figure 2.2: Preparing the “Golden Generation”
Indo
nesi
a: L
itera
cy fo
r Life
Ski
lls a
nd E
ntre
pren
eurs
hip
14
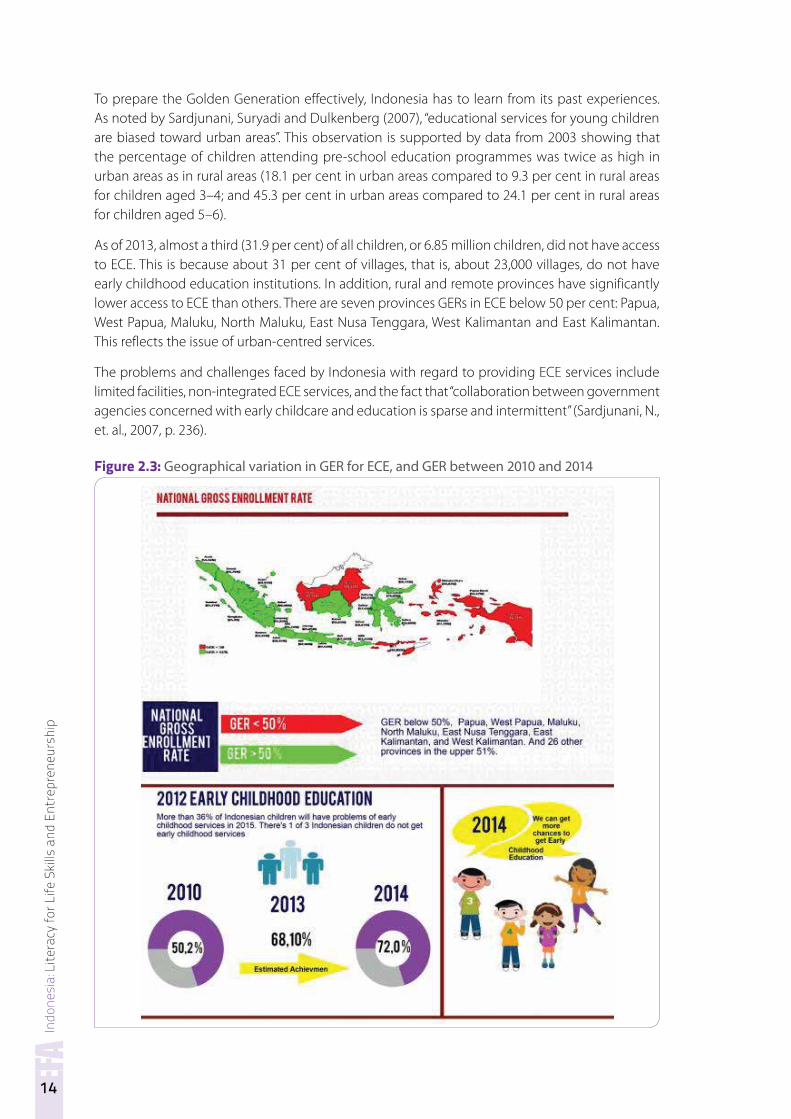
To prepare the Golden Generation effectively, Indonesia has to learn from its past experiences. As noted by Sardjunani, Suryadi and Dulkenberg (2007), “educational services for young children are biased toward urban areas”. This observation is supported by data from 2003 showing that the percentage of children attending pre-school education programmes was twice as high in urban areas as in rural areas (18.1 per cent in urban areas compared to 9.3 per cent in rural areas for children aged 3–4; and 45.3 per cent in urban areas compared to 24.1 per cent in rural areas for children aged 5–6).
As of 2013, almost a third (31.9 per cent) of all children, or 6.85 million children, did not have access to ECE. This is because about 31 per cent of villages, that is, about 23,000 villages, do not have early childhood education institutions. In addition, rural and remote provinces have significantly lower access to ECE than others. There are seven provinces GERs in ECE below 50 per cent: Papua, West Papua, Maluku, North Maluku, East Nusa Tenggara, West Kalimantan and East Kalimantan. This reflects the issue of urban-centred services.
The problems and challenges faced by Indonesia with regard to providing ECE services include limited facilities, non-integrated ECE services, and the fact that “collaboration between government agencies concerned with early childcare and education is sparse and intermittent” (Sardjunani, N., et. al., 2007, p. 236).
Figure 2.3: Geographical variation in GER for ECE, and GER between 2010 and 2014
Indo
nesi
a: L
itera
cy fo
r Life
Ski
lls a
nd E
ntre
pren
eurs
hip
15
In 2013, the President of Indonesia issued Presidential Decree 60/2013, which emphasizes the importance of holistic and integrated approaches to early childhood development and calls for the provision of an array of services, including health, nutrition, education, protection and parental skills training as part of the delivery of early childhood care and education programmes. In accordance with this decree, all families have the right to subsidized ECE services. The decree aims to reduce rural-urban disparities and to prioritize resources for poor and marginalized children. Thus, marginalized children will have free access to ECE services.
To accelerate the ECE movement, the First Lady was appointed as the national “mother” of ECE (bunda PAUD nasional), and all the governors’ wives became “mothers” of ECE at the provincial level, while the wives of the mayors and regents became “mothers” of ECE at the city and district level.
2 1 2 Basic Education
Regarding the second EFA Goal (universal primary education), Indonesia set itself a primary school NER target of 95.23 per cent, to be achieved by 2015. The target has already been achieved at the national level, but it has not been achieved in each province and district.
The main challenges are (i) lack of access for all children to good quality primary education, (ii) the difficulty of reaching students in remote and border areas, and (iii) the variation in quality and equality of teacher distribution across the country.
Another issue affecting primary school NERs is that of “early entry”. This occurs when parents send children under the age of 7 to primary school and when children aged 12 are already enrolled in junior secondary school.
In Indonesia, sekolah dasar (SD), primary schools, provide basic education in for children aged 7–12 years. These services are also provided through madrasah ibtidaiyah (MI), the primary level of Islamic schools, and through “Package A” education facilities (equivalent to primary school). For children aged 13–15 years, basic education is provided through sekolah menengah pertama (SMP), junior secondary schools, as well as through madrasah tsanawiyah (MT), which are junior secondary Islamic schools, and “Package B” facilities (equivalent to junior secondary school).
The national NER for primary school level (SD, MI and Package A) was 95.8 per cent in 2012. As noted above, this rate is higher than the NER target for 2015, which is 95.23 per cent. The GER for primary school (SD, MI and Package A) was 116.2 per cent in 2012 and the target GER for 2015 is 119.1 per cent.
In 2012, the NER for junior secondary school level (SMP/MT/Package B) was 78.8 per cent, which exceeds the target of 76.8 per cent, and the GER was 103.9 per cent.
© M
inistr
y of E
duca
tion a
nd Cu
lture,
Repu
blic o
f Indo
nesia
Indo
nesi
a: L
itera
cy fo
r Life
Ski
lls a
nd E
ntre
pren
eurs
hip
16
As noted earlier for ECE, the enrolment rates for primary and secondary school vary between provinces and there is a gap in access to education between rural and urban areas. In 2011, only 68.5 per cent of the provinces had achieved the target NER for primary school level (SD, MI, or Package A) of ≥ 95 per cent, and only 74.2 per cent of provinces had achieved the GER target for junior secondary school level (SMP, MT or Package B) of ≥ 95 per cent. In rural and remote areas, the percentage of children without access to primary and secondary education is significantly higher than that found in urban areas; and in rural areas girls and the extremely poor segments of the population are particularly disadvantaged. It is estimated that more than 1.75 million Indonesian children aged 13–15 are not in junior secondary school or equivalent education programmes.
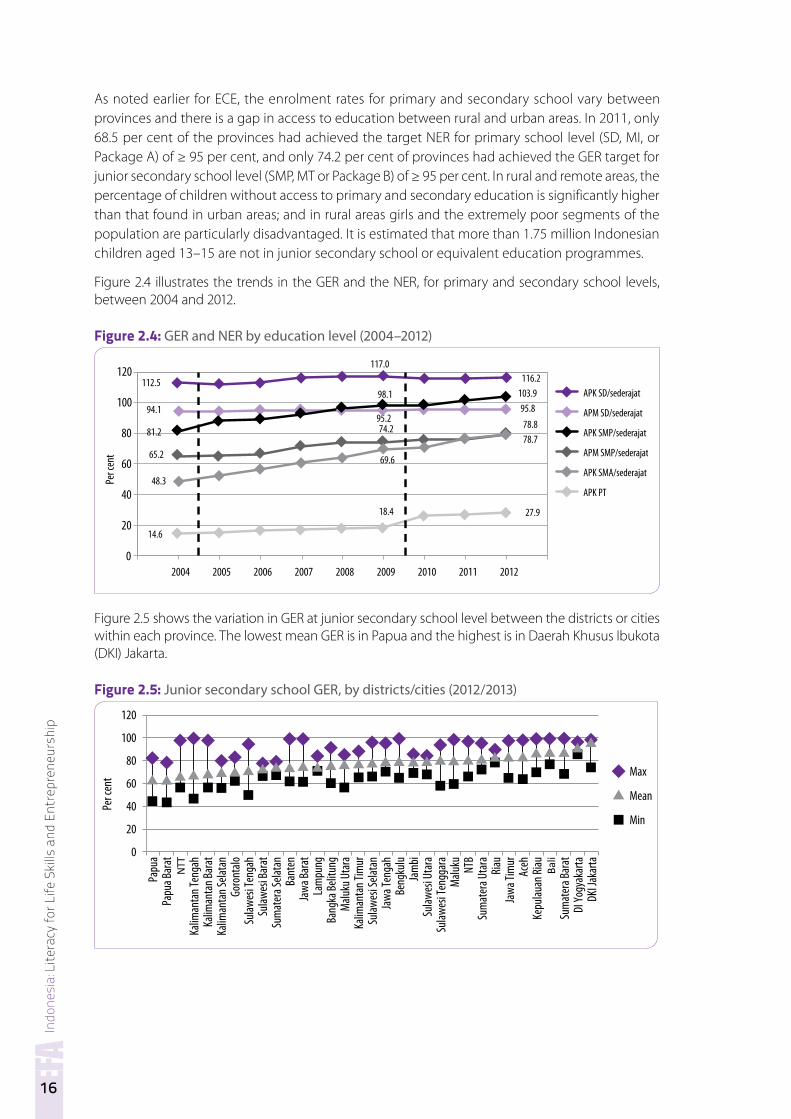
Figure 2.4 illustrates the trends in the GER and the NER, for primary and secondary school levels, between 2004 and 2012.
Figure 2.4: GER and NER by education level (2004–2012)
94.195.2
95.8
112.5
117.0116.2
65.2
74.2 78.881.2
98.1 103.9
48.3
69.6
78.7
14.6
18.4 27.9
0
20
40
60
80
100
120
2004
Per c
ent
2005 2006 2007 2008 2009 2010 2011 2012
APM SD/sederajat
APK SD/sederajat
APM SMP/sederajat
APK SMP/sederajat
APK SMA/sederajat
APK PT
Figure 2.5 shows the variation in GER at junior secondary school level between the districts or cities within each province. The lowest mean GER is in Papua and the highest is in Daerah Khusus Ibukota (DKI) Jakarta.
Figure 2.5: Junior secondary school GER, by districts/cities (2012/2013)
0
20
40
60
80
100
120
Papu
a
Per c
ent
Papu
a Bar
atNT
TKa
liman
tan T
enga
hKa
liman
tan B
arat
Kalim
anta
n Sela
tan
Goro
ntalo
Sulaw
esi T
enga
hSu
lawes
i Bar
atSu
mat
era S
elata
nBa
nten
Jawa
Bara
tLa
mpu
ngBa
ngka
Belit
ung
Malu
ku U
tara
Kalim
anta
n Tim
urSu
lawes
i Sela
tan
Jawa
Teng
ahBe
ngku
luJa
mbi
Sulaw
esi U
tara
Sulaw
esi T
engg
ara
Malu
ku NTB
Sum
ater
a Uta
raRi
auJa
wa Ti
mur
Aceh
Kepu
lauan
Riau Bali
Sum
ater
a Bar
atDI
Yogy
akar
taDK
I Jak
arta
Max
Mean
Min
Indo
nesi
a: L
itera
cy fo
r Life
Ski
lls a
nd E
ntre
pren
eurs
hip
17
Recognizing the issues in terms of unequal access to good quality education, the priorities for basic education are as listed below.
• Improve access, quality and relevance of basic education for all children, especially targeting the poor, remote, and marginalized communities.
• Increase actions for more efficient and effective management of education resources.
• Create a national movement in support of the completion of basic education by all children, involving parents and community leaders, NGOs and the private sector.
• Give more opportunities to private schools and community-based educational institutions to provide basic education. This includes alternative education programmes, to reach the unreached, poor and remote communities and to improve equity in access to basic education.
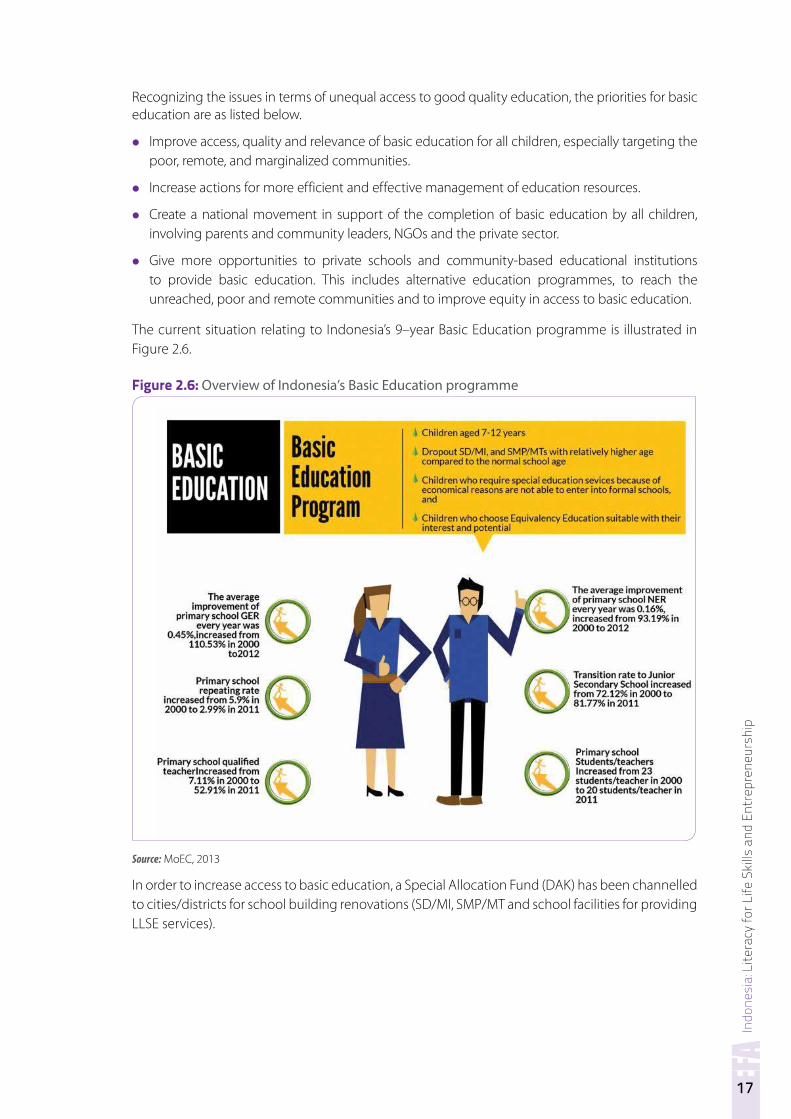
The current situation relating to Indonesia’s 9–year Basic Education programme is illustrated in Figure 2.6.
Figure 2.6: Overview of Indonesia’s Basic Education programme
Source: MoEC, 2013
In order to increase access to basic education, a Special Allocation Fund (DAK) has been channelled to cities/districts for school building renovations (SD/MI, SMP/MT and school facilities for providing LLSE services).
Indo
nesi
a: L
itera
cy fo
r Life
Ski
lls a
nd E
ntre
pren
eurs
hip
18
2 1 3 Life Skills and Vocational Education
Between 2005 and 2009, Indonesia shifted its focus from preparing senior secondary students for higher education to preparing them to enter the world of work. Thus, the focus shifted from students enrolled in sekolah menengah atas (SMA), senior secondary schools, to students enrolled in sekolah menengah kejuruan (SMK), senior secondary vocational schools. This policy shift aimed to increase the relevance of secondary school education and to improve the life skills and vocational skills of Indonesian youth. According to the National Strategic Plan 2005–2010 of the Ministry of National Education (MoNE), the goal is to achieve a ratio of students in SMA and SMK of 30:70 by 2015. This goal is to be achieved by increasing access to community colleges. Greater access to non-formal education through community empowerment training courses will be provided to ensure students gain practical and applied skills.
Whether or not the ratio target will be achieved, the aim of more relevant and useful education is likely to have significant benefits for secondary-level students. The shift in policy puts more emphasis on the gaining of specific skills and on improving linkages with industry. In SMKs, subjects such as business and economics will be offered, as well as strengthened computing subjects and English, and students will be supported by internships in relevant economic sectors.
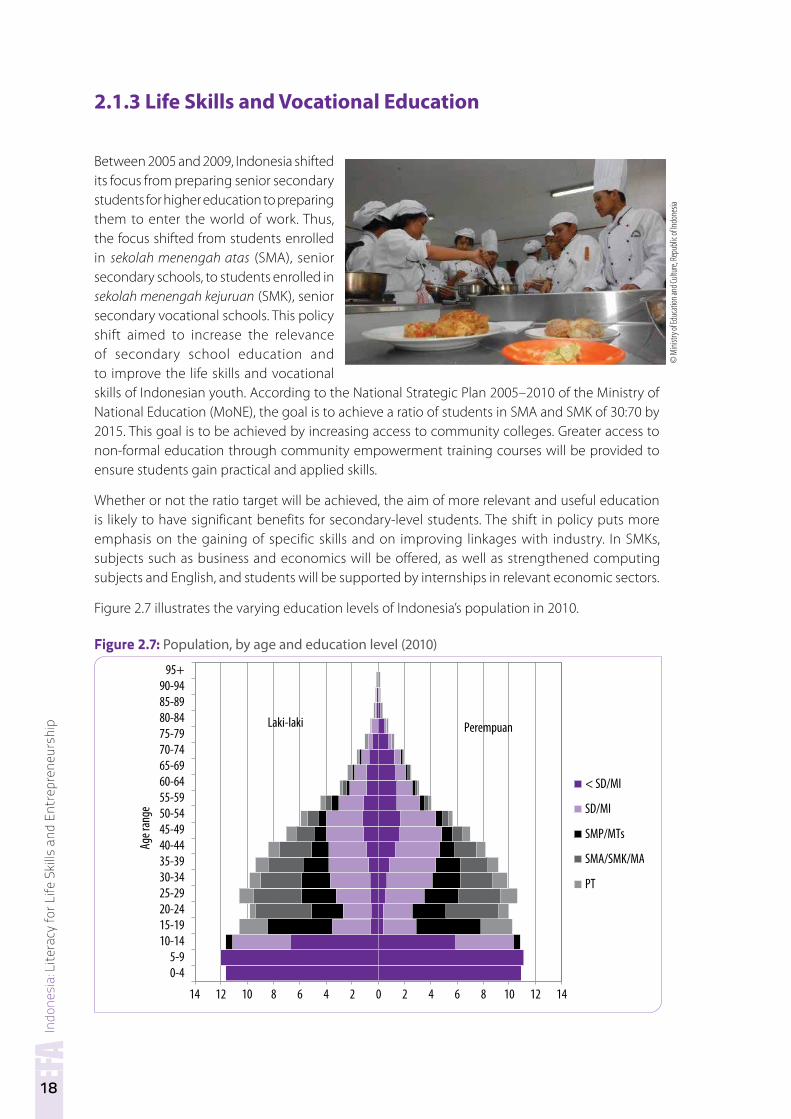
Figure 2.7 illustrates the varying education levels of Indonesia’s population in 2010.
Figure 2.7: Population, by age and education level (2010)
14 12 10 8 6 4 2 0 2 4 6 8 10 12 14
0-45-9
10-1415-1920-2425-2930-3435-3940-4445-4950-5455-5960-6465-6970-7475-7980-8485-8990-94
95+
< SD/MI
Age r
ange SD/MI
SMP/MTs
SMA/SMK/MA
PT
PerempuanLaki-laki
© M
inistr
y of E
duca
tion a
nd Cu
lture,
Repu
blic o
f Indo
nesia
Indo
nesi
a: L
itera
cy fo
r Life
Ski
lls a
nd E
ntre
pren
eurs
hip
19
In Indonesia, unemployment among educated youth is higher in urban areas than in rural areas. This is because there are fewer educated youth in rural areas, and because rural youth tend to be employed in the types of jobs that do not need higher skills. According to the Badan Pusat Statistik (BPS), the National Bureau of Statistics, “skilled” jobs are defined as those usually requiring a senior secondary education or higher qualification, including managerial, skilled production, office, administration and sales positions. “Unskilled” jobs include manual labour, transportation and factory work (2010).
According to the National Action Plan, Indonesia’s Life Skills and Vocational Education programme aims to:
• Produce a qualified workforce, ready to work and/or run their own businesses (entrepreneurship).
• Increase the productivity of workers to produce goods and services based on market demand.
• Develop business activities managed by the public.
• Improve public health and avoid drug abuse and HIV and AIDS.
• Decrease unemployment to reduce poverty.
Life skills and vocational education is provided through both formal and non-formal education facilities. Formal education facilities provide technical and vocational education through SMK. The most popular vocational education programmes offered in formal schools are technology and industry, business management and tourism. Other popular subjects are agriculture, social welfare, arts and crafts, forestry, and marine studies.
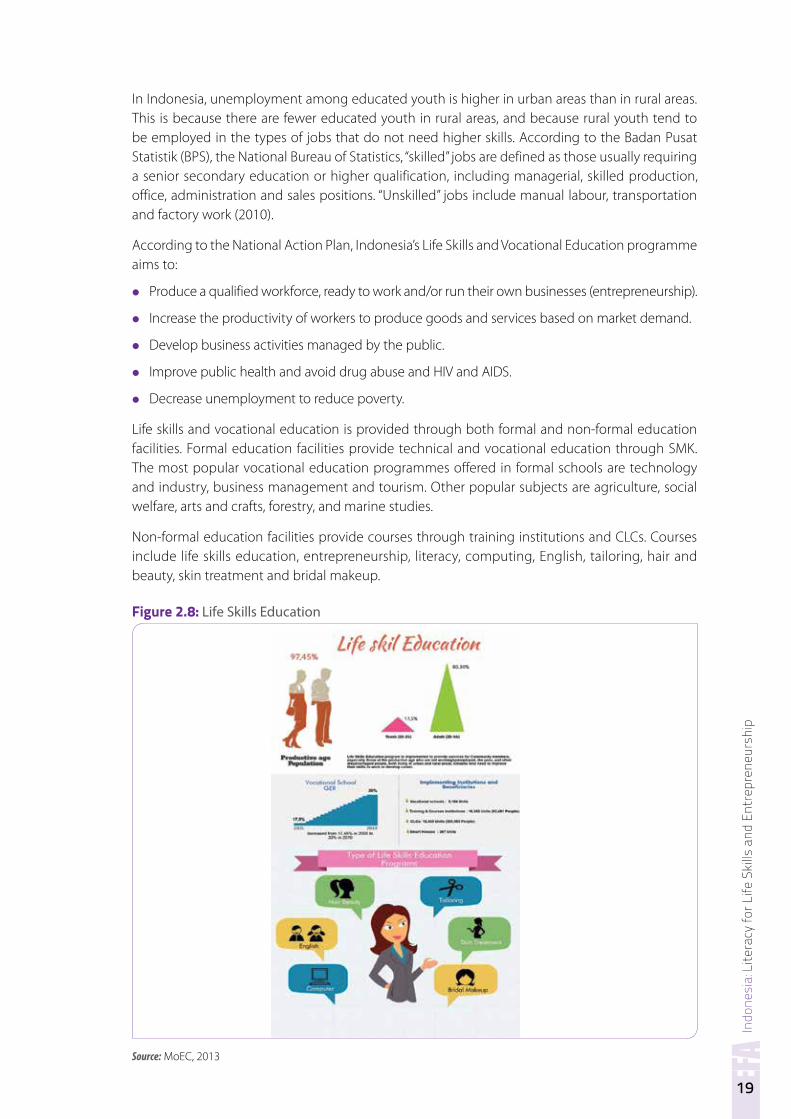
Non-formal education facilities provide courses through training institutions and CLCs. Courses include life skills education, entrepreneurship, literacy, computing, English, tailoring, hair and beauty, skin treatment and bridal makeup.
Figure 2.8: Life Skills Education
Source: MoEC, 2013
Indo
nesi
a: L
itera
cy fo
r Life
Ski
lls a
nd E
ntre
pren
eurs
hip
20
The number of formal vocational schools increased significantly in the five years between 2006 and 2011, rising from 6,025 schools in 2005/2006 to 9,164 schools in 2010/2011. The GER of vocational schools also increased, rising from 17.45 per cent in 2005/2006 to 30 per cent in 2010/2011. These figures indicate significant support from both the government and society for the development of life skills and vocational skills.
In non-formal education, the number of training institutions and CLCs increased over the three years between 2009 and 2011, with the number of training institutions growing from 12,070 in 2009 to 16,353 in 2011, and the number of CLCs growing from 6,500 in 2009 to 18,439 in 2011. In addition, “Smart Houses”, which provide life skills education through the LLSE programme, increased from an initial 10 Smart Houses in 2010 to 367 in 2013.
The number of students enrolled in training institutions and CLCs has likewise increased, rising from 43,275 in 2006 to 60,491 in 2012 and then to 32,000 in 2013. The total number of students enrolled in non-formal training institutions in the six years between 2006 and 2012 was 563,821.
The number of vocational school teachers has also risen, increasing from 127,024 in 1999/2000 to 165,400 in 2011/2012. The number of educators in non-formal institutions has also risen in recent years, increasing from 70,314 in 2009 to 107,573 in 2011. Likewise, the number of CLC educators has increased, rising from 22,161 in 2009 to 52,768 in 2011.
As of 2011, all formal vocational school teachers had higher-education degrees (bachelors, masters or doctorates). This was not the case just a few years previously. In 2009, 211,977 teachers (80.91 per cent) had a bachelor, master or doctorate degree, compared to 50,025 teachers (19.09 per cent) with a diploma. In 2011, the majority, 89.62 per cent, had bachelor degrees and the remainder (10.38 per cent) had masters and doctorates.
In non-formal education training institutes, many educators have higher-education degrees (bachelor, masters or doctorates), but almost half of the educators have only senior-secondary certificates or diplomas. In 2009, 52.32 per cent had degrees, while 32.39 per cent had senior secondary school certificates and 15.29 per cent had diplomas. In 2011, the figures were very similar, with 53.17 per cent having degrees, 32.30 per cent having senior secondary school certificates and 14.53 per cent having diplomas.
Similarly, at CLCs many educators have degrees. In 2009, 57.74 per cent had degrees, 28.20 per cent had senior secondary school certificates and 14.06 per cent had diplomas. In 2011, these figures had changed slightly, with 46.72 per cent of CLC educators having degrees, 31.51 per cent having senior secondary school certificates and 21.77 per cent having diplomas.
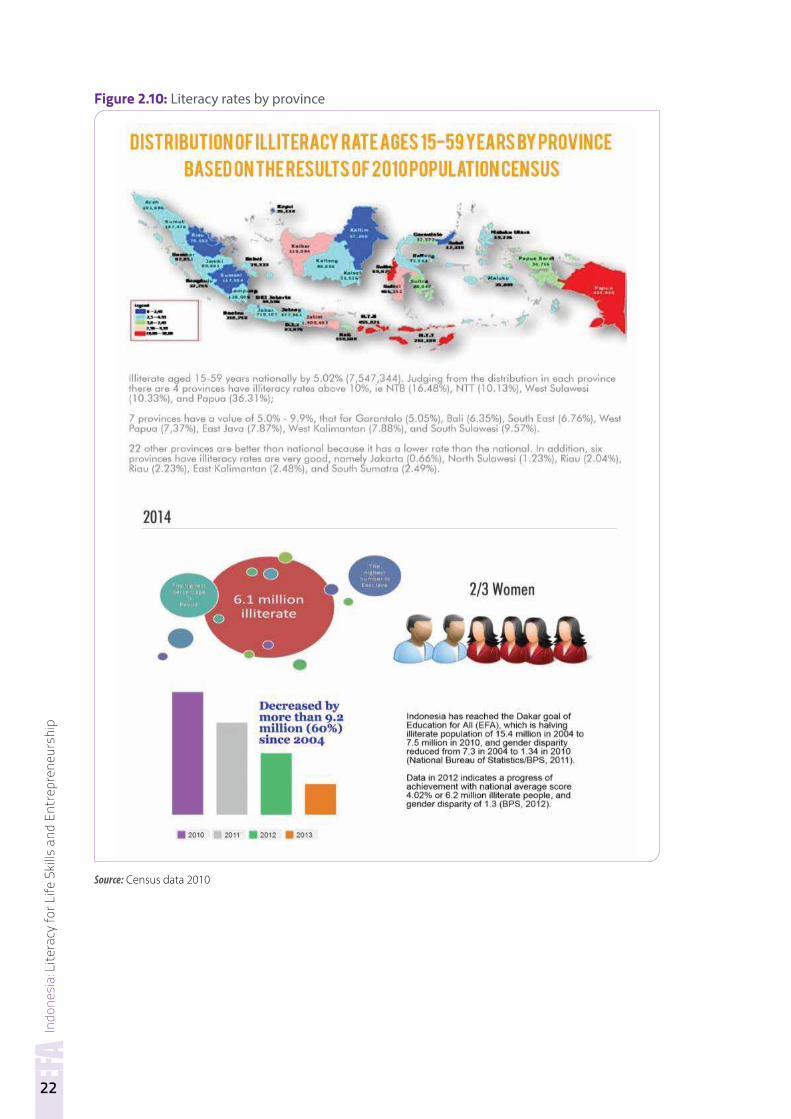
2 1 4 Literacy EducationLiteracy is an important tool to enable people to access information and knowledge for employment and a better life. Indonesia’s target adult literacy rate for 2015 is 94.7 per cent. The biggest challenge faced in reaching this target is to reduce the number of illiterates aged 45 years old and above.
In 2012, the literacy rate of the population aged 25–44 was 97.45 per cent, but the literacy rate for the population aged 45–59 was only 89.63 ©
Mini
stry o
f Edu
catio
n and
Cultu
re, Re
publi
c of In
done
sia
Indo
nesi
a: L
itera
cy fo
r Life
Ski
lls a
nd E
ntre
pren
eurs
hip
21
per cent. The youth literacy rate was 99.08 per cent in 2012, up from 98.51 per cent in 2010 (National Bureau of Statistics, 2012).
The Indonesian government’s efforts in addressing illiteracy were initiated with the issuing of Presidential Instruction 5/2006 on “The National Movement of Compulsory Nine-Year Basic Education and the Fight against Illiteracy”. In accordance with this, the Directorate of Community Education Development made the literacy programme a “National Movement”.
In response to the issue of “relapse” of literates into illiteracy, in 2008, the MoEC initiated various literacy programmes: including entrepreneurship literacy, reading programmes for post-literacy follow up, tutor training, character education and peace building. The literacy training initiative involved more than 4,155 personnel from CLCs, Community Reading Centres and Smart Houses. In addition to this training, the government also provided “competitive funding” for any institution that applied for training.
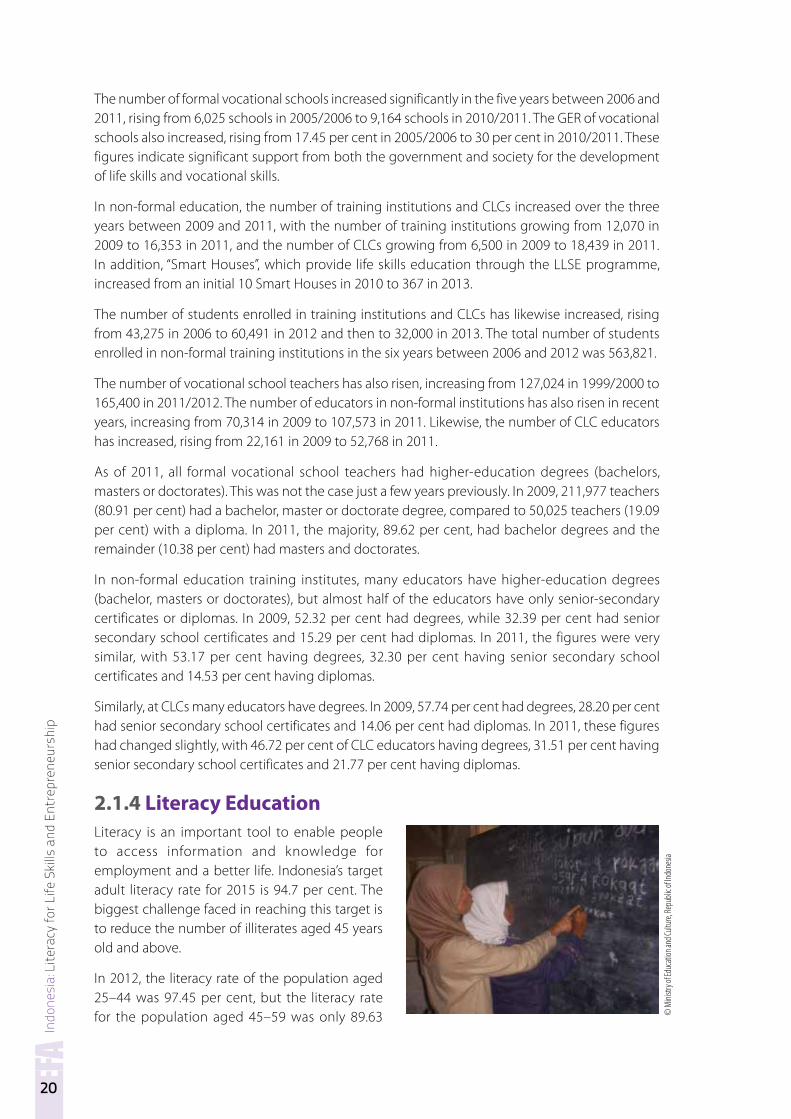
According to MoEC figures, in 2004 Indonesia had 15.41 million illiterates, representing 10.2 per cent of the adult population, and 64 per cent of the illiterates were female, two thirds of the illiterate population (BPS, 2011). Figure 2.9 shows the change in the number of illiterates between 2004 and 2012.
Figure 2.9: Adult illiteracy (2004–2012)
2004
15.4114.89
12.8811.82
9.768.7
7.56.7 6.4
4.214.435.025.35.97
7.28.07
9.5510.2
7.36.6
5.334.32
3.24 2.751.34
2.89 2.17
2005 2006 2007 2008 2009 2010 2011 2012
Percentage
Total number (in million)
Gender disparity
0
2
4
6
8
10
12
14
16
18
Source: BPS, 2011; MoEC, 2013.
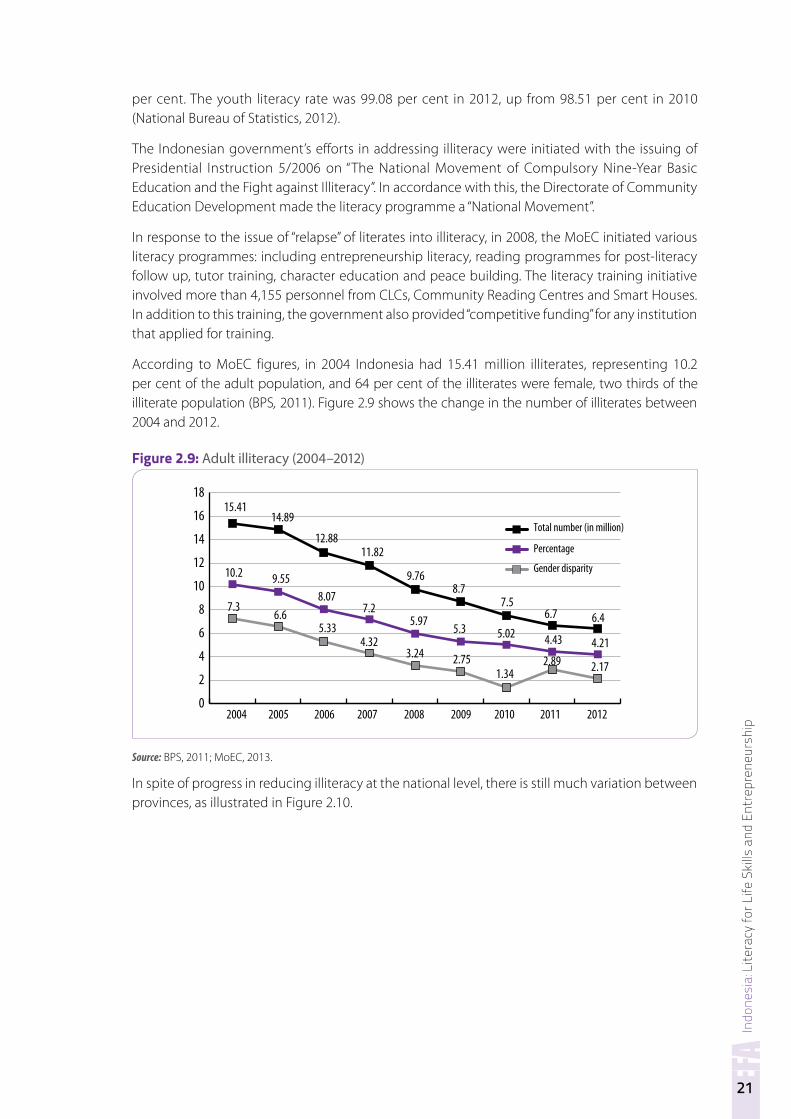
In spite of progress in reducing illiteracy at the national level, there is still much variation between provinces, as illustrated in Figure 2.10.
Indo
nesi
a: L
itera
cy fo
r Life
Ski
lls a
nd E
ntre
pren
eurs
hip
22
Figure 2.10: Literacy rates by province
Source: Census data 2010
Indo
nesi
a: L
itera
cy fo
r Life
Ski
lls a
nd E
ntre
pren
eurs
hip
23
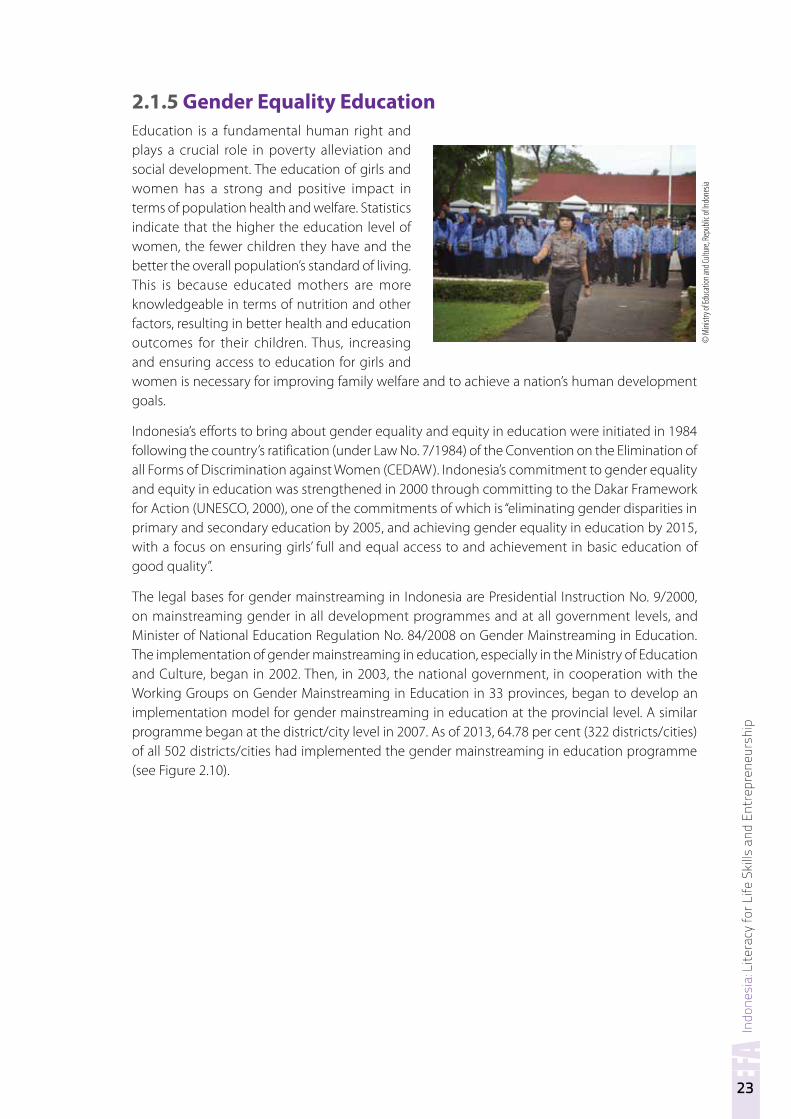
2 1 5 Gender Equality EducationEducation is a fundamental human right and plays a crucial role in poverty alleviation and social development. The education of girls and women has a strong and positive impact in terms of population health and welfare. Statistics indicate that the higher the education level of women, the fewer children they have and the better the overall population’s standard of living. This is because educated mothers are more knowledgeable in terms of nutrition and other factors, resulting in better health and education outcomes for their children. Thus, increasing and ensuring access to education for girls and women is necessary for improving family welfare and to achieve a nation’s human development goals.
Indonesia’s efforts to bring about gender equality and equity in education were initiated in 1984 following the country’s ratification (under Law No. 7/1984) of the Convention on the Elimination of all Forms of Discrimination against Women (CEDAW). Indonesia’s commitment to gender equality and equity in education was strengthened in 2000 through committing to the Dakar Framework for Action (UNESCO, 2000), one of the commitments of which is “eliminating gender disparities in primary and secondary education by 2005, and achieving gender equality in education by 2015, with a focus on ensuring girls’ full and equal access to and achievement in basic education of good quality”.
The legal bases for gender mainstreaming in Indonesia are Presidential Instruction No. 9/2000, on mainstreaming gender in all development programmes and at all government levels, and Minister of National Education Regulation No. 84/2008 on Gender Mainstreaming in Education. The implementation of gender mainstreaming in education, especially in the Ministry of Education and Culture, began in 2002. Then, in 2003, the national government, in cooperation with the Working Groups on Gender Mainstreaming in Education in 33 provinces, began to develop an implementation model for gender mainstreaming in education at the provincial level. A similar programme began at the district/city level in 2007. As of 2013, 64.78 per cent (322 districts/cities) of all 502 districts/cities had implemented the gender mainstreaming in education programme (see Figure 2.10).
© M
inistr
y of E
duca
tion a
nd Cu
lture,
Repu
blic o
f Indo
nesia
Indo
nesi
a: L
itera
cy fo
r Life
Ski
lls a
nd E
ntre
pren
eurs
hip
24
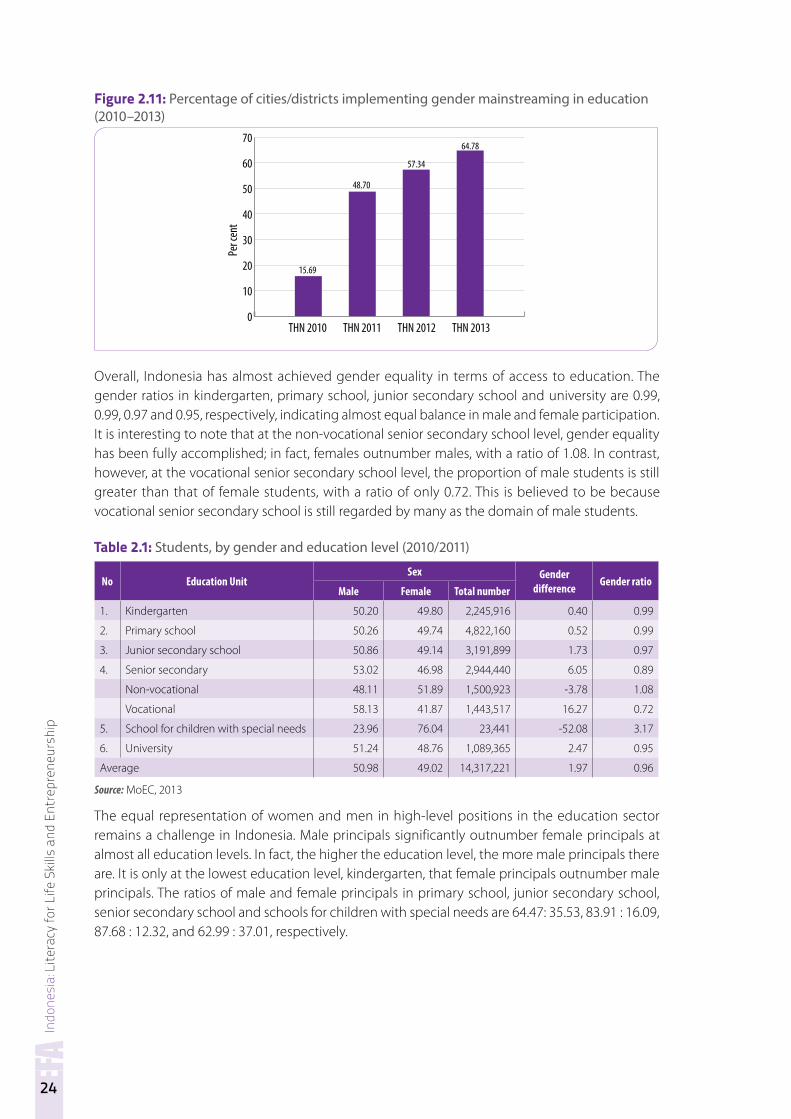
Figure 2.11: Percentage of cities/districts implementing gender mainstreaming in education (2010–2013)
0
10
20
30
40
50
60
70
THN 2010
Per c
ent
15.69
48.70
57.34
64.78
THN 2011 THN 2012 THN 2013
Overall, Indonesia has almost achieved gender equality in terms of access to education. The gender ratios in kindergarten, primary school, junior secondary school and university are 0.99, 0.99, 0.97 and 0.95, respectively, indicating almost equal balance in male and female participation. It is interesting to note that at the non-vocational senior secondary school level, gender equality has been fully accomplished; in fact, females outnumber males, with a ratio of 1.08. In contrast, however, at the vocational senior secondary school level, the proportion of male students is still greater than that of female students, with a ratio of only 0.72. This is believed to be because vocational senior secondary school is still regarded by many as the domain of male students.
Table 2.1: Students, by gender and education level (2010/2011)
No Education UnitSex Gender
difference Gender ratioMale Female Total number
1. Kindergarten 50.20 49.80 2,245,916 0.40 0.99
2. Primary school 50.26 49.74 4,822,160 0.52 0.99
3. Junior secondary school 50.86 49.14 3,191,899 1.73 0.97
4. Senior secondary 53.02 46.98 2,944,440 6.05 0.89
Non-vocational 48.11 51.89 1,500,923 -3.78 1.08
Vocational 58.13 41.87 1,443,517 16.27 0.72
5. School for children with special needs 23.96 76.04 23,441 -52.08 3.17
6. University 51.24 48.76 1,089,365 2.47 0.95
Average 50.98 49.02 14,317,221 1.97 0.96
Source: MoEC, 2013
The equal representation of women and men in high-level positions in the education sector remains a challenge in Indonesia. Male principals significantly outnumber female principals at almost all education levels. In fact, the higher the education level, the more male principals there are. It is only at the lowest education level, kindergarten, that female principals outnumber male principals. The ratios of male and female principals in primary school, junior secondary school, senior secondary school and schools for children with special needs are 64.47: 35.53, 83.91 : 16.09, 87.68 : 12.32, and 62.99 : 37.01, respectively.
Indo
nesi
a: L
itera
cy fo
r Life
Ski
lls a
nd E
ntre
pren
eurs
hip
25
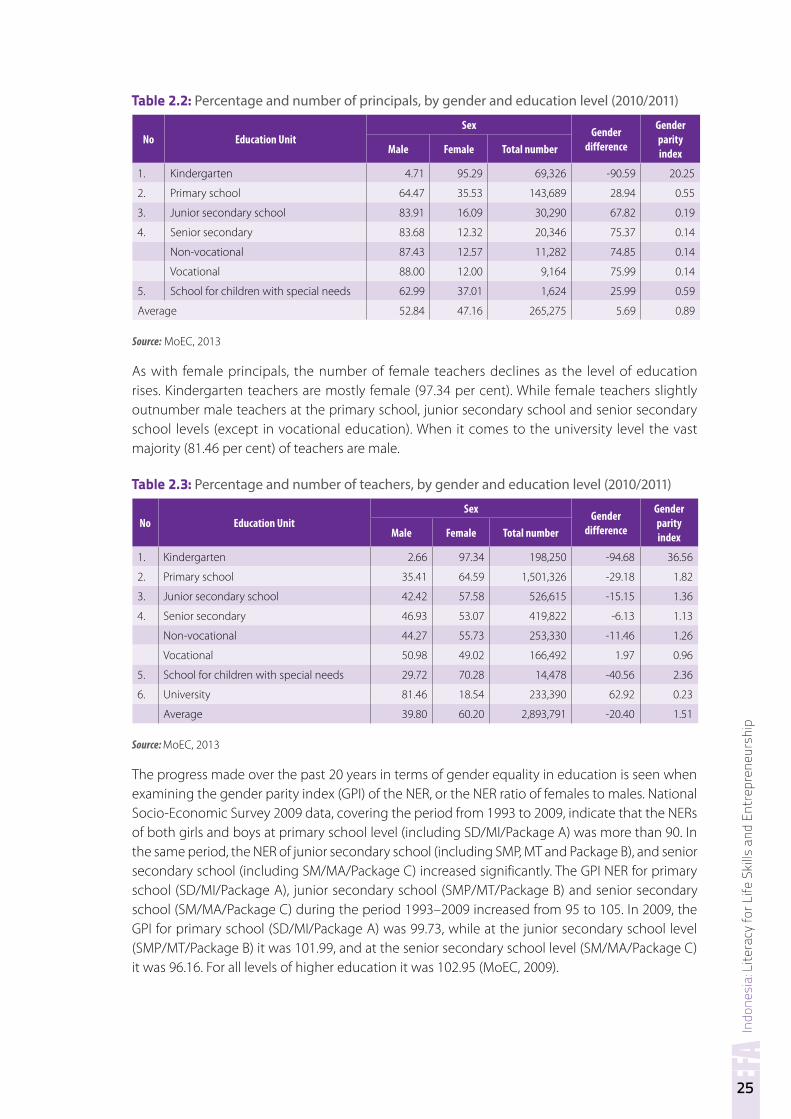
Table 2.2: Percentage and number of principals, by gender and education level (2010/2011)
No Education UnitSex Gender
difference
Gender parity indexMale Female Total number
1. Kindergarten 4.71 95.29 69,326 -90.59 20.25
2. Primary school 64.47 35.53 143,689 28.94 0.55
3. Junior secondary school 83.91 16.09 30,290 67.82 0.19
4. Senior secondary 83.68 12.32 20,346 75.37 0.14
Non-vocational 87.43 12.57 11,282 74.85 0.14
Vocational 88.00 12.00 9,164 75.99 0.14
5. School for children with special needs 62.99 37.01 1,624 25.99 0.59
Average 52.84 47.16 265,275 5.69 0.89
Source: MoEC, 2013
As with female principals, the number of female teachers declines as the level of education rises. Kindergarten teachers are mostly female (97.34 per cent). While female teachers slightly outnumber male teachers at the primary school, junior secondary school and senior secondary school levels (except in vocational education). When it comes to the university level the vast majority (81.46 per cent) of teachers are male.
Table 2.3: Percentage and number of teachers, by gender and education level (2010/2011)
No Education UnitSex Gender
difference
Gender parity indexMale Female Total number
1. Kindergarten 2.66 97.34 198,250 -94.68 36.56
2. Primary school 35.41 64.59 1,501,326 -29.18 1.82
3. Junior secondary school 42.42 57.58 526,615 -15.15 1.36
4. Senior secondary 46.93 53.07 419,822 -6.13 1.13
Non-vocational 44.27 55.73 253,330 -11.46 1.26
Vocational 50.98 49.02 166,492 1.97 0.96
5. School for children with special needs 29.72 70.28 14,478 -40.56 2.36
6. University 81.46 18.54 233,390 62.92 0.23
Average 39.80 60.20 2,893,791 -20.40 1.51
Source: MoEC, 2013
The progress made over the past 20 years in terms of gender equality in education is seen when examining the gender parity index (GPI) of the NER, or the NER ratio of females to males. National Socio-Economic Survey 2009 data, covering the period from 1993 to 2009, indicate that the NERs of both girls and boys at primary school level (including SD/MI/Package A) was more than 90. In the same period, the NER of junior secondary school (including SMP, MT and Package B), and senior secondary school (including SM/MA/Package C) increased significantly. The GPI NER for primary school (SD/MI/Package A), junior secondary school (SMP/MT/Package B) and senior secondary school (SM/MA/Package C) during the period 1993–2009 increased from 95 to 105. In 2009, the GPI for primary school (SD/MI/Package A) was 99.73, while at the junior secondary school level (SMP/MT/Package B) it was 101.99, and at the senior secondary school level (SM/MA/Package C) it was 96.16. For all levels of higher education it was 102.95 (MoEC, 2009).
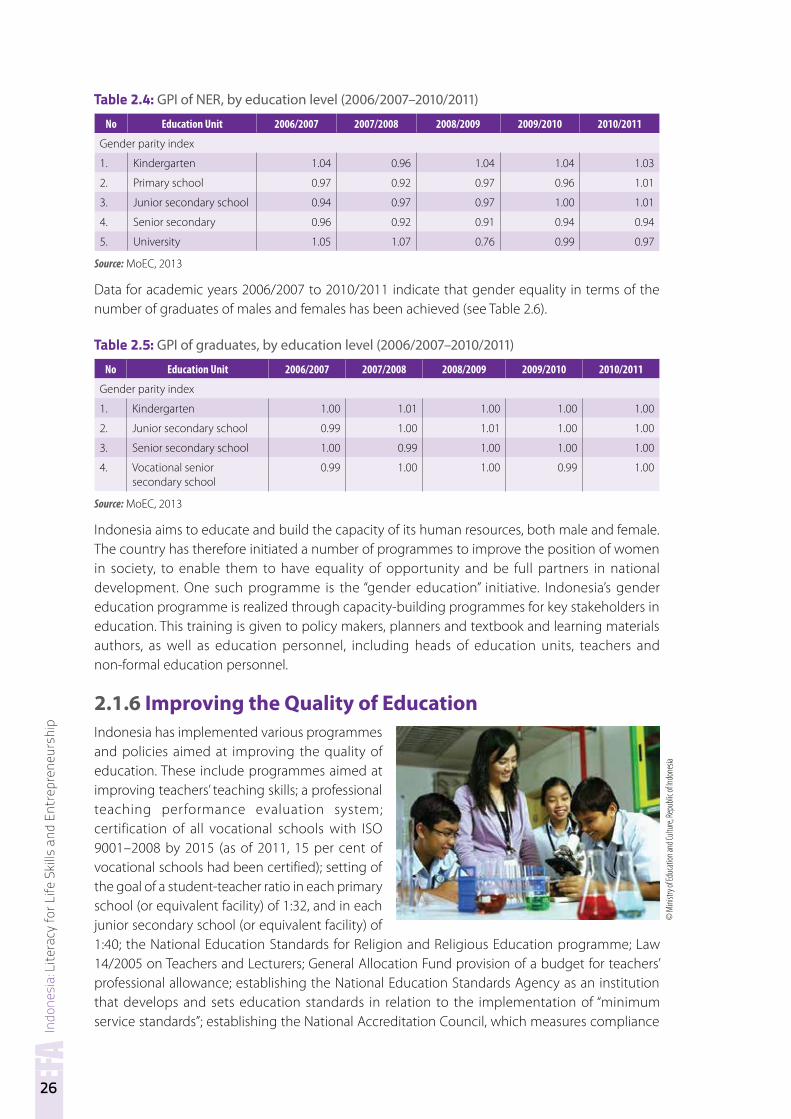
Indo
nesi
a: L
itera
cy fo
r Life
Ski
lls a
nd E
ntre
pren
eurs
hip
26
Table 2.4: GPI of NER, by education level (2006/2007–2010/2011)
No Education Unit 2006/2007 2007/2008 2008/2009 2009/2010 2010/2011
Gender parity index
1. Kindergarten 1.04 0.96 1.04 1.04 1.03
2. Primary school 0.97 0.92 0.97 0.96 1.01
3. Junior secondary school 0.94 0.97 0.97 1.00 1.01
4. Senior secondary 0.96 0.92 0.91 0.94 0.94
5. University 1.05 1.07 0.76 0.99 0.97
Source: MoEC, 2013
Data for academic years 2006/2007 to 2010/2011 indicate that gender equality in terms of the number of graduates of males and females has been achieved (see Table 2.6).
Table 2.5: GPI of graduates, by education level (2006/2007–2010/2011)
No Education Unit 2006/2007 2007/2008 2008/2009 2009/2010 2010/2011
Gender parity index
1. Kindergarten 1.00 1.01 1.00 1.00 1.00
2. Junior secondary school 0.99 1.00 1.01 1.00 1.00
3. Senior secondary school 1.00 0.99 1.00 1.00 1.00
4. Vocational senior secondary school
0.99 1.00 1.00 0.99 1.00
Source: MoEC, 2013
Indonesia aims to educate and build the capacity of its human resources, both male and female. The country has therefore initiated a number of programmes to improve the position of women in society, to enable them to have equality of opportunity and be full partners in national development. One such programme is the “gender education” initiative. Indonesia’s gender education programme is realized through capacity-building programmes for key stakeholders in education. This training is given to policy makers, planners and textbook and learning materials authors, as well as education personnel, including heads of education units, teachers and non-formal education personnel.
2 1 6 Improving the Quality of EducationIndonesia has implemented various programmes and policies aimed at improving the quality of education. These include programmes aimed at improving teachers’ teaching skills; a professional teaching performance evaluation system; certification of all vocational schools with ISO 9001–2008 by 2015 (as of 2011, 15 per cent of vocational schools had been certified); setting of the goal of a student-teacher ratio in each primary school (or equivalent facility) of 1:32, and in each junior secondary school (or equivalent facility) of 1:40; the National Education Standards for Religion and Religious Education programme; Law 14/2005 on Teachers and Lecturers; General Allocation Fund provision of a budget for teachers’ professional allowance; establishing the National Education Standards Agency as an institution that develops and sets education standards in relation to the implementation of “minimum service standards”; establishing the National Accreditation Council, which measures compliance
© M
inistr
y of E
duca
tion a
nd Cu
lture,
Repu
blic o
f Indo
nesia
Indo
nesi
a: L
itera
cy fo
r Life
Ski
lls a
nd E
ntre
pren
eurs
hip
27
with national education standards, set up in accordance with Government Regulation 19/2005; establishing the Bantuan Operasional Sekolah, or Operational Aid to School programme, set up to channel funds and books to schools; and the Quality Management Operational Assistance programme for secondary school and vocational school students.
In addition, the public funding allocation for education has been increased to 20 per cent since 2009. Since 2011, several types of scholarships have been provided, including achievement scholarships, scholarships for poor students (bidikmisi) in higher education and scholarships for academic improvement (bachelor, master and doctorate degrees) for teachers and lecturers.
The government also encourages multilateral cooperation and private-public partnership to support improvements in education quality. Civil society, including school committees, teachers unions, religious organizations, and NGOs, plays a crucial role in achieving education quality goals. Indonesia has implemented school-based management as a means for civil society participation.
The results of quality of education improvement efforts, in terms of teacher qualifications and student-class ratios, are illustrated in Figure 2.11.
© M
inistr
y of E
duca
tion a
nd Cu
lture,
Repu
blic o
f Indo
nesia
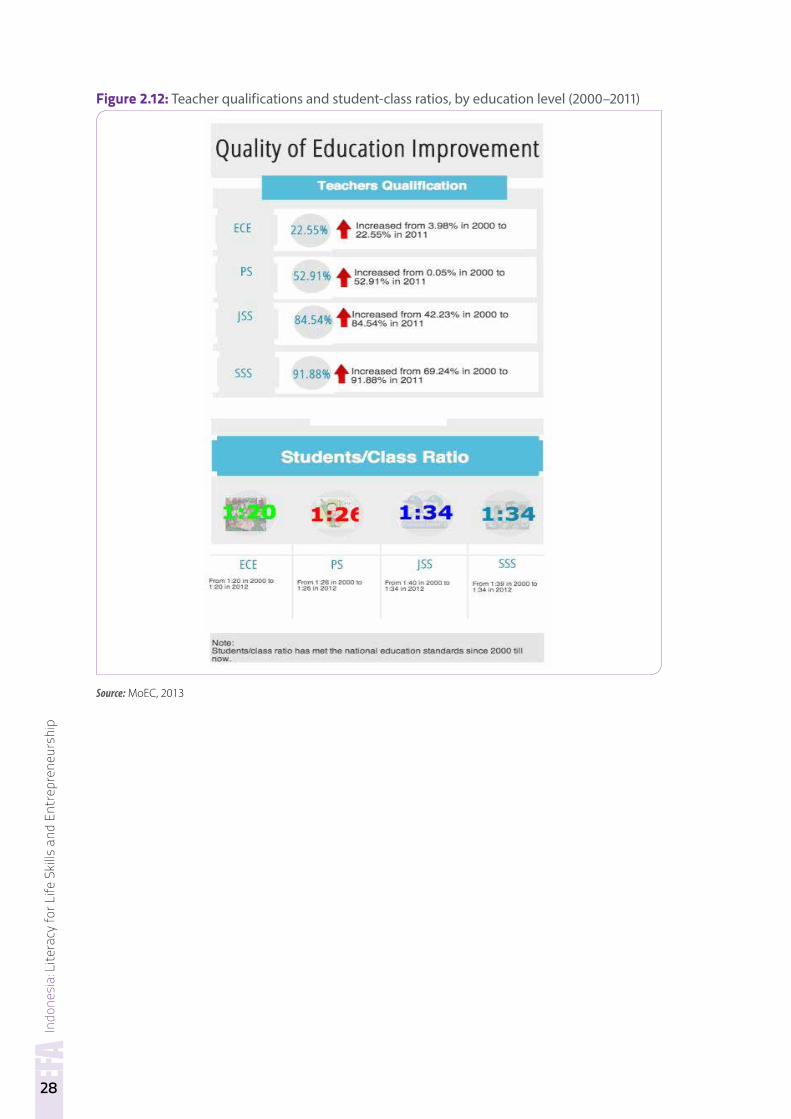
Indo
nesi
a: L
itera
cy fo
r Life
Ski
lls a
nd E
ntre
pren
eurs
hip
28
Figure 2.12: Teacher qualifications and student-class ratios, by education level (2000–2011)
Source: MoEC, 2013
Indo
nesi
a: L
itera
cy fo
r Life
Ski
lls a
nd E
ntre
pren
eurs
hip
29
Literacy in Indonesia: Achievements and challenges
3.1 Literacy achievements In the context of literacy, the EFA Goal is “the attainment of a 50 per cent increase in adult literacy, particularly among women, by the year 2015”. Indonesia’s literacy target was modified to “the attainment of a 50 per cent decrease in adult illiteracy (for those aged 15 and above) by 2015”. Indonesia achieved this target in 2011, with the illiteracy rate decreasing from 9.55 per cent (14.89 million people) in 2005 to 4.43 per cent (6.7 million people) in 2011.
Despite already having achieved the EFA Goal, the government has continued its literacy campaign, aiming to decrease the adult illiteracy rate from the 2011 figure of 4.43 per cent to 3.83 per cent by 2015. This policy recognizes that adult literacy plays an essential role in humanizing the lives of individuals by enabling economic security and good health, fostering cultural identity and tolerance, and promoting civic participation. Thus, since 2011, Indonesia’s efforts in term of increasing literacy have been concentrated largely on the remaining illiterate population (6.73 million people in 2011).
As a result of continued efforts to improve literacy, the adult literacy rate has increased since 2011. In 2013 the adult literacy rate reached 95.98 per cent. While this is another remarkable achievement, the figures indicate that there are still approximately 6.1 million illiterate adults in the country.
This decrease in illiteracy in Indonesia, which in 2000 had an adult population of 8.9 million spread out over a vast and varied archipelago, has been quite an achievement. There is still work to be done, however. This chapter discusses the remaining literacy challenges and the strategies that are being followed to reduce illiteracy in Indonesia.
3.2 Remaining challengesWith the achievement of EFA Goal 4 in 2011 many people thought that illiteracy was no longer a problem in Indonesia. The national illiteracy and literacy rates do not reflect the differences between male and female literacy rates, however, and do not reflect the situations at the provincial and district levels and the differences in the literacy rates of the various ethnic groups that make up Indonesia’s population.
Specifically, the remaining literacy issues are as follows:
• Women’s literacy rates have increased over the years, but the literacy rate for women is still lower than the literacy rate for men.
• The literacy rate of the adult population has increased, but people in rural areas have lower literacy rates than those living in urban areas.
3
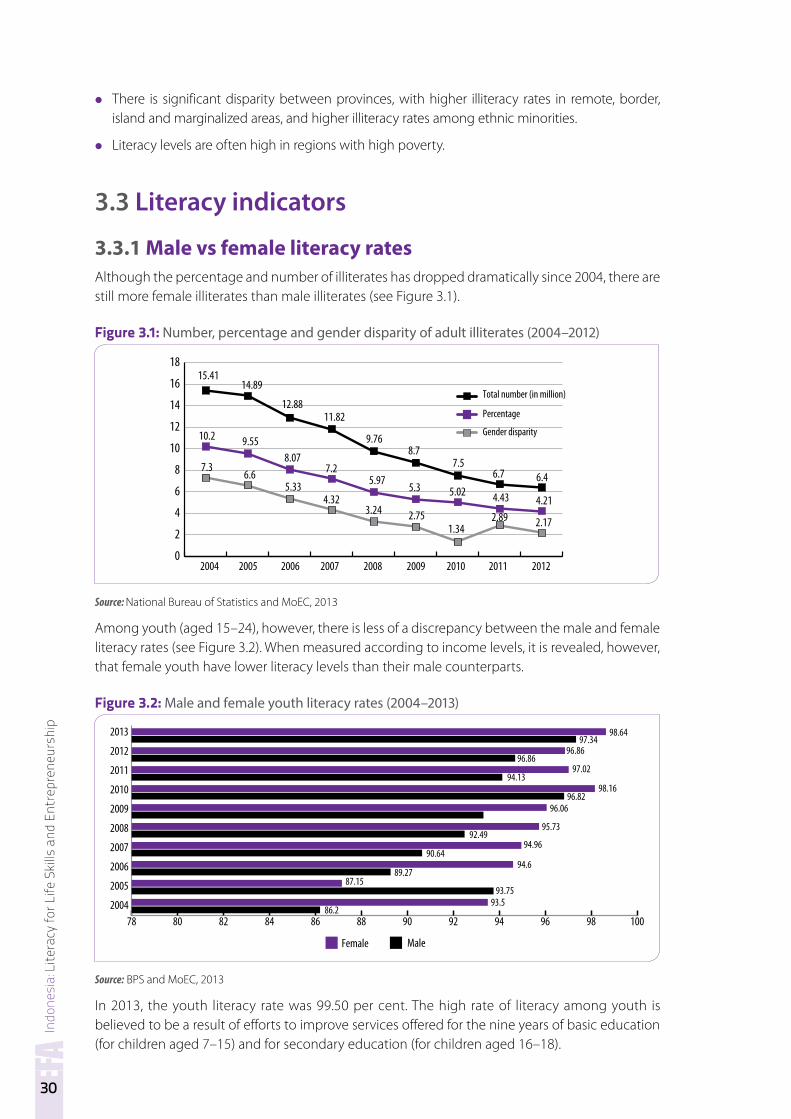
Indo
nesi
a: L
itera
cy fo
r Life
Ski
lls a
nd E
ntre
pren
eurs
hip
30
• There is significant disparity between provinces, with higher illiteracy rates in remote, border, island and marginalized areas, and higher illiteracy rates among ethnic minorities.
• Literacy levels are often high in regions with high poverty.
3.3 Literacy indicators
3 3 1 Male vs female literacy ratesAlthough the percentage and number of illiterates has dropped dramatically since 2004, there are still more female illiterates than male illiterates (see Figure 3.1).
Figure 3.1: Number, percentage and gender disparity of adult illiterates (2004–2012)
2004
15.4114.89
12.8811.82
9.768.7
7.56.7 6.4
4.214.435.025.35.97
7.28.07
9.5510.2
7.36.6
5.334.32
3.24 2.751.34
2.89 2.17
2005 2006 2007 2008 2009 2010 2011 2012
Percentage
Total number (in million)
Gender disparity
0
2
4
6
8
10
12
14
16
18
Source: National Bureau of Statistics and MoEC, 2013
Among youth (aged 15–24), however, there is less of a discrepancy between the male and female literacy rates (see Figure 3.2). When measured according to income levels, it is revealed, however, that female youth have lower literacy levels than their male counterparts.
Figure 3.2: Male and female youth literacy rates (2004–2013)
78 80 82 84 86 88 90 92 94 96 98 1002004
2005
2006
2007
2008
2009
2010
2011
2012
2013 98.6497.34
96.8696.86
97.0294.13
98.1696.82
96.06
95.7392.49
94.9690.64
94.689.27
87.1593.75
93.586.2
Female Male
Source: BPS and MoEC, 2013
In 2013, the youth literacy rate was 99.50 per cent. The high rate of literacy among youth is believed to be a result of efforts to improve services offered for the nine years of basic education (for children aged 7–15) and for secondary education (for children aged 16–18).
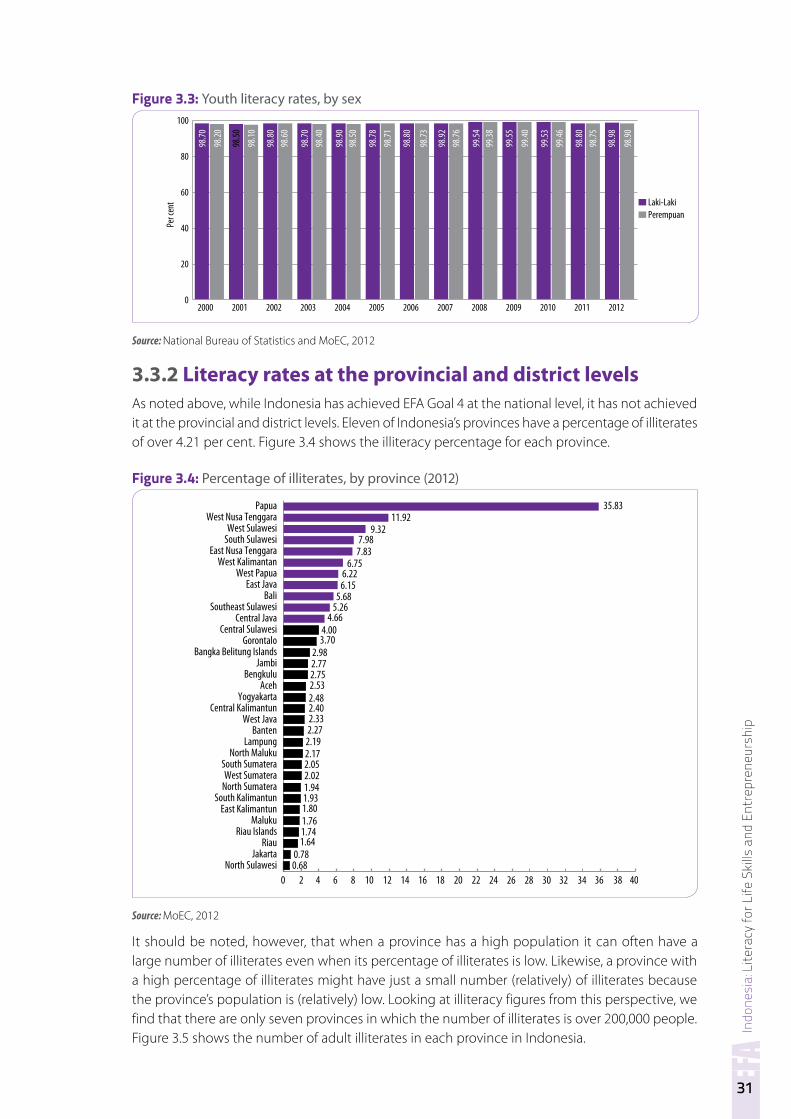
Indo
nesi
a: L
itera
cy fo
r Life
Ski
lls a
nd E
ntre
pren
eurs
hip
31
Figure 3.3: Youth literacy rates, by sex
Laki-LakiPerempuan
0
20
40
60
80
100
2000 2001 2002 2003 2004 2005 2006 2007 2008 2009 2010 2011 2012
98.70
Per c
ent
98.20
98.50
98.10
98.80
98.60
98.70
98.40
98.90
98.50
98.78
98.71
98.80
98.98
98.75
98.80
99.46
99.53
99.40
99.55
99.38
99.54
98.76
98.92
98.73
98.90
Source: National Bureau of Statistics and MoEC, 2012
3 3 2 Literacy rates at the provincial and district levelsAs noted above, while Indonesia has achieved EFA Goal 4 at the national level, it has not achieved it at the provincial and district levels. Eleven of Indonesia’s provinces have a percentage of illiterates of over 4.21 per cent. Figure 3.4 shows the illiteracy percentage for each province.
Figure 3.4: Percentage of illiterates, by province (2012)
Papua 35.8311.92
9.327.98
7.836.75
6.226.15
5.685.26
4.664.003.70
2.982.772.752.532.482.402.332.27
2.192.172.052.021.941.931.801.761.741.64
0.780.68
West Nusa TenggaraWest Sulawesi
South SulawesiEast Nusa Tenggara
West PapuaWest Kalimantan
East JavaBali
Central Java
Bangka Belitung Islands
Aceh
Banten
Central Kalimantun
Southeast Sulawesi
Central Sulawesi
Jambi
Yogyakarta
Lampung
West SumateraSouth Sumatera
Gorontalo
Bengkulu
West Java
North Maluku
North Sumatera
MalukuRiau Islands
RiauJakarta
North Sulawesi
East KalimantunSouth Kalimantun
0 2 4 6 8 10 12 14 16 18 20 22 24 26 28 30 32 34 36 38 40
Source: MoEC, 2012
It should be noted, however, that when a province has a high population it can often have a large number of illiterates even when its percentage of illiterates is low. Likewise, a province with a high percentage of illiterates might have just a small number (relatively) of illiterates because the province’s population is (relatively) low. Looking at illiteracy figures from this perspective, we find that there are only seven provinces in which the number of illiterates is over 200,000 people. Figure 3.5 shows the number of adult illiterates in each province in Indonesia.
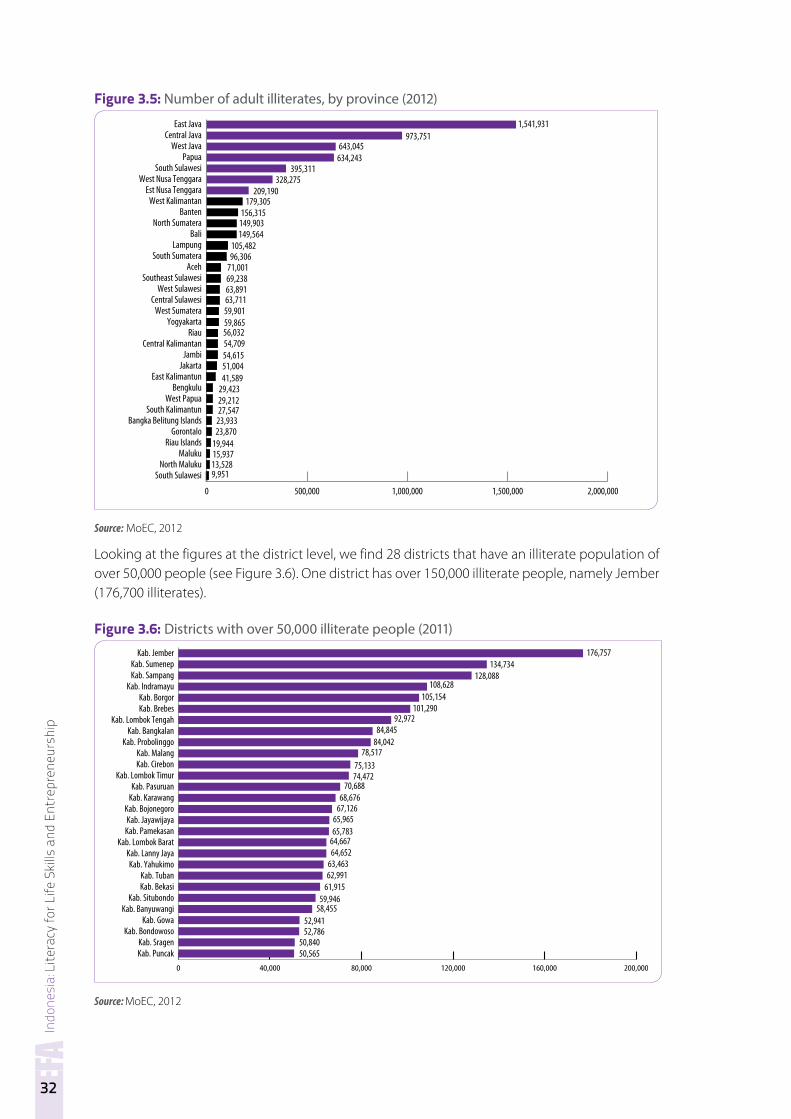
Indo
nesi
a: L
itera
cy fo
r Life
Ski
lls a
nd E
ntre
pren
eurs
hip
32
Figure 3.5: Number of adult illiterates, by province (2012)
East Java 1,541,931973,751
643,045634,243
395,311328,275
209,190179,305
156,315149,903149,564
105,48296,306
71,00169,23863,89163,71159,90159,86556,03254,70954,61551,00441,589
29,42329,21227,547
23,93323,870
19,94415,93713,5289,951
Central JavaWest Java
PapuaSouth Sulawesi
Est Nusa TenggaraWest Nusa Tenggara
West KalimantanBanten
Bali
Aceh
Central Sulawesi
Central Kalimantan
Yogyakarta
North Sumatera
Lampung
Southeast Sulawesi
West Sumatera
Jambi
BengkuluEast Kalimantun
South Sumatera
West Sulawesi
Riau
Jakarta
West Papua
GorontaloRiau Islands
MalukuNorth Maluku
South Sulawesi
Bangka Belitung IslandsSouth Kalimantun
0 500,000 1,000,000 1,500,000 2,000,000
Source: MoEC, 2012
Looking at the figures at the district level, we find 28 districts that have an illiterate population of over 50,000 people (see Figure 3.6). One district has over 150,000 illiterate people, namely Jember (176,700 illiterates).
Figure 3.6: Districts with over 50,000 illiterate people (2011)
Kab. SumenepKab. Sampang
Kab. IndramayuKab. Borgor
Kab. Lombok TengahKab. Brebes
Kab. BangkalanKab. Probolinggo
Kab. Cirebon
Kab. Karawang
Kab. Pamekasan
Kab. Tuban
Kab. Lanny Jaya
Kab. Malang
Kab. Lombok Timur
Kab. Bojonegoro
Kab. Lombok Barat
Kab. Bekasi
Kab. GowaKab. Banyuwangi
Kab. Pasuruan
Kab. Jayawijaya
Kab. Yahukimo
Kab. Situbondo
Kab. Bondowoso
Kab. PuncakKab. Sragen
0 40,000 80,000 120,000 160,000 200,000
Kab. Jember 176,757134,734
128,088108,628
105,154101,290
92,97284,845
84,04278,517
75,133
70,68868,676
67,12665,96565,783
64,66764,652
63,46362,991
61,91559,946
58,45552,94152,786
50,84050,565
74,472
Source: MoEC, 2012
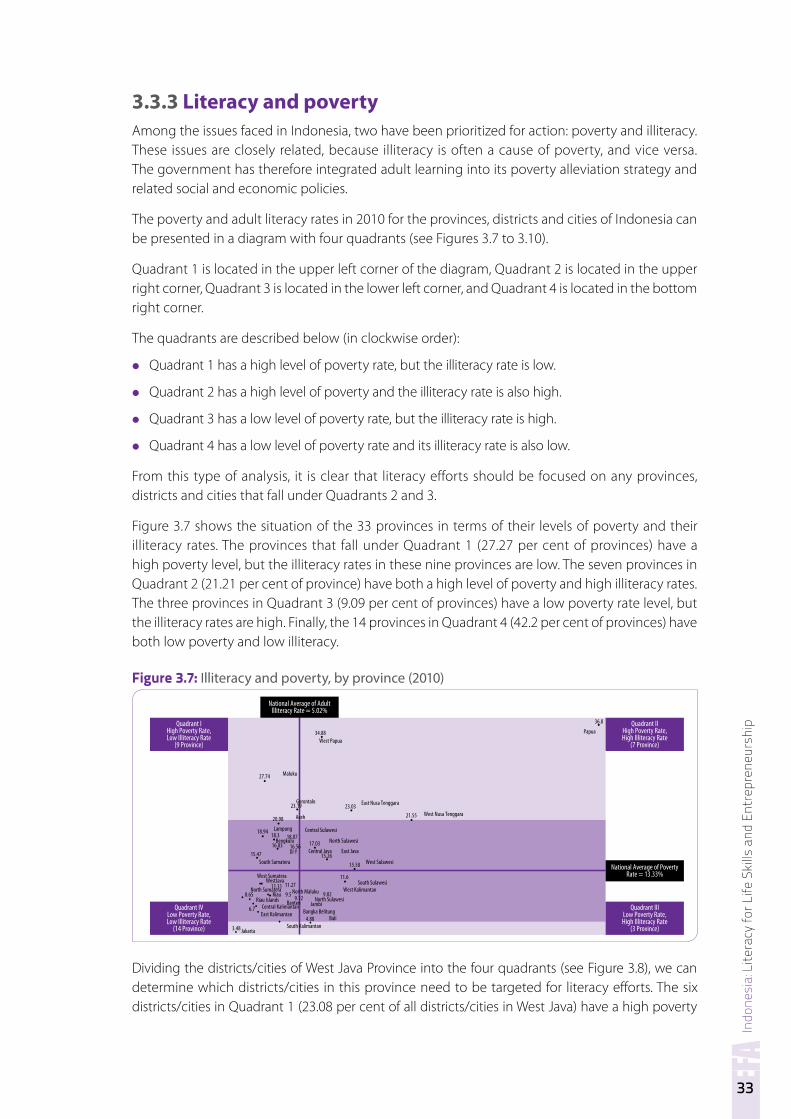
Indo
nesi
a: L
itera
cy fo
r Life
Ski
lls a
nd E
ntre
pren
eurs
hip
33
3 3 3 Literacy and poverty Among the issues faced in Indonesia, two have been prioritized for action: poverty and illiteracy. These issues are closely related, because illiteracy is often a cause of poverty, and vice versa. The government has therefore integrated adult learning into its poverty alleviation strategy and related social and economic policies.
The poverty and adult literacy rates in 2010 for the provinces, districts and cities of Indonesia can be presented in a diagram with four quadrants (see Figures 3.7 to 3.10).
Quadrant 1 is located in the upper left corner of the diagram, Quadrant 2 is located in the upper right corner, Quadrant 3 is located in the lower left corner, and Quadrant 4 is located in the bottom right corner.
The quadrants are described below (in clockwise order):
• Quadrant 1 has a high level of poverty rate, but the illiteracy rate is low.
• Quadrant 2 has a high level of poverty and the illiteracy rate is also high.
• Quadrant 3 has a low level of poverty rate, but the illiteracy rate is high.
• Quadrant 4 has a low level of poverty rate and its illiteracy rate is also low.
From this type of analysis, it is clear that literacy efforts should be focused on any provinces, districts and cities that fall under Quadrants 2 and 3.
Figure 3.7 shows the situation of the 33 provinces in terms of their levels of poverty and their illiteracy rates. The provinces that fall under Quadrant 1 (27.27 per cent of provinces) have a high poverty level, but the illiteracy rates in these nine provinces are low. The seven provinces in Quadrant 2 (21.21 per cent of province) have both a high level of poverty and high illiteracy rates. The three provinces in Quadrant 3 (9.09 per cent of provinces) have a low poverty rate level, but the illiteracy rates are high. Finally, the 14 provinces in Quadrant 4 (42.2 per cent of provinces) have both low poverty and low illiteracy.
Figure 3.7: Illiteracy and poverty, by province (2010)
National Average of AdultIlliteracy Rate = 5.02%
Quadrant IHigh Poverty Rate,Low Illiteracy Rate
(9 Province)
Quadrant IVLow Poverty Rate,Low Illiteracy Rate
(14 Province)
Quadrant IIILow Poverty Rate,High Illiteracy Rate
(3 Province)
National Average of PovertyRate = 13.33%
Quadrant IIHigh Poverty Rate,High Illiteracy Rate
(7 Province)
East Nusa Tenggara23.03
34.88West Papua
27.74
North Maluku
JambiBanten
Maluku
Gorontalo23.19
Aceh20.98
18.94 Lampung
Bengkulu18.3 18.0716.83
Central Sulawesi
North Sulawesi17.03
15.26East JavaCentral JavaDI Y
16.5615.47
11.319.5 9.12
4.88
6.7
8.65
3.48
11.2711.6
9.02
South Sumatera
West Sumatera
North SumateraRiau
Riau Islands
WestJava
West Sulawesi
South Sulawesi
North Sulawesi
West Kalimantan
Central KalimantanEast Kalimantan
South KalimantanBali
Jakarta
Bangka Belitung
15.58
21.55 West Nusa Tenggara
36.8
Papua
Dividing the districts/cities of West Java Province into the four quadrants (see Figure 3.8), we can determine which districts/cities in this province need to be targeted for literacy efforts. The six districts/cities in Quadrant 1 (23.08 per cent of all districts/cities in West Java) have a high poverty
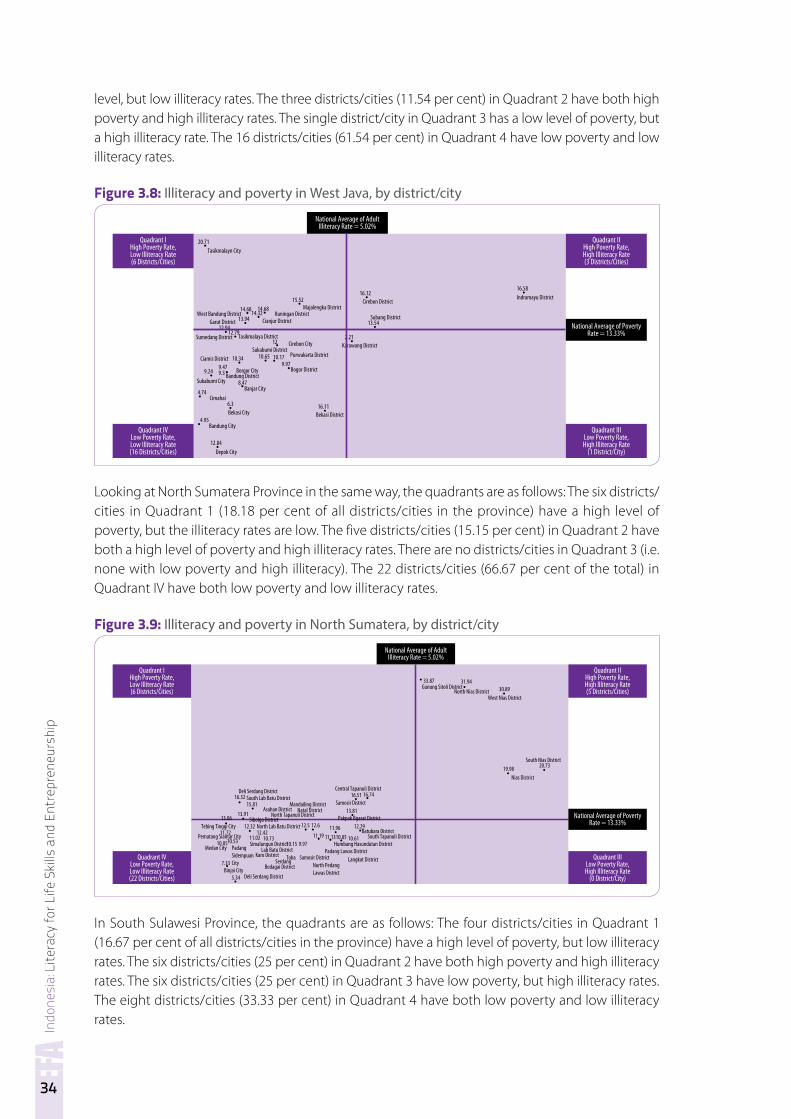
Indo
nesi
a: L
itera
cy fo
r Life
Ski
lls a
nd E
ntre
pren
eurs
hip
34
level, but low illiteracy rates. The three districts/cities (11.54 per cent) in Quadrant 2 have both high poverty and high illiteracy rates. The single district/city in Quadrant 3 has a low level of poverty, but a high illiteracy rate. The 16 districts/cities (61.54 per cent) in Quadrant 4 have low poverty and low illiteracy rates.
Figure 3.8: Illiteracy and poverty in West Java, by district/city
National Average of AdultIlliteracy Rate = 5.02%
Quadrant IVLow Poverty Rate,Low Illiteracy Rate(16 Districts/Cities)
Quadrant IIILow Poverty Rate,High Illiteracy Rate
(1 District/City)
20.71Tasikmalayn City
West Bandung DistrictCianjur District
Kuningan DistrictMajalengka District
Garut District
Cirebon District
Cirebon City
Purwakarta District
Bogor District
Sukabumi District
Sumedang District
Ciamis District
Sukabumi City
Cimahai
Bekasi City Bekasi District
Bandung City
Depok City
Tasikmalaya District
Borgor CityBandung District
Banjar City
Subang District
Karawang District
15.5214.6814.68
14.3213.94
12.9412.79
12.84
9.24 9.39.47
8.47
10.34 10.65 10.179.97
16.11
2.21
13.54
16.12Indramayu District16.58
12
4.95
4.74
6.3
National Average of PovertyRate = 13.33%
Quadrant IHigh Poverty Rate,Low Illiteracy Rate(6 Districts/Cities)
Quadrant IIHigh Poverty Rate,High Illiteracy Rate(3 Districts/Cities)
Looking at North Sumatera Province in the same way, the quadrants are as follows: The six districts/cities in Quadrant 1 (18.18 per cent of all districts/cities in the province) have a high level of poverty, but the illiteracy rates are low. The five districts/cities (15.15 per cent) in Quadrant 2 have both a high level of poverty and high illiteracy rates. There are no districts/cities in Quadrant 3 (i.e. none with low poverty and high illiteracy). The 22 districts/cities (66.67 per cent of the total) in Quadrant IV have both low poverty and low illiteracy rates.
Figure 3.9: Illiteracy and poverty in North Sumatera, by district/city
Quadrant IVLow Poverty Rate,Low Illiteracy Rate(22 Districts/Cities)
Quadrant IIILow Poverty Rate,High Illiteracy Rate
(0 District/City)
Quadrant IHigh Poverty Rate,Low Illiteracy Rate(6 Districts/Cities)
Quadrant IIHigh Poverty Rate,High Illiteracy Rate(5 Districts/Cities)
Gunung Sitoli DistrictNorth Nias District
West Nias District
South Nias District
Nias District
33.87 31.9430.89
20.7319.98
Central Tapanuli District
Samosir DistrictMandailing District
Deli Serdang DistrictSouth Lab Batu District
North Lab Batu District
Simalungun DistrictMedan City
Deli Serdang District
Bedagai District
Lab Batu DistrictKaro District Samosir District
Padang Lawas DistrictLangkat District
South Tapanuli DistrictBatubara District
Humbang Hasundutan District
North PedangLawas District
TobaSerdang
Binjai City
Pematang Siantar City
PadangSidempuanCity
Tebing Tinggi City
Asahan District
Sibolga DistrictNorth Tapanuli District
Natal DistrictPakpak Bgarat District
16.51
13.81
16.74
12.2911.9610.85 10.61
12.5 12.6
11.19 11.13
15.81
13.91
16.32
12.3212.42
11.02 10.7310.5310.05
7.33
10.15 9.97
5.34
13.06
11.72
National Average of AdultIlliteracy Rate = 5.02%
National Average of PovertyRate = 13.33%
In South Sulawesi Province, the quadrants are as follows: The four districts/cities in Quadrant 1 (16.67 per cent of all districts/cities in the province) have a high level of poverty, but low illiteracy rates. The six districts/cities (25 per cent) in Quadrant 2 have both high poverty and high illiteracy rates. The six districts/cities (25 per cent) in Quadrant 3 have low poverty, but high illiteracy rates. The eight districts/cities (33.33 per cent) in Quadrant 4 have both low poverty and low illiteracy rates.
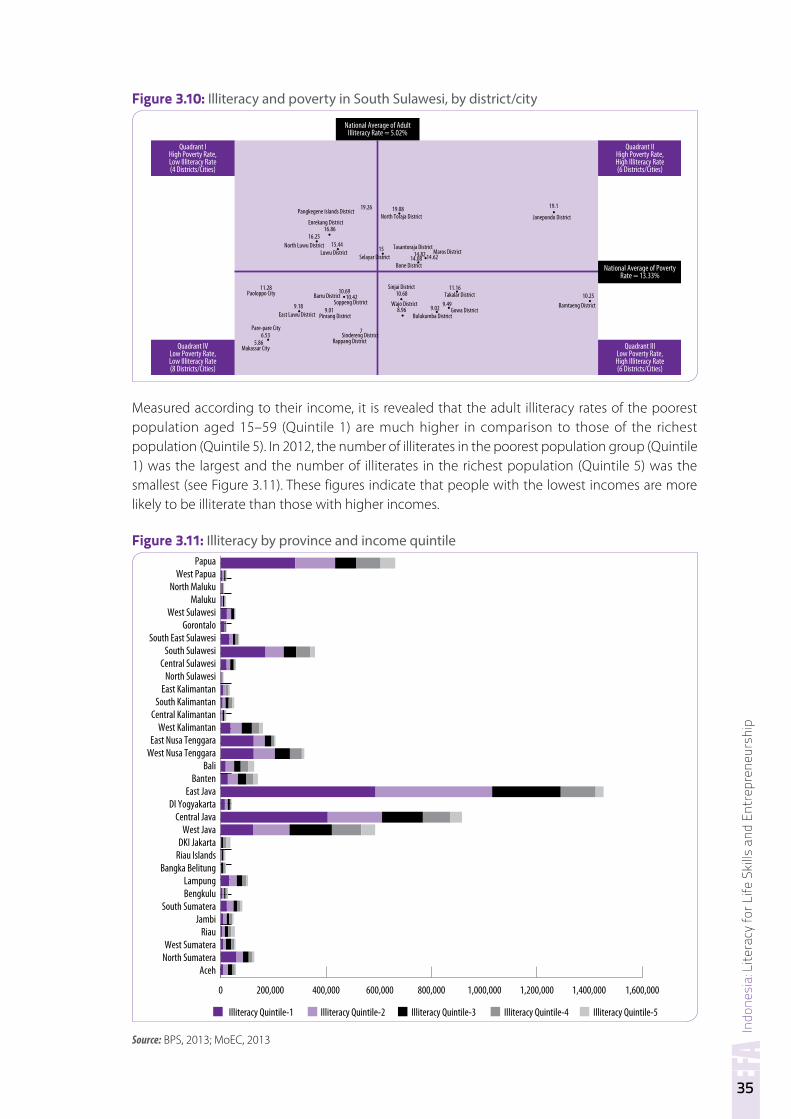
Indo
nesi
a: L
itera
cy fo
r Life
Ski
lls a
nd E
ntre
pren
eurs
hip
35
Figure 3.10: Illiteracy and poverty in South Sulawesi, by district/city
Pangkegene Islands District
Enrekang District
North Luwu DistrictLuwu District
Selayar District
Sinjai District
Wajo DistrictBarru District
Soppeng District
East Luwu District Pinrang District
Sindereng DistrictRappang District
Pare-pare City
Makassar City
Paoloppo City Takalar District
Gowa DistrictBulukumba District
North Toraja District
Tasantoraja DistrictMaros District
Janepondo District
Bamtaeng District
Bone District
16.8616.25
15.44
19.26 19.08
8.96
10.6810.6910.42
9.019.18
11.28
6.535.86
7
1514.08
14.82 14.62
11.1610.25
19.1
9.499.02
Quadrant IVLow Poverty Rate,Low Illiteracy Rate(8 Districts/Cities)
Quadrant IIILow Poverty Rate,High Illiteracy Rate(6 Districts/Cities)
Quadrant IHigh Poverty Rate,Low Illiteracy Rate(4 Districts/Cities)
Quadrant IIHigh Poverty Rate,High Illiteracy Rate(6 Districts/Cities)
National Average of AdultIlliteracy Rate = 5.02%
National Average of PovertyRate = 13.33%
Measured according to their income, it is revealed that the adult illiteracy rates of the poorest population aged 15–59 (Quintile 1) are much higher in comparison to those of the richest population (Quintile 5). In 2012, the number of illiterates in the poorest population group (Quintile 1) was the largest and the number of illiterates in the richest population (Quintile 5) was the smallest (see Figure 3.11). These figures indicate that people with the lowest incomes are more likely to be illiterate than those with higher incomes.
Figure 3.11: Illiteracy by province and income quintile Papua
West PapuaNorth Maluku
MalukuWest Sulawesi
South East SulawesiGorontalo
South SulawesiCentral Sulawesi
East Kalimantan
West Kalimantan
Bali
Central Java
East Java
North Sulawesi
South Kalimantan
East Nusa Tenggara
Banten
West Java
Bangka BelitungRiau Islands
Central Kalimantan
West Nusa Tenggara
DI Yogyakarta
DKI Jakarta
Lampung
Aceh
BengkuluSouth Sumatera
JambiRiau
West SumateraNorth Sumatera
0 400,000200,000 600,000 1,000,000 1,400,000800,000 1,200,000 1,600,000
Illiteracy Quintile-1 Illiteracy Quintile-2 Illiteracy Quintile-3 Illiteracy Quintile-4 Illiteracy Quintile-5
Source: BPS, 2013; MoEC, 2013
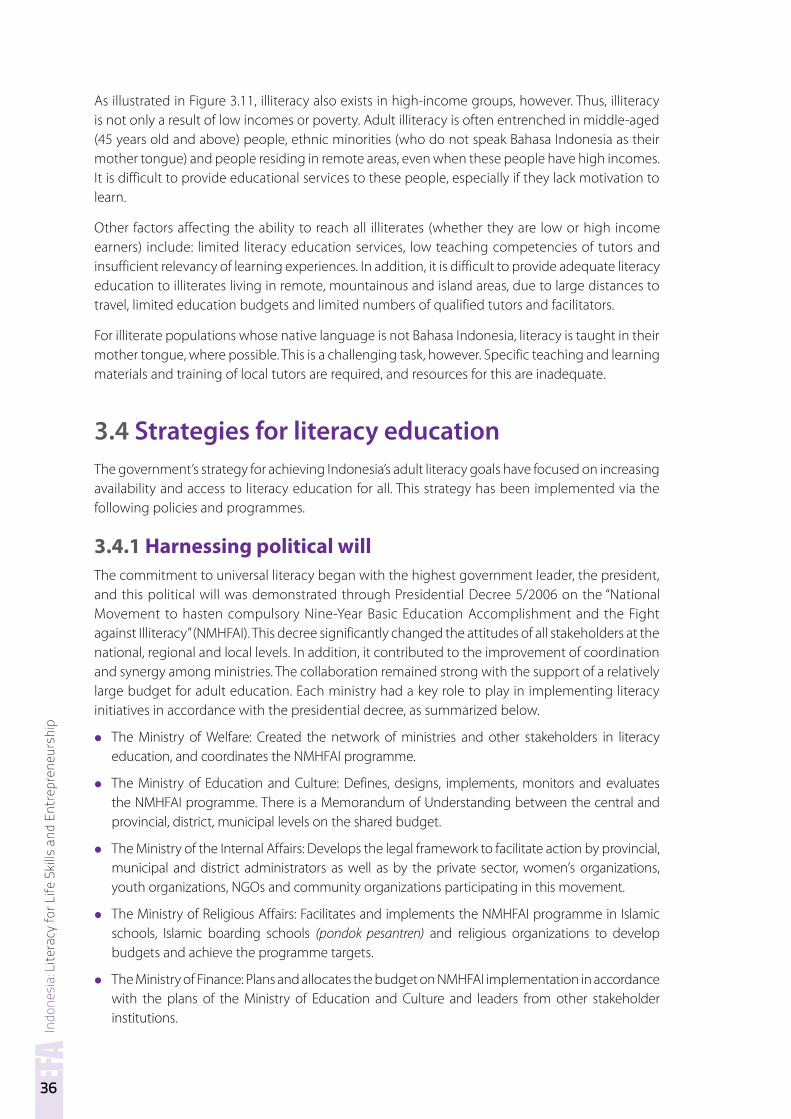
Indo
nesi
a: L
itera
cy fo
r Life
Ski
lls a
nd E
ntre
pren
eurs
hip
36
As illustrated in Figure 3.11, illiteracy also exists in high-income groups, however. Thus, illiteracy is not only a result of low incomes or poverty. Adult illiteracy is often entrenched in middle-aged (45 years old and above) people, ethnic minorities (who do not speak Bahasa Indonesia as their mother tongue) and people residing in remote areas, even when these people have high incomes. It is difficult to provide educational services to these people, especially if they lack motivation to learn.
Other factors affecting the ability to reach all illiterates (whether they are low or high income earners) include: limited literacy education services, low teaching competencies of tutors and insufficient relevancy of learning experiences. In addition, it is difficult to provide adequate literacy education to illiterates living in remote, mountainous and island areas, due to large distances to travel, limited education budgets and limited numbers of qualified tutors and facilitators.
For illiterate populations whose native language is not Bahasa Indonesia, literacy is taught in their mother tongue, where possible. This is a challenging task, however. Specific teaching and learning materials and training of local tutors are required, and resources for this are inadequate.
3.4 Strategies for literacy educationThe government’s strategy for achieving Indonesia’s adult literacy goals have focused on increasing availability and access to literacy education for all. This strategy has been implemented via the following policies and programmes.
3 4 1 Harnessing political will The commitment to universal literacy began with the highest government leader, the president, and this political will was demonstrated through Presidential Decree 5/2006 on the “National Movement to hasten compulsory Nine-Year Basic Education Accomplishment and the Fight against Illiteracy” (NMHFAI). This decree significantly changed the attitudes of all stakeholders at the national, regional and local levels. In addition, it contributed to the improvement of coordination and synergy among ministries. The collaboration remained strong with the support of a relatively large budget for adult education. Each ministry had a key role to play in implementing literacy initiatives in accordance with the presidential decree, as summarized below.
• The Ministry of Welfare: Created the network of ministries and other stakeholders in literacy education, and coordinates the NMHFAI programme.
• The Ministry of Education and Culture: Defines, designs, implements, monitors and evaluates the NMHFAI programme. There is a Memorandum of Understanding between the central and provincial, district, municipal levels on the shared budget.
• The Ministry of the Internal Affairs: Develops the legal framework to facilitate action by provincial, municipal and district administrators as well as by the private sector, women’s organizations, youth organizations, NGOs and community organizations participating in this movement.
• The Ministry of Religious Affairs: Facilitates and implements the NMHFAI programme in Islamic schools, Islamic boarding schools (pondok pesantren) and religious organizations to develop budgets and achieve the programme targets.
• The Ministry of Finance: Plans and allocates the budget on NMHFAI implementation in accordance with the plans of the Ministry of Education and Culture and leaders from other stakeholder institutions.
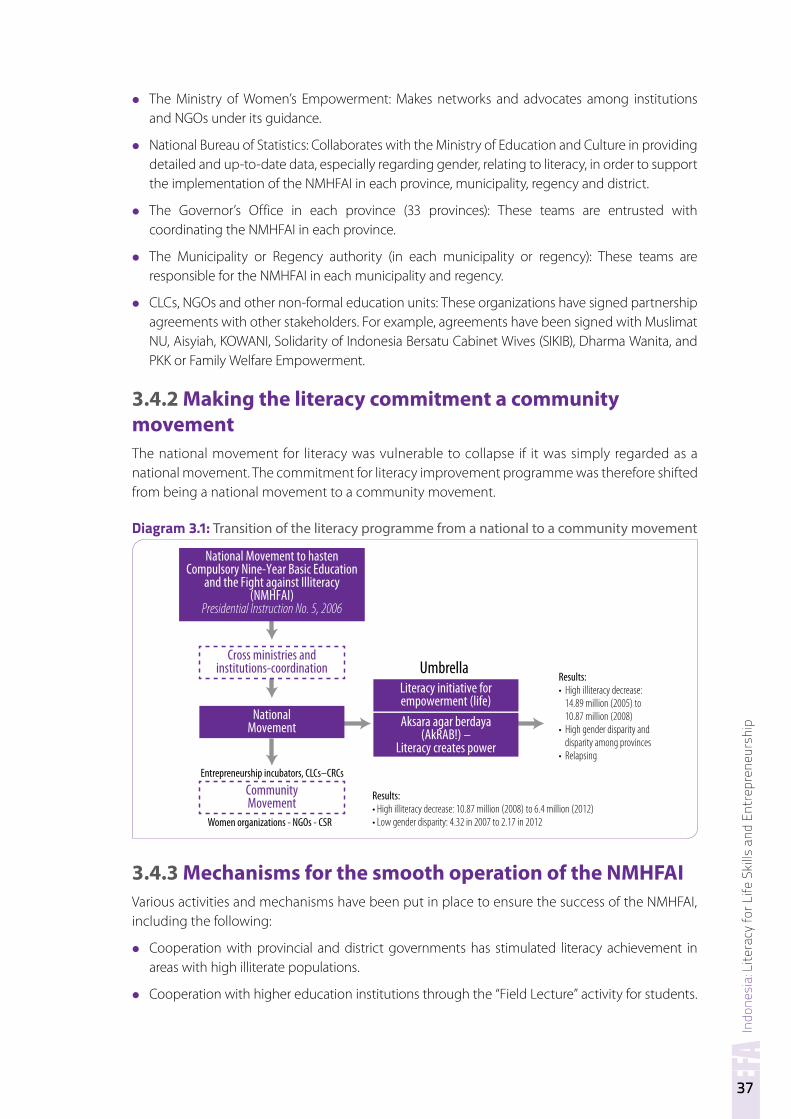
Indo
nesi
a: L
itera
cy fo
r Life
Ski
lls a
nd E
ntre
pren
eurs
hip
37
• The Ministry of Women’s Empowerment: Makes networks and advocates among institutions and NGOs under its guidance.
• National Bureau of Statistics: Collaborates with the Ministry of Education and Culture in providing detailed and up-to-date data, especially regarding gender, relating to literacy, in order to support the implementation of the NMHFAI in each province, municipality, regency and district.
• The Governor’s Office in each province (33 provinces): These teams are entrusted with coordinating the NMHFAI in each province.
• The Municipality or Regency authority (in each municipality or regency): These teams are responsible for the NMHFAI in each municipality and regency.
• CLCs, NGOs and other non-formal education units: These organizations have signed partnership agreements with other stakeholders. For example, agreements have been signed with Muslimat NU, Aisyiah, KOWANI, Solidarity of Indonesia Bersatu Cabinet Wives (SIKIB), Dharma Wanita, and PKK or Family Welfare Empowerment.
3 4 2 Making the literacy commitment a community movementThe national movement for literacy was vulnerable to collapse if it was simply regarded as a national movement. The commitment for literacy improvement programme was therefore shifted from being a national movement to a community movement.
Diagram 3.1: Transition of the literacy programme from a national to a community movement
National Movement to hastenCompulsory Nine-Year Basic Education
and the Fight against Illiteracy(NMHFAI)
Presidential Instruction No. 5, 2006
Cross ministries andinstitutions-coordination
NationalMovement
CommunityMovement Results:
• High illiteracy decrease: 10.87 million (2008) to 6.4 million (2012)• Low gender disparity: 4.32 in 2007 to 2.17 in 2012
Literacy initiative forempowerment (life)Aksara agar berdaya
(AkRAB!) –Literacy creates power
Entrepreneurship incubators, CLCs–CRCs
Women organizations - NGOs - CSR
Results:• High illiteracy decrease:
14.89 million (2005) to 10.87 million (2008)
• High gender disparity and disparity among provinces
• Relapsing
Umbrella
3 4 3 Mechanisms for the smooth operation of the NMHFAI Various activities and mechanisms have been put in place to ensure the success of the NMHFAI, including the following:
• Cooperation with provincial and district governments has stimulated literacy achievement in areas with high illiterate populations.
• Cooperation with higher education institutions through the “Field Lecture” activity for students.
Indo
nesi
a: L
itera
cy fo
r Life
Ski
lls a
nd E
ntre
pren
eurs
hip
38
• Partnership agreements with religious organizations, women’s organizations, NGOs, civil society organizations and the private sector (through encouraging Corporate Social Responsibility).
• To ensure ongoing support for the literacy movement, the national government gives recognition and acknowledgements to provincial and district governments that achieve literacy targets. For example, it gives awards to provincial and district governments that successfully achieve their targets in literacy in accordance with the national target.
• The government has increased the availability of literacy services for adult populations, aiming to reach all illiterates regardless of age, geographic location, gender, language, culture or ethnicity. Services have therefore been able to “reach the unreached”, those in remote coastal and mountain communities, as well as ethnic minorities and other disadvantaged groups.
• Actions have been taken to improve the quality of literacy learning and integrating it with vocational skills, to increase learners’ chances in finding employment or in gaining a dignified profession.
• Activities have aimed to provide literacy learners of literacy with assistance and benefits to enable them to adapt to changes in society and the working world, while adopting the desired values for the creation of productive human resources.
3.5 Indonesia’s adult literacy programmesThe Directorate of Community Education Development seeks to achieve universal adult literacy and implements various literacy education programmes, each focusing on specific groups and their needs. The programmes include basic literacy, women’s literacy, digital literacy, entrepreneurship literacy, critical literacy, natural disaster prevention literacy and literacy for peace.
In Indonesia, an adult illiterate who is still learning to read has few encounters with words they have never seen before in print. Despite this lack of exposure to written text among adults, it is assumed that teaching literacy skills to adults would be easier than teaching children. Yet, data indicate that the opposite is true. Adults not only feel embarrassed about learning how to read, write and do basic arithmetic, they also tend to avoid literacy programmes if the programmes are during their working hours and unless they receive financial compensation for attendance. Therefore, to attract more adult learners, adult literacy programmes were developed that start from the basics, support them in their daily lives and are relevant to their surroundings and culture.
According to data from the National Bureau of Statistics, in 2013 Indonesia had about a half million illiterate youth and 6.1 million illiterate adults, with an overall gender disparity of 1.3. Based on these figures, the national literacy education service focuses on adults aged between 15 and 59 years old, and on females. However, males and elderly people are also encouraged to join literacy programmes.
The key adult literacy programmes developed and implemented in Indonesia are as follows:
• Basic Literacy. This programme aims to increase learners’ abilities to read, write, count, listen and communicate verbally and in writing, using letters and numbers, in Bahasa Indonesia.
• The Literacy for Life Skills and Entrepreneurship (LLSE) programme. This initiative focuses on both literacy skills and poverty alleviation, with a focus on “train to gain”. It encompasses three smaller programmes, namely Self-Entrepreneurship Literacy (SEL), Life Skills Education (LSE) and the Piloting Entrepreneurship Incubator (PEI).
Indo
nesi
a: L
itera
cy fo
r Life
Ski
lls a
nd E
ntre
pren
eurs
hip
39
- Self-Entrepreneurship Literacy. This initiative trains learners in basic entrepreneurship skills through methods that also increase the literacy of the learners. The programme aims not only to enhance literacy but also aims to enable learners to increase their incomes, so is also a poverty alleviation initiative.
- Life Skills Education. This initiative focuses on life skills development. This programme is intended to empower those who have completed basic education. Under this initiative, participant are encouraged to engage in all activities in which literacy is required for the effective functioning of their group and community and also for enabling them to use reading, writing and calculations for their own and their communities’ development.
- Piloting Entrepreneurship Incubator. This programme enhances community entrepreneurship through the piloting of business incubators and entrepreneurship centres that increase both literacy and the incomes of learners and the community.
• The Aksara Agar Berdaya (AKRAB) – Literacy Creates Power. Under this programme, learners familiarize themselves with letters (aksara) in order to achieve empowerment (berdaya), meaning that it is through familiarity with letters that empowerment can be achieved. AKRAB classes are integrated into entrepreneurship education, life skills education and gender equity (MoNE, 2010).
• Writing Habit Improvement through Mother and Child Newspapers. This intiative seeks to improve the writing skills and writing culture of women and children by training them in citizen journalism. Through this programme, learners are exposed to various kinds of media and to several forms of information and communication technology (ICT).
• Family Literacy Education: This programme is designed to empower families through a literate member of the family teaching literacy and numeracy skills to the other family members. This enables families to search for, acquire and utilize information for solving family problems and enables them to participate in the development of the country.
• Literacy through Folk Tales. This initiative uses folk tales as means of assisting learners to gain literacy skills.
• Local Culture Literacy. This literacy programme uses local culture as a means of teaching and of empowering the students.
• Improving Community Reading Culture: This programme aims to maintain literacy skills of literates and at the same time improve community reading habits and culture through providing community reading centres in public spaces throughout Indonesia, including markets, religious buildings and village hospitals.
• Smart House: This programme assists learning communities to build “smart houses” as non-formal education institutions in locations that lack spaces for non-formal learning. This programme is particularly aimed at learners (children, youth, women, senior citizens and other community members) in disadvantaged, remote and border regions. Under this programme, grants are given to NGOs and other community organizations that meet the criteria to participate in creating “Smart Houses”.
• Smart House Assistance: This initiative aims to develop the Smart House institution into a non-formal education unit that can provide learning services appropriate to the community’s needs.
• Pioneering Collective Learning Hub: This seeks to facilitate learning communities by encouraging the use of public spaces as places for collective learning. Grants are given to CLCs, community reading centres and other non-formal education institutions, indigenous people’s organizations, Islamic boarding schools, art studios, creative industry groups, environmental groups and other non-profit organizations that meet the given criteria.
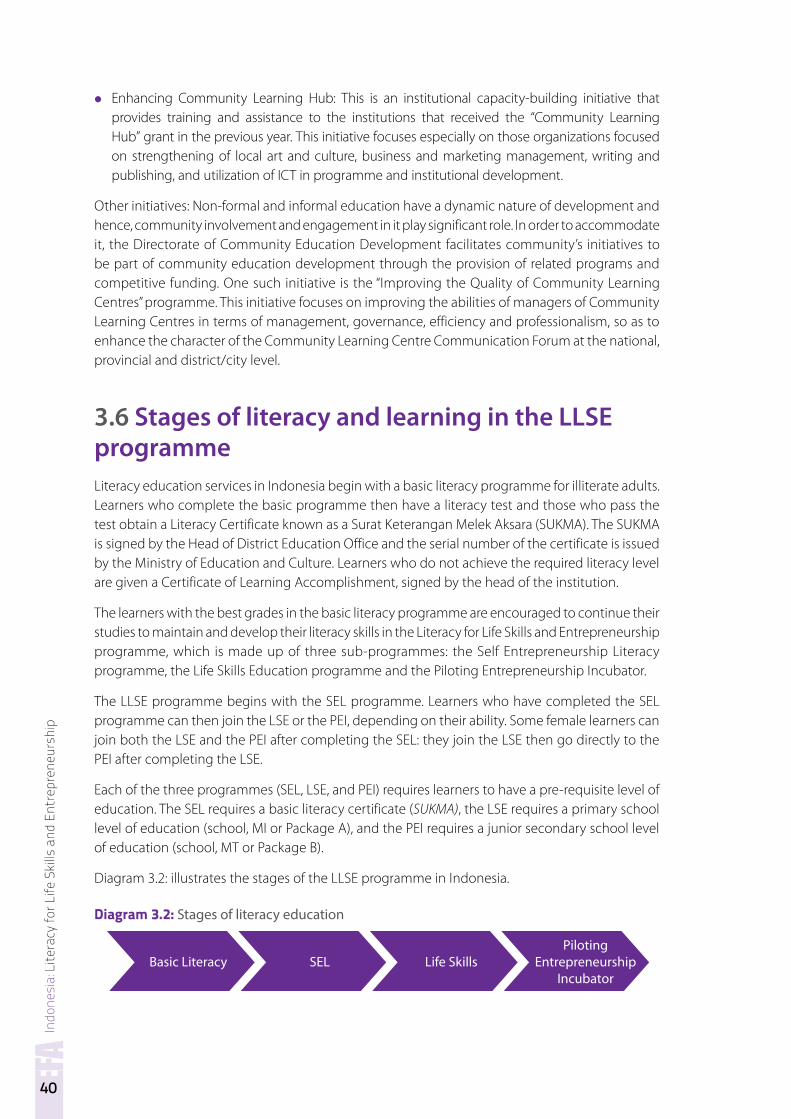
Indo
nesi
a: L
itera
cy fo
r Life
Ski
lls a
nd E
ntre
pren
eurs
hip
40
• Enhancing Community Learning Hub: This is an institutional capacity-building initiative that provides training and assistance to the institutions that received the “Community Learning Hub” grant in the previous year. This initiative focuses especially on those organizations focused on strengthening of local art and culture, business and marketing management, writing and publishing, and utilization of ICT in programme and institutional development.
Other initiatives: Non-formal and informal education have a dynamic nature of development and hence, community involvement and engagement in it play significant role. In order to accommodate it, the Directorate of Community Education Development facilitates community’s initiatives to be part of community education development through the provision of related programs and competitive funding. One such initiative is the “Improving the Quality of Community Learning Centres” programme. This initiative focuses on improving the abilities of managers of Community Learning Centres in terms of management, governance, efficiency and professionalism, so as to enhance the character of the Community Learning Centre Communication Forum at the national, provincial and district/city level.
3.6 Stages of literacy and learning in the LLSE programmeLiteracy education services in Indonesia begin with a basic literacy programme for illiterate adults. Learners who complete the basic programme then have a literacy test and those who pass the test obtain a Literacy Certificate known as a Surat Keterangan Melek Aksara (SUKMA). The SUKMA is signed by the Head of District Education Office and the serial number of the certificate is issued by the Ministry of Education and Culture. Learners who do not achieve the required literacy level are given a Certificate of Learning Accomplishment, signed by the head of the institution.
The learners with the best grades in the basic literacy programme are encouraged to continue their studies to maintain and develop their literacy skills in the Literacy for Life Skills and Entrepreneurship programme, which is made up of three sub-programmes: the Self Entrepreneurship Literacy programme, the Life Skills Education programme and the Piloting Entrepreneurship Incubator.
The LLSE programme begins with the SEL programme. Learners who have completed the SEL programme can then join the LSE or the PEI, depending on their ability. Some female learners can join both the LSE and the PEI after completing the SEL: they join the LSE then go directly to the PEI after completing the LSE.
Each of the three programmes (SEL, LSE, and PEI) requires learners to have a pre-requisite level of education. The SEL requires a basic literacy certificate (SUKMA), the LSE requires a primary school level of education (school, MI or Package A), and the PEI requires a junior secondary school level of education (school, MT or Package B).
Diagram 3.2: illustrates the stages of the LLSE programme in Indonesia.
Diagram 3.2: Stages of literacy education
Basic Literacy SEL Life SkillsPiloting
EntrepreneurshipIncubator
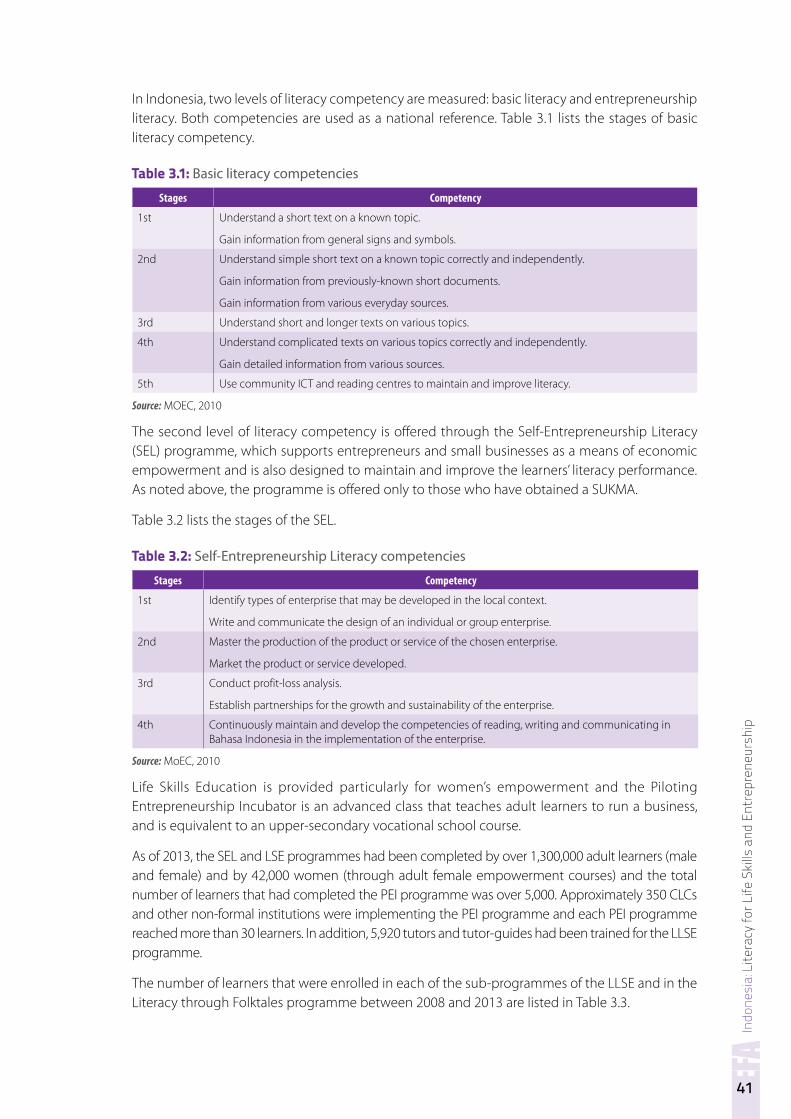
Indo
nesi
a: L
itera
cy fo
r Life
Ski
lls a
nd E
ntre
pren
eurs
hip
41
In Indonesia, two levels of literacy competency are measured: basic literacy and entrepreneurship literacy. Both competencies are used as a national reference. Table 3.1 lists the stages of basic literacy competency.
Table 3.1: Basic literacy competencies
Stages Competency
1st Understand a short text on a known topic.
Gain information from general signs and symbols.
2nd Understand simple short text on a known topic correctly and independently.
Gain information from previously-known short documents.
Gain information from various everyday sources.
3rd Understand short and longer texts on various topics.
4th Understand complicated texts on various topics correctly and independently.
Gain detailed information from various sources.
5th Use community ICT and reading centres to maintain and improve literacy.
Source: MOEC, 2010
The second level of literacy competency is offered through the Self-Entrepreneurship Literacy (SEL) programme, which supports entrepreneurs and small businesses as a means of economic empowerment and is also designed to maintain and improve the learners’ literacy performance. As noted above, the programme is offered only to those who have obtained a SUKMA.
Table 3.2 lists the stages of the SEL.
Table 3.2: Self-Entrepreneurship Literacy competencies
Stages Competency
1st Identify types of enterprise that may be developed in the local context.
Write and communicate the design of an individual or group enterprise.
2nd Master the production of the product or service of the chosen enterprise.
Market the product or service developed.
3rd Conduct profit-loss analysis.
Establish partnerships for the growth and sustainability of the enterprise.
4th Continuously maintain and develop the competencies of reading, writing and communicating in Bahasa Indonesia in the implementation of the enterprise.
Source: MoEC, 2010
Life Skills Education is provided particularly for women’s empowerment and the Piloting Entrepreneurship Incubator is an advanced class that teaches adult learners to run a business, and is equivalent to an upper-secondary vocational school course.
As of 2013, the SEL and LSE programmes had been completed by over 1,300,000 adult learners (male and female) and by 42,000 women (through adult female empowerment courses) and the total number of learners that had completed the PEI programme was over 5,000. Approximately 350 CLCs and other non-formal institutions were implementing the PEI programme and each PEI programme reached more than 30 learners. In addition, 5,920 tutors and tutor-guides had been trained for the LLSE programme.
The number of learners that were enrolled in each of the sub-programmes of the LLSE and in the Literacy through Folktales programme between 2008 and 2013 are listed in Table 3.3.
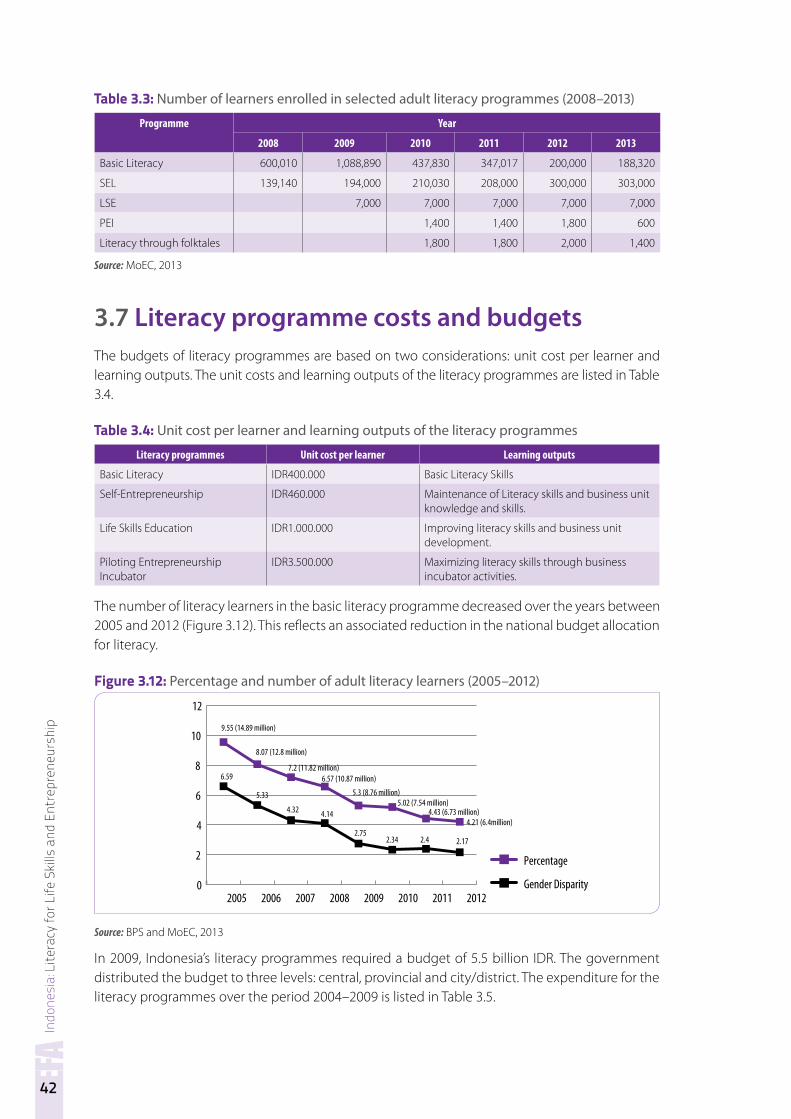
Indo
nesi
a: L
itera
cy fo
r Life
Ski
lls a
nd E
ntre
pren
eurs
hip
42
Table 3.3: Number of learners enrolled in selected adult literacy programmes (2008–2013)
Programme Year
2008 2009 2010 2011 2012 2013
Basic Literacy 600,010 1,088,890 437,830 347,017 200,000 188,320
SEL 139,140 194,000 210,030 208,000 300,000 303,000
LSE 7,000 7,000 7,000 7,000 7,000
PEI 1,400 1,400 1,800 600
Literacy through folktales 1,800 1,800 2,000 1,400
Source: MoEC, 2013
3.7 Literacy programme costs and budgetsThe budgets of literacy programmes are based on two considerations: unit cost per learner and learning outputs. The unit costs and learning outputs of the literacy programmes are listed in Table 3.4.
Table 3.4: Unit cost per learner and learning outputs of the literacy programmes
Literacy programmes Unit cost per learner Learning outputs
Basic Literacy IDR400.000 Basic Literacy Skills
Self-Entrepreneurship IDR460.000 Maintenance of Literacy skills and business unit knowledge and skills.
Life Skills Education IDR1.000.000 Improving literacy skills and business unit development.
Piloting Entrepreneurship Incubator
IDR3.500.000 Maximizing literacy skills through business incubator activities.
The number of literacy learners in the basic literacy programme decreased over the years between 2005 and 2012 (Figure 3.12). This reflects an associated reduction in the national budget allocation for literacy.
Figure 3.12: Percentage and number of adult literacy learners (2005–2012)
2006 2007 2008 2009 2010 2011 20120
2
4
6
8
10
12
Gender Disparity
Percentage
2005
9.55 (14.89 million)
6.59
5.33
4.32 4.14
2.752.34 2.4 2.17
8.07 (12.8 million)
7.2 (11.82 million)6.57 (10.87 million)
5.3 (8.76 million)5.02 (7.54 million)
4.43 (6.73 million)4.21 (6.4million)
Source: BPS and MoEC, 2013
In 2009, Indonesia’s literacy programmes required a budget of 5.5 billion IDR. The government distributed the budget to three levels: central, provincial and city/district. The expenditure for the literacy programmes over the period 2004–2009 is listed in Table 3.5.
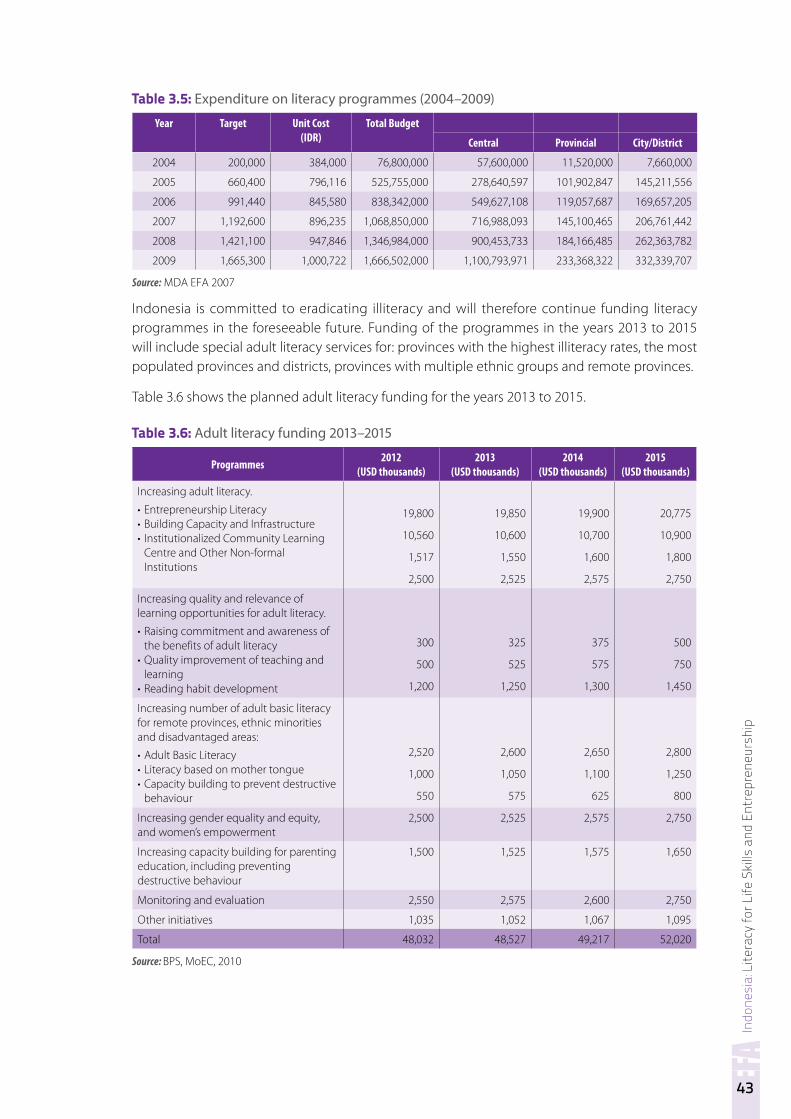
Indo
nesi
a: L
itera
cy fo
r Life
Ski
lls a
nd E
ntre
pren
eurs
hip
43
Table 3.5: Expenditure on literacy programmes (2004–2009)
Year Target Unit Cost (IDR)
Total Budget
Central Provincial City/District
2004 200,000 384,000 76,800,000 57,600,000 11,520,000 7,660,000
2005 660,400 796,116 525,755,000 278,640,597 101,902,847 145,211,556
2006 991,440 845,580 838,342,000 549,627,108 119,057,687 169,657,205
2007 1,192,600 896,235 1,068,850,000 716,988,093 145,100,465 206,761,442
2008 1,421,100 947,846 1,346,984,000 900,453,733 184,166,485 262,363,782
2009 1,665,300 1,000,722 1,666,502,000 1,100,793,971 233,368,322 332,339,707
Source: MDA EFA 2007
Indonesia is committed to eradicating illiteracy and will therefore continue funding literacy programmes in the foreseeable future. Funding of the programmes in the years 2013 to 2015 will include special adult literacy services for: provinces with the highest illiteracy rates, the most populated provinces and districts, provinces with multiple ethnic groups and remote provinces.
Table 3.6 shows the planned adult literacy funding for the years 2013 to 2015.
Table 3.6: Adult literacy funding 2013–2015
Programmes 2012 (USD thousands)
2013 (USD thousands)
2014 (USD thousands)
2015 (USD thousands)
Increasing adult literacy.
• Entrepreneurship Literacy• Building Capacity and Infrastructure• Institutionalized Community Learning
Centre and Other Non-formal Institutions
19,800
10,560
1,517
2,500
19,850
10,600
1,550
2,525
19,900
10,700
1,600
2,575
20,775
10,900
1,800
2,750
Increasing quality and relevance of learning opportunities for adult literacy.
• Raising commitment and awareness of the benefits of adult literacy
• Quality improvement of teaching and learning
• Reading habit development
300
500
1,200
325
525
1,250
375
575
1,300
500
750
1,450
Increasing number of adult basic literacy for remote provinces, ethnic minorities and disadvantaged areas:
• Adult Basic Literacy • Literacy based on mother tongue• Capacity building to prevent destructive
behaviour
2,520
1,000
550
2,600
1,050
575
2,650
1,100
625
2,800
1,250
800
Increasing gender equality and equity, and women’s empowerment
2,500 2,525 2,575 2,750
Increasing capacity building for parenting education, including preventing destructive behaviour
1,500 1,525 1,575 1,650
Monitoring and evaluation 2,550 2,575 2,600 2,750
Other initiatives 1,035 1,052 1,067 1,095
Total 48,032 48,527 49,217 52,020
Source: BPS, MoEC, 2010
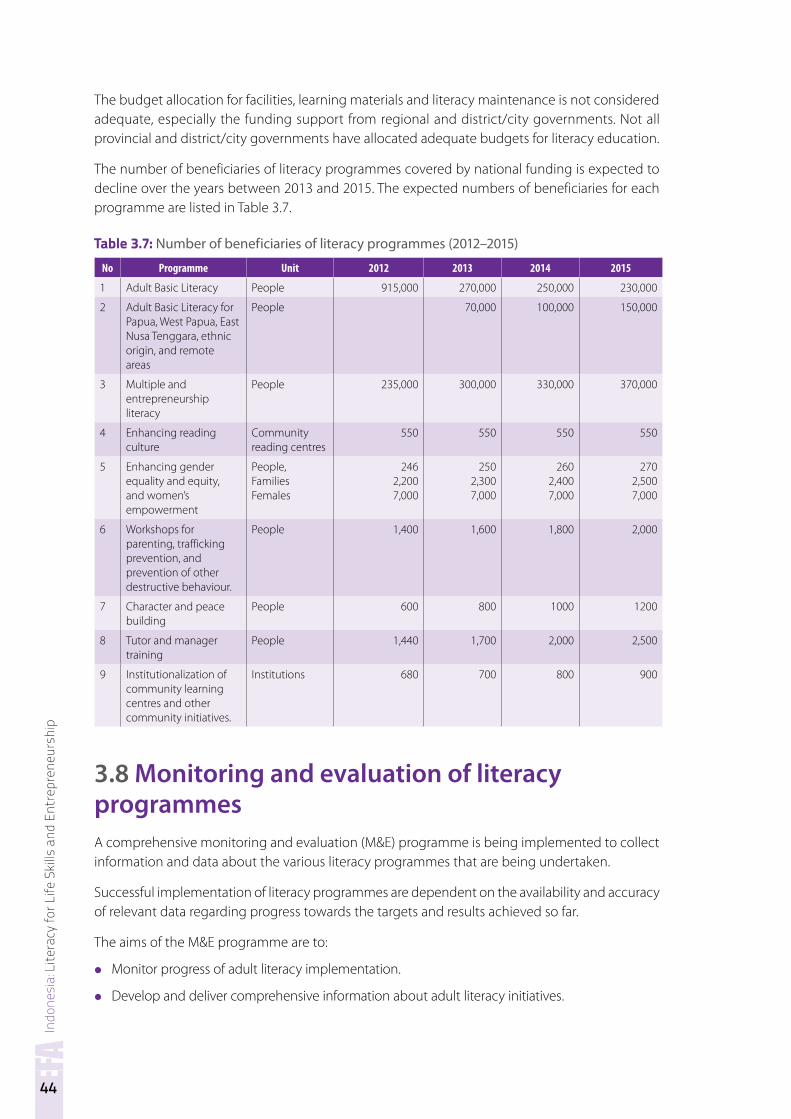
Indo
nesi
a: L
itera
cy fo
r Life
Ski
lls a
nd E
ntre
pren
eurs
hip
44
The budget allocation for facilities, learning materials and literacy maintenance is not considered adequate, especially the funding support from regional and district/city governments. Not all provincial and district/city governments have allocated adequate budgets for literacy education.
The number of beneficiaries of literacy programmes covered by national funding is expected to decline over the years between 2013 and 2015. The expected numbers of beneficiaries for each programme are listed in Table 3.7.
Table 3.7: Number of beneficiaries of literacy programmes (2012–2015)
No Programme Unit 2012 2013 2014 2015
1 Adult Basic Literacy People 915,000 270,000 250,000 230,000
2 Adult Basic Literacy for Papua, West Papua, East Nusa Tenggara, ethnic origin, and remote areas
People 70,000 100,000 150,000
3 Multiple and entrepreneurship literacy
People 235,000 300,000 330,000 370,000
4 Enhancing reading culture
Community reading centres
550 550 550 550
5 Enhancing gender equality and equity, and women’s empowerment
People, Families Females
246 2,200 7,000
250 2,300 7,000
260 2,400 7,000
270 2,500 7,000
6 Workshops for parenting, trafficking prevention, and prevention of other destructive behaviour.
People 1,400 1,600 1,800 2,000
7 Character and peace building
People 600 800 1000 1200
8 Tutor and manager training
People 1,440 1,700 2,000 2,500
9 Institutionalization of community learning centres and other community initiatives.
Institutions 680 700 800 900
3.8 Monitoring and evaluation of literacy programmesA comprehensive monitoring and evaluation (M&E) programme is being implemented to collect information and data about the various literacy programmes that are being undertaken.
Successful implementation of literacy programmes are dependent on the availability and accuracy of relevant data regarding progress towards the targets and results achieved so far.
The aims of the M&E programme are to:
• Monitor progress of adult literacy implementation.
• Develop and deliver comprehensive information about adult literacy initiatives.
Indo
nesi
a: L
itera
cy fo
r Life
Ski
lls a
nd E
ntre
pren
eurs
hip
45
• Gain information about the impact and outcome of the programmes.
• Evaluate achievements of the adult literacy programmes at the district, city, province and national levels.
Develop a management information system.
The process of evaluation of literacy education programmes includes: a pre-learning assessment of learners (tests of learners’ abilities before beginning literacy programmes), assessments by the tutors during the learning process, and post-learning tests. Tests and assessments of students consider five competencies, namely listening, speaking, reading, writing and arithmetic.
M&E activities are conducted through assessments and data collection by the National Bureau of Statistics, using the UNESCO Literacy Assessment Monitoring Programme (LAMP).
Assessments of literacy programmes undertaken in recent years have revealed a number of issues facing adult literacy education, including the following:
• Literacy learners are highly likely to relapse into illiteracy.
• Literacy tutors are usually poorly trained with very limited teaching and learning materials.
• Although there are several literacy activities that use innovative techniques to enhance literacy skills and these approaches are successful, they are not well documented.
Indo
nesi
a: L
itera
cy fo
r Life
Ski
lls a
nd E
ntre
pren
eurs
hip
46
The Literacy for Life Skills and Entrepreneurship programme
This chapter describes the findings of the case study of the Literacy for Life Skills and Entrepreneurship programme.
4.1 Introduction to the LLSE programme
4 1 1 GoalsThe LLSE programme has three main goals for learners: (i) improvement of literacy skills (ii) mastery of life skills and (iii) development of entrepreneurship skills. Through its integrated components, including teaching of functional literacy in mother tongues, it enhances the literate environment of communities and particularly endeavours to empower women through combining training in basic literacy with life skills training.
This literacy programme is an effective intervention to sustain reading skills of new readers while developing entrepreneurship literacy as a tool for poverty alleviation. The programme counters the tendency of newly-literate people to relapse into illiteracy. It does not simply introduce texts, but it stimulates the participants to be productive and self-reliant in generating income and being part of developing the nation. The LLSE programme offers participants the opportunity to learn the skills necessary to access the small-business sector and earn a higher income.
4 1 2 Delivery of servicesThe Literacy for Life Skills and Entrepreneurship programme is a community-based learning initiative, classes for which are held in CLCs and in faith-based venues such as mosques, madrasahs and churches in villages across Indonesia, which provide safe learning spaces that are within easy reach.
4 1 3 Principles of the LLSE programmeThe LLSE programme was developed based on certain principles, as listed below.
• Priority principle: Literacy programmes and services must contribute to achieving universal literacy in Indonesia by meeting national targets while being appropriate to local community needs.
• Focused engagement principle: Engagement is focused on rural and urban poor illiterates, especially female illiterates.
• Special access principle: The literacy education services are accessible to vulnerable young adults and disadvantaged groups.
• Ethnic minority engagement principle: Engagement with ethnic minority children, parents, and leaders is central to the design and delivery of services in reaching the unreached.
4
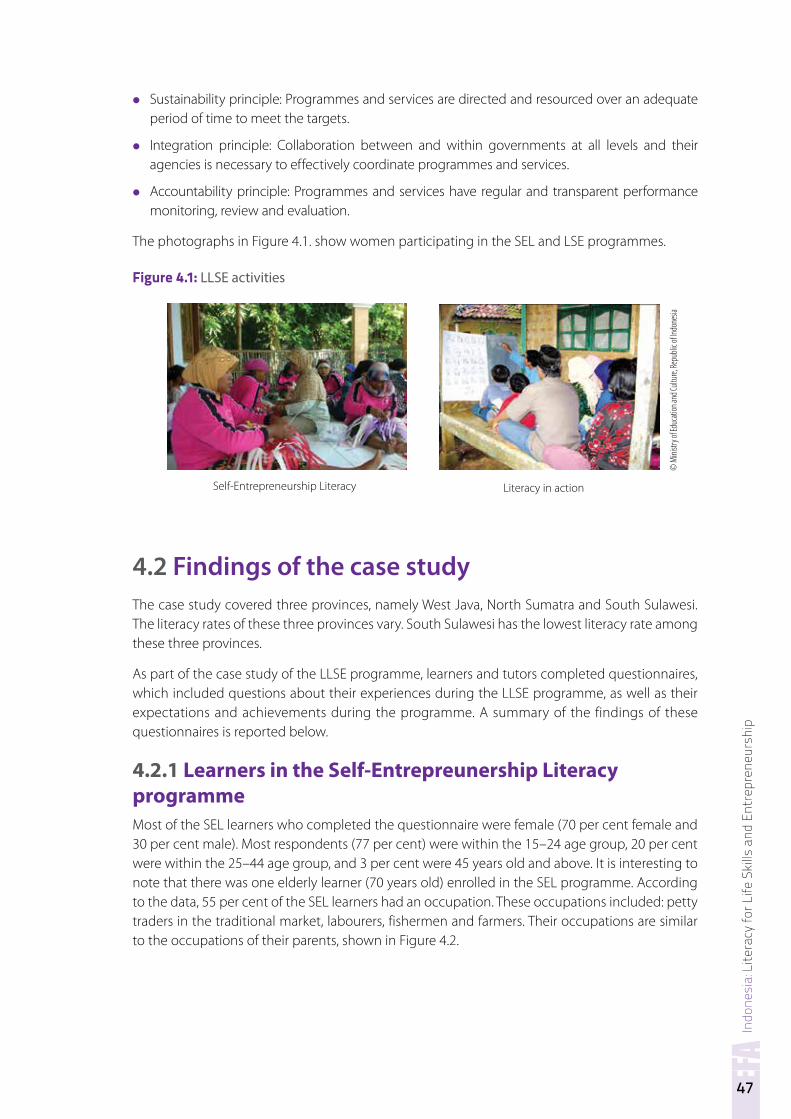
Indo
nesi
a: L
itera
cy fo
r Life
Ski
lls a
nd E
ntre
pren
eurs
hip
47
• Sustainability principle: Programmes and services are directed and resourced over an adequate period of time to meet the targets.
• Integration principle: Collaboration between and within governments at all levels and their agencies is necessary to effectively coordinate programmes and services.
• Accountability principle: Programmes and services have regular and transparent performance monitoring, review and evaluation.
The photographs in Figure 4.1. show women participating in the SEL and LSE programmes.
Figure 4.1: LLSE activities
4.2 Findings of the case studyThe case study covered three provinces, namely West Java, North Sumatra and South Sulawesi. The literacy rates of these three provinces vary. South Sulawesi has the lowest literacy rate among these three provinces.
As part of the case study of the LLSE programme, learners and tutors completed questionnaires, which included questions about their experiences during the LLSE programme, as well as their expectations and achievements during the programme. A summary of the findings of these questionnaires is reported below.
4 2 1 Learners in the Self-Entrepreunership Literacy programmeMost of the SEL learners who completed the questionnaire were female (70 per cent female and 30 per cent male). Most respondents (77 per cent) were within the 15–24 age group, 20 per cent were within the 25–44 age group, and 3 per cent were 45 years old and above. It is interesting to note that there was one elderly learner (70 years old) enrolled in the SEL programme. According to the data, 55 per cent of the SEL learners had an occupation. These occupations included: petty traders in the traditional market, labourers, fishermen and farmers. Their occupations are similar to the occupations of their parents, shown in Figure 4.2.
Self-Entrepreneurship Literacy Literacy in action
© M
inistr
y of E
duca
tion a
nd Cu
lture,
Repu
blic o
f Indo
nesia
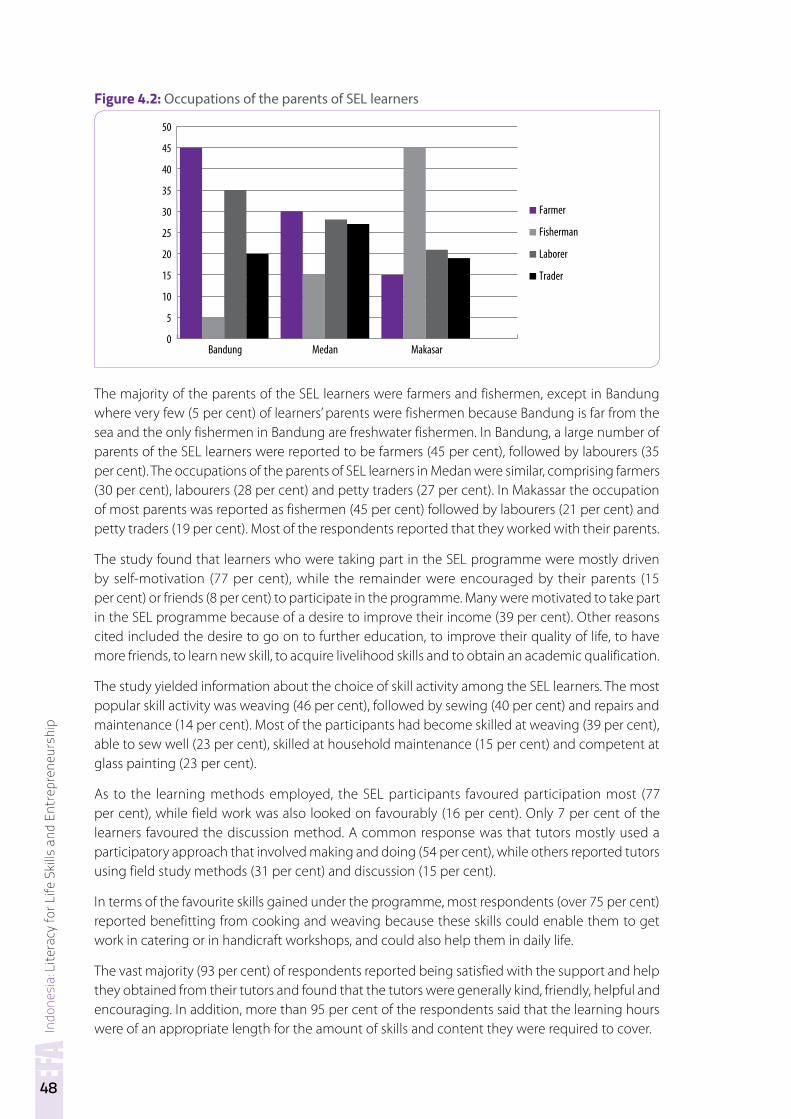
Indo
nesi
a: L
itera
cy fo
r Life
Ski
lls a
nd E
ntre
pren
eurs
hip
48
Figure 4.2: Occupations of the parents of SEL learners
0
5
10
15
20
25
30
35
40
45
50
Bandung Medan Makasar
Farmer
Fisherman
Laborer
Trader
The majority of the parents of the SEL learners were farmers and fishermen, except in Bandung where very few (5 per cent) of learners’ parents were fishermen because Bandung is far from the sea and the only fishermen in Bandung are freshwater fishermen. In Bandung, a large number of parents of the SEL learners were reported to be farmers (45 per cent), followed by labourers (35 per cent). The occupations of the parents of SEL learners in Medan were similar, comprising farmers (30 per cent), labourers (28 per cent) and petty traders (27 per cent). In Makassar the occupation of most parents was reported as fishermen (45 per cent) followed by labourers (21 per cent) and petty traders (19 per cent). Most of the respondents reported that they worked with their parents.
The study found that learners who were taking part in the SEL programme were mostly driven by self-motivation (77 per cent), while the remainder were encouraged by their parents (15 per cent) or friends (8 per cent) to participate in the programme. Many were motivated to take part in the SEL programme because of a desire to improve their income (39 per cent). Other reasons cited included the desire to go on to further education, to improve their quality of life, to have more friends, to learn new skill, to acquire livelihood skills and to obtain an academic qualification.
The study yielded information about the choice of skill activity among the SEL learners. The most popular skill activity was weaving (46 per cent), followed by sewing (40 per cent) and repairs and maintenance (14 per cent). Most of the participants had become skilled at weaving (39 per cent), able to sew well (23 per cent), skilled at household maintenance (15 per cent) and competent at glass painting (23 per cent).
As to the learning methods employed, the SEL participants favoured participation most (77 per cent), while field work was also looked on favourably (16 per cent). Only 7 per cent of the learners favoured the discussion method. A common response was that tutors mostly used a participatory approach that involved making and doing (54 per cent), while others reported tutors using field study methods (31 per cent) and discussion (15 per cent).
In terms of the favourite skills gained under the programme, most respondents (over 75 per cent) reported benefitting from cooking and weaving because these skills could enable them to get work in catering or in handicraft workshops, and could also help them in daily life.
The vast majority (93 per cent) of respondents reported being satisfied with the support and help they obtained from their tutors and found that the tutors were generally kind, friendly, helpful and encouraging. In addition, more than 95 per cent of the respondents said that the learning hours were of an appropriate length for the amount of skills and content they were required to cover.
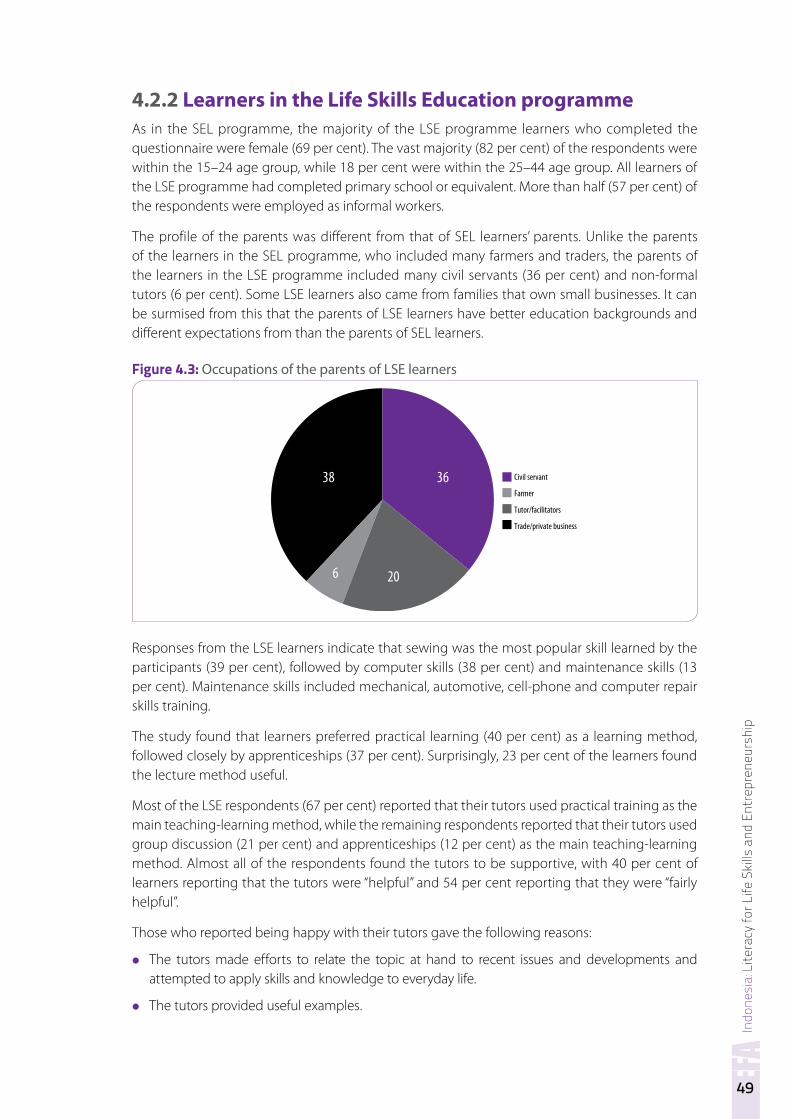
Indo
nesi
a: L
itera
cy fo
r Life
Ski
lls a
nd E
ntre
pren
eurs
hip
49
4 2 2 Learners in the Life Skills Education programmeAs in the SEL programme, the majority of the LSE programme learners who completed the questionnaire were female (69 per cent). The vast majority (82 per cent) of the respondents were within the 15–24 age group, while 18 per cent were within the 25–44 age group. All learners of the LSE programme had completed primary school or equivalent. More than half (57 per cent) of the respondents were employed as informal workers.
The profile of the parents was different from that of SEL learners’ parents. Unlike the parents of the learners in the SEL programme, who included many farmers and traders, the parents of the learners in the LSE programme included many civil servants (36 per cent) and non-formal tutors (6 per cent). Some LSE learners also came from families that own small businesses. It can be surmised from this that the parents of LSE learners have better education backgrounds and different expectations from than the parents of SEL learners.
Figure 4.3: Occupations of the parents of LSE learners
Civil servant
Farmer
Tutor/facilitators
Trade/private business
36
20
38
6
Responses from the LSE learners indicate that sewing was the most popular skill learned by the participants (39 per cent), followed by computer skills (38 per cent) and maintenance skills (13 per cent). Maintenance skills included mechanical, automotive, cell-phone and computer repair skills training.
The study found that learners preferred practical learning (40 per cent) as a learning method, followed closely by apprenticeships (37 per cent). Surprisingly, 23 per cent of the learners found the lecture method useful.
Most of the LSE respondents (67 per cent) reported that their tutors used practical training as the main teaching-learning method, while the remaining respondents reported that their tutors used group discussion (21 per cent) and apprenticeships (12 per cent) as the main teaching-learning method. Almost all of the respondents found the tutors to be supportive, with 40 per cent of learners reporting that the tutors were “helpful” and 54 per cent reporting that they were “fairly helpful”.
Those who reported being happy with their tutors gave the following reasons:
• The tutors made efforts to relate the topic at hand to recent issues and developments and attempted to apply skills and knowledge to everyday life.
• The tutors provided useful examples.
Indo
nesi
a: L
itera
cy fo
r Life
Ski
lls a
nd E
ntre
pren
eurs
hip
50
• The tutors took care to generate active participation in class.
• The tutors encouraged learners to learn new things.
• The tutors made clear to learners what and why particular knowledge was useful to them.
• The tutors catered to individual differences and took the time to help slow learners.
• The tutors used various references rather than merely relying on textbooks.
• The tutors increased the knowledge, insights, skills and experiences that would be useful to learners in their future lives.
• The tutors selected learning sites that were located in strategic positions and were easily accessible.
• The tutors made an effort to provide clean, comfortable and conducive learning environments.
The participants who were dissatisfied with the way the LSE programme conducted was conducted gave the following feedback:
• Tutors had the tendency to come late to class.
• Tutors were not encouraging when students expressed their ideas and asked questions.
• Tutors failed to engage learners.
• Facilities to support good teaching-learning were lacking.
Almost all (95 per cent) of the LSE participants who completed the questionnaire reported that they joined the programme as a result of self-motivation while the remainder (5 per cent) did so in response to advice from significant people. The main motivation to take part in the LSE programme seemed to be the desire to earn a higher income. Other motivating factors included the desire to acquire enough skills and knowledge to become successful entrepreneurs, the desire and to improve their employability and living conditions, and the desire to obtain the “Package B” certificate, which is equivalent to the junior secondary school certificate.
4 2 3 Learners in the Piloting Entrepreneurship Incubator programmeAccording to the questionnaire results, the majority of participants (72.3 per cent) in the PEI programme were male. The PEI participants ranged in age from 21 to 45 years old. Almost all participants (80 per cent) had completed junior secondary school, MT or Package B, and the remainder (20 per cent) had completed Senior Secondary School, MA or Package C. Almost half of the PEI learners who had not completed junior secondary school or an equivalent were participating in Package C courses at the same time.
The occupations of the parents of PEI participants were different from the occupations of the parents of the SEL and LSE participants (see Figure 4.4). Interestingly, almost half (49.8 per cent) of the PEI learners reported that their parents were unemployed. One third (33.2 per cent) of the respondents reported that their parents operated small- and medium-sized enterprises in the fields of agriculture and craft. Others reported that their parents were traders (15 per cent) and farmers (15 per cent), while a few respondents (2 per cent) reported that their parents were civil servants.
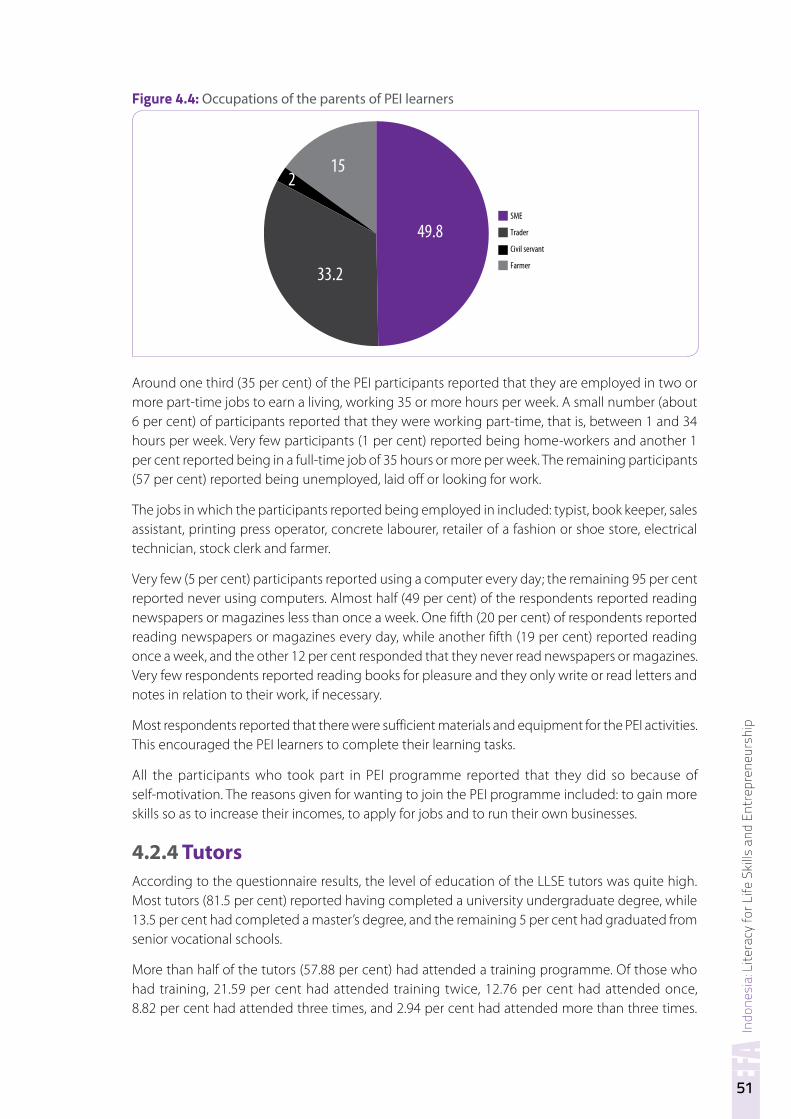
Indo
nesi
a: L
itera
cy fo
r Life
Ski
lls a
nd E
ntre
pren
eurs
hip
51
Figure 4.4: Occupations of the parents of PEI learners
SME
Trader
Civil servant
Farmer
49.8
33.2
152
Around one third (35 per cent) of the PEI participants reported that they are employed in two or more part-time jobs to earn a living, working 35 or more hours per week. A small number (about 6 per cent) of participants reported that they were working part-time, that is, between 1 and 34 hours per week. Very few participants (1 per cent) reported being home-workers and another 1 per cent reported being in a full-time job of 35 hours or more per week. The remaining participants (57 per cent) reported being unemployed, laid off or looking for work.
The jobs in which the participants reported being employed in included: typist, book keeper, sales assistant, printing press operator, concrete labourer, retailer of a fashion or shoe store, electrical technician, stock clerk and farmer.
Very few (5 per cent) participants reported using a computer every day; the remaining 95 per cent reported never using computers. Almost half (49 per cent) of the respondents reported reading newspapers or magazines less than once a week. One fifth (20 per cent) of respondents reported reading newspapers or magazines every day, while another fifth (19 per cent) reported reading once a week, and the other 12 per cent responded that they never read newspapers or magazines. Very few respondents reported reading books for pleasure and they only write or read letters and notes in relation to their work, if necessary.
Most respondents reported that there were sufficient materials and equipment for the PEI activities. This encouraged the PEI learners to complete their learning tasks.
All the participants who took part in PEI programme reported that they did so because of self-motivation. The reasons given for wanting to join the PEI programme included: to gain more skills so as to increase their incomes, to apply for jobs and to run their own businesses.
4 2 4 TutorsAccording to the questionnaire results, the level of education of the LLSE tutors was quite high. Most tutors (81.5 per cent) reported having completed a university undergraduate degree, while 13.5 per cent had completed a master’s degree, and the remaining 5 per cent had graduated from senior vocational schools.
More than half of the tutors (57.88 per cent) had attended a training programme. Of those who had training, 21.59 per cent had attended training twice, 12.76 per cent had attended once, 8.82 per cent had attended three times, and 2.94 per cent had attended more than three times.
Indo
nesi
a: L
itera
cy fo
r Life
Ski
lls a
nd E
ntre
pren
eurs
hip
52
Of tutors who had attended training, the majority (81 per cent) reported attending the training at the provincial level, while 12.33 per cent attended training at the central level and 6.67 per cent at the district or municipal level.
Around 70 per cent of the tutors surveyed reported having a second job, while 27 per cent did not have any other employment and 3 per cent operated their own small businesses. The tutors’ other jobs included teaching (58.33 per cent) and private sector employment (12.5 per cent). The remainder (29.17 per cent) reported being engaged in various other forms of employment.
Around one fifth of the tutors (20.59 per cent) reported being involved in tutoring SEL, while a similar percentage (23.53 per cent) reported being involved in tutoring LSE. About 21.76 per cent were involved in tutoring both SEL and LSE; 21.76 per cent were involved in tutoring LSE and PEI, and 34.12 per cent were involved in tutoring PEI.
4.3 Findings based on the research questions This section describes the findings of the interviews, the observations and the review of documentary materials. The findings are presented in the order of the research questions.
4 3 1 Question 1: The contribution of learners’ literacy skills towards alleviation of their poverty
Findings on literacy proficiency of adult learnersAll of the learners participating in the LLSE programme have a SUKMA. Thus, all of these learners are literate and their participation in the SEL, LSE and PEI is a means of maintaining their literacy while becoming empowered to alleviate their poverty. Information collected from the interviews with tutors and facilitators indicates that the literacy level of the majority of adult learners they taught is Level 3: the ability to understand short and longer texts on various topics (see Table 3.1 in Chapter 3).
The tutors reported that most of their students fell within the age range of 15 to 59. They reported that the oldest age group (45–59) tended to have the lowest scores on both literacy and numeracy, on average. The middle group (25–44) was slightly better at being able to reach Level 4 literacy: “able to understand complicated texts on various topics correctly and independently” and “gain detailed information from various sources”. The youngest group (15–24) had the best literacy proficiency. This was reported as being because some youth are able to use “community ICT and reading centres to maintain and improve their literacy”.
SEL/LSE/PEI proficiency of adult learnersDuring the interviews and focus group discussions, the case study team displayed a table listing the skills gained in the LLSE programme and asked the respondents about the skills of the learners’ of the SEL, LSE, and PEI programmes. The responses are summarized in Table 4.2.
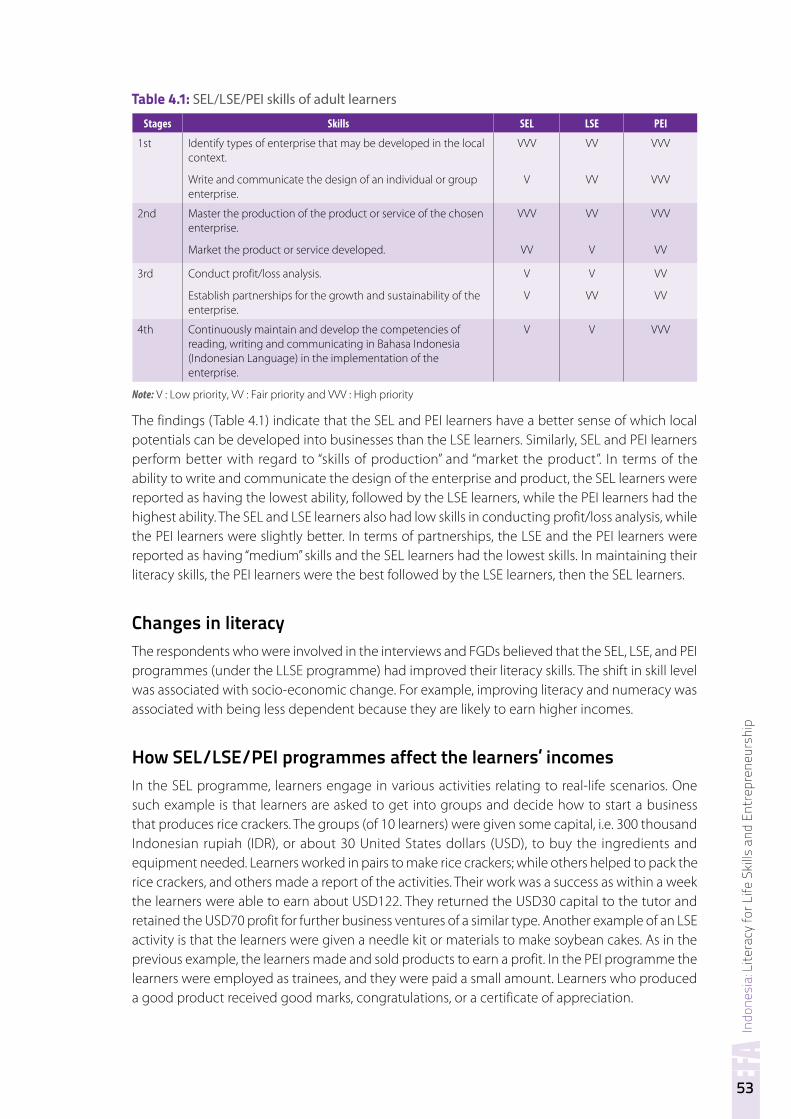
Indo
nesi
a: L
itera
cy fo
r Life
Ski
lls a
nd E
ntre
pren
eurs
hip
53
Table 4.1: SEL/LSE/PEI skills of adult learners
Stages Skills SEL LSE PEI
1st Identify types of enterprise that may be developed in the local context.
Write and communicate the design of an individual or group enterprise.
VVV
V
VV
VV
VVV
VVV
2nd Master the production of the product or service of the chosen enterprise.
Market the product or service developed.
VVV
VV
VV
V
VVV
VV
3rd Conduct profit/loss analysis.
Establish partnerships for the growth and sustainability of the enterprise.
V
V
V
VV
VV
VV
4th Continuously maintain and develop the competencies of reading, writing and communicating in Bahasa Indonesia (Indonesian Language) in the implementation of the enterprise.
V V VVV
Note: V : Low priority, VV : Fair priority and VVV : High priority
The findings (Table 4.1) indicate that the SEL and PEI learners have a better sense of which local potentials can be developed into businesses than the LSE learners. Similarly, SEL and PEI learners perform better with regard to “skills of production” and “market the product”. In terms of the ability to write and communicate the design of the enterprise and product, the SEL learners were reported as having the lowest ability, followed by the LSE learners, while the PEI learners had the highest ability. The SEL and LSE learners also had low skills in conducting profit/loss analysis, while the PEI learners were slightly better. In terms of partnerships, the LSE and the PEI learners were reported as having “medium” skills and the SEL learners had the lowest skills. In maintaining their literacy skills, the PEI learners were the best followed by the LSE learners, then the SEL learners.
Changes in literacyThe respondents who were involved in the interviews and FGDs believed that the SEL, LSE, and PEI programmes (under the LLSE programme) had improved their literacy skills. The shift in skill level was associated with socio-economic change. For example, improving literacy and numeracy was associated with being less dependent because they are likely to earn higher incomes.
How SEL/LSE/PEI programmes affect the learners’ incomesIn the SEL programme, learners engage in various activities relating to real-life scenarios. One such example is that learners are asked to get into groups and decide how to start a business that produces rice crackers. The groups (of 10 learners) were given some capital, i.e. 300 thousand Indonesian rupiah (IDR), or about 30 United States dollars (USD), to buy the ingredients and equipment needed. Learners worked in pairs to make rice crackers; while others helped to pack the rice crackers, and others made a report of the activities. Their work was a success as within a week the learners were able to earn about USD122. They returned the USD30 capital to the tutor and retained the USD70 profit for further business ventures of a similar type. Another example of an LSE activity is that the learners were given a needle kit or materials to make soybean cakes. As in the previous example, the learners made and sold products to earn a profit. In the PEI programme the learners were employed as trainees, and they were paid a small amount. Learners who produced a good product received good marks, congratulations, or a certificate of appreciation.
Indo
nesi
a: L
itera
cy fo
r Life
Ski
lls a
nd E
ntre
pren
eurs
hip
54
Effect of SEL/LSE/PEI proficiency on finding employmentThe study found that higher SEL/LSE/PEI proficiency levels were positively linked to the likelihood of getting jobs in the informal sector, because the learners’ skills had improved. But for more formal jobs, higher certification was required.
4 3 2 Question 2: Learners’ motivation in preserving their literacy skillsAccording to the respondents, the SEL, LSE and PEI programmes were able to attract learners because life skills are seen as playing an important role in improving learners’ socio-economic situation. Respondents felt that the LLSE had assisted adult learners to develop and contribute to their own well-being and that of their families and communities. The adult learners were more confident as a result of participation in the LLSE and had started to break the cycle of exclusion and poverty.
According to the respondents, the best way to encourage participation of adults in SEL/LSE/PEI programmes was by providing conducive learning experiences with activities related to production and selling of products. Also, the ability to describe profit/loss analysis was an important activity to motivate the learners in SEL/LSE/PEI. This is because the ability to calculate profit/loss analysis was a means to encourage learners to practice their numeracy skills and to make them productive and perform well in business activities in the workplace.
Almost all tutors and facilitators who responded to the question of “How do you accommodate individual interests and career goals in SEL/LSE/PEI?” responded that a “career” was never of interest to the learners. The learners were mostly concerned with improving their economic conditions rather than following a career path. Few learners thought that a career had a significant influence on their economic situation. The respondents felt that “empowerment” was the key word to engage learners to work on an individual goal. The tutors also motivated learners by telling real-life stories of famous entrepreneurs. Tutors also said that learners were interested in engaging in trial and error.
Other factors that learners found to be motivating, useful and relevant included:
• Emphasizing practical knowledge.
• Designing a course that provides immediate relevancy.
• Providing examples from everyday life and workplace experiences or associating what is learned with daily life and the workplace.
• Presenting the benefits of undertaking the course.
The tutors reported that the best approach in facilitating the SEL/LSE/PEI was by being respectful, patient, resourceful, motivational and communicative. They reported that the use of humour and asking for feedback were not very important in motivating the learners.
4 3 3 Question 3: Competency of literacy tutorsThe case study teams observed teaching-learning activities were observed during visits to CLCs and other education institutions. One of the key findings from these observations was that much of the teaching was judged as “good” or “fairly good” quality. Some teaching strategies that the CST suggested were effective included setting goals together with the learners and presenting the
Indo
nesi
a: L
itera
cy fo
r Life
Ski
lls a
nd E
ntre
pren
eurs
hip
55
benefits of undertaking the programme. From the observations it was found that learners were all engaged and worked to achieve progress in their individual work. The tutors set up the tasks, provided learning equipment and gave examples of the products.
Types of teaching methods for SEL/LSE/PEIThe tutors acted as monitors and coaches for the learners, ensuring the learners gained the skills and knowledge they needed to create a product, advising them on the selection of appropriate raw materials, guiding the methods they could use, and ensuring the learners stayed focused on their tasks and finished the products within the agreed deadlines.
Time tutors spent watching television, video or DVDsAccording to the respondents, the tutors of the SEL and LSE programmes do not watch videos or DVDs each day, mainly because electronic equipment, electricity and multimedia resources are limited. The tutors do, however, watch television regularly, mostly for news and entertainment. The PEI tutors, on the other hand, watch television, videos and DVDs often, with the intention of improving their entrepreneurial teaching skills. The frequency of watching learning or instructional materials is limited by the availability of such programmes.
Borrowing materials from a learning facilityIn Indonesia, the funding for the LLSE programme does not cover all materials. Implementers are given independence in identifying the best learning materials, according to local contexts and learners’ needs. According to the study findings, tutors use several kinds of learning materials and tools: learning tools that are provided by national government (booklets, leaflets, etc); learning tools that are created based on national government products; and learning tools that are made locally. Very few tutors borrow from a LLSE learning facility. They normally go to a reading corner or community reading centre. If they do not have such facilities in their own communities, some go to community reading centres nearby.
Tutor Training All SEL, LSE, and PEI tutors considered that “identifying causal factors in low income/poverty levels, relating them to the learners’ acquisition of literacy capabilities, and addressing these factors in SEL/LSE/PEI programmes” is a low priority. Training to “manage the programmes appropriate to the different individual needs and aspirations of learners in the context of socio-economic status” was considered a “high” priority for PEI tutors and a “fair” (medium-level) priority for SEL and LSE tutors. Interestingly, “facilitating learning support” and “maintaining records” were considered a “fair” priority. The most significant priority for all tutors was “developing learning plans and partnerships”. Planning LLSE training in cooperation with learners and establishing partnerships to provide real activities were considered “difficult” for both learners and tutors.
The results of interviews and FGDs with respondents and stakeholders about “the most important tutor training to manage SEL/LSE/ PEI” are summarized in Table 4.2.
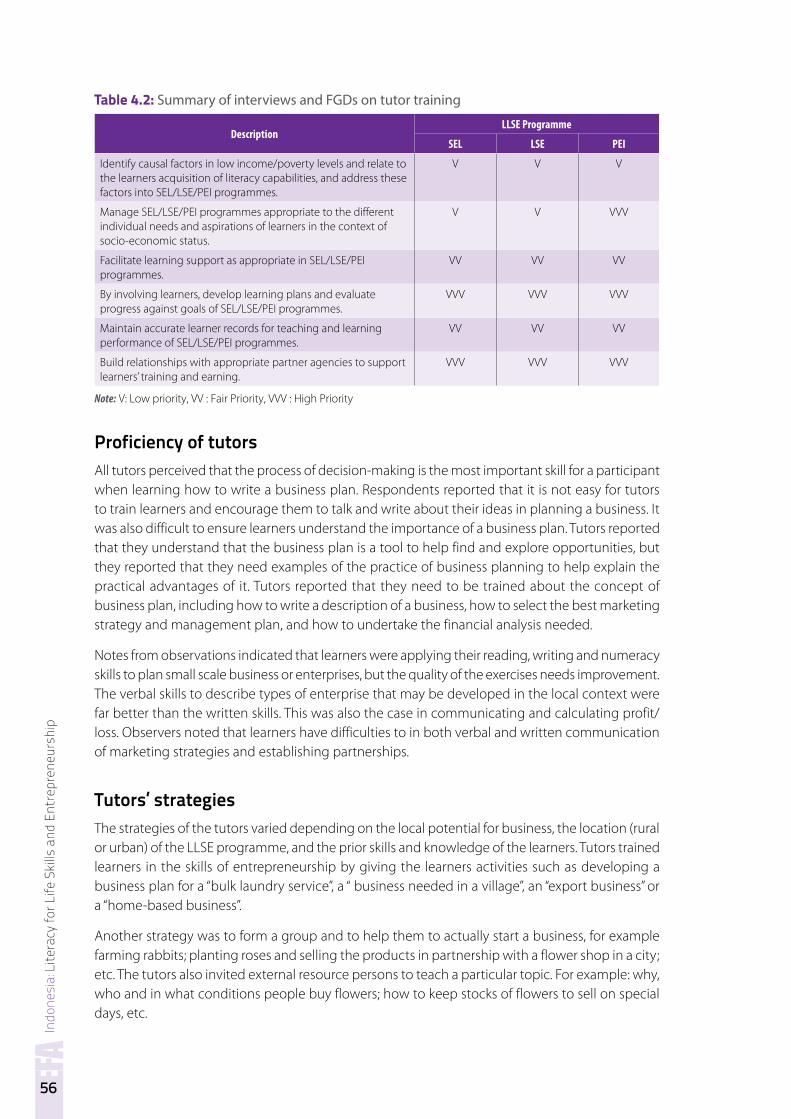
Indo
nesi
a: L
itera
cy fo
r Life
Ski
lls a
nd E
ntre
pren
eurs
hip
56
Table 4.2: Summary of interviews and FGDs on tutor training
DescriptionLLSE Programme
SEL LSE PEI
Identify causal factors in low income/poverty levels and relate to the learners acquisition of literacy capabilities, and address these factors into SEL/LSE/PEI programmes.
V V V
Manage SEL/LSE/PEI programmes appropriate to the different individual needs and aspirations of learners in the context of socio-economic status.
V V VVV
Facilitate learning support as appropriate in SEL/LSE/PEI programmes.
VV VV VV
By involving learners, develop learning plans and evaluate progress against goals of SEL/LSE/PEI programmes.
VVV VVV VVV
Maintain accurate learner records for teaching and learning performance of SEL/LSE/PEI programmes.
VV VV VV
Build relationships with appropriate partner agencies to support learners’ training and earning.
VVV VVV VVV
Note: V: Low priority, VV : Fair Priority, VVV : High Priority
Proficiency of tutors All tutors perceived that the process of decision-making is the most important skill for a participant when learning how to write a business plan. Respondents reported that it is not easy for tutors to train learners and encourage them to talk and write about their ideas in planning a business. It was also difficult to ensure learners understand the importance of a business plan. Tutors reported that they understand that the business plan is a tool to help find and explore opportunities, but they reported that they need examples of the practice of business planning to help explain the practical advantages of it. Tutors reported that they need to be trained about the concept of business plan, including how to write a description of a business, how to select the best marketing strategy and management plan, and how to undertake the financial analysis needed.
Notes from observations indicated that learners were applying their reading, writing and numeracy skills to plan small scale business or enterprises, but the quality of the exercises needs improvement. The verbal skills to describe types of enterprise that may be developed in the local context were far better than the written skills. This was also the case in communicating and calculating profit/loss. Observers noted that learners have difficulties to in both verbal and written communication of marketing strategies and establishing partnerships.
Tutors’ strategiesThe strategies of the tutors varied depending on the local potential for business, the location (rural or urban) of the LLSE programme, and the prior skills and knowledge of the learners. Tutors trained learners in the skills of entrepreneurship by giving the learners activities such as developing a business plan for a “bulk laundry service”, a “ business needed in a village”, an “export business” or a “home-based business”.
Another strategy was to form a group and to help them to actually start a business, for example farming rabbits; planting roses and selling the products in partnership with a flower shop in a city; etc. The tutors also invited external resource persons to teach a particular topic. For example: why, who and in what conditions people buy flowers; how to keep stocks of flowers to sell on special days, etc.
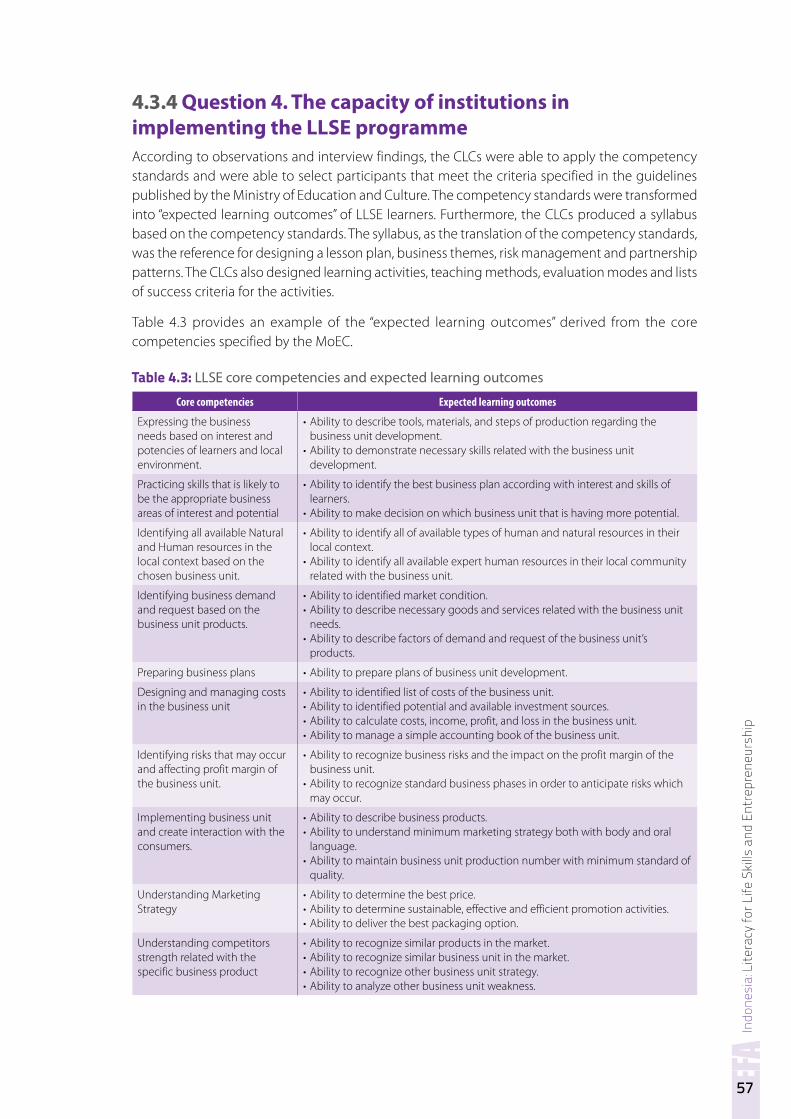
Indo
nesi
a: L
itera
cy fo
r Life
Ski
lls a
nd E
ntre
pren
eurs
hip
57
4 3 4 Question 4 The capacity of institutions in implementing the LLSE programmeAccording to observations and interview findings, the CLCs were able to apply the competency standards and were able to select participants that meet the criteria specified in the guidelines published by the Ministry of Education and Culture. The competency standards were transformed into “expected learning outcomes” of LLSE learners. Furthermore, the CLCs produced a syllabus based on the competency standards. The syllabus, as the translation of the competency standards, was the reference for designing a lesson plan, business themes, risk management and partnership patterns. The CLCs also designed learning activities, teaching methods, evaluation modes and lists of success criteria for the activities.
Table 4.3 provides an example of the “expected learning outcomes” derived from the core competencies specified by the MoEC.
Table 4.3: LLSE core competencies and expected learning outcomes
Core competencies Expected learning outcomes
Expressing the business needs based on interest and potencies of learners and local environment.
• Ability to describe tools, materials, and steps of production regarding the business unit development.
• Ability to demonstrate necessary skills related with the business unit development.
Practicing skills that is likely to be the appropriate business areas of interest and potential
• Ability to identify the best business plan according with interest and skills of learners.
• Ability to make decision on which business unit that is having more potential.
Identifying all available Natural and Human resources in the local context based on the chosen business unit.
• Ability to identify all of available types of human and natural resources in their local context.
• Ability to identify all available expert human resources in their local community related with the business unit.
Identifying business demand and request based on the business unit products.
• Ability to identified market condition.• Ability to describe necessary goods and services related with the business unit
needs. • Ability to describe factors of demand and request of the business unit’s
products.
Preparing business plans • Ability to prepare plans of business unit development.
Designing and managing costs in the business unit
• Ability to identified list of costs of the business unit.• Ability to identified potential and available investment sources.• Ability to calculate costs, income, profit, and loss in the business unit. • Ability to manage a simple accounting book of the business unit.
Identifying risks that may occur and affecting profit margin of the business unit.
• Ability to recognize business risks and the impact on the profit margin of the business unit.
• Ability to recognize standard business phases in order to anticipate risks which may occur.
Implementing business unit and create interaction with the consumers.
• Ability to describe business products.• Ability to understand minimum marketing strategy both with body and oral
language. • Ability to maintain business unit production number with minimum standard of
quality.
Understanding Marketing Strategy
• Ability to determine the best price.• Ability to determine sustainable, effective and efficient promotion activities. • Ability to deliver the best packaging option.
Understanding competitors strength related with the specific business product
• Ability to recognize similar products in the market.• Ability to recognize similar business unit in the market.• Ability to recognize other business unit strategy.• Ability to analyze other business unit weakness.
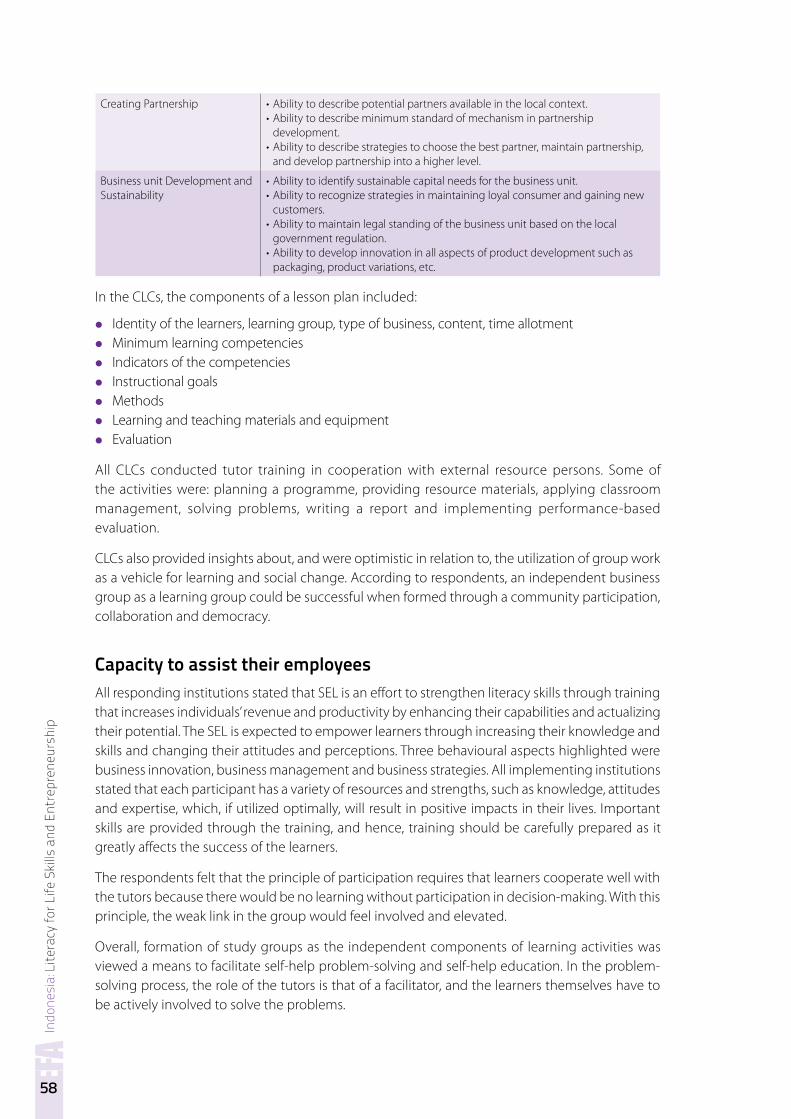
Indo
nesi
a: L
itera
cy fo
r Life
Ski
lls a
nd E
ntre
pren
eurs
hip
58
Creating Partnership • Ability to describe potential partners available in the local context. • Ability to describe minimum standard of mechanism in partnership
development.• Ability to describe strategies to choose the best partner, maintain partnership,
and develop partnership into a higher level.
Business unit Development and Sustainability
• Ability to identify sustainable capital needs for the business unit. • Ability to recognize strategies in maintaining loyal consumer and gaining new
customers.• Ability to maintain legal standing of the business unit based on the local
government regulation. • Ability to develop innovation in all aspects of product development such as
packaging, product variations, etc.
In the CLCs, the components of a lesson plan included:
• Identity of the learners, learning group, type of business, content, time allotment
• Minimum learning competencies
• Indicators of the competencies
• Instructional goals
• Methods
• Learning and teaching materials and equipment
• Evaluation
All CLCs conducted tutor training in cooperation with external resource persons. Some of the activities were: planning a programme, providing resource materials, applying classroom management, solving problems, writing a report and implementing performance-based evaluation.
CLCs also provided insights about, and were optimistic in relation to, the utilization of group work as a vehicle for learning and social change. According to respondents, an independent business group as a learning group could be successful when formed through a community participation, collaboration and democracy.
Capacity to assist their employees All responding institutions stated that SEL is an effort to strengthen literacy skills through training that increases individuals’ revenue and productivity by enhancing their capabilities and actualizing their potential. The SEL is expected to empower learners through increasing their knowledge and skills and changing their attitudes and perceptions. Three behavioural aspects highlighted were business innovation, business management and business strategies. All implementing institutions stated that each participant has a variety of resources and strengths, such as knowledge, attitudes and expertise, which, if utilized optimally, will result in positive impacts in their lives. Important skills are provided through the training, and hence, training should be carefully prepared as it greatly affects the success of the learners.
The respondents felt that the principle of participation requires that learners cooperate well with the tutors because there would be no learning without participation in decision-making. With this principle, the weak link in the group would feel involved and elevated.
Overall, formation of study groups as the independent components of learning activities was viewed a means to facilitate self-help problem-solving and self-help education. In the problem-solving process, the role of the tutors is that of a facilitator, and the learners themselves have to be actively involved to solve the problems.
Indo
nesi
a: L
itera
cy fo
r Life
Ski
lls a
nd E
ntre
pren
eurs
hip
59
All implementing institutions cooperate with entrepreneur training providers to:
• Start forming small groups of learners.
• Train the agents to be facilitators.
• Train the facilitators as participative leaders.
• Gradually shift responsibility from the agents to the learners.
4 3 5 Question 5 Government support to LLSE
Government policy on LLSEIn implementing Presidential Decree 5/2006 on “The National Movement of Compulsory Nine-Year Basic Education and the Fight against Illiteracy”, several strategies that have been carried out in the field of illiteracy eradication, as follows:
• An emphasis was placed on illiteracy eradication in provinces and regions with large illiterate populations.
• Accountability was improved in the illiteracy eradication programme.
• Partnership and networking were developed.
• Cooperation was established with universities and colleges.
• Standards were set along with quality assurance of literacy programmes.
Government support to LLSE implementationThe Indonesian government, through the Directorate of Community Education Development, provides technical guidance on SEL, LSE and PEI (under the umbrella of LLSE) that can be utilized by any implementing education institution.
The government provides guidance through the formation of business and entrepreneurship groups. The process is carried out through backstopping and partnership. The guidance is focused on improving the learners’ capacity in initiating and developing businesses.
The government provides guidance on:
• Business management
• Promotion and marketing
• Business competition
• Laws
• Business networking
• Capital
The study found that the guidance given by the government is one of the key factors that can influence the implementing institutions’ willingness to start and develop small-scale productive enterprises, especially for women. The study also found that a lack of guidance from the government caused low participation from the community in implementing functional and entrepreneurship literacy programmes. For the community (i.e. learners), guidance is far more important than the life skills programmes themselves. The study found that simultaneous and systematic guidance could improve the learners’ confidence in undertaking entrepreneurial activities. The guidance was also found to stimulate business development.
Indo
nesi
a: L
itera
cy fo
r Life
Ski
lls a
nd E
ntre
pren
eurs
hip
60
Several principles that need to be taken into account in providing guidance and in building partnerships with the community are as follows.
• Mutually beneficial
• Equal
• Collaborative
• Empowering
According to the respondents, partnerships should be developed both vertically and horizontally. Vertically, requires initiatives from the government and state organizations or agencies. Horizontal partnerships should be realized through cooperation with the private sector and individuals. Partnership was viewed as a strategy to counter fear of failure. This partnership pattern could stimulate a condition that enables everybody to grow and develop as a partner for others.
Government facilitation The government offers a variety of facilitation programmes for the institutions implementing the LLSE programme. The government also develops various models and manuals for CLCs by building cooperation with universities. In addition, the government provides facilities through competitive funding for institutions that have their own showrooms to showcase their products.
Several programmes are also provided to support learners. One of the programmes that is implemented nationally is International Literacy Day. In commemorating the event, literacy learners are given opportunities to deliver their testimonies on how literacy learning has changed their lives.
CLCs that are successful in implementing SEL are given the opportunity to join an international exhibition. For example, the Government of Indonesia will send representatives of some CLCs to an exhibition in Japan related to the International Conference on Education for Sustainable Development (Kominkan 2014). In addition, annually, CLCs are encouraged to join a competition as part of International Literacy Day. Every year, six CLCs are selected as the most creative CLCs in Indonesia.
The LLSE programme’s success has resulted in the commitment for literacy improvement no longer being a national movement but instead becoming a community movement that seeks to eliminate illiteracy and to build a peaceful, fair and prosperous Indonesia.
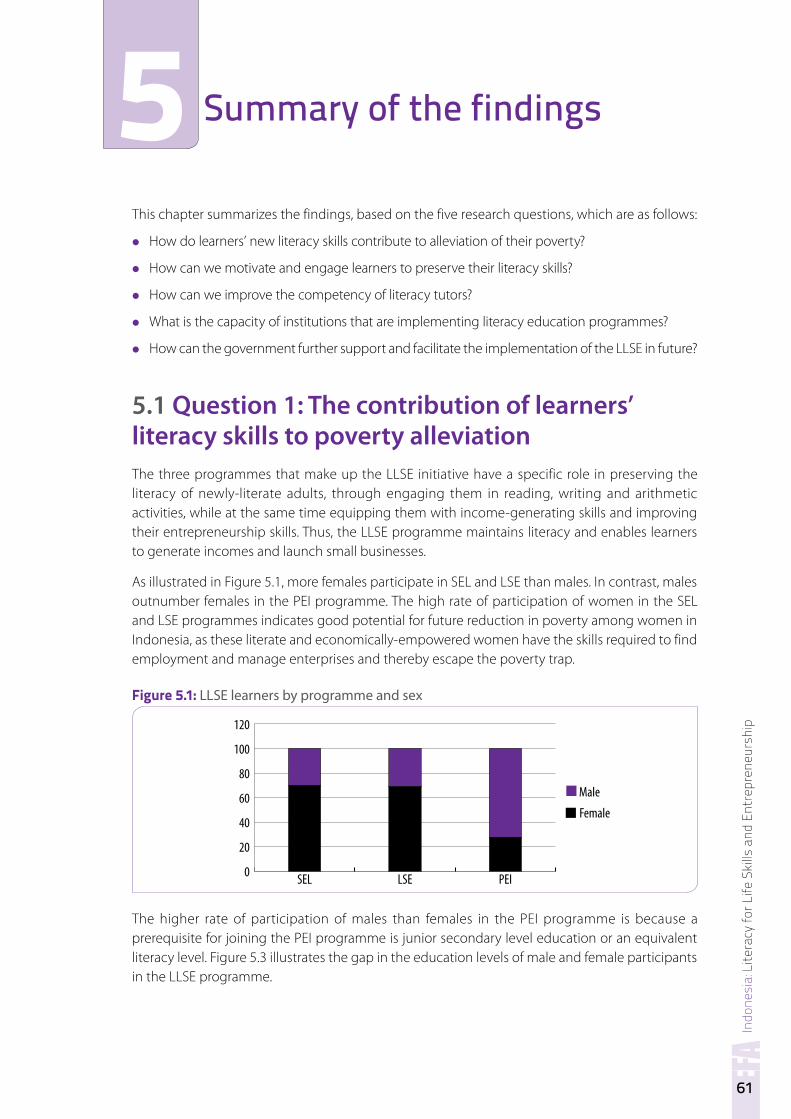
Indo
nesi
a: L
itera
cy fo
r Life
Ski
lls a
nd E
ntre
pren
eurs
hip
61
Summary of the findings
This chapter summarizes the findings, based on the five research questions, which are as follows:
• How do learners’ new literacy skills contribute to alleviation of their poverty?
• How can we motivate and engage learners to preserve their literacy skills?
• How can we improve the competency of literacy tutors?
• What is the capacity of institutions that are implementing literacy education programmes?
• How can the government further support and facilitate the implementation of the LLSE in future?
5.1 Question 1: The contribution of learners’ literacy skills to poverty alleviationThe three programmes that make up the LLSE initiative have a specific role in preserving the literacy of newly-literate adults, through engaging them in reading, writing and arithmetic activities, while at the same time equipping them with income-generating skills and improving their entrepreneurship skills. Thus, the LLSE programme maintains literacy and enables learners to generate incomes and launch small businesses.
As illustrated in Figure 5.1, more females participate in SEL and LSE than males. In contrast, males outnumber females in the PEI programme. The high rate of participation of women in the SEL and LSE programmes indicates good potential for future reduction in poverty among women in Indonesia, as these literate and economically-empowered women have the skills required to find employment and manage enterprises and thereby escape the poverty trap.
Figure 5.1: LLSE learners by programme and sex
Male
Female
0
20
40
60
80
100
120
PEILSESEL
The higher rate of participation of males than females in the PEI programme is because a prerequisite for joining the PEI programme is junior secondary level education or an equivalent literacy level. Figure 5.3 illustrates the gap in the education levels of male and female participants in the LLSE programme.
5
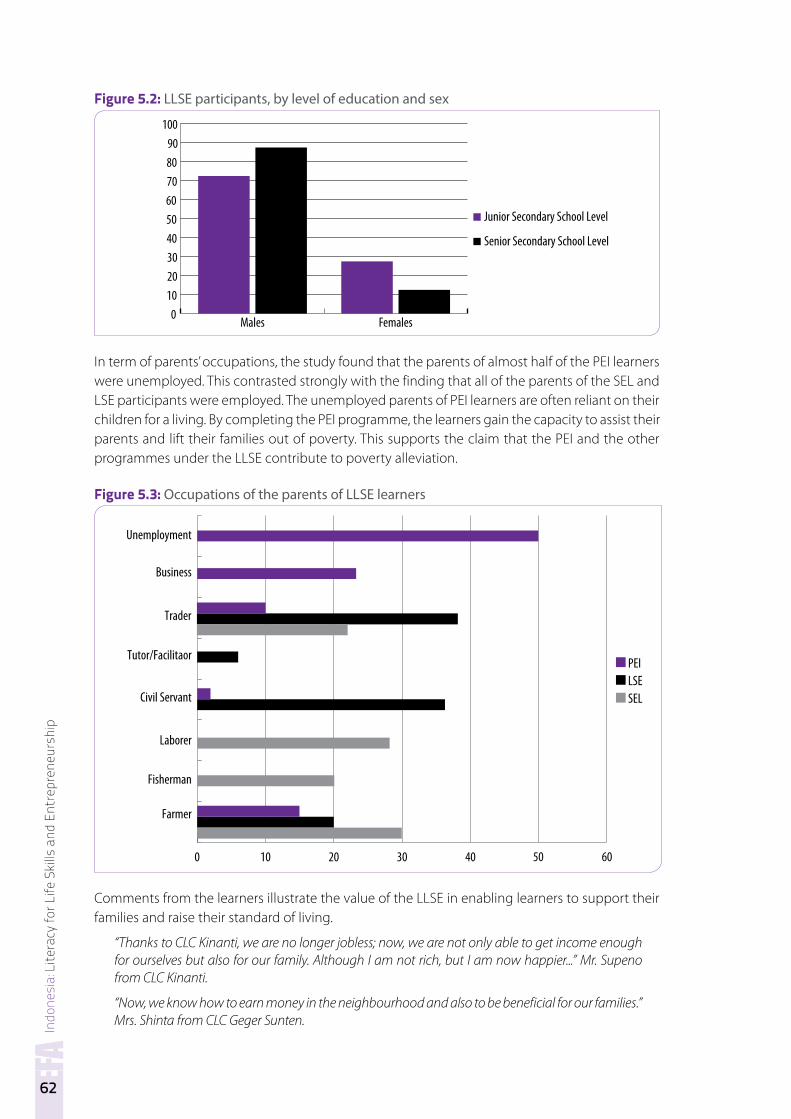
Indo
nesi
a: L
itera
cy fo
r Life
Ski
lls a
nd E
ntre
pren
eurs
hip
62
Figure 5.2: LLSE participants, by level of education and sex
0102030405060708090
100
FemalesMales
Junior Secondary School Level
Senior Secondary School Level
In term of parents’ occupations, the study found that the parents of almost half of the PEI learners were unemployed. This contrasted strongly with the finding that all of the parents of the SEL and LSE participants were employed. The unemployed parents of PEI learners are often reliant on their children for a living. By completing the PEI programme, the learners gain the capacity to assist their parents and lift their families out of poverty. This supports the claim that the PEI and the other programmes under the LLSE contribute to poverty alleviation.
Figure 5.3: Occupations of the parents of LLSE learners
Unemployment
Business
Trader
Tutor/Facilitaor
Civil Servant
Laborer
Fisherman
Farmer
0 10 20 30 40 50 60
PEILSESEL
Comments from the learners illustrate the value of the LLSE in enabling learners to support their families and raise their standard of living.
“Thanks to CLC Kinanti, we are no longer jobless; now, we are not only able to get income enough for ourselves but also for our family. Although I am not rich, but I am now happier...” Mr. Supeno from CLC Kinanti.
“Now, we know how to earn money in the neighbourhood and also to be beneficial for our families.” Mrs. Shinta from CLC Geger Sunten.
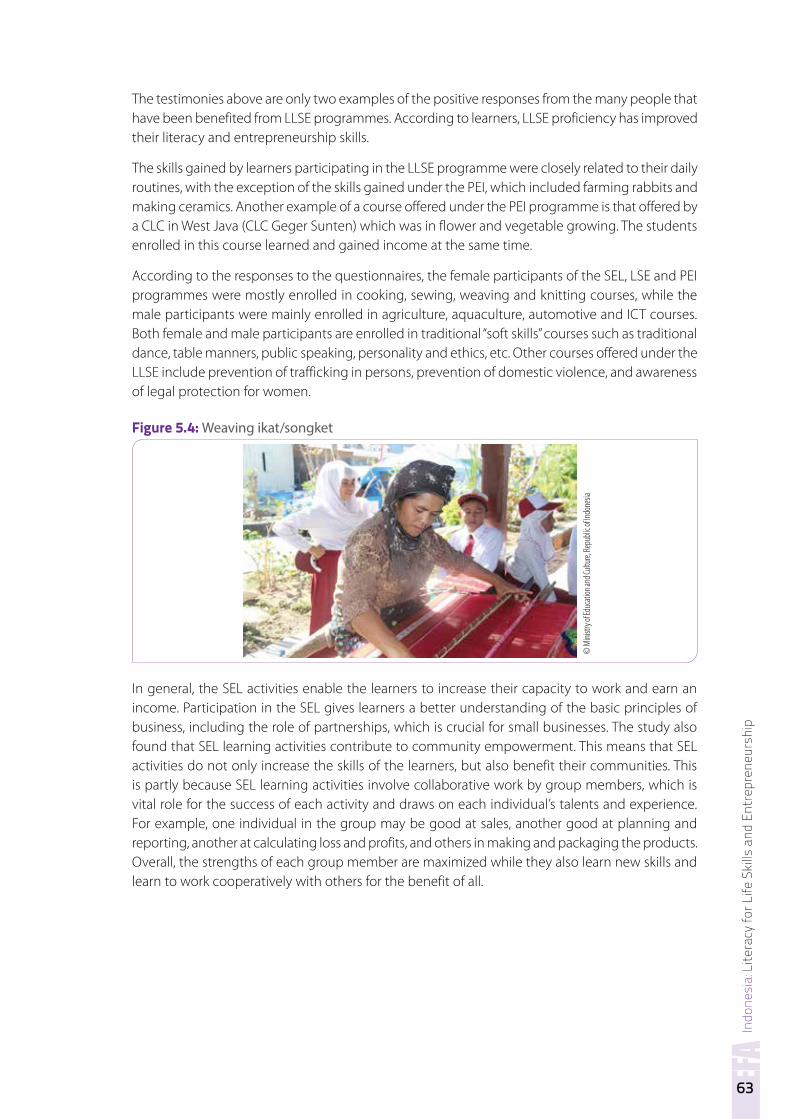
Indo
nesi
a: L
itera
cy fo
r Life
Ski
lls a
nd E
ntre
pren
eurs
hip
63
The testimonies above are only two examples of the positive responses from the many people that have been benefited from LLSE programmes. According to learners, LLSE proficiency has improved their literacy and entrepreneurship skills.
The skills gained by learners participating in the LLSE programme were closely related to their daily routines, with the exception of the skills gained under the PEI, which included farming rabbits and making ceramics. Another example of a course offered under the PEI programme is that offered by a CLC in West Java (CLC Geger Sunten) which was in flower and vegetable growing. The students enrolled in this course learned and gained income at the same time.
According to the responses to the questionnaires, the female participants of the SEL, LSE and PEI programmes were mostly enrolled in cooking, sewing, weaving and knitting courses, while the male participants were mainly enrolled in agriculture, aquaculture, automotive and ICT courses. Both female and male participants are enrolled in traditional “soft skills” courses such as traditional dance, table manners, public speaking, personality and ethics, etc. Other courses offered under the LLSE include prevention of trafficking in persons, prevention of domestic violence, and awareness of legal protection for women.
Figure 5.4: Weaving ikat/songket
In general, the SEL activities enable the learners to increase their capacity to work and earn an income. Participation in the SEL gives learners a better understanding of the basic principles of business, including the role of partnerships, which is crucial for small businesses. The study also found that SEL learning activities contribute to community empowerment. This means that SEL activities do not only increase the skills of the learners, but also benefit their communities. This is partly because SEL learning activities involve collaborative work by group members, which is vital role for the success of each activity and draws on each individual’s talents and experience. For example, one individual in the group may be good at sales, another good at planning and reporting, another at calculating loss and profits, and others in making and packaging the products. Overall, the strengths of each group member are maximized while they also learn new skills and learn to work cooperatively with others for the benefit of all.
© M
inistr
y of E
duca
tion a
nd Cu
lture,
Repu
blic o
f Indo
nesia
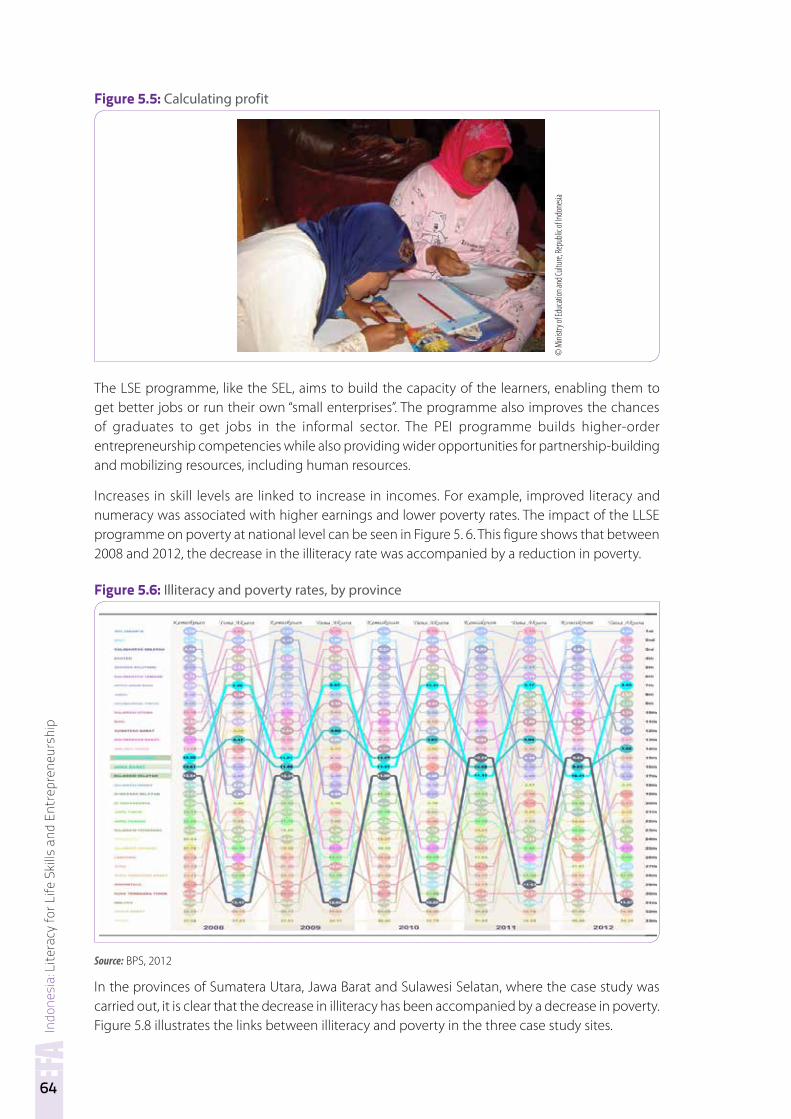
Indo
nesi
a: L
itera
cy fo
r Life
Ski
lls a
nd E
ntre
pren
eurs
hip
64
Figure 5.5: Calculating profit
The LSE programme, like the SEL, aims to build the capacity of the learners, enabling them to get better jobs or run their own “small enterprises”. The programme also improves the chances of graduates to get jobs in the informal sector. The PEI programme builds higher-order entrepreneurship competencies while also providing wider opportunities for partnership-building and mobilizing resources, including human resources.
Increases in skill levels are linked to increase in incomes. For example, improved literacy and numeracy was associated with higher earnings and lower poverty rates. The impact of the LLSE programme on poverty at national level can be seen in Figure 5. 6. This figure shows that between 2008 and 2012, the decrease in the illiteracy rate was accompanied by a reduction in poverty.
Figure 5.6: Illiteracy and poverty rates, by province
Source: BPS, 2012
In the provinces of Sumatera Utara, Jawa Barat and Sulawesi Selatan, where the case study was carried out, it is clear that the decrease in illiteracy has been accompanied by a decrease in poverty. Figure 5.8 illustrates the links between illiteracy and poverty in the three case study sites.
© M
inistr
y of E
duca
tion a
nd Cu
lture,
Repu
blic o
f Indo
nesia
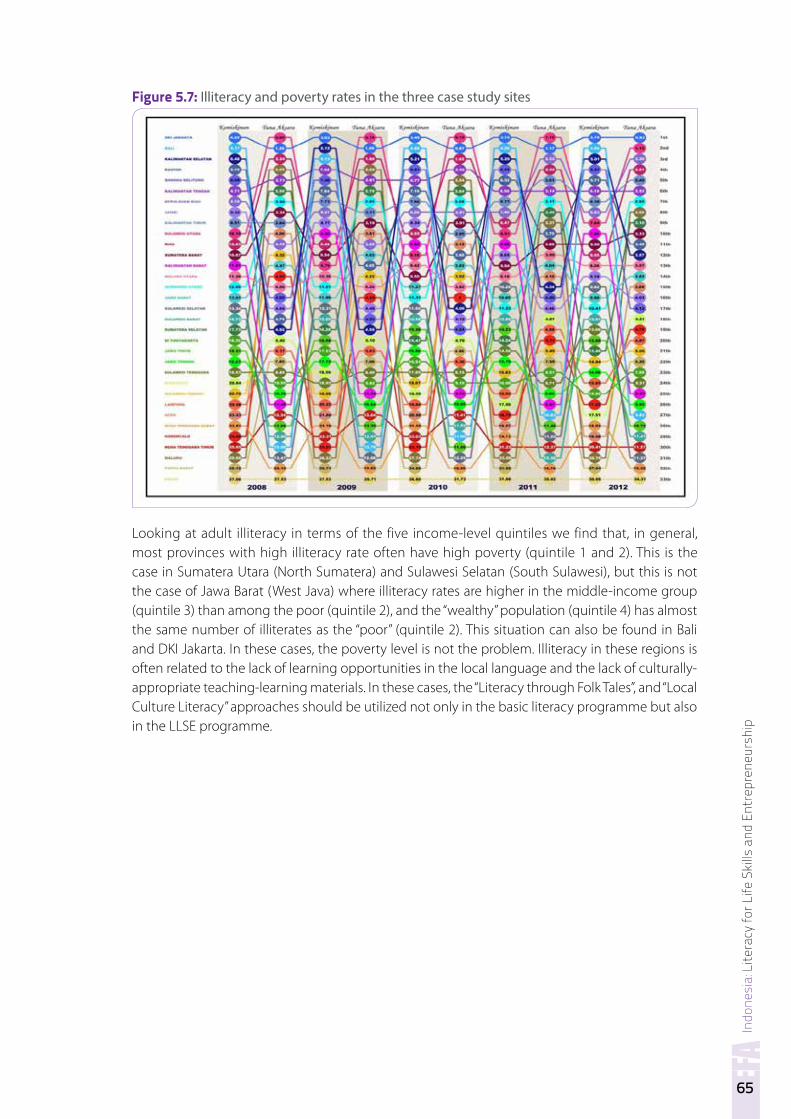
Indo
nesi
a: L
itera
cy fo
r Life
Ski
lls a
nd E
ntre
pren
eurs
hip
65
Figure 5.7: Illiteracy and poverty rates in the three case study sites
Looking at adult illiteracy in terms of the five income-level quintiles we find that, in general, most provinces with high illiteracy rate often have high poverty (quintile 1 and 2). This is the case in Sumatera Utara (North Sumatera) and Sulawesi Selatan (South Sulawesi), but this is not the case of Jawa Barat (West Java) where illiteracy rates are higher in the middle-income group (quintile 3) than among the poor (quintile 2), and the “wealthy” population (quintile 4) has almost the same number of illiterates as the “poor” (quintile 2). This situation can also be found in Bali and DKI Jakarta. In these cases, the poverty level is not the problem. Illiteracy in these regions is often related to the lack of learning opportunities in the local language and the lack of culturally-appropriate teaching-learning materials. In these cases, the “Literacy through Folk Tales”, and “Local Culture Literacy” approaches should be utilized not only in the basic literacy programme but also in the LLSE programme.
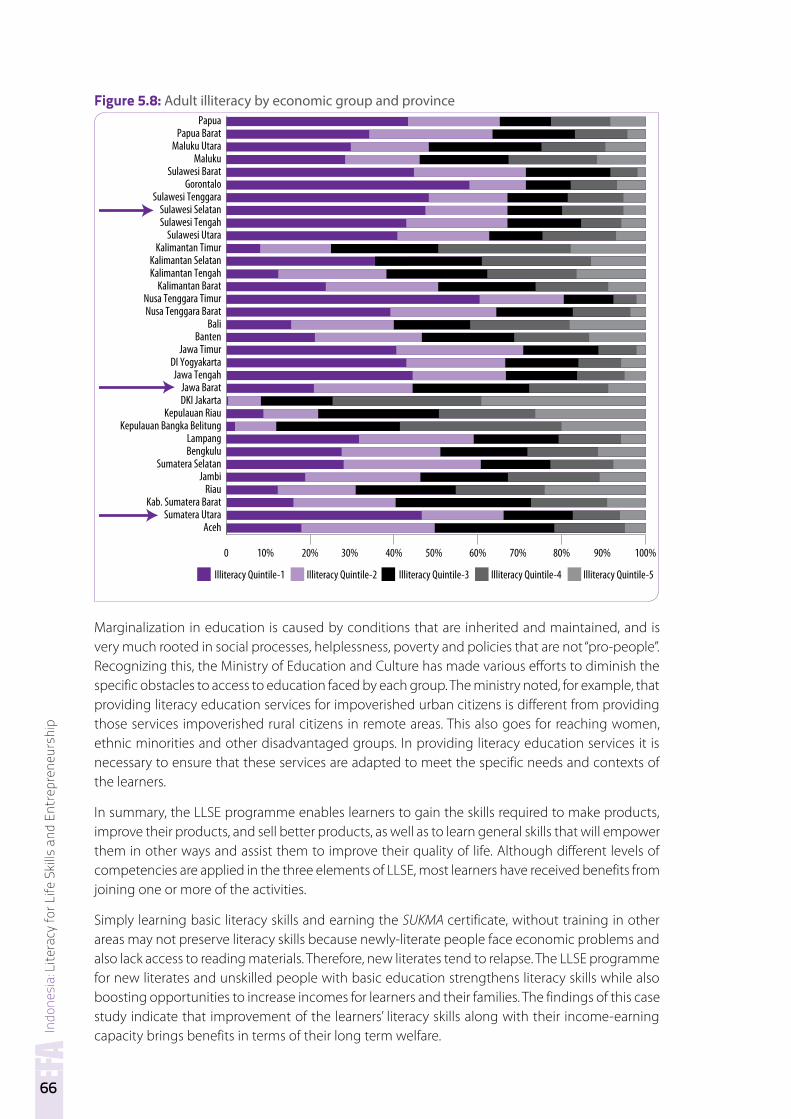
Indo
nesi
a: L
itera
cy fo
r Life
Ski
lls a
nd E
ntre
pren
eurs
hip
66
Figure 5.8: Adult illiteracy by economic group and provincePapua
Papua BaratMaluku Utara
MalukuSulawesi Barat
Sulawesi TenggaraGorontalo
Sulawesi TengahSulawesi Utara
Kalimantan TimurKalimantan Selatan
Sulawesi Selatan
Kalimantan TengahKalimantan Barat
Nusa Tenggara Barat
Jawa Timur
Jawa Barat
Lampang
Kepulauan Riau
Nusa Tenggara Timur
Bali
DI Yogyakarta
DKI Jakarta
Bengkulu
RiauJambi
Banten
Jawa Tengah
Kepulauan Bangka Belitung
Sumatera Selatan
Kab. Sumatera Barat
AcehSumatera Utara
0 20% 40% 60% 80% 100%10% 30% 50% 70% 90%
Illiteracy Quintile-1 Illiteracy Quintile-2 Illiteracy Quintile-3 Illiteracy Quintile-4 Illiteracy Quintile-5
Marginalization in education is caused by conditions that are inherited and maintained, and is very much rooted in social processes, helplessness, poverty and policies that are not “pro-people”. Recognizing this, the Ministry of Education and Culture has made various efforts to diminish the specific obstacles to access to education faced by each group. The ministry noted, for example, that providing literacy education services for impoverished urban citizens is different from providing those services impoverished rural citizens in remote areas. This also goes for reaching women, ethnic minorities and other disadvantaged groups. In providing literacy education services it is necessary to ensure that these services are adapted to meet the specific needs and contexts of the learners.
In summary, the LLSE programme enables learners to gain the skills required to make products, improve their products, and sell better products, as well as to learn general skills that will empower them in other ways and assist them to improve their quality of life. Although different levels of competencies are applied in the three elements of LLSE, most learners have received benefits from joining one or more of the activities.
Simply learning basic literacy skills and earning the SUKMA certificate, without training in other areas may not preserve literacy skills because newly-literate people face economic problems and also lack access to reading materials. Therefore, new literates tend to relapse. The LLSE programme for new literates and unskilled people with basic education strengthens literacy skills while also boosting opportunities to increase incomes for learners and their families. The findings of this case study indicate that improvement of the learners’ literacy skills along with their income-earning capacity brings benefits in terms of their long term welfare.
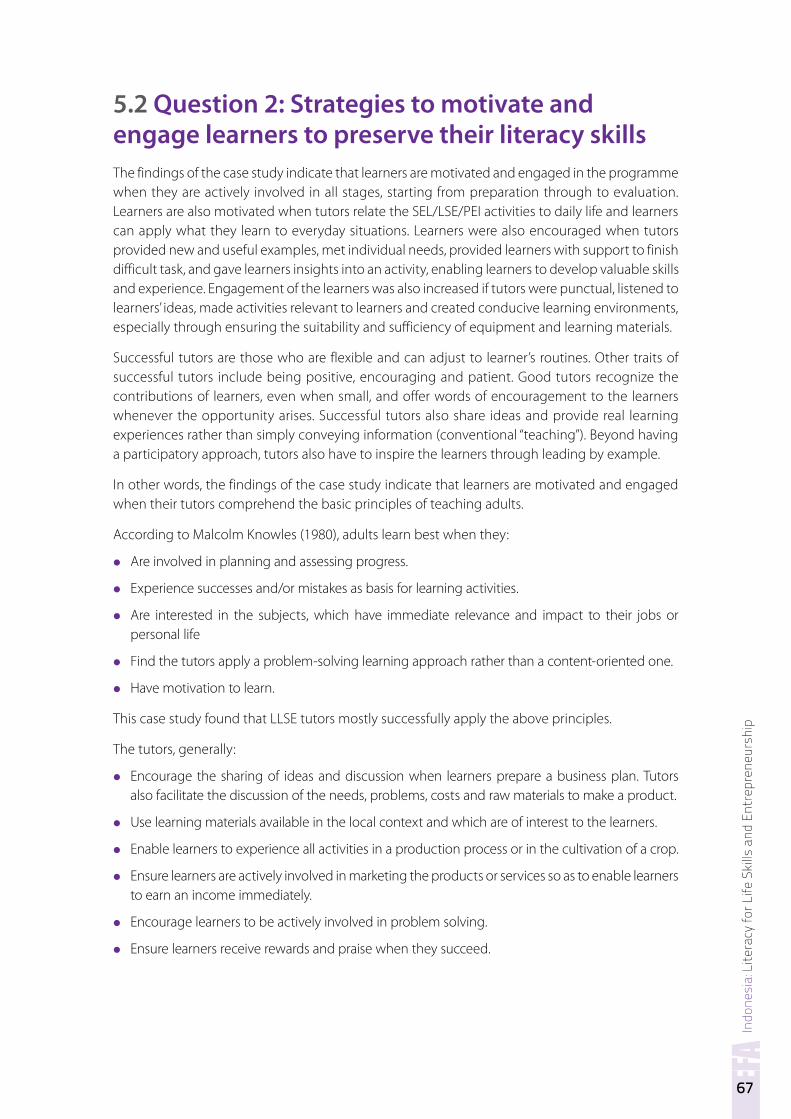
Indo
nesi
a: L
itera
cy fo
r Life
Ski
lls a
nd E
ntre
pren
eurs
hip
67
5.2 Question 2: Strategies to motivate and engage learners to preserve their literacy skillsThe findings of the case study indicate that learners are motivated and engaged in the programme when they are actively involved in all stages, starting from preparation through to evaluation. Learners are also motivated when tutors relate the SEL/LSE/PEI activities to daily life and learners can apply what they learn to everyday situations. Learners were also encouraged when tutors provided new and useful examples, met individual needs, provided learners with support to finish difficult task, and gave learners insights into an activity, enabling learners to develop valuable skills and experience. Engagement of the learners was also increased if tutors were punctual, listened to learners’ ideas, made activities relevant to learners and created conducive learning environments, especially through ensuring the suitability and sufficiency of equipment and learning materials.
Successful tutors are those who are flexible and can adjust to learner’s routines. Other traits of successful tutors include being positive, encouraging and patient. Good tutors recognize the contributions of learners, even when small, and offer words of encouragement to the learners whenever the opportunity arises. Successful tutors also share ideas and provide real learning experiences rather than simply conveying information (conventional “teaching”). Beyond having a participatory approach, tutors also have to inspire the learners through leading by example.
In other words, the findings of the case study indicate that learners are motivated and engaged when their tutors comprehend the basic principles of teaching adults.
According to Malcolm Knowles (1980), adults learn best when they:
• Are involved in planning and assessing progress.
• Experience successes and/or mistakes as basis for learning activities.
• Are interested in the subjects, which have immediate relevance and impact to their jobs or personal life
• Find the tutors apply a problem-solving learning approach rather than a content-oriented one.
• Have motivation to learn.
This case study found that LLSE tutors mostly successfully apply the above principles.
The tutors, generally:
• Encourage the sharing of ideas and discussion when learners prepare a business plan. Tutors also facilitate the discussion of the needs, problems, costs and raw materials to make a product.
• Use learning materials available in the local context and which are of interest to the learners.
• Enable learners to experience all activities in a production process or in the cultivation of a crop.
• Ensure learners are actively involved in marketing the products or services so as to enable learners to earn an income immediately.
• Encourage learners to be actively involved in problem solving.
• Ensure learners receive rewards and praise when they succeed.
Indo
nesi
a: L
itera
cy fo
r Life
Ski
lls a
nd E
ntre
pren
eurs
hip
68
In short, in order to ensure adult learners are successful, tutors enable adult learners to experience many types of learning activities, including such things as small group discussions, experiments, role play, building, writing, drawing, farming and planting.
The photographs in Figure 5.9 show learners engaged in LLSE activities. These photographs show examples of high motivation and engagement of learners and indicate that the learners’ expectations are being met.
Figure 5.9: LLSE activities and products
Figure 5.10: A confident learner
Mushroom farming
Rabbit farming
LSE activities
Receiving Certificate 1
Entrepreneurship literacy development
SEL Activity 1
© M
inistr
y of E
duca
tion a
nd Cu
lture,
Repu
blic o
f Indo
nesia
© M
inistr
y of E
duca
tion a
nd Cu
lture,
Repu
blic o
f Indo
nesia
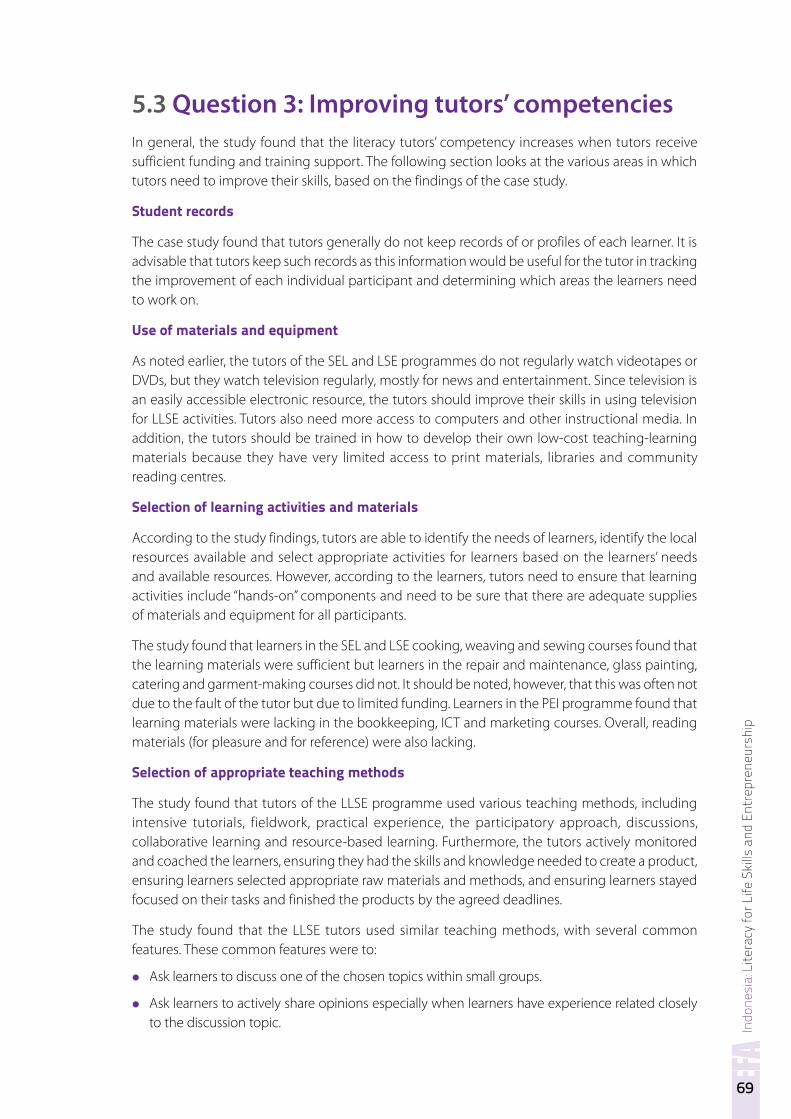
Indo
nesi
a: L
itera
cy fo
r Life
Ski
lls a
nd E
ntre
pren
eurs
hip
69
5.3 Question 3: Improving tutors’ competenciesIn general, the study found that the literacy tutors’ competency increases when tutors receive sufficient funding and training support. The following section looks at the various areas in which tutors need to improve their skills, based on the findings of the case study.
Student records
The case study found that tutors generally do not keep records of or profiles of each learner. It is advisable that tutors keep such records as this information would be useful for the tutor in tracking the improvement of each individual participant and determining which areas the learners need to work on.
Use of materials and equipment
As noted earlier, the tutors of the SEL and LSE programmes do not regularly watch videotapes or DVDs, but they watch television regularly, mostly for news and entertainment. Since television is an easily accessible electronic resource, the tutors should improve their skills in using television for LLSE activities. Tutors also need more access to computers and other instructional media. In addition, the tutors should be trained in how to develop their own low-cost teaching-learning materials because they have very limited access to print materials, libraries and community reading centres.
Selection of learning activities and materials
According to the study findings, tutors are able to identify the needs of learners, identify the local resources available and select appropriate activities for learners based on the learners’ needs and available resources. However, according to the learners, tutors need to ensure that learning activities include “hands-on” components and need to be sure that there are adequate supplies of materials and equipment for all participants.
The study found that learners in the SEL and LSE cooking, weaving and sewing courses found that the learning materials were sufficient but learners in the repair and maintenance, glass painting, catering and garment-making courses did not. It should be noted, however, that this was often not due to the fault of the tutor but due to limited funding. Learners in the PEI programme found that learning materials were lacking in the bookkeeping, ICT and marketing courses. Overall, reading materials (for pleasure and for reference) were also lacking.
Selection of appropriate teaching methods
The study found that tutors of the LLSE programme used various teaching methods, including intensive tutorials, fieldwork, practical experience, the participatory approach, discussions, collaborative learning and resource-based learning. Furthermore, the tutors actively monitored and coached the learners, ensuring they had the skills and knowledge needed to create a product, ensuring learners selected appropriate raw materials and methods, and ensuring learners stayed focused on their tasks and finished the products by the agreed deadlines.
The study found that the LLSE tutors used similar teaching methods, with several common features. These common features were to:
• Ask learners to discuss one of the chosen topics within small groups.
• Ask learners to actively share opinions especially when learners have experience related closely to the discussion topic.
Indo
nesi
a: L
itera
cy fo
r Life
Ski
lls a
nd E
ntre
pren
eurs
hip
70
• Ask learners to write the main ideas of the discussion on the white board.
• Ask learners to read the written main ideas as a group or as an individual (read aloud).
• Ask learners to discuss themes together with the group.
• Ask learners to criticize or comment on the themes.
• Ask learners to make notes.
• Ask learners to read their notes.
• Ask learners on their opinions on the learning materials used in the class.
• Ask learners to express opinions, experiences or problems related to the learning materials.
These features are not required but are commonly used by tutors so as to ensure the learners fully participate in the learning process and to get adequate feedback from learners about the learning materials and methods used.
Figure 5.11: Tutor and needlework students
Tutors’ knowledge of the programme content
The main focus of LLSE programme is to assist learners to improve both their literacy and entrepreneurship skills. The LLSE programme intends to ensure graduates are skilful in running a business not only in terms of the day to day activities, but also in terms of making appropriate management decisions The findings of the study indicate that the tutors need to improve their knowledge of business management and development. The findings also indicate that tutors’ market research skills and needs analysis skills are limited. To build their skills in these areas tutors are encouraged to establish networks and partnerships with tutors at other CLCs, training facilities and universities to share their knowledge and experience, and tutors should also seek to learn from successful business people.
5.4 Question 4: The capacity of institutions The study found that the achievement of the literacy targets in Indonesia depends on non-formal education institutions. Various NFE institutions provide literacy programmes, including NGOs, religious organizations and women organizations, but most LLSE courses are provided by CLCs.
© M
inistr
y of E
duca
tion a
nd Cu
lture,
Repu
blic o
f Indo
nesia
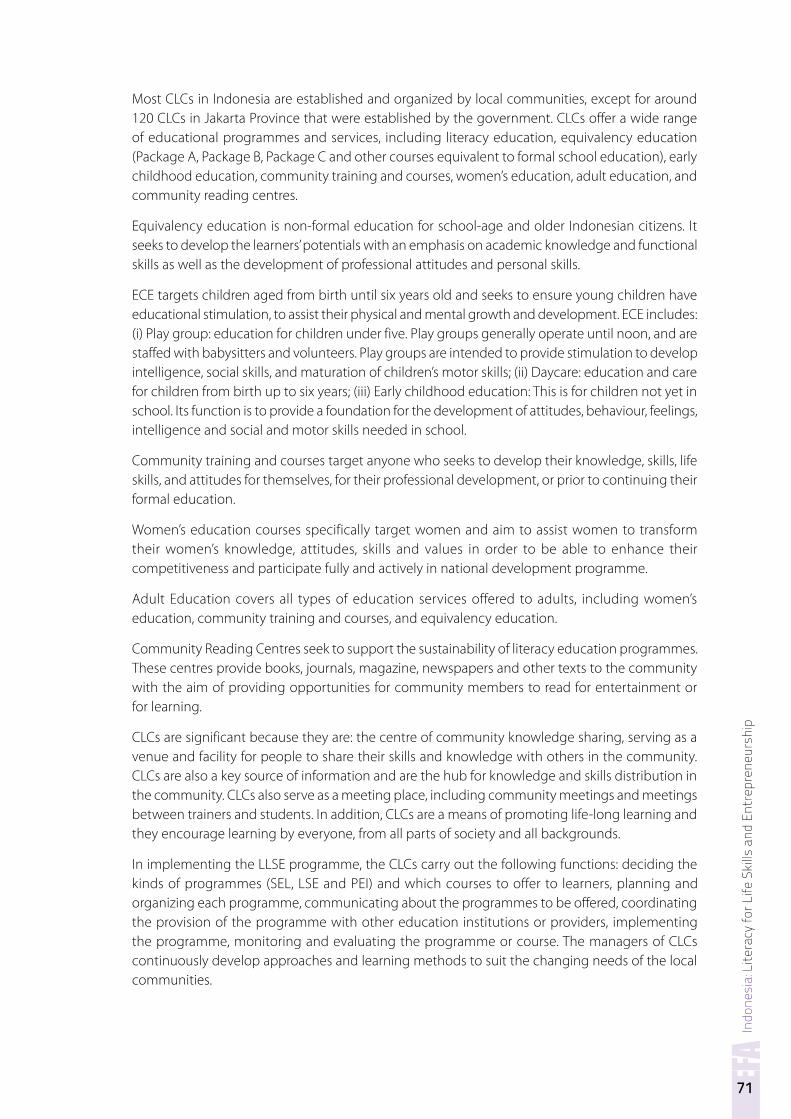
Indo
nesi
a: L
itera
cy fo
r Life
Ski
lls a
nd E
ntre
pren
eurs
hip
71
Most CLCs in Indonesia are established and organized by local communities, except for around 120 CLCs in Jakarta Province that were established by the government. CLCs offer a wide range of educational programmes and services, including literacy education, equivalency education (Package A, Package B, Package C and other courses equivalent to formal school education), early childhood education, community training and courses, women’s education, adult education, and community reading centres.
Equivalency education is non-formal education for school-age and older Indonesian citizens. It seeks to develop the learners’ potentials with an emphasis on academic knowledge and functional skills as well as the development of professional attitudes and personal skills.
ECE targets children aged from birth until six years old and seeks to ensure young children have educational stimulation, to assist their physical and mental growth and development. ECE includes: (i) Play group: education for children under five. Play groups generally operate until noon, and are staffed with babysitters and volunteers. Play groups are intended to provide stimulation to develop intelligence, social skills, and maturation of children’s motor skills; (ii) Daycare: education and care for children from birth up to six years; (iii) Early childhood education: This is for children not yet in school. Its function is to provide a foundation for the development of attitudes, behaviour, feelings, intelligence and social and motor skills needed in school.
Community training and courses target anyone who seeks to develop their knowledge, skills, life skills, and attitudes for themselves, for their professional development, or prior to continuing their formal education.
Women’s education courses specifically target women and aim to assist women to transform their women’s knowledge, attitudes, skills and values in order to be able to enhance their competitiveness and participate fully and actively in national development programme.
Adult Education covers all types of education services offered to adults, including women’s education, community training and courses, and equivalency education.
Community Reading Centres seek to support the sustainability of literacy education programmes. These centres provide books, journals, magazine, newspapers and other texts to the community with the aim of providing opportunities for community members to read for entertainment or for learning.
CLCs are significant because they are: the centre of community knowledge sharing, serving as a venue and facility for people to share their skills and knowledge with others in the community. CLCs are also a key source of information and are the hub for knowledge and skills distribution in the community. CLCs also serve as a meeting place, including community meetings and meetings between trainers and students. In addition, CLCs are a means of promoting life-long learning and they encourage learning by everyone, from all parts of society and all backgrounds.
In implementing the LLSE programme, the CLCs carry out the following functions: deciding the kinds of programmes (SEL, LSE and PEI) and which courses to offer to learners, planning and organizing each programme, communicating about the programmes to be offered, coordinating the provision of the programme with other education institutions or providers, implementing the programme, monitoring and evaluating the programme or course. The managers of CLCs continuously develop approaches and learning methods to suit the changing needs of the local communities.
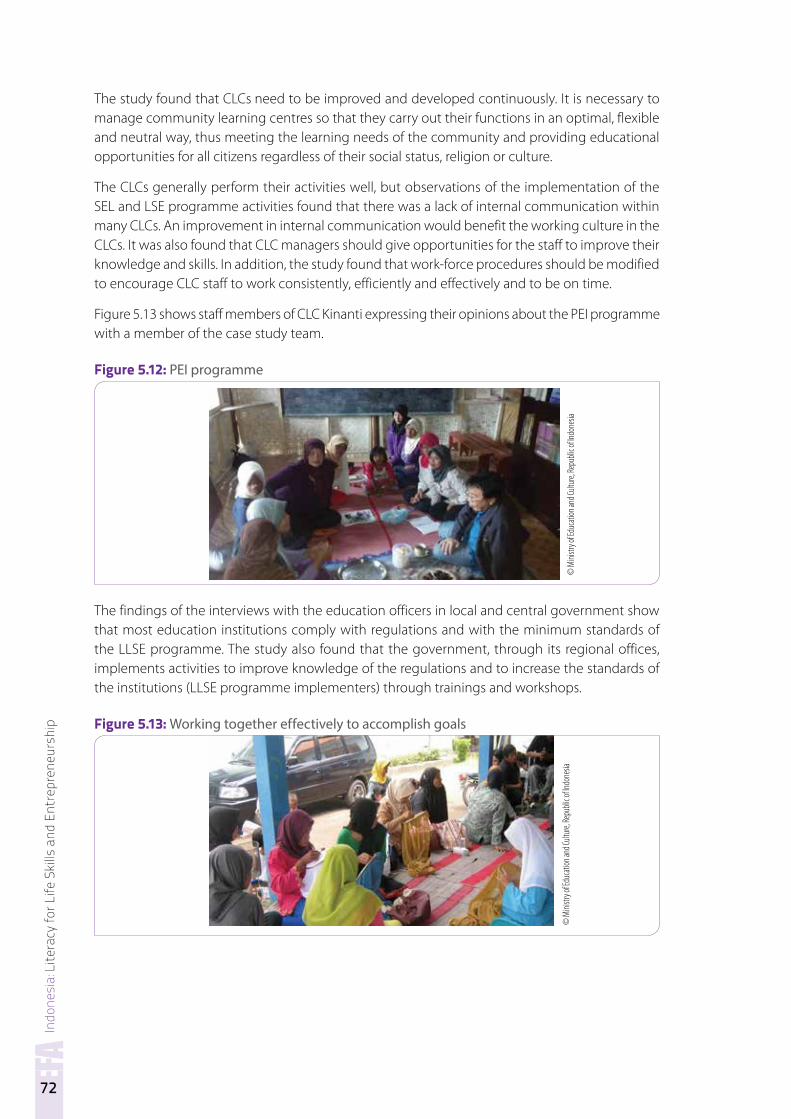
Indo
nesi
a: L
itera
cy fo
r Life
Ski
lls a
nd E
ntre
pren
eurs
hip
72
The study found that CLCs need to be improved and developed continuously. It is necessary to manage community learning centres so that they carry out their functions in an optimal, flexible and neutral way, thus meeting the learning needs of the community and providing educational opportunities for all citizens regardless of their social status, religion or culture.
The CLCs generally perform their activities well, but observations of the implementation of the SEL and LSE programme activities found that there was a lack of internal communication within many CLCs. An improvement in internal communication would benefit the working culture in the CLCs. It was also found that CLC managers should give opportunities for the staff to improve their knowledge and skills. In addition, the study found that work-force procedures should be modified to encourage CLC staff to work consistently, efficiently and effectively and to be on time.
Figure 5.13 shows staff members of CLC Kinanti expressing their opinions about the PEI programme with a member of the case study team.
Figure 5.12: PEI programme
The findings of the interviews with the education officers in local and central government show that most education institutions comply with regulations and with the minimum standards of the LLSE programme. The study also found that the government, through its regional offices, implements activities to improve knowledge of the regulations and to increase the standards of the institutions (LLSE programme implementers) through trainings and workshops.
Figure 5.13: Working together effectively to accomplish goals
© M
inistr
y of E
duca
tion a
nd Cu
lture,
Repu
blic o
f Indo
nesia
© M
inistr
y of E
duca
tion a
nd Cu
lture,
Repu
blic o
f Indo
nesia
Indo
nesi
a: L
itera
cy fo
r Life
Ski
lls a
nd E
ntre
pren
eurs
hip
73
5.5 Question 5: Government actionsThe findings with regard to the actions that can be taken by the government to support and facilitate the future implementation of the LLSE programme are summarized below.
Encouraging CLCs to develop networks and partnerships
To improve the delivery and management of the LLSE programme, CLCs should be encouraged to collaborate with other CLCs and with universities and other education institutions to share knowledge and skills.
Further develop standards for CLCs
While standards exist, these should be developed further to ensure they are clear and the LLSE programme can be assessed effectively.
Collect feedback from learners
Information should be gathered from learners at the end of each LLSE course about their views of the LLSE programme so as to identify ways to improve each course.
Equip all CLCs with Community Reading Centres
The government, in cooperation with the implementers and organizers of the LLSE programmes, should ensure all CLCs have Community Reading Centres, to support efforts to maintain literacy skills. The government should also expand the provision of reading materials to include reading materials related to various functional skills and to ensure reading materials are available for readers of all literacy levels.
Initiate supporting programmes to maintain LLSE ability
Programmes may be needed to support graduates of the LLSE programme to maintain their skills, especially among those graduates who have not found employment.
Strengthen inter-ministerial networks and partnerships
A priority is to develop mechanism and incentives that will establish and sustain networks and partnerships between government ministries so as to enhance inter-ministerial collaboration. This will require flexible block-grant financing mechanisms and innovative forms of technical support to build up network capacity.
• Accelerate the establishment of a Tutor Communication Forum
A Tutor Communication Forum for all tutors involved in the LLSE programme would enable better sharing of knowledge and information between tutors and would support them in their skills development.
• Build the capacity of the institutions
A particular challenge is the perceived of lack of value of LLSE among potential learners. To increase the value of LLSE and therefore increase demand for the programme, it is necessary to improve the delivery and management of the programme. This will require improving the planning and budgeting capacity of institutions delivering the LLSE programme and enhancing the role of the committee of NFE in terms of planning and implementing the programme.
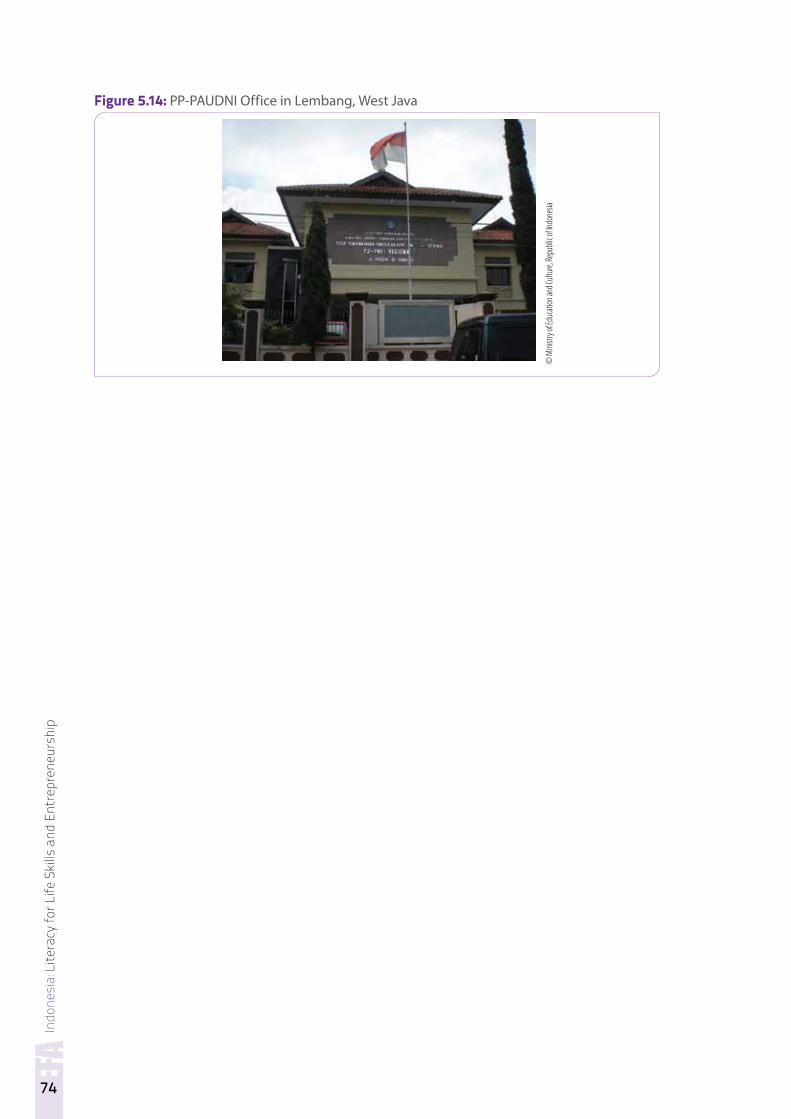
Indo
nesi
a: L
itera
cy fo
r Life
Ski
lls a
nd E
ntre
pren
eurs
hip
74
Figure 5.14: PP-PAUDNI Office in Lembang, West Java
© M
inistr
y of E
duca
tion a
nd Cu
lture,
Repu
blic o
f Indo
nesia
Indo
nesi
a: L
itera
cy fo
r Life
Ski
lls a
nd E
ntre
pren
eurs
hip
75
Conclusions and recommendations
6.1 ConclusionsThis study of the LLSE programme found that, overall, the programme has been successful in achieving its goals. In terms of the five research questions, the study found that:
• The LLSE programme is enabling new-literates to gain the skills needed to increase their incomes and thus lift themselves and their families out of poverty.
• Learners enrolled in the LLSE programme are motivated when tutors provide high quality teaching-learning experiences that are appropriate to their needs and expectations.
• Tutor competency can be improved through better support from the institutions they work with and from the government. Specifically, through providing tutors with more training and through the facilitation of networks for knowledge-sharing.
• The institutions implementing the LLSE programme (mainly CLCs) are providing it in line with set standards, but there is room for improvement in the quality of the services provided.
• The government can further support and facilitate the implementation of the programme through encouraging CLCs to develop networks and partnerships with other education institutions, developing standards for the CLCs, collecting feedback from learners, equipping CLCs with community reading centres, initiating programmes to maintain the abilities of LLSE graduates, strengthening inter-ministerial networks and partnerships, establishing a tutor forum and building the capacity of institutions implementing the LLSE programme.
6.2 RecommendationsFollowing from these conclusions, the recommendations are as follows:
Recommendations for CLCs
• Improve management capacity.
• Support tutors to improve their knowledge and skills, particularly in the area of business development.
• Develop networks and cooperation with other CLCs to facilitate knowledge sharing and capacity building of all CLCs.
Recommendations for government
• Facilitate the networking of CLCs with other education institutions and partnerships to increase knowledge-sharing and capacity building of CLCs.
• Develop standards for the CLCs.
6
Indo
nesi
a: L
itera
cy fo
r Life
Ski
lls a
nd E
ntre
pren
eurs
hip
76
• Collect feedback from learners.
• Equip CLCs with community reading centres.
• Establish a tutor forum and support the capacity building of tutors, to ensure they have the required level of knowledge in and skills in business development.
• Initiate programmes to maintain the abilities of LLSE graduates.
• Strengthen inter-ministerial coordination and cooperation.
References
Badan Perencanaan Pembangunan Nasional (National Development Planning Agency). 2010. Laporan Pencapaian Tujuan Pembangunan Milenium di Indonesia 2010 Jakarta, Bappenas
_____. 2010. Peta Jalan Percepatan Pencapaian Tujuan Pembangunan Milenium di Indonesia. Jakarta, Bappenas
Badan Pusat Statistik (National Bureau of Statistics). 2011. Illiteracy Statistics. Jakarta.
Kemdiknas. 2009. Improving Literacy for All. Jakarta, Kementerian Pendidikan Nasional.
Knowles, M. 1984. Andragogy in Action, San Fransisco, Jossey – Bass.
Ministry of Education and Culture. 2009. Education statistics, by gender. Jakarta, Center of Statistics, MoEC.
_____. 2010. A Country Paper: Status and Major Challenges of Literacy in Indonesia. Jakarta, MoEC
_____. 2013. Illiteracy statistics. Jakarta, Center of Statistics, MoEC.
Ministry of Public Welfare. 2003. Ministerial Decree. No: B.10/MENKOKESRA/I/2003
Ministry of National Education. 2010.
Pusat Satistik Pendidikan, Kemdiknas. 2010. Data Keniraksaraan Berdasarkan Provinsi dan Kabupaten/Kota. Jakarta, Kementerian Pendidikan Nasional.
P2PAUDNI. 2013a. Hasil Pengembangan Model Pendidikan Masyarakat. Bandung, P2PAUDNI.
_____. 2013b. Model Unggulan, Bidang Pengembangan: Program Pendidikan Masyarakat. Semarang, P2PAUDNI.
Sardjunani, N., Suryadi, A., Dulkenberg, E. 2007. Indonesia: Public Financing of Block Grants for Privately Delivered Services. In Young, E., Richardson, L, M. Early Child Development from Measurement to Action: A Priority for Growth and Equity. World Bank Publications.
UNESCO. 2000. Dakar Framework for Action, Paris, UNESCO.
_____. 2010. Education for All Global Monitoring Report 2010: Reaching the Marginalized. Paris, UNESCO.
_____. 2012. Education For All Global Monitoring Report. Paris, UNESCO.
Yulaelawati. 2010. Keaksaraan Prasyarat Bagi Semua Orang dalam Jurnal Akrab! Edisi 1 Keaksaraan untuk Semua. Jakarta: Kementerian Pendidikan Nasional.

INDONESIALiteracy for Life Skills and
EntrepreneurshipUNESCO Bangkok OfficeAsia and Pacific Regional Bureau for Education
Mom Luang Pin Malakul Centenary Building920 Sukhumvit Road, Prakanong, KlongtoeyBangkok 10110, ThailandEmail: [email protected]: www.unesco.org/bangkokTel: +66-2-3910577 Fax: +66-2-3910866 CASE STUDY
Indonesia: Literacy for Life Skills and EntrepreneurshipProm
ising EFA Practices in the Asia-Pacific Region