Embed Size (px)
Citation preview
ed-TH / sa- MA
Challenges for wily veterans to cement their grip
Bulk segment remains as palpable growth driver for domestic cement demand
Burgeoning capacity continues to create supply-demand imbalance
Pressure on ASP remains and will impact margins going forward
Maintain FULLY VALUED calls for both INTP and SMGR
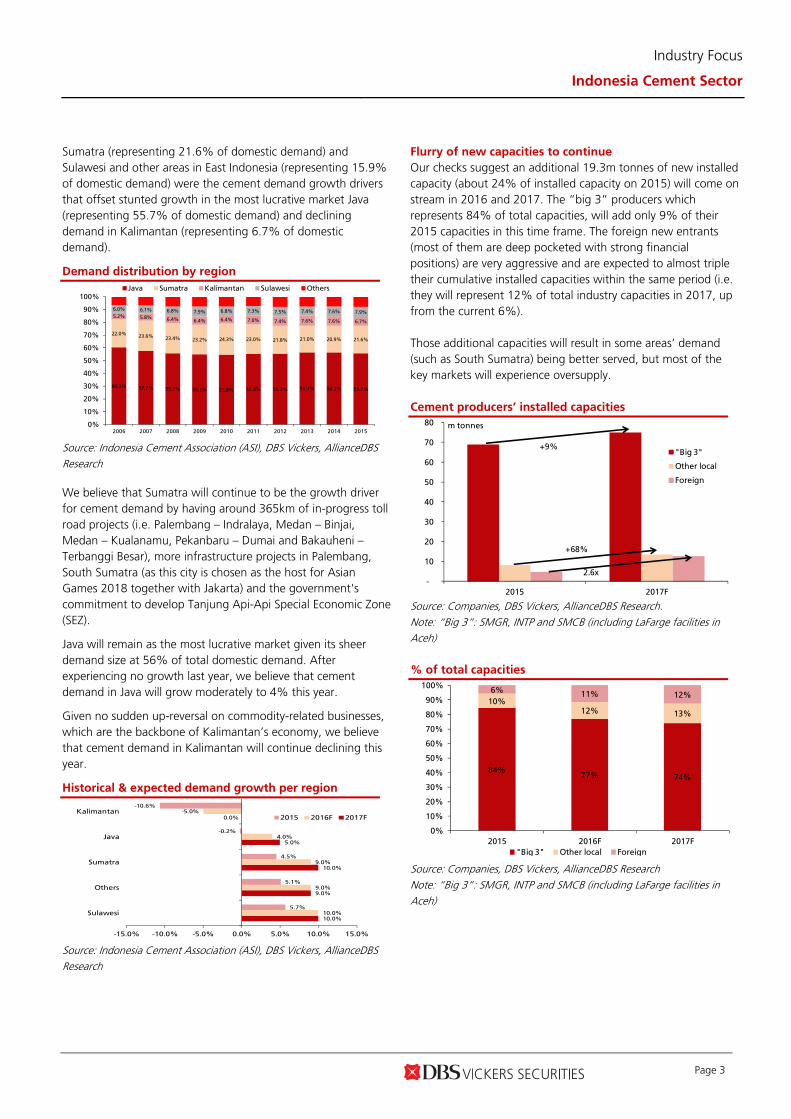
Moderate growth in demand, driven by bulk segment. Cement demand momentum started to pick up in 4Q15 (driven by infrastructure development) after a stunted growth in the first three quarters of last year. Overall, we estimated cement volume to increase by 5.4%/6.6% to 63.8/67.8m tonnes in FY16/17F. Growth accelaration in infrastructure development and slower property pre-sales will push bulk portion further to c.30% in 2017 (from current 23.7%).
Flurry of new capacities to drop utilisation rate further...
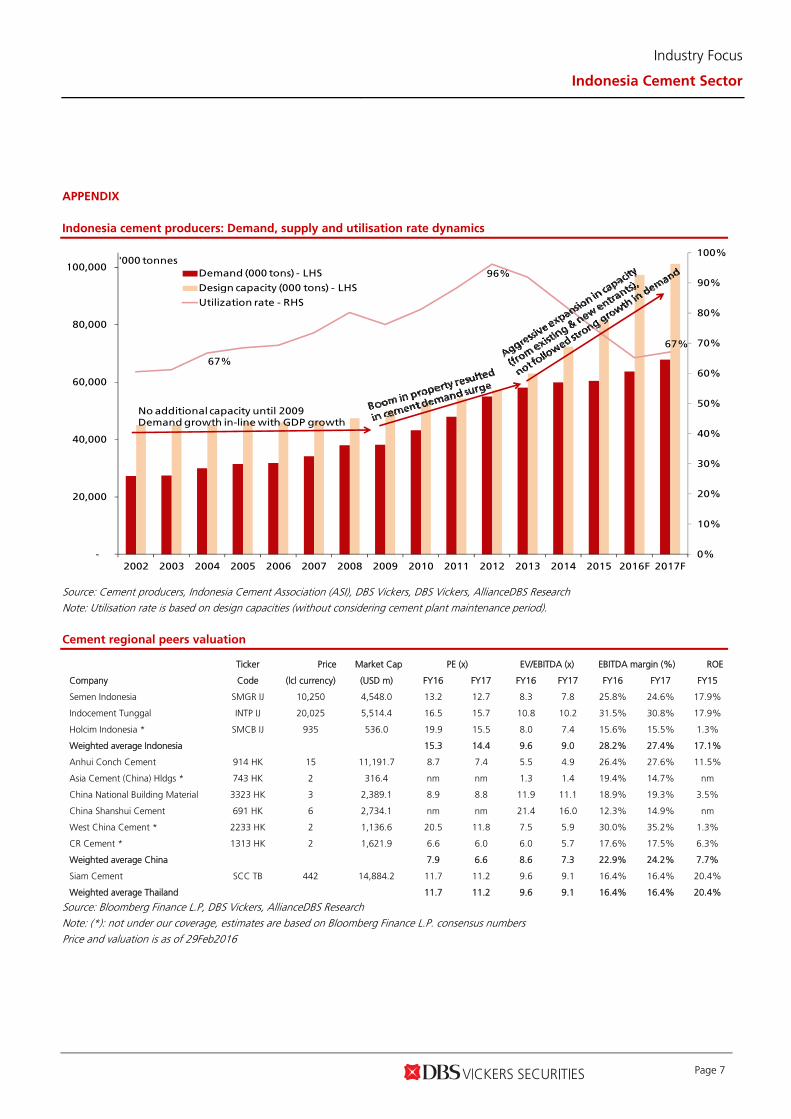
An additional 19.3m tonnes of new installed capacity is expected to come on stream by the end of 2017, with aggressive growth from foreign new entrants (hence, by 2017, they will represent 12% of total industry capacity, from the current 6%). Considering the supply-demand imbalance, the industry's design capacity utilisation rate will continue to drop to 67% in 2017 (similar level to 2004).
... and put pressure on price and subsequently margins.
Low utilisation rate, continued shifts to bulk segment (with lower ASP) and government's direction to push efficient infrastructure development (i.e. with lower cost) will put pressure on ASP and subsequently erode cement producers’ margins going forward.
Slight tweak in earnings as we rolled earnings forward,
maintain negative view on incumbents. We revised our FY16/17F earnings for INTP and SMGR between (-)2.9% and 2% to reflect the cement sales volume achievement in FY15. Our estimates are still one of the lowest in the street. Our target prices are pegged to (-)1SD of respective 10-year mean forward PE (similar to 2004 levels when industry utilisation was low), implying another 20-28% downside as de-rating may continue due to shifts in competitive landscape and legitimate threat from new entrants. We prefer exposure to SMGR as compared to INTP for its market leader position in important markets and its more diversified presence spread throughout the Indonesian islands. Upside risk to our calls may come from significant delays in new players’ greenfield cement plants as this reduce competition and lift utilisation rates.
JCI : 4,779.99
Analyst Edward Ariadi Tanuwijaya +6221 3003 4932 [email protected] Tjen San Chong +603 2604 3972 [email protected]
STOCKS
Source: DBS Vickers, AllianceDBS Research Indocement Tunggal P. : Indocement was established in 1975. The expanded heavily in the 90’s, prior to Heidelberg Cement Group becoming the majority shareholder in 2001. The company trades cement product under “Tiga Roda” brand.
Semen Indonesia : Semen Gresik was established in 1957 as state-owned cement producer before changing its brand name to Semen Indonesia recently. In 1995 the company completed an acquisition of Semen Padang and Semen Tonasa. It is currently the largest player in the market with more than 40% market share.
Domestic cement demand trend
0
10
20
30
40
50
60
70
80
20
02
20
03
20
04
20
05
20
06
20
07
20
08
20
09
20
10
20
11
20
12
20
13
20
14
20
15
20
16
F
20
17
Fm tonnes
5% CAGR
8% CAGR
6% CAGR
Source: Indonesia Cement Association (ASI), DBS Vickers, AllianceDBS Research
DBS Group Research . Equity 2 Mar 2016
Indonesia Industry Focus
Indonesia Cement Sector
Refer to important disclosures at the end of this report
Price Mkt Cap Target Price Performance (%)
Rp US$m Rp 3 mth 12 mth Rating
Indocement 20,000 5,545 14,500 (2.1) (16.8) FULLY VALUED Semen Indonesia 10,250 4,579 8,200 (7.0) (31.1) FULLY VALUED

Industry Focus
Indonesia Cement Sector
Page 2
Encouraging momentum on demand
Jan cement sales volume grew 4.4% y-o-y (on apple-to-apple basis after excluding sales volume from Semen Jawa, a new member of Indonesia Cement Association [ASI]) to 5.05m tonnes. Semen Jawa's cement sales made up 1.8% of total domestic demand. Cement demand has started to pick up in 4Q last year (as shown in chart below), after stunted growth in the early part of last year. It is mostly driven by infrastructure development and hence the apparent shift towards bulk segment. Quarterly domestic cement demand
-5%
0%
5%
10%
15%
20%
25%
10,000
11,000
12,000
13,000
14,000
15,000
16,000
17,000
18,000
1Q
11
2Q
11
3Q
11
4Q
11
1Q
12
2Q
12
3Q
12
4Q
12
1Q
13
2Q
13
3Q
13
4Q
13
1Q
14
2Q
14
3Q
14
4Q
14
1Q
15
2Q
15
3Q
15
4Q
15
Cement sales (LHS)Growth y-o-y (RHS)
'000 tonnes
Source: Indonesia Cement Association (ASI), DBS Vickers, AllianceDBS Research Overall, we estimate that domestic cement demand will grow 5.4%/6.6% to 63.6m/67.8m tonnes in FY16/17F. Growth acceleration in infrastructure development, coupled with slower property pre-sales growth (as discussed in detail in our latest Indonesia property and industrial estate sector report on 5 Jan 2016 titled On the mend after a major setback, despite potential booster from the government's much heralded one million house programme), will boost bulk segment demand. Infrastructure spending as % of GDP
3.0%
3.5%
4.0%
4.5%
5.0%
5.5%
0
100
200
300
400
500
600
700
2005 2006 2007 2008 2009 2010 2011 2012 2013 2014 2015F
Infrastructure Investment (LHS) % of GDP (RHS)Rp tr
Source: Ministry of Finance (state budget data), DBS Vickers, AllianceDBS Research
Property pre-sales to recover moderately (not a surge)
-
5,000
10,000
15,000
20,000
25,000
30,000
35,000
40,000
45,000
2009 2010 2011 2012 2013 2014 2015 2016F2017F
plateauingRpbn
Source: Property developers under our coverage, DBS Vickers, AllianceDBS Research We forecast bulk segment to grow at a 17.2% CAGR between 2015-2017F, while forecasting just 2.2% CAGR for the same period for the bag segment. Therefore, this pushes bulk portion to even higher at c.30% in 2017. The long-term multiplier effect from the much heralded infrastructure development to property pre-sales will remain as a key positive catalyst, but not in the near term. Share of Bulk and Bag cement sales in Indonesia
81% 80% 79% 78% 76% 73% 71%
19% 20% 21% 22% 24% 27% 29%
0%
10%
20%
30%
40%
50%
60%
70%
80%
90%
100%
20
11
20
12
20
13
20
14
20
15
20
16
F
20
17
F
Bag Bulk
Source: Indonesia Cement Association (ASI), DBS Vickers, AllianceDBS Research Annual cement demand growth
34.239.1
44.1 45.6 46.8 46.1 46.5 48.2
6.6
8.9
10.812.4 13.1 14.3 17.2
19.7
0
10
20
30
40
50
60
70
80
2010 2011 2012 2013 2014 2015 2016F 2017F
Bag Bulkm tonnes
2.2% CAGR(for bag)
17.2% CAGR(for bulk)
6% CAGR(overall)
Source: Indonesia Cement Association (ASI), DBS Vickers, AllianceDBS Research
Industry Focus
Indonesia Cement Sector
Page 3
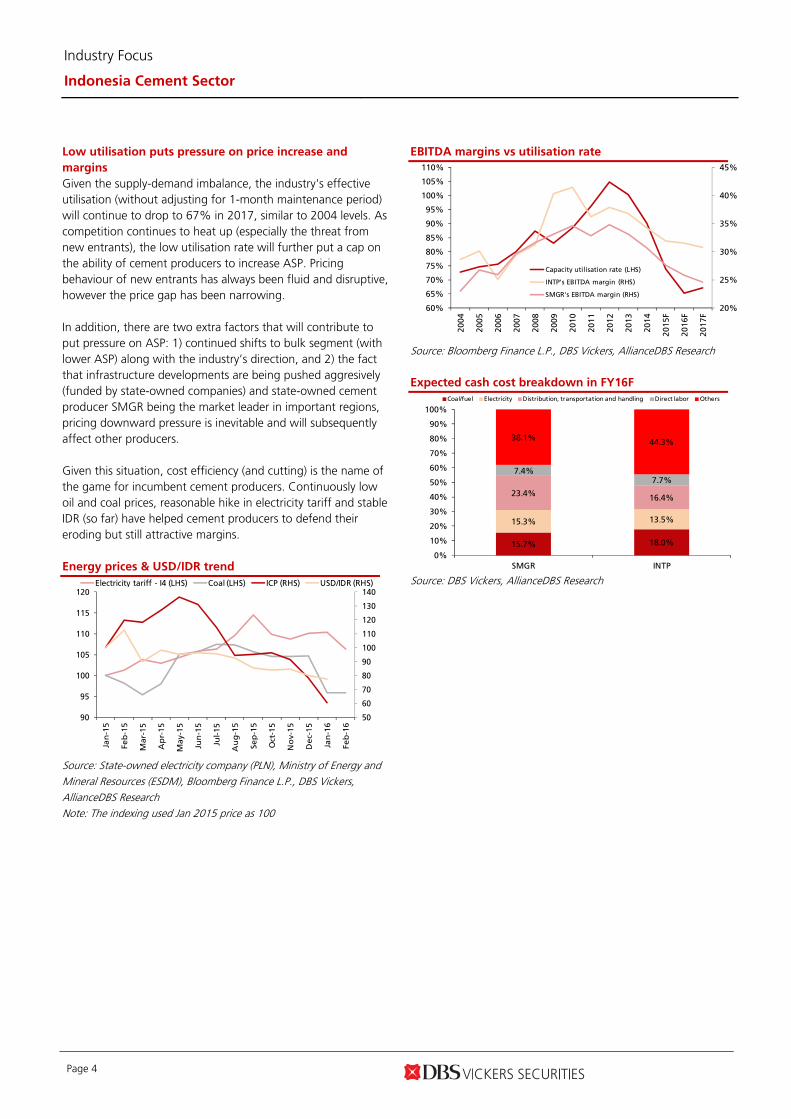
Sumatra (representing 21.6% of domestic demand) and Sulawesi and other areas in East Indonesia (representing 15.9% of domestic demand) were the cement demand growth drivers that offset stunted growth in the most lucrative market Java (representing 55.7% of domestic demand) and declining demand in Kalimantan (representing 6.7% of domestic demand). Demand distribution by region
60.3% 57.7% 55.7% 55.1% 53.8% 55.3% 55.3% 56.4% 56.3% 55.7%
22.0%23.6% 23.4% 23.2% 24.3% 23.0% 21.8% 21.0% 20.9% 21.6%
5.2% 5.8% 6.4% 6.4% 6.4% 7.0% 7.4% 7.6% 7.6% 6.7%
6.0% 6.1% 6.8% 7.9% 6.8% 7.3% 7.5% 7.4% 7.6% 7.9%
0%
10%
20%
30%
40%
50%
60%
70%
80%
90%
100%
2006 2007 2008 2009 2010 2011 2012 2013 2014 2015
Java Sumatra Kalimantan Sulawesi Others
Source: Indonesia Cement Association (ASI), DBS Vickers, AllianceDBS Research We believe that Sumatra will continue to be the growth driver for cement demand by having around 365km of in-progress toll road projects (i.e. Palembang – Indralaya, Medan – Binjai, Medan – Kualanamu, Pekanbaru – Dumai and Bakauheni – Terbanggi Besar), more infrastructure projects in Palembang, South Sumatra (as this city is chosen as the host for Asian Games 2018 together with Jakarta) and the government's commitment to develop Tanjung Api-Api Special Economic Zone (SEZ). Java will remain as the most lucrative market given its sheer demand size at 56% of total domestic demand. After experiencing no growth last year, we believe that cement demand in Java will grow moderately to 4% this year. Given no sudden up-reversal on commodity-related businesses, which are the backbone of Kalimantan’s economy, we believe that cement demand in Kalimantan will continue declining this year. Historical & expected demand growth per region
10.0%
9.0%
10.0%
5.0%
0.0%
10.0%
9.0%
9.0%
4.0%
-5.0%
5.7%
5.1%
4.5%
-0.2%
-10.6%
-15.0% -10.0% -5.0% 0.0% 5.0% 10.0% 15.0%
Sulawesi
Others
Sumatra
Java
Kalimantan2015 2016F 2017F
Source: Indonesia Cement Association (ASI), DBS Vickers, AllianceDBS Research
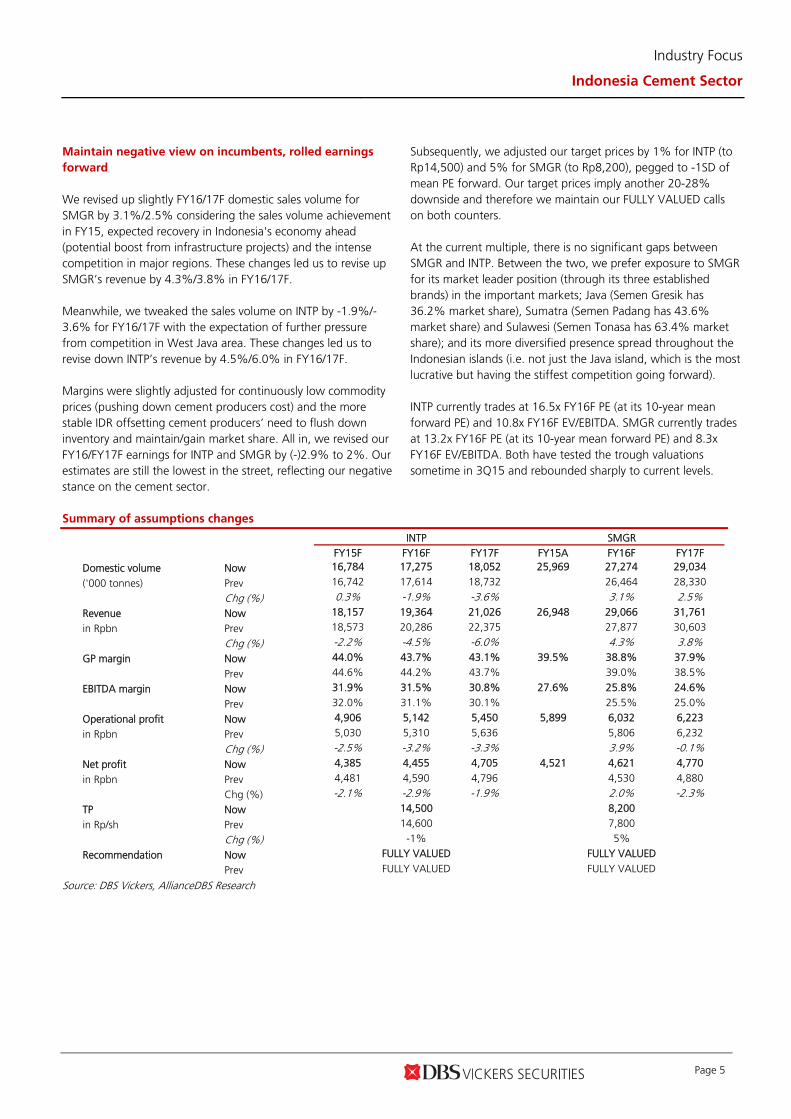
Flurry of new capacities to continue
Our checks suggest an additional 19.3m tonnes of new installed capacity (about 24% of installed capacity on 2015) will come on stream in 2016 and 2017. The “big 3” producers which represents 84% of total capacities, will add only 9% of their 2015 capacities in this time frame. The foreign new entrants (most of them are deep pocketed with strong financial positions) are very aggressive and are expected to almost triple their cumulative installed capacities within the same period (i.e. they will represent 12% of total industry capacities in 2017, up from the current 6%). Those additional capacities will result in some areas’ demand (such as South Sumatra) being better served, but most of the key markets will experience oversupply. Cement producers’ installed capacities
-
10
20
30
40
50
60
70
80
2015 2017F
"Big 3"
Other local
Foreign
m tonnes
+9%
+68%
2.6x
Source: Companies, DBS Vickers, AllianceDBS Research. Note: “Big 3”: SMGR, INTP and SMCB (including LaFarge facilities in Aceh) % of total capacities
84%77% 74%
10%12% 13%
6% 11% 12%
0%
10%
20%
30%
40%
50%
60%
70%
80%
90%
100%
2015 2016F 2017F
"Big 3" Other local Foreign
Source: Companies, DBS Vickers, AllianceDBS Research Note: “Big 3”: SMGR, INTP and SMCB (including LaFarge facilities in Aceh)
Industry Focus
Indonesia Cement Sector
Page 4
Low utilisation puts pressure on price increase and
margins
Given the supply-demand imbalance, the industry's effective utilisation (without adjusting for 1-month maintenance period) will continue to drop to 67% in 2017, similar to 2004 levels. As competition continues to heat up (especially the threat from new entrants), the low utilisation rate will further put a cap on the ability of cement producers to increase ASP. Pricing behaviour of new entrants has always been fluid and disruptive, however the price gap has been narrowing. In addition, there are two extra factors that will contribute to put pressure on ASP: 1) continued shifts to bulk segment (with lower ASP) along with the industry’s direction, and 2) the fact that infrastructure developments are being pushed aggresively (funded by state-owned companies) and state-owned cement producer SMGR being the market leader in important regions, pricing downward pressure is inevitable and will subsequently affect other producers. Given this situation, cost efficiency (and cutting) is the name of the game for incumbent cement producers. Continuously low oil and coal prices, reasonable hike in electricity tariff and stable IDR (so far) have helped cement producers to defend their eroding but still attractive margins. Energy prices & USD/IDR trend
50
60
70
80
90
100
110
120
130
140
90
95
100
105
110
115
120
Jan
-15
Fe
b-1
5
Ma
r-1
5
Ap
r-1
5
Ma
y-1
5
Jun
-15
Jul-
15
Au
g-1
5
Se
p-1
5
Oct
-15
No
v-1
5
De
c-1
5
Jan
-16
Fe
b-1
6
Electricity tariff - I4 (LHS) Coal (LHS) ICP (RHS) USD/IDR (RHS)
Source: State-owned electricity company (PLN), Ministry of Energy and Mineral Resources (ESDM), Bloomberg Finance L.P., DBS Vickers, AllianceDBS Research Note: The indexing used Jan 2015 price as 100
EBITDA margins vs utilisation rate
20%
25%
30%
35%
40%
45%
60%
65%
70%
75%
80%
85%
90%
95%
100%
105%
110%
20
04
20
05
20
06
20
07
20
08
20
09
20
10
20
11
20
12
20
13
20
14
20
15
F
20
16
F
20
17
F
Capacity utilisation rate (LHS)
INTP's EBITDA margin (RHS)
SMGR's EBITDA margin (RHS)
Source: Bloomberg Finance L.P., DBS Vickers, AllianceDBS Research Expected cash cost breakdown in FY16F
15.7% 18.0%
15.3% 13.5%
23.4%16.4%
7.4%7.7%
38.1%44.3%
0%
10%
20%
30%
40%
50%
60%
70%
80%
90%
100%
SMGR INTP
Coal/fuel Electricity Distribution, transportation and handling Direct labor Others
Source: DBS Vickers, AllianceDBS Research
Industry Focus
Indonesia Cement Sector
Page 5
Maintain negative view on incumbents, rolled earnings
forward
We revised up slightly FY16/17F domestic sales volume for SMGR by 3.1%/2.5% considering the sales volume achievement in FY15, expected recovery in Indonesia's economy ahead (potential boost from infrastructure projects) and the intense competition in major regions. These changes led us to revise up SMGR’s revenue by 4.3%/3.8% in FY16/17F. Meanwhile, we tweaked the sales volume on INTP by -1.9%/-3.6% for FY16/17F with the expectation of further pressure from competition in West Java area. These changes led us to revise down INTP’s revenue by 4.5%/6.0% in FY16/17F. Margins were slightly adjusted for continuously low commodity prices (pushing down cement producers cost) and the more stable IDR offsetting cement producers’ need to flush down inventory and maintain/gain market share. All in, we revised our FY16/FY17F earnings for INTP and SMGR by (-)2.9% to 2%. Our estimates are still the lowest in the street, reflecting our negative stance on the cement sector.
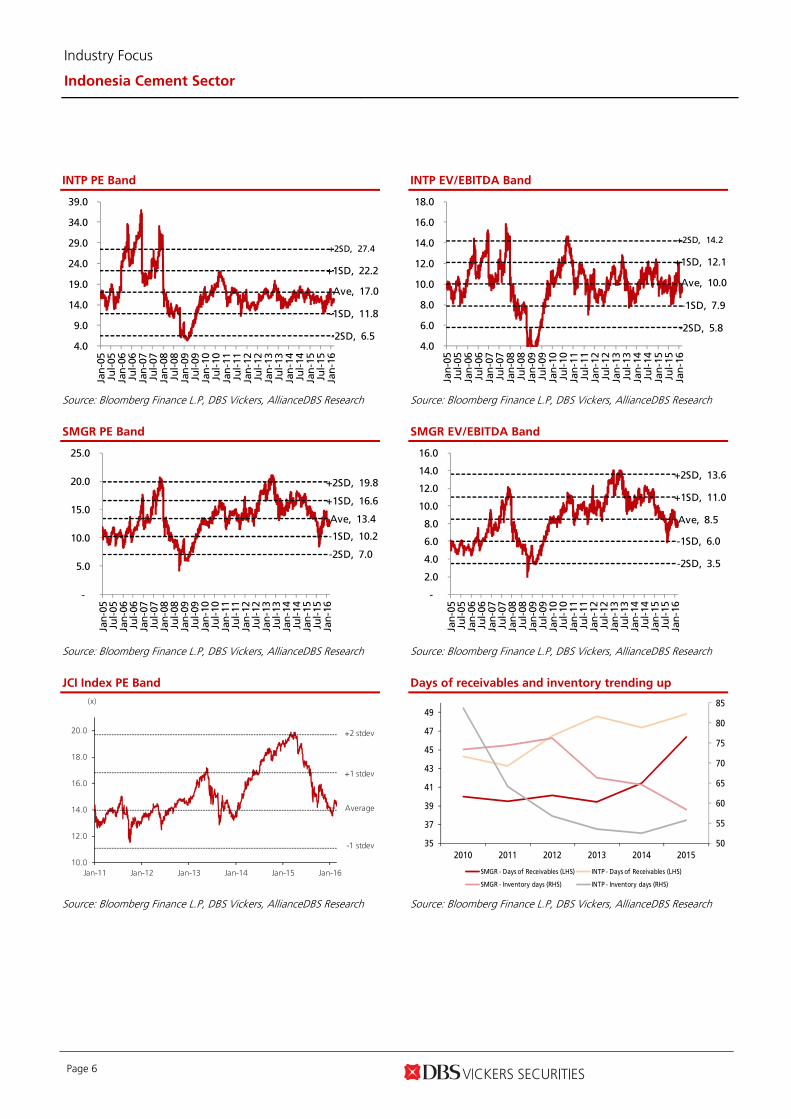
Subsequently, we adjusted our target prices by 1% for INTP (to Rp14,500) and 5% for SMGR (to Rp8,200), pegged to -1SD of mean PE forward. Our target prices imply another 20-28% downside and therefore we maintain our FULLY VALUED calls on both counters. At the current multiple, there is no significant gaps between SMGR and INTP. Between the two, we prefer exposure to SMGR for its market leader position (through its three established brands) in the important markets; Java (Semen Gresik has 36.2% market share), Sumatra (Semen Padang has 43.6% market share) and Sulawesi (Semen Tonasa has 63.4% market share); and its more diversified presence spread throughout the Indonesian islands (i.e. not just the Java island, which is the most lucrative but having the stiffest competition going forward). INTP currently trades at 16.5x FY16F PE (at its 10-year mean forward PE) and 10.8x FY16F EV/EBITDA. SMGR currently trades at 13.2x FY16F PE (at its 10-year mean forward PE) and 8.3x FY16F EV/EBITDA. Both have tested the trough valuations sometime in 3Q15 and rebounded sharply to current levels.
Summary of assumptions changes
INTP SMGR FY15F FY16F FY17F FY15A FY16F FY17F
Domestic volume Now 16,784 17,275 18,052 25,969 27,274 29,034
('000 tonnes) Prev 16,742 17,614 18,732
26,464 28,330
Chg (%) 0.3% -1.9% -3.6% 3.1% 2.5%
Revenue Now 18,157 19,364 21,026 26,948 29,066 31,761
in Rpbn Prev 18,573 20,286 22,375 27,877 30,603
Chg (%) -2.2% -4.5% -6.0% 4.3% 3.8%
GP margin Now 44.0% 43.7% 43.1% 39.5% 38.8% 37.9%
Prev 44.6% 44.2% 43.7%
39.0% 38.5%
EBITDA margin Now 31.9% 31.5% 30.8% 27.6% 25.8% 24.6%
Prev 32.0% 31.1% 30.1% 25.5% 25.0%
Operational profit Now 4,906 5,142 5,450 5,899 6,032 6,223
in Rpbn Prev 5,030 5,310 5,636 5,806 6,232
Chg (%) -2.5% -3.2% -3.3% 3.9% -0.1%
Net profit Now 4,385 4,455 4,705 4,521 4,621 4,770
in Rpbn Prev 4,481 4,590 4,796 4,530 4,880
Chg (%) -2.1% -2.9% -1.9% 2.0% -2.3%
TP Now 14,500 8,200
in Rp/sh Prev 14,600 7,800
Chg (%) -1% 5%
Recommendation Now FULLY VALUED FULLY VALUED
Prev FULLY VALUED FULLY VALUED
Source: DBS Vickers, AllianceDBS Research
Industry Focus
Indonesia Cement Sector
Page 6
INTP PE Band
-2SD, 6.5
-1SD, 11.8
Ave, 17.0
+1SD, 22.2
+2SD, 27.4
4.0
9.0
14.0
19.0
24.0
29.0
34.0
39.0
Jan
-05
Jul-
05
Jan
-06
Jul-
06
Jan
-07
Jul-
07
Jan
-08
Jul-
08
Jan
-09
Jul-
09
Jan
-10
Jul-
10
Jan
-11
Jul-
11
Jan
-12
Jul-
12
Jan
-13
Jul-
13
Jan
-14
Jul-
14
Jan
-15
Jul-
15
Jan
-16
Source: Bloomberg Finance L.P, DBS Vickers, AllianceDBS Research SMGR PE Band
-2SD, 7.0
-1SD, 10.2
Ave, 13.4
+1SD, 16.6
+2SD, 19.8
-
5.0
10.0
15.0
20.0
25.0
Jan
-05
Jul-
05
Jan
-06
Jul-
06
Jan
-07
Jul-
07
Jan
-08
Jul-
08
Jan
-09
Jul-
09
Jan
-10
Jul-
10
Jan
-11
Jul-
11
Jan
-12
Jul-
12
Jan
-13
Jul-
13
Jan
-14
Jul-
14
Jan
-15
Jul-
15
Jan
-16
Source: Bloomberg Finance L.P, DBS Vickers, AllianceDBS Research JCI Index PE Band
Average
+1 stdev
+2 stdev
-1 stdev
10.0
12.0
14.0
16.0
18.0
20.0
Jan-11 Jan-12 Jan-13 Jan-14 Jan-15 Jan-16
(x)
Source: Bloomberg Finance L.P, DBS Vickers, AllianceDBS Research
INTP EV/EBITDA Band
-2SD, 5.8
-1SD, 7.9
Ave, 10.0
+1SD, 12.1
+2SD, 14.2
4.0
6.0
8.0
10.0
12.0
14.0
16.0
18.0
Jan
-05
Jul-
05
Jan
-06
Jul-
06
Jan
-07
Jul-
07
Jan
-08
Jul-
08
Jan
-09
Jul-
09
Jan
-10
Jul-
10
Jan
-11
Jul-
11
Jan
-12
Jul-
12
Jan
-13
Jul-
13
Jan
-14
Jul-
14
Jan
-15
Jul-
15
Jan
-16
Source: Bloomberg Finance L.P, DBS Vickers, AllianceDBS Research SMGR EV/EBITDA Band
-2SD, 3.5
-1SD, 6.0
Ave, 8.5
+1SD, 11.0
+2SD, 13.6
-
2.0
4.0
6.0
8.0
10.0
12.0
14.0
16.0 Ja
n-0
5Ju
l-05
Jan
-06
Jul-
06
Jan
-07
Jul-
07
Jan
-08
Jul-
08
Jan
-09
Jul-
09
Jan
-10
Jul-
10
Jan
-11
Jul-
11
Jan
-12
Jul-
12
Jan
-13
Jul-
13
Jan
-14
Jul-
14
Jan
-15
Jul-
15
Jan
-16
Source: Bloomberg Finance L.P, DBS Vickers, AllianceDBS Research Days of receivables and inventory trending up
50
55
60
65
70
75
80
85
35
37
39
41
43
45
47
49
2010 2011 2012 2013 2014 2015
SMGR - Days of Receivables (LHS) INTP - Days of Receivables (LHS)
SMGR - Inventory days (RHS) INTP - Inventory days (RHS)
Source: Bloomberg Finance L.P, DBS Vickers, AllianceDBS Research
Industry Focus
Indonesia Cement Sector
Page 7
APPENDIX
Indonesia cement producers: Demand, supply and utilisation rate dynamics
67%
96%
67%
0%
10%
20%
30%
40%
50%
60%
70%
80%
90%
100%
-
20,000
40,000
60,000
80,000
100,000
2002 2003 2004 2005 2006 2007 2008 2009 2010 2011 2012 2013 2014 2015 2016F 2017F
Demand (000 tons) - LHS
Design capacity (000 tons) - LHS
Utilization rate - RHS
'000 tonnes
No additional capacity until 2009Demand growth in-line with GDP growth
Source: Cement producers, Indonesia Cement Association (ASI), DBS Vickers, DBS Vickers, AllianceDBS Research Note: Utilisation rate is based on design capacities (without considering cement plant maintenance period). Cement regional peers valuation
Ticker Price Market Cap PE (x) EV/EBITDA (x) EBITDA margin (%) ROE
Company Code (lcl currency) (USD m) FY16 FY17 FY16 FY17 FY16 FY17 FY15
Semen Indonesia SMGR IJ 10,250 4,548.0 13.2 12.7 8.3 7.8 25.8% 24.6% 17.9%
Indocement Tunggal INTP IJ 20,025 5,514.4 16.5 15.7 10.8 10.2 31.5% 30.8% 17.9%
Holcim Indonesia * SMCB IJ 935 536.0 19.9 15.5 8.0 7.4 15.6% 15.5% 1.3%
Weighted average Indonesia 15.3 14.4 9.6 9.0 28.2% 27.4% 17.1%
Anhui Conch Cement 914 HK 15 11,191.7 8.7 7.4 5.5 4.9 26.4% 27.6% 11.5%
Asia Cement (China) Hldgs * 743 HK 2 316.4 nm nm 1.3 1.4 19.4% 14.7% nm
China National Building Material 3323 HK 3 2,389.1 8.9 8.8 11.9 11.1 18.9% 19.3% 3.5%
China Shanshui Cement 691 HK 6 2,734.1 nm nm 21.4 16.0 12.3% 14.9% nm
West China Cement * 2233 HK 2 1,136.6 20.5 11.8 7.5 5.9 30.0% 35.2% 1.3%
CR Cement * 1313 HK 2 1,621.9 6.6 6.0 6.0 5.7 17.6% 17.5% 6.3%
Weighted average China 7.9 6.6 8.6 7.3 22.9% 24.2% 7.7%
Siam Cement SCC TB 442 14,884.2 11.7 11.2 9.6 9.1 16.4% 16.4% 20.4%
Weighted average Thailand 11.7 11.2 9.6 9.1 16.4% 16.4% 20.4%
Source: Bloomberg Finance L.P, DBS Vickers, AllianceDBS Research Note: (*): not under our coverage, estimates are based on Bloomberg Finance L.P. consensus numbers Price and valuation is as of 29Feb2016
Industry Focus
Indonesia Cement Sector
Page 8
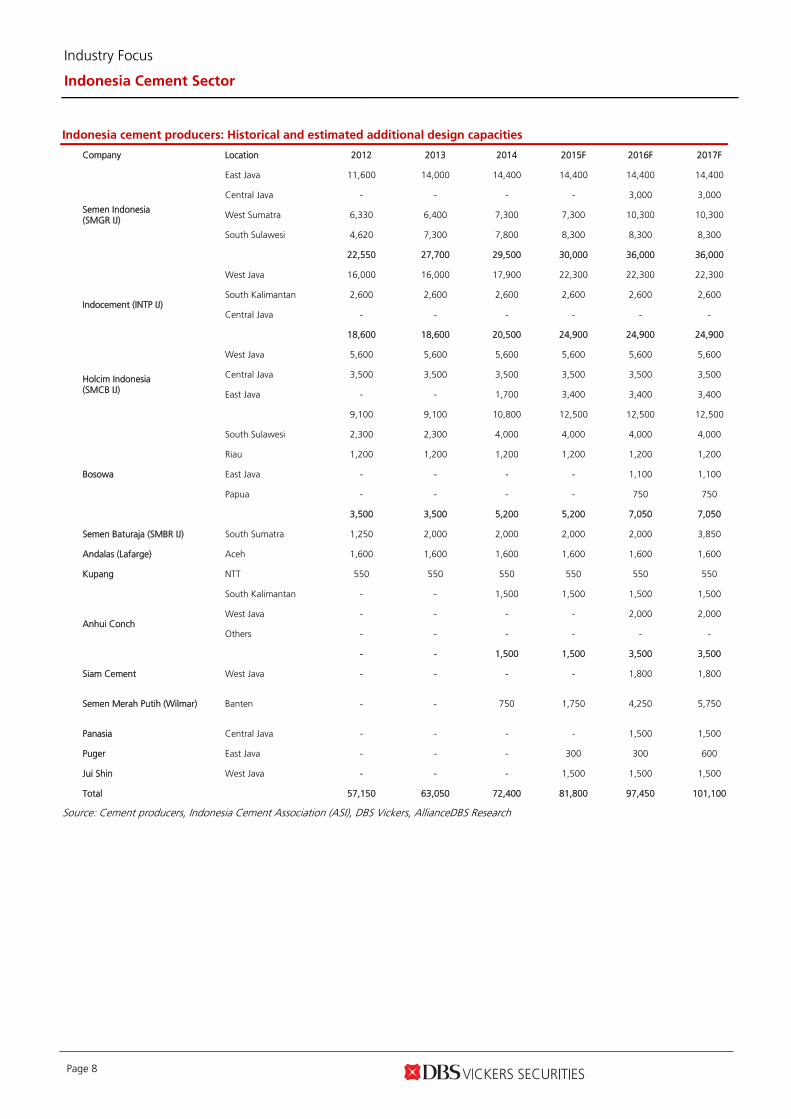
Indonesia cement producers: Historical and estimated additional design capacities
Company Location 2012 2013 2014 2015F 2016F 2017F
Semen Indonesia (SMGR IJ)
East Java 11,600 14,000 14,400 14,400 14,400 14,400
Central Java - - - - 3,000 3,000
West Sumatra 6,330 6,400 7,300 7,300 10,300 10,300
South Sulawesi 4,620 7,300 7,800 8,300 8,300 8,300
22,550 27,700 29,500 30,000 36,000 36,000
Indocement (INTP IJ)
West Java 16,000 16,000 17,900 22,300 22,300 22,300
South Kalimantan 2,600 2,600 2,600 2,600 2,600 2,600
Central Java - - - - - -
18,600 18,600 20,500 24,900 24,900 24,900
Holcim Indonesia (SMCB IJ)
West Java 5,600 5,600 5,600 5,600 5,600 5,600
Central Java 3,500 3,500 3,500 3,500 3,500 3,500
East Java - - 1,700 3,400 3,400 3,400
9,100 9,100 10,800 12,500 12,500 12,500
Bosowa
South Sulawesi 2,300 2,300 4,000 4,000 4,000 4,000
Riau 1,200 1,200 1,200 1,200 1,200 1,200
East Java - - - - 1,100 1,100
Papua - - - - 750 750
3,500 3,500 5,200 5,200 7,050 7,050
Semen Baturaja (SMBR IJ) South Sumatra 1,250 2,000 2,000 2,000 2,000 3,850
Andalas (Lafarge) Aceh 1,600 1,600 1,600 1,600 1,600 1,600
Kupang NTT 550 550 550 550 550 550
Anhui Conch
South Kalimantan - - 1,500 1,500 1,500 1,500
West Java - - - - 2,000 2,000
Others - - - - - -
- - 1,500 1,500 3,500 3,500
Siam Cement West Java - - - - 1,800 1,800
Semen Merah Putih (Wilmar) Banten - - 750 1,750 4,250 5,750
Panasia Central Java - - - - 1,500 1,500
Puger East Java - - - 300 300 600
Jui Shin West Java - - - 1,500 1,500 1,500
Total 57,150 63,050 72,400 81,800 97,450 101,100
Source: Cement producers, Indonesia Cement Association (ASI), DBS Vickers, AllianceDBS Research

Industry Focus
Indonesia Cement Sector
Page 9
Cement producer competition heat map
Source: Cement producers, Indonesia Cement Association (ASI), DBS Vickers, AllianceDBS Research Note: 1. Utilisation rate is based on design capacities (without considering cement plant maintenance period).
2. Red circle: intense competition (oversupply), Orange: moderate competition (adequate supply), Green: light competition (incumbents have the upper hand).
Industry Focus Indonesia Cement Sector
Industry Focus
Indonesia Cement Sector
Page 10
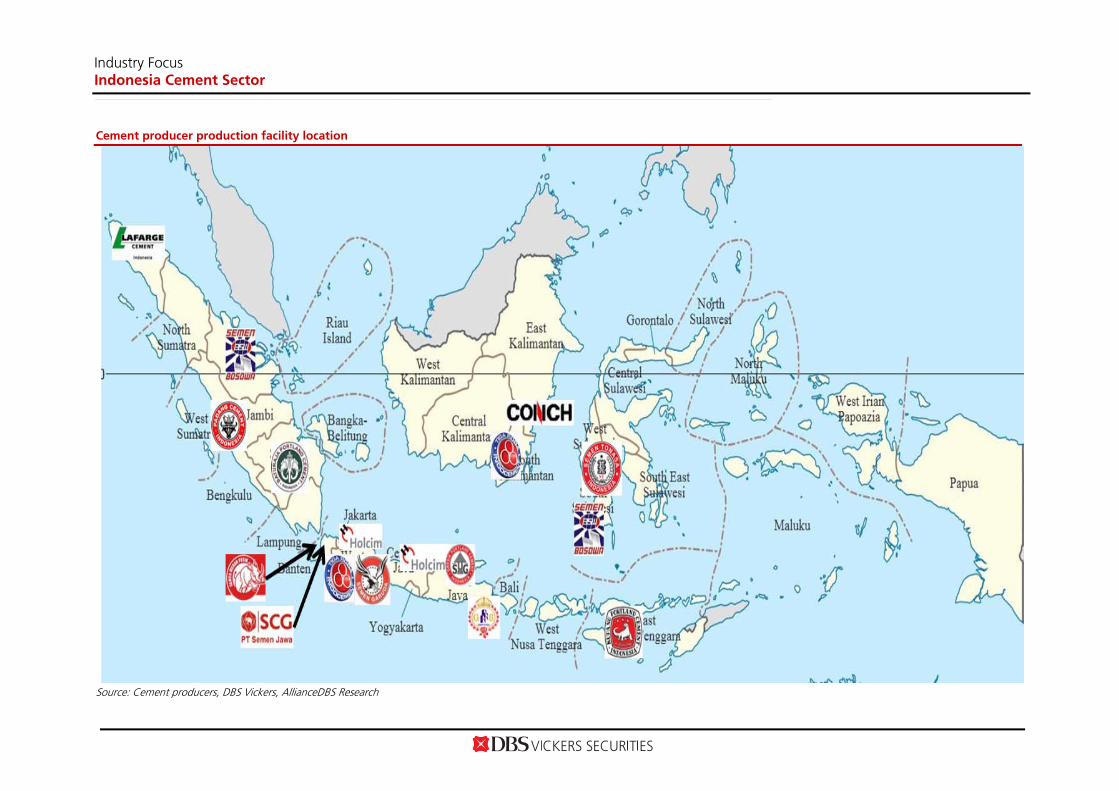
Cement producer production facility location
Source: Cement producers, DBS Vickers, AllianceDBS Research
Industry Focus Indonesia Cement Sector
Industry Focus
Indonesia Cement Sector
Page 11
Company Guides
ASIAN INSIGHTS VICKERS SECURITIES ed: TH / sa: MA
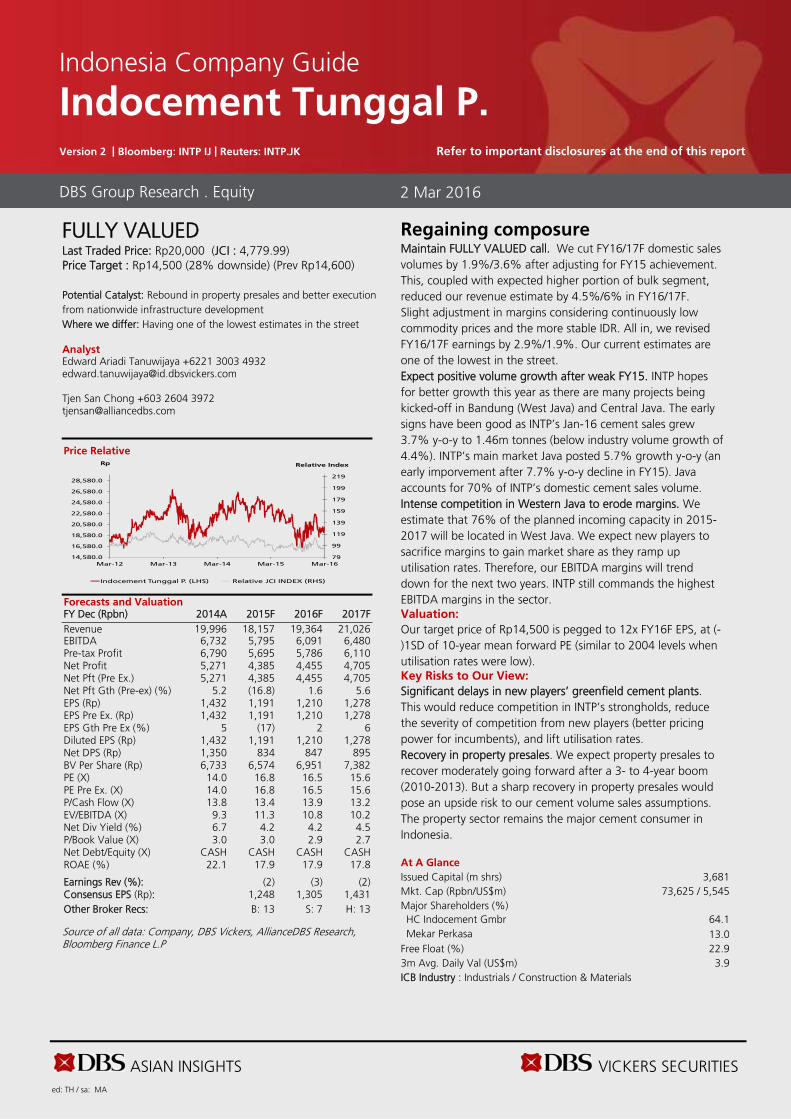
FULLY VALUED Last Traded Price: Rp20,000 (JCI : 4,779.99) Price Target : Rp14,500 (28% downside) (Prev Rp14,600) Potential Catalyst: Rebound in property presales and better execution from nationwide infrastructure development Where we differ: Having one of the lowest estimates in the street Analyst Edward Ariadi Tanuwijaya +6221 3003 4932 [email protected] Tjen San Chong +603 2604 3972 [email protected]
Price Relative
Forecasts and Valuation FY Dec (Rpbn) 2014A 2015F 2016F 2017F Revenue 19,996 18,157 19,364 21,026 EBITDA 6,732 5,795 6,091 6,480 Pre-tax Profit 6,790 5,695 5,786 6,110 Net Profit 5,271 4,385 4,455 4,705 Net Pft (Pre Ex.) 5,271 4,385 4,455 4,705 Net Pft Gth (Pre-ex) (%) 5.2 (16.8) 1.6 5.6 EPS (Rp) 1,432 1,191 1,210 1,278 EPS Pre Ex. (Rp) 1,432 1,191 1,210 1,278 EPS Gth Pre Ex (%) 5 (17) 2 6 Diluted EPS (Rp) 1,432 1,191 1,210 1,278 Net DPS (Rp) 1,350 834 847 895 BV Per Share (Rp) 6,733 6,574 6,951 7,382 PE (X) 14.0 16.8 16.5 15.6 PE Pre Ex. (X) 14.0 16.8 16.5 15.6 P/Cash Flow (X) 13.8 13.4 13.9 13.2 EV/EBITDA (X) 9.3 11.3 10.8 10.2 Net Div Yield (%) 6.7 4.2 4.2 4.5 P/Book Value (X) 3.0 3.0 2.9 2.7 Net Debt/Equity (X) CASH CASH CASH CASH ROAE (%) 22.1 17.9 17.9 17.8 Earnings Rev (%): (2) (3) (2) Consensus EPS (Rp): 1,248 1,305 1,431 Other Broker Recs: B: 13 S: 7 H: 13
Source of all data: Company, DBS Vickers, AllianceDBS Research, Bloomberg Finance L.P
Regaining composure Maintain FULLY VALUED call. We cut FY16/17F domestic sales volumes by 1.9%/3.6% after adjusting for FY15 achievement. This, coupled with expected higher portion of bulk segment, reduced our revenue estimate by 4.5%/6% in FY16/17F. Slight adjustment in margins considering continuously low commodity prices and the more stable IDR. All in, we revised FY16/17F earnings by 2.9%/1.9%. Our current estimates are one of the lowest in the street. Expect positive volume growth after weak FY15. INTP hopes for better growth this year as there are many projects being kicked-off in Bandung (West Java) and Central Java. The early signs have been good as INTP’s Jan-16 cement sales grew 3.7% y-o-y to 1.46m tonnes (below industry volume growth of 4.4%). INTP’s main market Java posted 5.7% growth y-o-y (an early imporvement after 7.7% y-o-y decline in FY15). Java accounts for 70% of INTP’s domestic cement sales volume. Intense competition in Western Java to erode margins. We estimate that 76% of the planned incoming capacity in 2015-2017 will be located in West Java. We expect new players to sacrifice margins to gain market share as they ramp up utilisation rates. Therefore, our EBITDA margins will trend down for the next two years. INTP still commands the highest EBITDA margins in the sector. Valuation:
Our target price of Rp14,500 is pegged to 12x FY16F EPS, at (-)1SD of 10-year mean forward PE (similar to 2004 levels when utilisation rates were low). Key Risks to Our View:
Significant delays in new players’ greenfield cement plants. This would reduce competition in INTP’s strongholds, reduce the severity of competition from new players (better pricing power for incumbents), and lift utilisation rates. Recovery in property presales. We expect property presales to recover moderately going forward after a 3- to 4-year boom (2010-2013). But a sharp recovery in property presales would pose an upside risk to our cement volume sales assumptions. The property sector remains the major cement consumer in Indonesia. At A Glance Issued Capital (m shrs) 3,681 Mkt. Cap (Rpbn/US$m) 73,625 / 5,545 Major Shareholders (%) HC Indocement Gmbr 64.1 Mekar Perkasa 13.0
Free Float (%) 22.9 3m Avg. Daily Val (US$m) 3.9 ICB Industry : Industrials / Construction & Materials
DBS Group Research . Equity 2 Mar 2016
Indonesia Company Guide
Indocement Tunggal P. Version 2 | Bloomberg: INTP IJ | Reuters: INTP.JK Refer to important disclosures at the end of this report
79
99
119
139
159
179
199
219
14,580.0
16,580.0
18,580.0
20,580.0
22,580.0
24,580.0
26,580.0
28,580.0
Mar-12 Mar-13 Mar-14 Mar-15 Mar-16
Relative IndexRp
Indocement Tunggal P. (LHS) Relative JCI INDEX (RHS)
ASIAN INSIGHTS VICKERS SECURITIES Page 13
Company Guide
Indocement Tunggal P.
CRITICAL DATA POINTS TO WATCH
Earnings Drivers:
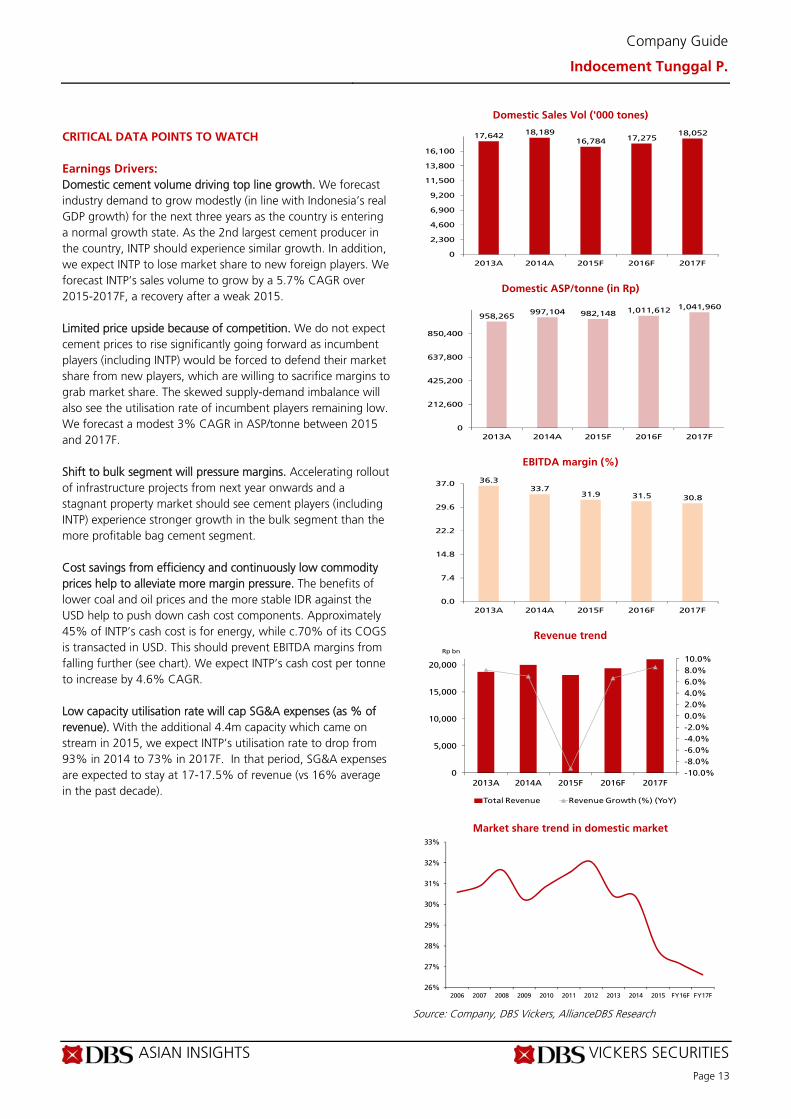
Domestic cement volume driving top line growth. We forecast industry demand to grow modestly (in line with Indonesia’s real GDP growth) for the next three years as the country is entering a normal growth state. As the 2nd largest cement producer in the country, INTP should experience similar growth. In addition, we expect INTP to lose market share to new foreign players. We forecast INTP’s sales volume to grow by a 5.7% CAGR over 2015-2017F, a recovery after a weak 2015. Limited price upside because of competition. We do not expect cement prices to rise significantly going forward as incumbent players (including INTP) would be forced to defend their market share from new players, which are willing to sacrifice margins to grab market share. The skewed supply-demand imbalance will also see the utilisation rate of incumbent players remaining low. We forecast a modest 3% CAGR in ASP/tonne between 2015 and 2017F. Shift to bulk segment will pressure margins. Accelerating rollout of infrastructure projects from next year onwards and a stagnant property market should see cement players (including INTP) experience stronger growth in the bulk segment than the more profitable bag cement segment. Cost savings from efficiency and continuously low commodity prices help to alleviate more margin pressure. The benefits of lower coal and oil prices and the more stable IDR against the USD help to push down cash cost components. Approximately 45% of INTP’s cash cost is for energy, while c.70% of its COGS is transacted in USD. This should prevent EBITDA margins from falling further (see chart). We expect INTP’s cash cost per tonne to increase by 4.6% CAGR. Low capacity utilisation rate will cap SG&A expenses (as % of revenue). With the additional 4.4m capacity which came on stream in 2015, we expect INTP’s utilisation rate to drop from 93% in 2014 to 73% in 2017F. In that period, SG&A expenses are expected to stay at 17-17.5% of revenue (vs 16% average in the past decade).
Domestic Sales Vol ('000 tones)
Domestic ASP/tonne (in Rp)
EBITDA margin (%)
Revenue trend
Market share trend in domestic market
Source: Company, DBS Vickers, AllianceDBS Research
17,64218,189
16,784 17,27518,052
0
2,300
4,600
6,900
9,200
11,500
13,800
16,100
2013A 2014A 2015F 2016F 2017F
958,265997,104 982,148 1,011,612 1,041,960
0
212,600
425,200
637,800
850,400
2013A 2014A 2015F 2016F 2017F
36.333.7
31.9 31.5 30.8
0.0
7.4
14.8
22.2
29.6
37.0
2013A 2014A 2015F 2016F 2017F
-10.0%
-8.0%
-6.0%
-4.0%
-2.0%
0.0%
2.0%
4.0%
6.0%
8.0%
10.0%
0
5,000
10,000
15,000
20,000
2013A 2014A 2015F 2016F 2017F
Rp bn
Total Revenue Revenue Growth (%) (YoY)
26%
27%
28%
29%
30%
31%
32%
33%
2006 2007 2008 2009 2010 2011 2012 2013 2014 2015 FY16F FY17F
ASIAN INSIGHTS VICKERS SECURITIES Page 14
Company Guide
Indocement Tunggal P.
Balance Sheet:
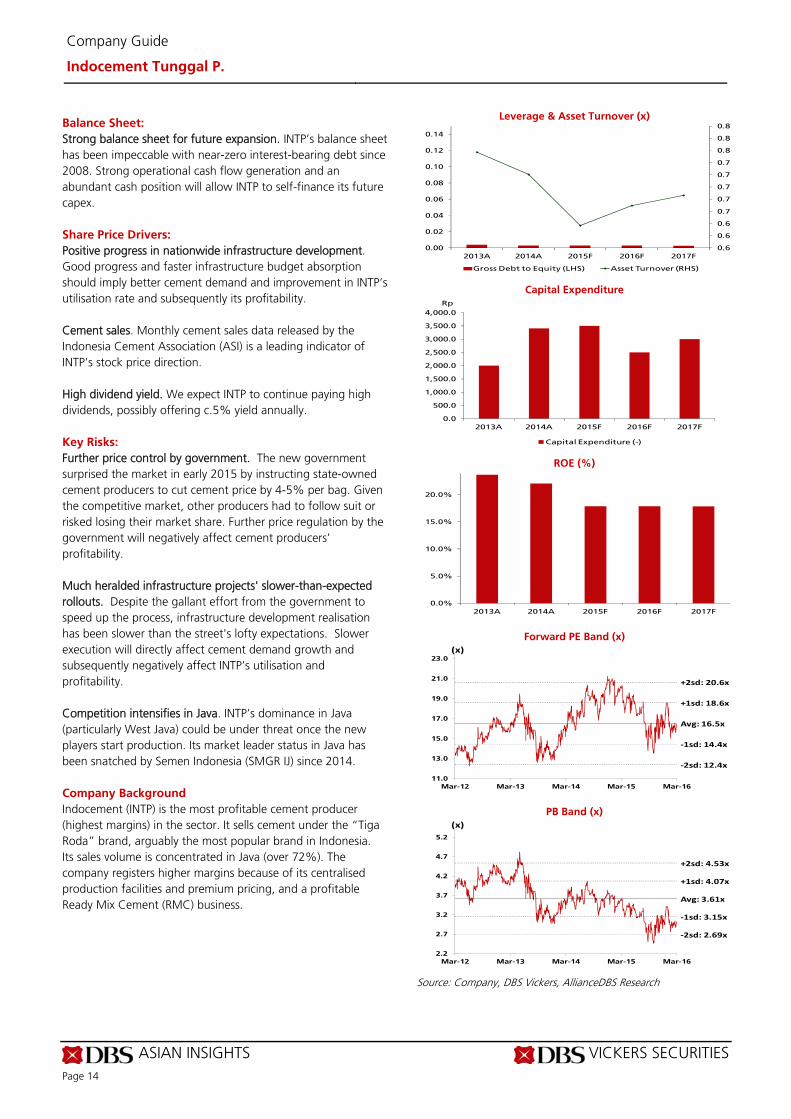
Strong balance sheet for future expansion. INTP’s balance sheet has been impeccable with near-zero interest-bearing debt since 2008. Strong operational cash flow generation and an abundant cash position will allow INTP to self-finance its future capex.
Share Price Drivers:
Positive progress in nationwide infrastructure development. Good progress and faster infrastructure budget absorption should imply better cement demand and improvement in INTP’s utilisation rate and subsequently its profitability. Cement sales. Monthly cement sales data released by the Indonesia Cement Association (ASI) is a leading indicator of INTP’s stock price direction. High dividend yield. We expect INTP to continue paying high dividends, possibly offering c.5% yield annually.
Key Risks:
Further price control by government. The new government surprised the market in early 2015 by instructing state-owned cement producers to cut cement price by 4-5% per bag. Given the competitive market, other producers had to follow suit or risked losing their market share. Further price regulation by the government will negatively affect cement producers’ profitability. Much heralded infrastructure projects' slower-than-expected rollouts. Despite the gallant effort from the government to speed up the process, infrastructure development realisation has been slower than the street's lofty expectations. Slower execution will directly affect cement demand growth and subsequently negatively affect INTP’s utilisation and profitability. Competition intensifies in Java. INTP’s dominance in Java (particularly West Java) could be under threat once the new players start production. Its market leader status in Java has been snatched by Semen Indonesia (SMGR IJ) since 2014.
Company Background
Indocement (INTP) is the most profitable cement producer (highest margins) in the sector. It sells cement under the “Tiga Roda” brand, arguably the most popular brand in Indonesia. Its sales volume is concentrated in Java (over 72%). The company registers higher margins because of its centralised production facilities and premium pricing, and a profitable Ready Mix Cement (RMC) business.
Leverage & Asset Turnover (x)
Capital Expenditure
ROE (%)
Forward PE Band (x)
PB Band (x)
Source: Company, DBS Vickers, AllianceDBS Research
0.6
0.6
0.6
0.7
0.7
0.7
0.7
0.7
0.8
0.8
0.8
0.00
0.02
0.04
0.06
0.08
0.10
0.12
0.14
2013A 2014A 2015F 2016F 2017F
Gross Debt to Equity (LHS) Asset Turnover (RHS)
0.0
500.0
1,000.0
1,500.0
2,000.0
2,500.0
3,000.0
3,500.0
4,000.0
2013A 2014A 2015F 2016F 2017F
Capital Expenditure (-)
Rp
0.0%
5.0%
10.0%
15.0%
20.0%
2013A 2014A 2015F 2016F 2017F
Avg: 16.5x
+1sd: 18.6x
+2sd: 20.6x
‐1sd: 14.4x
‐2sd: 12.4x
11.0
13.0
15.0
17.0
19.0
21.0
23.0
Mar-12 Mar-13 Mar-14 Mar-15 Mar-16
(x)
Avg: 3.61x
+1sd: 4.07x
+2sd: 4.53x
‐1sd: 3.15x
‐2sd: 2.69x
2.2
2.7
3.2
3.7
4.2
4.7
5.2
Mar-12 Mar-13 Mar-14 Mar-15 Mar-16
(x)
ASIAN INSIGHTS VICKERS SECURITIES Page 15
Company Guide
Indocement Tunggal P.
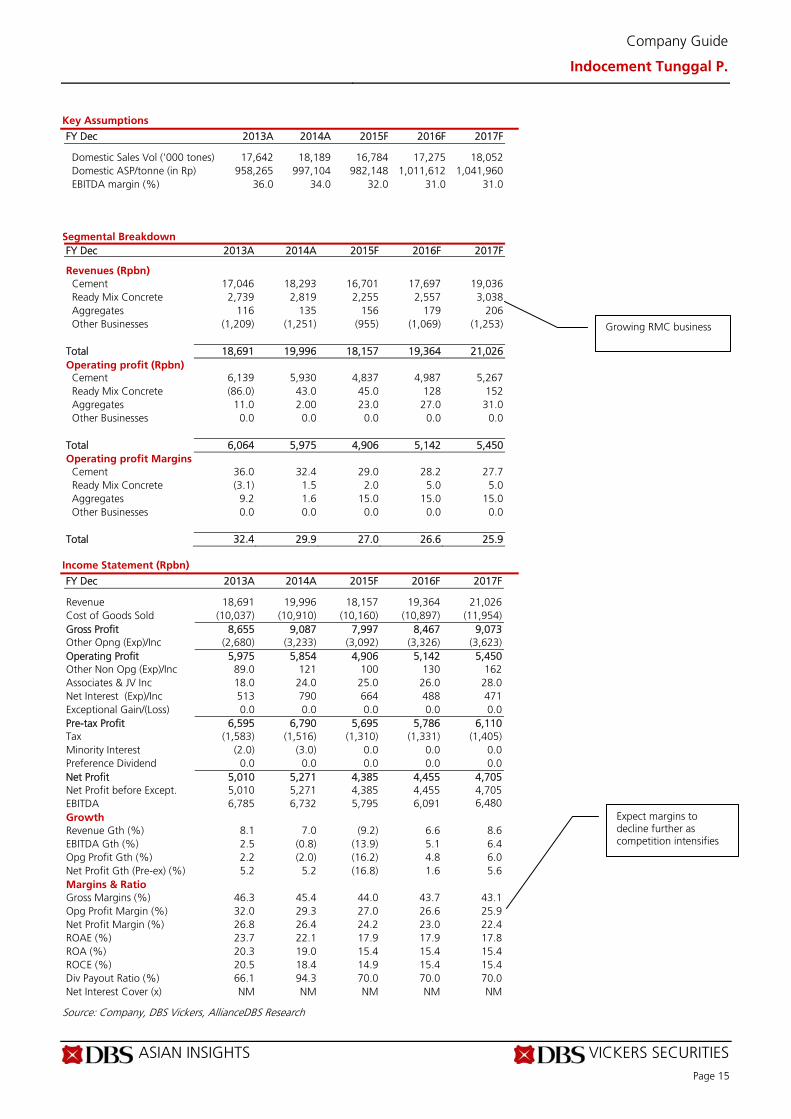
Key Assumptions
FY Dec 2013A 2014A 2015F 2016F 2017F Domestic Sales Vol ('000 tones) 17,642 18,189 16,784 17,275 18,052 Domestic ASP/tonne (in Rp) 958,265 997,104 982,148 1,011,612 1,041,960 EBITDA margin (%) 36.0 34.0 32.0 31.0 31.0
Segmental Breakdown
FY Dec 2013A 2014A 2015F 2016F 2017F Revenues (Rpbn) Cement 17,046 18,293 16,701 17,697 19,036 Ready Mix Concrete 2,739 2,819 2,255 2,557 3,038 Aggregates 116 135 156 179 206 Other Businesses (1,209) (1,251) (955) (1,069) (1,253) Total 18,691 19,996 18,157 19,364 21,026 Operating profit (Rpbn) Cement 6,139 5,930 4,837 4,987 5,267 Ready Mix Concrete (86.0) 43.0 45.0 128 152 Aggregates 11.0 2.00 23.0 27.0 31.0 Other Businesses 0.0 0.0 0.0 0.0 0.0 Total 6,064 5,975 4,906 5,142 5,450 Operating profit Margins
Cement 36.0 32.4 29.0 28.2 27.7 Ready Mix Concrete (3.1) 1.5 2.0 5.0 5.0 Aggregates 9.2 1.6 15.0 15.0 15.0 Other Businesses 0.0 0.0 0.0 0.0 0.0 Total 32.4 29.9 27.0 26.6 25.9
Income Statement (Rpbn)
FY Dec 2013A 2014A 2015F 2016F 2017F Revenue 18,691 19,996 18,157 19,364 21,026 Cost of Goods Sold (10,037) (10,910) (10,160) (10,897) (11,954) Gross Profit 8,655 9,087 7,997 8,467 9,073 Other Opng (Exp)/Inc (2,680) (3,233) (3,092) (3,326) (3,623) Operating Profit 5,975 5,854 4,906 5,142 5,450 Other Non Opg (Exp)/Inc 89.0 121 100 130 162 Associates & JV Inc 18.0 24.0 25.0 26.0 28.0 Net Interest (Exp)/Inc 513 790 664 488 471 Exceptional Gain/(Loss) 0.0 0.0 0.0 0.0 0.0 Pre-tax Profit 6,595 6,790 5,695 5,786 6,110 Tax (1,583) (1,516) (1,310) (1,331) (1,405) Minority Interest (2.0) (3.0) 0.0 0.0 0.0 Preference Dividend 0.0 0.0 0.0 0.0 0.0 Net Profit 5,010 5,271 4,385 4,455 4,705 Net Profit before Except. 5,010 5,271 4,385 4,455 4,705 EBITDA 6,785 6,732 5,795 6,091 6,480 Growth Revenue Gth (%) 8.1 7.0 (9.2) 6.6 8.6 EBITDA Gth (%) 2.5 (0.8) (13.9) 5.1 6.4 Opg Profit Gth (%) 2.2 (2.0) (16.2) 4.8 6.0 Net Profit Gth (Pre-ex) (%) 5.2 5.2 (16.8) 1.6 5.6 Margins & Ratio Gross Margins (%) 46.3 45.4 44.0 43.7 43.1 Opg Profit Margin (%) 32.0 29.3 27.0 26.6 25.9 Net Profit Margin (%) 26.8 26.4 24.2 23.0 22.4 ROAE (%) 23.7 22.1 17.9 17.9 17.8 ROA (%) 20.3 19.0 15.4 15.4 15.4 ROCE (%) 20.5 18.4 14.9 15.4 15.4 Div Payout Ratio (%) 66.1 94.3 70.0 70.0 70.0 Net Interest Cover (x) NM NM NM NM NM
Source: Company, DBS Vickers, AllianceDBS Research
Growing RMC business
Expect margins to decline further as competition intensifies

ASIAN INSIGHTS VICKERS SECURITIES Page 16
Company Guide
Indocement Tunggal P.
Quarterly / Interim Income Statement (Rpbn)
FY Dec 3Q2014 4Q2014 1Q2015 2Q2015 3Q2015 Revenue 4,668 5,829 4,328 4,547 4,011 Cost of Goods Sold (2,524) (3,090) (2,400) (2,481) (2,253) Gross Profit 2,144 2,739 1,928 2,066 1,758 Other Oper. (Exp)/Inc (786) (944) (695) (782) (629) Operating Profit 1,358 1,795 1,233 1,285 1,129 Other Non Opg (Exp)/Inc 9.00 45.0 43.0 (14.0) 16.0 Associates & JV Inc 7.00 7.00 8.00 6.00 6.00 Net Interest (Exp)/Inc 180 177 183 170 85.0 Exceptional Gain/(Loss) 0.0 0.0 0.0 0.0 0.0 Pre-tax Profit 1,554 2,025 1,466 1,447 1,236 Tax (348) (470) (320) (337) (273) Minority Interest 0.0 0.0 0.0 0.0 0.0 Net Profit 1,206 1,555 1,146 1,110 963 Net profit bef Except. 1,206 1,555 1,146 1,110 963 EBITDA 1,571 2,026 1,465 1,746 1,822 Growth Revenue Gth (%) (6.6) 24.9 (25.8) 5.1 (11.8) EBITDA Gth (%) (6.7) 29.0 (27.7) 19.2 4.3 Opg Profit Gth (%) (7.0) 32.2 (31.3) 4.2 (12.1) Net Profit Gth (Pre-ex) (%) (12.6) 28.9 (26.3) (3.2) (13.2) Margins Gross Margins (%) 45.9 47.0 44.5 45.4 43.8 Opg Profit Margins (%) 29.1 30.8 28.5 28.3 28.1 Net Profit Margins (%) 25.8 26.7 26.5 24.4 24.0
Balance Sheet (Rpbn)
FY Dec 2013A 2014A 2015F 2016F 2017F Net Fixed Assets 9,305 12,144 14,754 16,305 18,275 Invts in Associates & JVs 0.0 0.0 0.0 0.0 0.0 Other LT Assets 456 655 655 655 655 Cash & ST Invts 12,595 11,256 8,284 8,001 7,449 Inventory 1,474 1,666 1,551 1,664 1,825 Debtors 2,519 2,671 2,425 2,587 2,809 Other Current Assets 259 494 463 497 544 Total Assets 26,607 28,885 28,132 29,707 31,556 ST Debt 0.0 0.0 0.0 0.0 0.0 Creditor 1,375 1,695 1,592 1,709 1,870 Other Current Liab 1,365 1,565 1,499 1,571 1,672 LT Debt 93.0 76.0 76.0 76.0 76.0 Other LT Liabilities 797 764 764 764 764 Shareholder’s Equity 22,947 24,785 24,202 25,588 27,174 Minority Interests 30.0 0.0 0.0 0.0 0.0 Total Cap. & Liab. 26,607 28,885 28,132 29,707 31,556 Non-Cash Wkg. Capital 1,511 1,570 1,349 1,467 1,635 Net Cash/(Debt) 12,502 11,180 8,208 7,925 7,373 Debtors Turn (avg days) 48.6 47.4 51.2 47.2 46.8 Creditors Turn (avg days) 53.5 55.9 64.7 60.5 59.8 Inventory Turn (avg days) 58.2 57.1 63.3 59.0 58.3 Asset Turnover (x) 0.8 0.7 0.6 0.7 0.7 Current Ratio (x) 6.1 4.9 4.1 3.9 3.6 Quick Ratio (x) 5.5 4.3 3.5 3.2 2.9 Net Debt/Equity (X) CASH CASH CASH CASH CASH Net Debt/Equity ex MI (X) CASH CASH CASH CASH CASH Capex to Debt (%) 2,161.0 4,476.9 4,602.1 3,287.2 3,944.6 Z-Score (X) 14.7 13.2 13.3 12.5 11.7
Source: Company, DBS Vickers, AllianceDBS Research
1Q is the seasonally weakest quarter
Near-zero debt since 2008
Strong net cash position
ASIAN INSIGHTS VICKERS SECURITIES Page 17
Company Guide
Indocement Tunggal P.
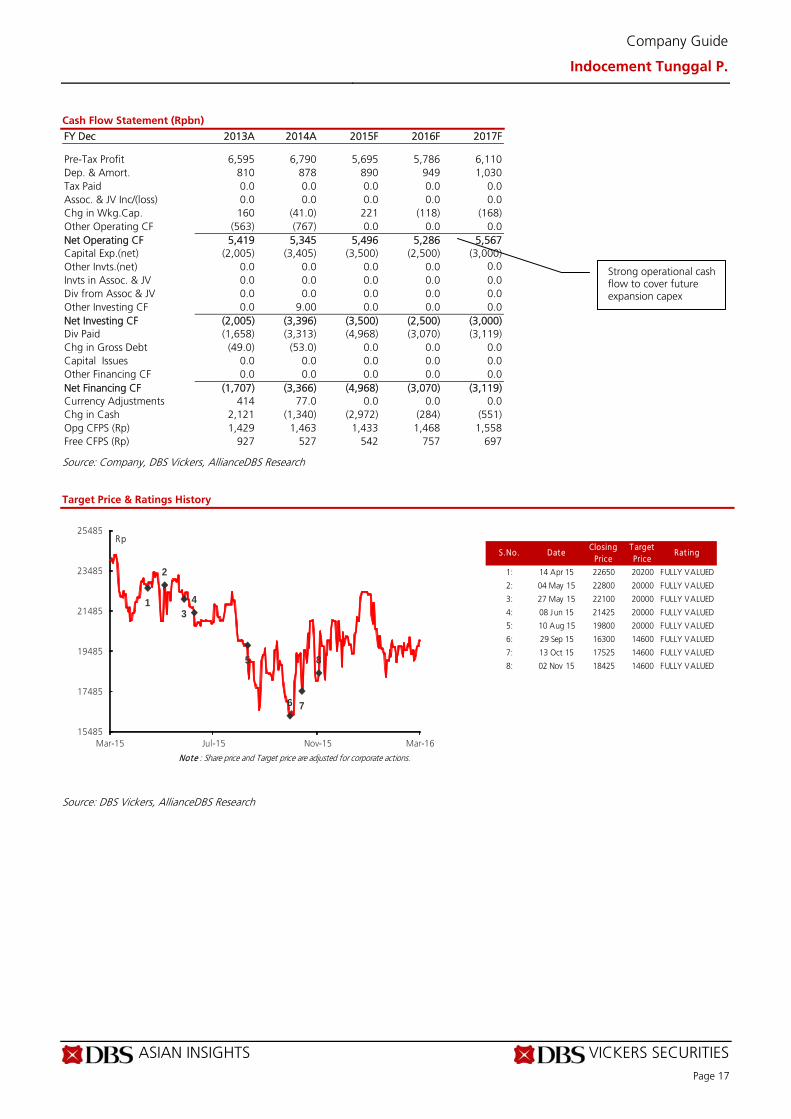
Cash Flow Statement (Rpbn)
FY Dec 2013A 2014A 2015F 2016F 2017F Pre-Tax Profit 6,595 6,790 5,695 5,786 6,110 Dep. & Amort. 810 878 890 949 1,030 Tax Paid 0.0 0.0 0.0 0.0 0.0 Assoc. & JV Inc/(loss) 0.0 0.0 0.0 0.0 0.0 Chg in Wkg.Cap. 160 (41.0) 221 (118) (168) Other Operating CF (563) (767) 0.0 0.0 0.0 Net Operating CF 5,419 5,345 5,496 5,286 5,567 Capital Exp.(net) (2,005) (3,405) (3,500) (2,500) (3,000) Other Invts.(net) 0.0 0.0 0.0 0.0 0.0 Invts in Assoc. & JV 0.0 0.0 0.0 0.0 0.0 Div from Assoc & JV 0.0 0.0 0.0 0.0 0.0 Other Investing CF 0.0 9.00 0.0 0.0 0.0 Net Investing CF (2,005) (3,396) (3,500) (2,500) (3,000) Div Paid (1,658) (3,313) (4,968) (3,070) (3,119) Chg in Gross Debt (49.0) (53.0) 0.0 0.0 0.0 Capital Issues 0.0 0.0 0.0 0.0 0.0 Other Financing CF 0.0 0.0 0.0 0.0 0.0 Net Financing CF (1,707) (3,366) (4,968) (3,070) (3,119) Currency Adjustments 414 77.0 0.0 0.0 0.0 Chg in Cash 2,121 (1,340) (2,972) (284) (551) Opg CFPS (Rp) 1,429 1,463 1,433 1,468 1,558 Free CFPS (Rp) 927 527 542 757 697
Source: Company, DBS Vickers, AllianceDBS Research
Target Price & Ratings History
Source: DBS Vickers, AllianceDBS Research
S.No. DateClosing
PriceT arget Price
Rat ing
1: 14 Apr 15 22650 20200 FULLY VALUED
2: 04 May 15 22800 20000 FULLY VALUED
3: 27 May 15 22100 20000 FULLY VALUED
4: 08 Jun 15 21425 20000 FULLY VALUED
5: 10 Aug 15 19800 20000 FULLY VALUED
6: 29 Sep 15 16300 14600 FULLY VALUED
7: 13 Oct 15 17525 14600 FULLY VALUED
8: 02 Nov 15 18425 14600 FULLY VALUED
Note : Share price and Target price are adjusted for corporate actions.
1
2
3
4
5
6 7
8
15485
17485
19485
21485
23485
25485
Mar-15 Jul-15 Nov-15 Mar-16
Rp
Strong operational cash flow to cover future expansion capex
ASIAN INSIGHTS VICKERS SECURITIES ed: TH / sa: MA
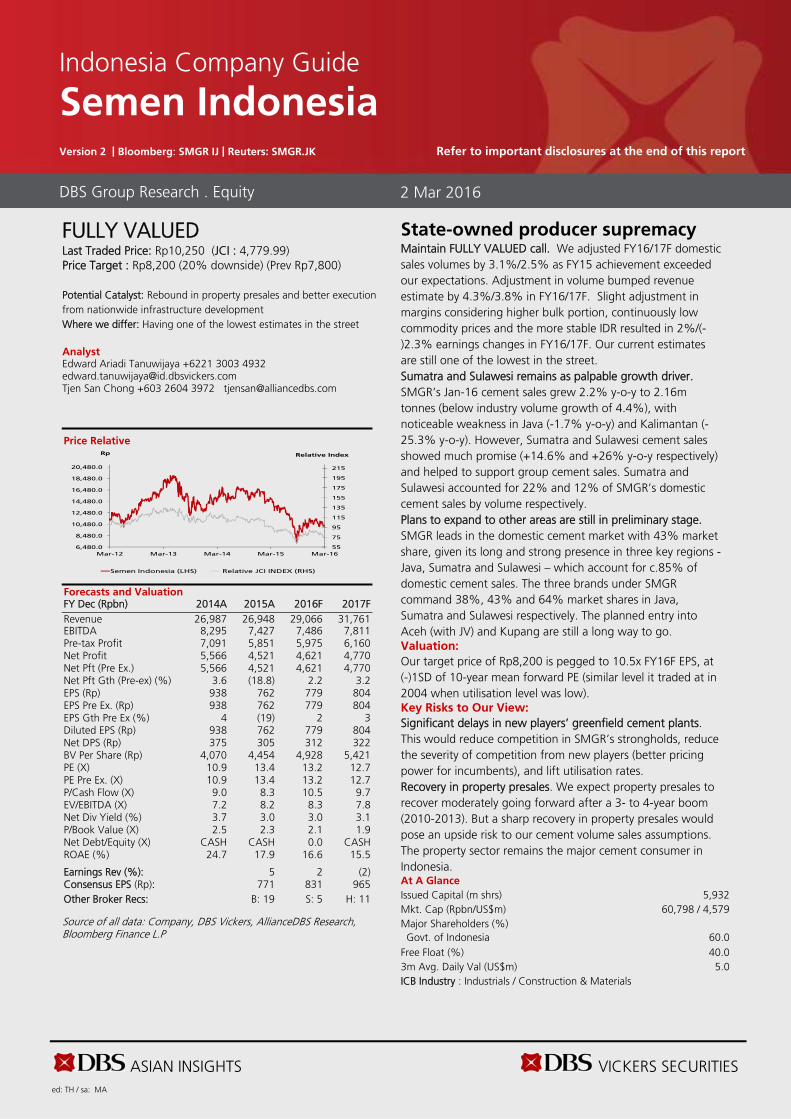
FULLY VALUED Last Traded Price: Rp10,250 (JCI : 4,779.99) Price Target : Rp8,200 (20% downside) (Prev Rp7,800) Potential Catalyst: Rebound in property presales and better execution from nationwide infrastructure development Where we differ: Having one of the lowest estimates in the street
Analyst Edward Ariadi Tanuwijaya +6221 3003 4932 [email protected] Tjen San Chong +603 2604 3972 [email protected]
Price Relative
Forecasts and Valuation FY Dec (Rpbn) 2014A 2015A 2016F 2017F Revenue 26,987 26,948 29,066 31,761 EBITDA 8,295 7,427 7,486 7,811 Pre-tax Profit 7,091 5,851 5,975 6,160 Net Profit 5,566 4,521 4,621 4,770 Net Pft (Pre Ex.) 5,566 4,521 4,621 4,770 Net Pft Gth (Pre-ex) (%) 3.6 (18.8) 2.2 3.2 EPS (Rp) 938 762 779 804 EPS Pre Ex. (Rp) 938 762 779 804 EPS Gth Pre Ex (%) 4 (19) 2 3 Diluted EPS (Rp) 938 762 779 804 Net DPS (Rp) 375 305 312 322 BV Per Share (Rp) 4,070 4,454 4,928 5,421 PE (X) 10.9 13.4 13.2 12.7 PE Pre Ex. (X) 10.9 13.4 13.2 12.7 P/Cash Flow (X) 9.0 8.3 10.5 9.7 EV/EBITDA (X) 7.2 8.2 8.3 7.8 Net Div Yield (%) 3.7 3.0 3.0 3.1 P/Book Value (X) 2.5 2.3 2.1 1.9 Net Debt/Equity (X) CASH CASH 0.0 CASH ROAE (%) 24.7 17.9 16.6 15.5 Earnings Rev (%): 5 2 (2) Consensus EPS (Rp): 771 831 965 Other Broker Recs: B: 19 S: 5 H: 11
Source of all data: Company, DBS Vickers, AllianceDBS Research, Bloomberg Finance L.P
State-owned producer supremacy Maintain FULLY VALUED call. We adjusted FY16/17F domestic sales volumes by 3.1%/2.5% as FY15 achievement exceeded our expectations. Adjustment in volume bumped revenue estimate by 4.3%/3.8% in FY16/17F. Slight adjustment in margins considering higher bulk portion, continuously low commodity prices and the more stable IDR resulted in 2%/(-)2.3% earnings changes in FY16/17F. Our current estimates are still one of the lowest in the street. Sumatra and Sulawesi remains as palpable growth driver. SMGR’s Jan-16 cement sales grew 2.2% y-o-y to 2.16m tonnes (below industry volume growth of 4.4%), with noticeable weakness in Java (-1.7% y-o-y) and Kalimantan (-25.3% y-o-y). However, Sumatra and Sulawesi cement sales showed much promise (+14.6% and +26% y-o-y respectively) and helped to support group cement sales. Sumatra and Sulawesi accounted for 22% and 12% of SMGR’s domestic cement sales by volume respectively. Plans to expand to other areas are still in preliminary stage. SMGR leads in the domestic cement market with 43% market share, given its long and strong presence in three key regions - Java, Sumatra and Sulawesi – which account for c.85% of domestic cement sales. The three brands under SMGR command 38%, 43% and 64% market shares in Java, Sumatra and Sulawesi respectively. The planned entry into Aceh (with JV) and Kupang are still a long way to go. Valuation:
Our target price of Rp8,200 is pegged to 10.5x FY16F EPS, at (-)1SD of 10-year mean forward PE (similar level it traded at in 2004 when utilisation level was low). Key Risks to Our View:
Significant delays in new players’ greenfield cement plants. This would reduce competition in SMGR’s strongholds, reduce the severity of competition from new players (better pricing power for incumbents), and lift utilisation rates. Recovery in property presales. We expect property presales to recover moderately going forward after a 3- to 4-year boom (2010-2013). But a sharp recovery in property presales would pose an upside risk to our cement volume sales assumptions. The property sector remains the major cement consumer in Indonesia. At A Glance Issued Capital (m shrs) 5,932 Mkt. Cap (Rpbn/US$m) 60,798 / 4,579 Major Shareholders (%) Govt. of Indonesia 60.0
Free Float (%) 40.0 3m Avg. Daily Val (US$m) 5.0 ICB Industry : Industrials / Construction & Materials
DBS Group Research . Equity 2 Mar 2016
Indonesia Company Guide
Semen Indonesia Version 2 | Bloomberg: SMGR IJ | Reuters: SMGR.JK Refer to important disclosures at the end of this report
55
75
95
115
135
155
175
195
215
6,480.0
8,480.0
10,480.0
12,480.0
14,480.0
16,480.0
18,480.0
20,480.0
Mar-12 Mar-13 Mar-14 Mar-15 Mar-16
Relative IndexRp
Semen Indonesia (LHS) Relative JCI INDEX (RHS)
ASIAN INSIGHTS VICKERS SECURITIES Page 19
Company Guide
Semen Indonesia
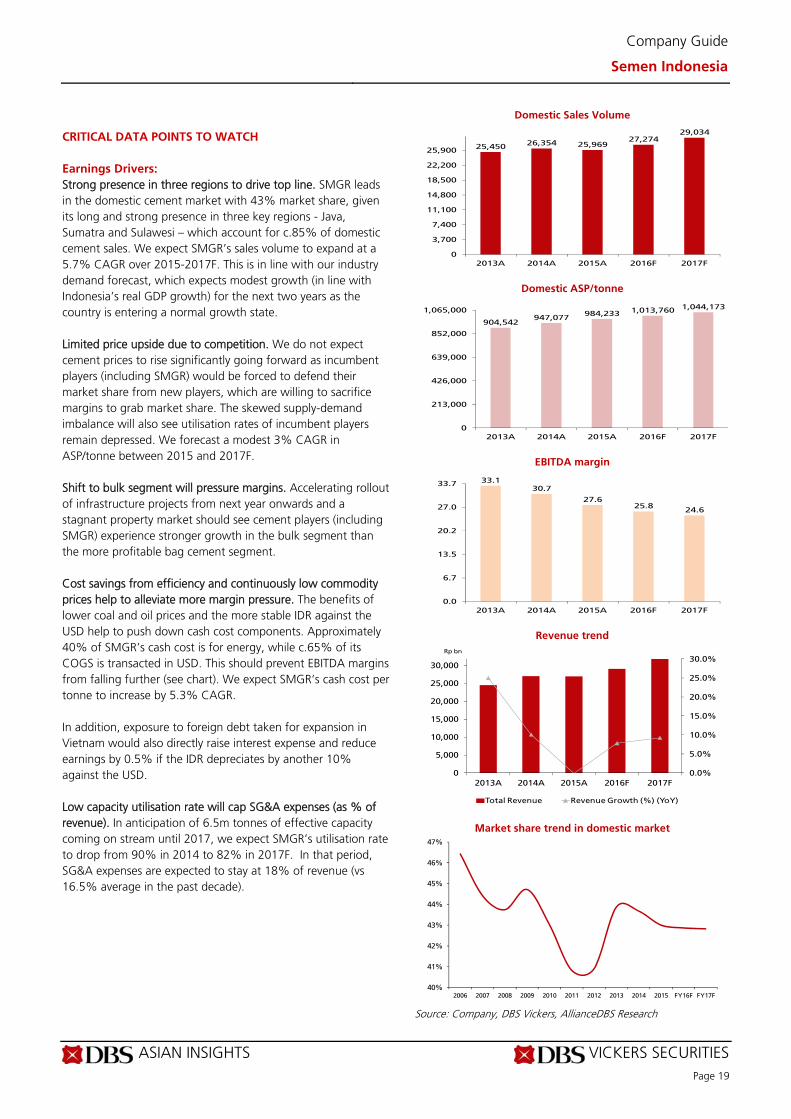
CRITICAL DATA POINTS TO WATCH
Earnings Drivers:
Strong presence in three regions to drive top line. SMGR leads in the domestic cement market with 43% market share, given its long and strong presence in three key regions - Java, Sumatra and Sulawesi – which account for c.85% of domestic cement sales. We expect SMGR’s sales volume to expand at a 5.7% CAGR over 2015-2017F. This is in line with our industry demand forecast, which expects modest growth (in line with Indonesia’s real GDP growth) for the next two years as the country is entering a normal growth state. Limited price upside due to competition. We do not expect cement prices to rise significantly going forward as incumbent players (including SMGR) would be forced to defend their market share from new players, which are willing to sacrifice margins to grab market share. The skewed supply-demand imbalance will also see utilisation rates of incumbent players remain depressed. We forecast a modest 3% CAGR in ASP/tonne between 2015 and 2017F. Shift to bulk segment will pressure margins. Accelerating rollout of infrastructure projects from next year onwards and a stagnant property market should see cement players (including SMGR) experience stronger growth in the bulk segment than the more profitable bag cement segment. Cost savings from efficiency and continuously low commodity prices help to alleviate more margin pressure. The benefits of lower coal and oil prices and the more stable IDR against the USD help to push down cash cost components. Approximately 40% of SMGR’s cash cost is for energy, while c.65% of its COGS is transacted in USD. This should prevent EBITDA margins from falling further (see chart). We expect SMGR’s cash cost per tonne to increase by 5.3% CAGR. In addition, exposure to foreign debt taken for expansion in Vietnam would also directly raise interest expense and reduce earnings by 0.5% if the IDR depreciates by another 10% against the USD. Low capacity utilisation rate will cap SG&A expenses (as % of revenue). In anticipation of 6.5m tonnes of effective capacity coming on stream until 2017, we expect SMGR’s utilisation rate to drop from 90% in 2014 to 82% in 2017F. In that period, SG&A expenses are expected to stay at 18% of revenue (vs 16.5% average in the past decade).
Domestic Sales Volume
Domestic ASP/tonne
EBITDA margin
Revenue trend
Market share trend in domestic market
Source: Company, DBS Vickers, AllianceDBS Research
25,45026,354 25,969
27,27429,034
0
3,700
7,400
11,100
14,800
18,500
22,200
25,900
2013A 2014A 2015A 2016F 2017F
904,542947,077
984,233 1,013,760 1,044,173
0
213,000
426,000
639,000
852,000
1,065,000
2013A 2014A 2015A 2016F 2017F
33.130.7
27.625.8
24.6
0.0
6.7
13.5
20.2
27.0
33.7
2013A 2014A 2015A 2016F 2017F
0.0%
5.0%
10.0%
15.0%
20.0%
25.0%
30.0%
0
5,000
10,000
15,000
20,000
25,000
30,000
2013A 2014A 2015A 2016F 2017F
Rp bn
Total Revenue Revenue Growth (%) (YoY)
40%
41%
42%
43%
44%
45%
46%
47%
2006 2007 2008 2009 2010 2011 2012 2013 2014 2015 FY16F FY17F
ASIAN INSIGHTS VICKERS SECURITIES Page 20
Company Guide
Semen Indonesia
Balance Sheet:
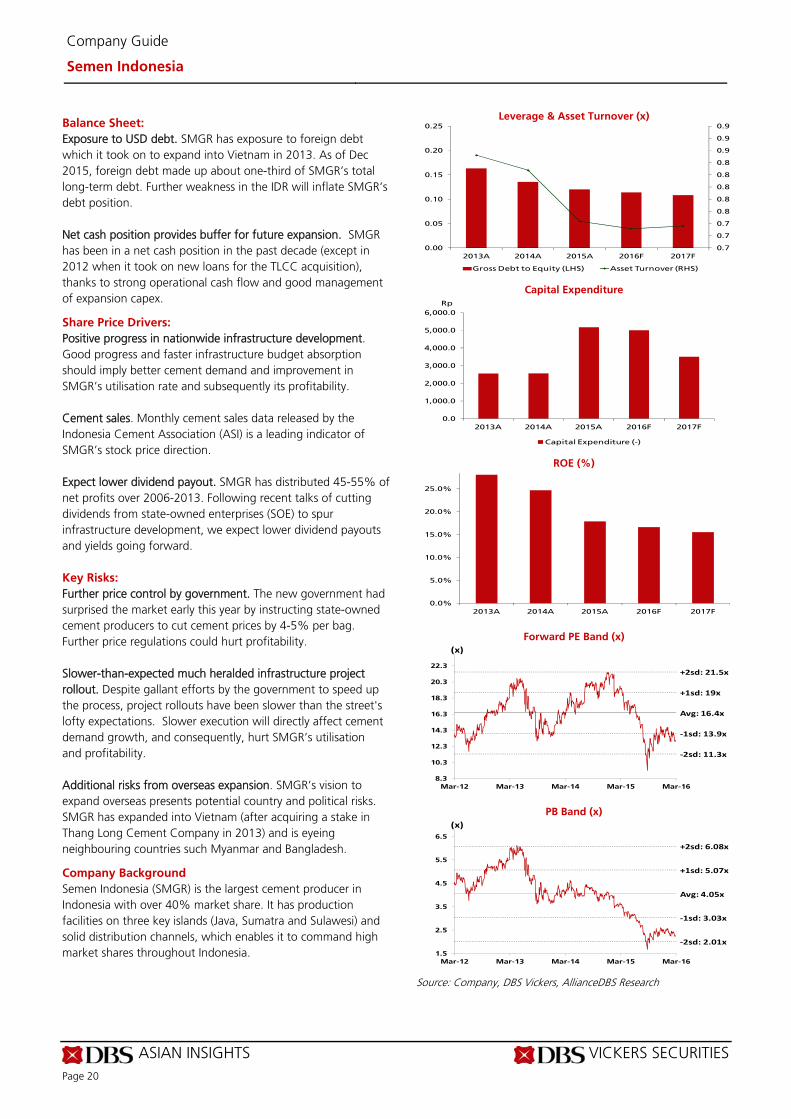
Exposure to USD debt. SMGR has exposure to foreign debt which it took on to expand into Vietnam in 2013. As of Dec 2015, foreign debt made up about one-third of SMGR’s total long-term debt. Further weakness in the IDR will inflate SMGR’s debt position. Net cash position provides buffer for future expansion. SMGR has been in a net cash position in the past decade (except in 2012 when it took on new loans for the TLCC acquisition), thanks to strong operational cash flow and good management of expansion capex.
Share Price Drivers:
Positive progress in nationwide infrastructure development. Good progress and faster infrastructure budget absorption should imply better cement demand and improvement in SMGR’s utilisation rate and subsequently its profitability. Cement sales. Monthly cement sales data released by the Indonesia Cement Association (ASI) is a leading indicator of SMGR’s stock price direction. Expect lower dividend payout. SMGR has distributed 45-55% of net profits over 2006-2013. Following recent talks of cutting dividends from state-owned enterprises (SOE) to spur infrastructure development, we expect lower dividend payouts and yields going forward.
Key Risks:
Further price control by government. The new government had surprised the market early this year by instructing state-owned cement producers to cut cement prices by 4-5% per bag. Further price regulations could hurt profitability. Slower-than-expected much heralded infrastructure project rollout. Despite gallant efforts by the government to speed up the process, project rollouts have been slower than the street's lofty expectations. Slower execution will directly affect cement demand growth, and consequently, hurt SMGR’s utilisation and profitability. Additional risks from overseas expansion. SMGR’s vision to expand overseas presents potential country and political risks. SMGR has expanded into Vietnam (after acquiring a stake in Thang Long Cement Company in 2013) and is eyeing neighbouring countries such Myanmar and Bangladesh.
Company Background
Semen Indonesia (SMGR) is the largest cement producer in Indonesia with over 40% market share. It has production facilities on three key islands (Java, Sumatra and Sulawesi) and solid distribution channels, which enables it to command high market shares throughout Indonesia.
Leverage & Asset Turnover (x)
Capital Expenditure
ROE (%)
Forward PE Band (x)
PB Band (x)
Source: Company, DBS Vickers, AllianceDBS Research
0.7
0.7
0.7
0.8
0.8
0.8
0.8
0.8
0.9
0.9
0.9
0.00
0.05
0.10
0.15
0.20
0.25
2013A 2014A 2015A 2016F 2017F
Gross Debt to Equity (LHS) Asset Turnover (RHS)
0.0
1,000.0
2,000.0
3,000.0
4,000.0
5,000.0
6,000.0
2013A 2014A 2015A 2016F 2017F
Capital Expenditure (-)
Rp
0.0%
5.0%
10.0%
15.0%
20.0%
25.0%
2013A 2014A 2015A 2016F 2017F
Avg: 16.4x
+1sd: 19x
+2sd: 21.5x
‐1sd: 13.9x
‐2sd: 11.3x
8.3
10.3
12.3
14.3
16.3
18.3
20.3
22.3
Mar-12 Mar-13 Mar-14 Mar-15 Mar-16
(x)
Avg: 4.05x
+1sd: 5.07x
+2sd: 6.08x
‐1sd: 3.03x
‐2sd: 2.01x
1.5
2.5
3.5
4.5
5.5
6.5
Mar-12 Mar-13 Mar-14 Mar-15 Mar-16
(x)
ASIAN INSIGHTS VICKERS SECURITIES Page 21
Company Guide
Semen Indonesia
Key Assumptions
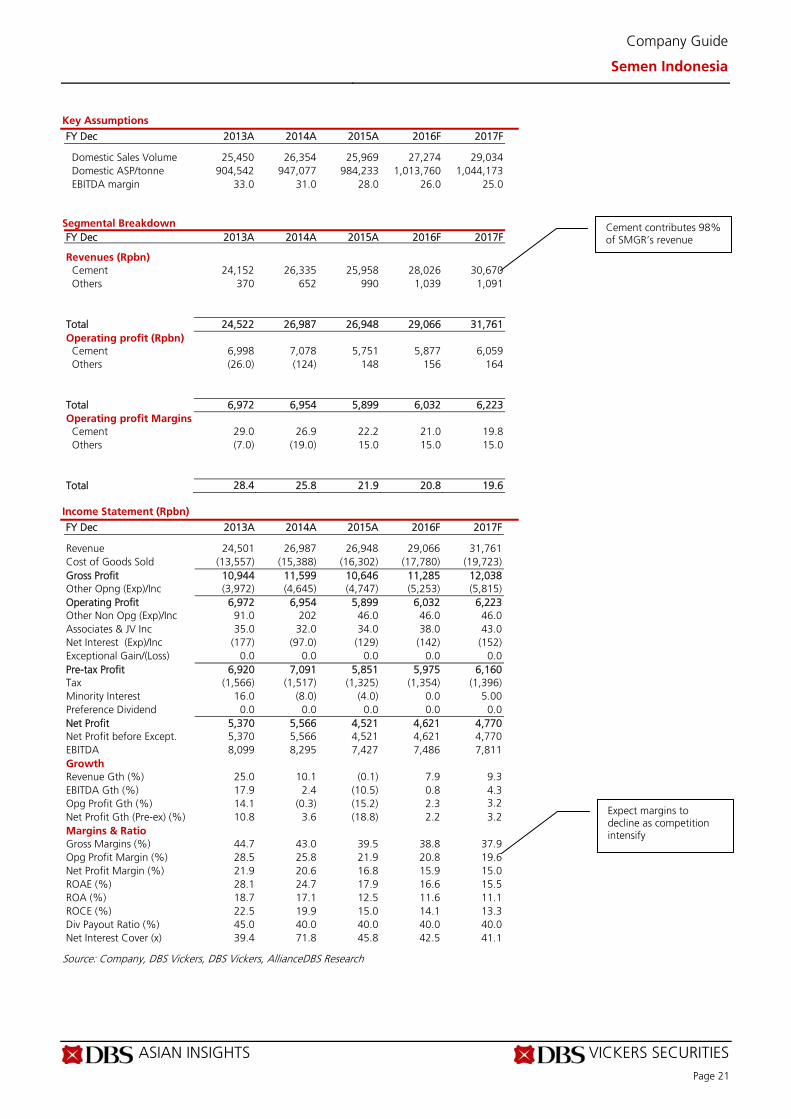
FY Dec 2013A 2014A 2015A 2016F 2017F Domestic Sales Volume 25,450 26,354 25,969 27,274 29,034 Domestic ASP/tonne 904,542 947,077 984,233 1,013,760 1,044,173 EBITDA margin 33.0 31.0 28.0 26.0 25.0
Segmental Breakdown
FY Dec 2013A 2014A 2015A 2016F 2017F Revenues (Rpbn) Cement 24,152 26,335 25,958 28,026 30,670 Others 370 652 990 1,039 1,091 Total 24,522 26,987 26,948 29,066 31,761 Operating profit (Rpbn)
Cement 6,998 7,078 5,751 5,877 6,059 Others (26.0) (124) 148 156 164 Total 6,972 6,954 5,899 6,032 6,223 Operating profit Margins
Cement 29.0 26.9 22.2 21.0 19.8 Others (7.0) (19.0) 15.0 15.0 15.0 Total 28.4 25.8 21.9 20.8 19.6
Income Statement (Rpbn)
FY Dec 2013A 2014A 2015A 2016F 2017F Revenue 24,501 26,987 26,948 29,066 31,761 Cost of Goods Sold (13,557) (15,388) (16,302) (17,780) (19,723) Gross Profit 10,944 11,599 10,646 11,285 12,038 Other Opng (Exp)/Inc (3,972) (4,645) (4,747) (5,253) (5,815) Operating Profit 6,972 6,954 5,899 6,032 6,223 Other Non Opg (Exp)/Inc 91.0 202 46.0 46.0 46.0 Associates & JV Inc 35.0 32.0 34.0 38.0 43.0 Net Interest (Exp)/Inc (177) (97.0) (129) (142) (152) Exceptional Gain/(Loss) 0.0 0.0 0.0 0.0 0.0 Pre-tax Profit 6,920 7,091 5,851 5,975 6,160 Tax (1,566) (1,517) (1,325) (1,354) (1,396) Minority Interest 16.0 (8.0) (4.0) 0.0 5.00 Preference Dividend 0.0 0.0 0.0 0.0 0.0 Net Profit 5,370 5,566 4,521 4,621 4,770 Net Profit before Except. 5,370 5,566 4,521 4,621 4,770 EBITDA 8,099 8,295 7,427 7,486 7,811 Growth Revenue Gth (%) 25.0 10.1 (0.1) 7.9 9.3 EBITDA Gth (%) 17.9 2.4 (10.5) 0.8 4.3 Opg Profit Gth (%) 14.1 (0.3) (15.2) 2.3 3.2 Net Profit Gth (Pre-ex) (%) 10.8 3.6 (18.8) 2.2 3.2 Margins & Ratio Gross Margins (%) 44.7 43.0 39.5 38.8 37.9 Opg Profit Margin (%) 28.5 25.8 21.9 20.8 19.6 Net Profit Margin (%) 21.9 20.6 16.8 15.9 15.0 ROAE (%) 28.1 24.7 17.9 16.6 15.5 ROA (%) 18.7 17.1 12.5 11.6 11.1 ROCE (%) 22.5 19.9 15.0 14.1 13.3 Div Payout Ratio (%) 45.0 40.0 40.0 40.0 40.0 Net Interest Cover (x) 39.4 71.8 45.8 42.5 41.1
Source: Company, DBS Vickers, DBS Vickers, AllianceDBS Research
Cement contributes 98% of SMGR’s revenue
Expect margins to decline as competition intensify
ASIAN INSIGHTS VICKERS SECURITIES Page 22
Company Guide
Semen Indonesia
Quarterly / Interim Income Statement (Rpbn)
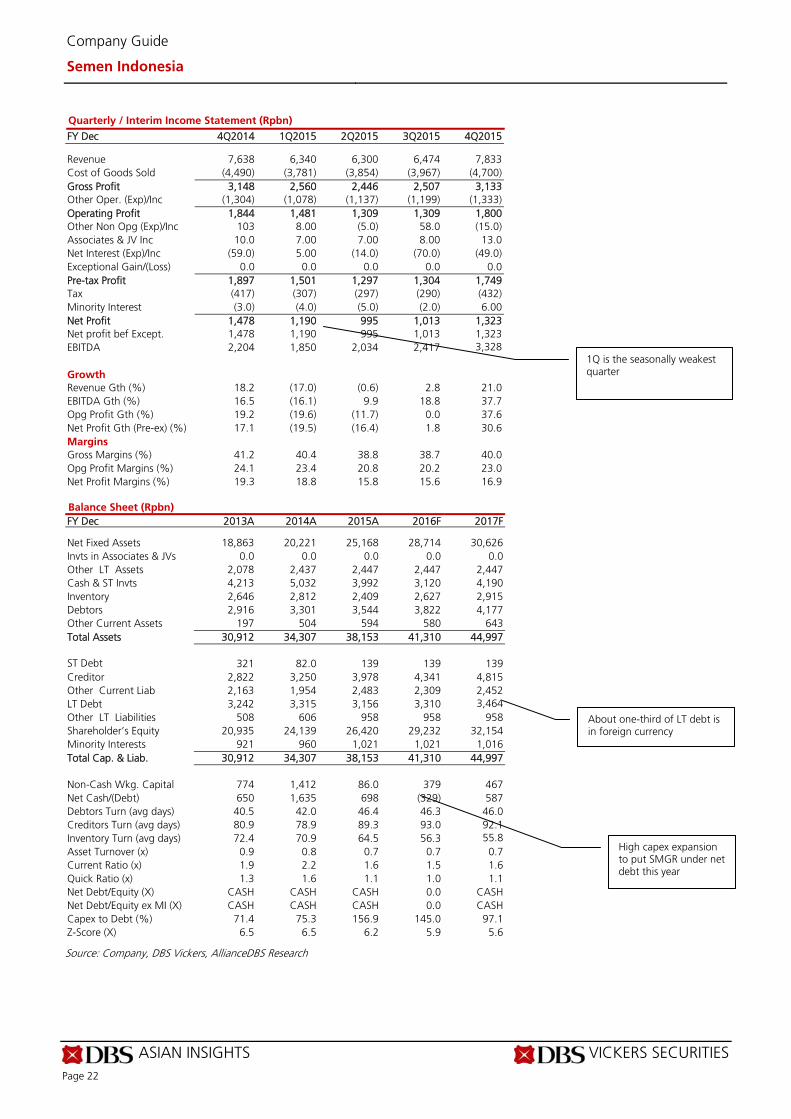
FY Dec 4Q2014 1Q2015 2Q2015 3Q2015 4Q2015 Revenue 7,638 6,340 6,300 6,474 7,833 Cost of Goods Sold (4,490) (3,781) (3,854) (3,967) (4,700) Gross Profit 3,148 2,560 2,446 2,507 3,133 Other Oper. (Exp)/Inc (1,304) (1,078) (1,137) (1,199) (1,333) Operating Profit 1,844 1,481 1,309 1,309 1,800 Other Non Opg (Exp)/Inc 103 8.00 (5.0) 58.0 (15.0) Associates & JV Inc 10.0 7.00 7.00 8.00 13.0 Net Interest (Exp)/Inc (59.0) 5.00 (14.0) (70.0) (49.0) Exceptional Gain/(Loss) 0.0 0.0 0.0 0.0 0.0 Pre-tax Profit 1,897 1,501 1,297 1,304 1,749 Tax (417) (307) (297) (290) (432) Minority Interest (3.0) (4.0) (5.0) (2.0) 6.00 Net Profit 1,478 1,190 995 1,013 1,323 Net profit bef Except. 1,478 1,190 995 1,013 1,323 EBITDA 2,204 1,850 2,034 2,417 3,328 Growth Revenue Gth (%) 18.2 (17.0) (0.6) 2.8 21.0 EBITDA Gth (%) 16.5 (16.1) 9.9 18.8 37.7 Opg Profit Gth (%) 19.2 (19.6) (11.7) 0.0 37.6 Net Profit Gth (Pre-ex) (%) 17.1 (19.5) (16.4) 1.8 30.6 Margins Gross Margins (%) 41.2 40.4 38.8 38.7 40.0 Opg Profit Margins (%) 24.1 23.4 20.8 20.2 23.0 Net Profit Margins (%) 19.3 18.8 15.8 15.6 16.9
Balance Sheet (Rpbn)
FY Dec 2013A 2014A 2015A 2016F 2017F Net Fixed Assets 18,863 20,221 25,168 28,714 30,626 Invts in Associates & JVs 0.0 0.0 0.0 0.0 0.0 Other LT Assets 2,078 2,437 2,447 2,447 2,447 Cash & ST Invts 4,213 5,032 3,992 3,120 4,190 Inventory 2,646 2,812 2,409 2,627 2,915 Debtors 2,916 3,301 3,544 3,822 4,177 Other Current Assets 197 504 594 580 643 Total Assets 30,912 34,307 38,153 41,310 44,997 ST Debt 321 82.0 139 139 139 Creditor 2,822 3,250 3,978 4,341 4,815 Other Current Liab 2,163 1,954 2,483 2,309 2,452 LT Debt 3,242 3,315 3,156 3,310 3,464 Other LT Liabilities 508 606 958 958 958 Shareholder’s Equity 20,935 24,139 26,420 29,232 32,154 Minority Interests 921 960 1,021 1,021 1,016 Total Cap. & Liab. 30,912 34,307 38,153 41,310 44,997 Non-Cash Wkg. Capital 774 1,412 86.0 379 467 Net Cash/(Debt) 650 1,635 698 (329) 587 Debtors Turn (avg days) 40.5 42.0 46.4 46.3 46.0 Creditors Turn (avg days) 80.9 78.9 89.3 93.0 92.1 Inventory Turn (avg days) 72.4 70.9 64.5 56.3 55.8 Asset Turnover (x) 0.9 0.8 0.7 0.7 0.7 Current Ratio (x) 1.9 2.2 1.6 1.5 1.6 Quick Ratio (x) 1.3 1.6 1.1 1.0 1.1 Net Debt/Equity (X) CASH CASH CASH 0.0 CASH Net Debt/Equity ex MI (X) CASH CASH CASH 0.0 CASH Capex to Debt (%) 71.4 75.3 156.9 145.0 97.1 Z-Score (X) 6.5 6.5 6.2 5.9 5.6
Source: Company, DBS Vickers, AllianceDBS Research
1Q is the seasonally weakest quarter
About one-third of LT debt is in foreign currency
High capex expansion to put SMGR under net debt this year
ASIAN INSIGHTS VICKERS SECURITIES Page 23
Company Guide
Semen Indonesia
Cash Flow Statement (Rpbn)
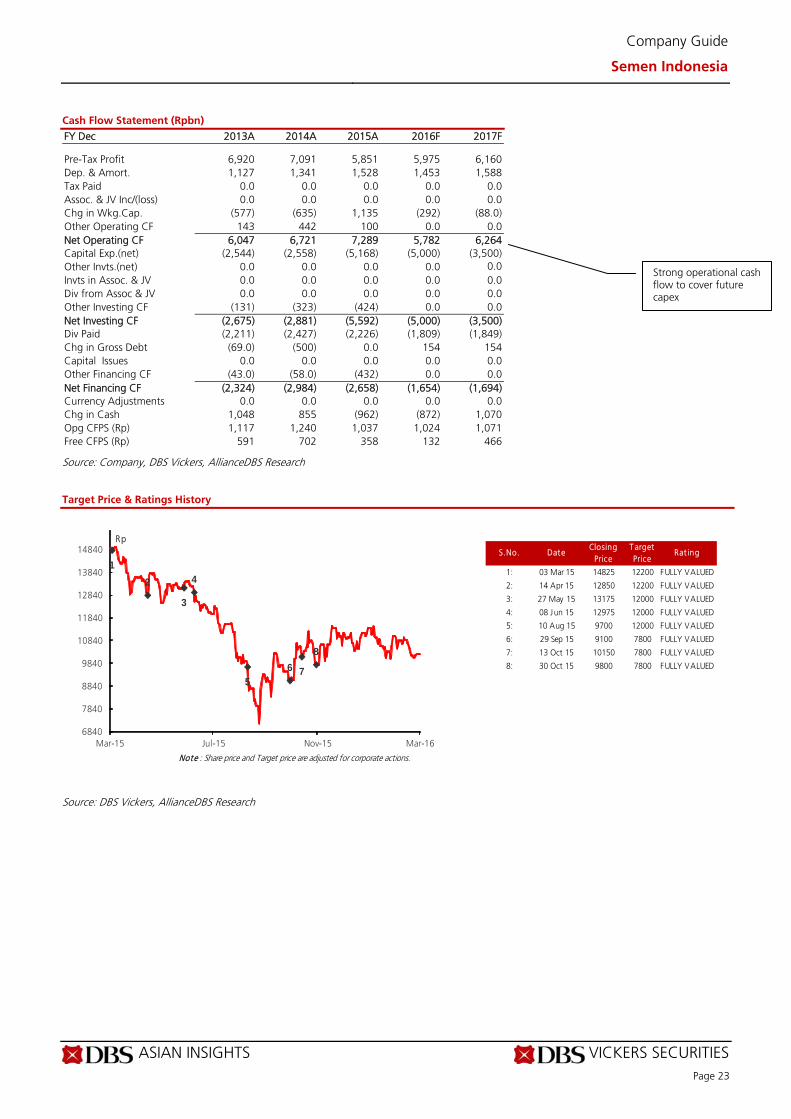
FY Dec 2013A 2014A 2015A 2016F 2017F Pre-Tax Profit 6,920 7,091 5,851 5,975 6,160 Dep. & Amort. 1,127 1,341 1,528 1,453 1,588 Tax Paid 0.0 0.0 0.0 0.0 0.0 Assoc. & JV Inc/(loss) 0.0 0.0 0.0 0.0 0.0 Chg in Wkg.Cap. (577) (635) 1,135 (292) (88.0) Other Operating CF 143 442 100 0.0 0.0 Net Operating CF 6,047 6,721 7,289 5,782 6,264 Capital Exp.(net) (2,544) (2,558) (5,168) (5,000) (3,500) Other Invts.(net) 0.0 0.0 0.0 0.0 0.0 Invts in Assoc. & JV 0.0 0.0 0.0 0.0 0.0 Div from Assoc & JV 0.0 0.0 0.0 0.0 0.0 Other Investing CF (131) (323) (424) 0.0 0.0 Net Investing CF (2,675) (2,881) (5,592) (5,000) (3,500) Div Paid (2,211) (2,427) (2,226) (1,809) (1,849) Chg in Gross Debt (69.0) (500) 0.0 154 154 Capital Issues 0.0 0.0 0.0 0.0 0.0 Other Financing CF (43.0) (58.0) (432) 0.0 0.0 Net Financing CF (2,324) (2,984) (2,658) (1,654) (1,694) Currency Adjustments 0.0 0.0 0.0 0.0 0.0 Chg in Cash 1,048 855 (962) (872) 1,070 Opg CFPS (Rp) 1,117 1,240 1,037 1,024 1,071 Free CFPS (Rp) 591 702 358 132 466
Source: Company, DBS Vickers, AllianceDBS Research
Target Price & Ratings History
Source: DBS Vickers, AllianceDBS Research
S.No. DateClosing
PriceT arget Price
Rat ing
1: 03 Mar 15 14825 12200 FULLY VALUED
2: 14 Apr 15 12850 12200 FULLY VALUED
3: 27 May 15 13175 12000 FULLY VALUED
4: 08 Jun 15 12975 12000 FULLY VALUED
5: 10 Aug 15 9700 12000 FULLY VALUED
6: 29 Sep 15 9100 7800 FULLY VALUED
7: 13 Oct 15 10150 7800 FULLY VALUED
8: 30 Oct 15 9800 7800 FULLY VALUED
Note : Share price and Target price are adjusted for corporate actions.
1
2
3
4
56 7
8
6840
7840
8840
9840
10840
11840
12840
13840
14840
Mar-15 Jul-15 Nov-15 Mar-16
Rp
Strong operational cash flow to cover future capex
Industry Focus
Indonesia Cement Sector
Page 24
DBS Vickers recommendations are based an Absolute Total Return* Rating system, defined as follows:
STRONG BUY (>20% total return over the next 3 months, with identifiable share price catalysts within this time frame)
BUY (>15% total return over the next 12 months for small caps, >10% for large caps)
HOLD (-10% to +15% total return over the next 12 months for small caps, -10% to +10% for large caps)
FULLY VALUED (negative total return i.e. > -10% over the next 12 months)
SELL (negative total return of > -20% over the next 3 months, with identifiable catalysts within this time frame)
* Share price appreciation + dividends
GENERAL DISCLOSURE/DISCLAIMER This report is prepared by PT. DBS Vickers Securities Indonesia ("DBSVI"). report is solely intended for the clients of DBS Bank Ltd and DBS Vickers Securities (Singapore) Pte Ltd, its respective connected and associated corporations and affiliates (collectively, the “DBS Vickers Group”) only and no part of this document may be (i) copied, photocopied or duplicated in any form or by any means or (ii) redistributed without the prior written consent of DBS Vickers Securities Indonesia. The research set out in this report is based on information obtained from sources believed to be reliable, but we (which collectively refers to DBS Bank Ltd., its respective connected and associated corporations, affiliates and their respective directors, officers, employees and agents (collectively, the “DBS Group”)) do not make any representation or warranty as to its accuracy, completeness or correctness. Opinions expressed are subject to change without notice. This document is prepared for general circulation. Any recommendation contained in this document does not have regard to the specific investment objectives, financial situation and the particular needs of any specific addressee. This document is for the information of addressees only and is not to be taken in substitution for the exercise of judgement by addressees, who should obtain separate independent legal or financial advice. The DBS Group accepts no liability whatsoever for any direct, indirect and/or consequential loss (including any claims for loss of profit) arising from any use of and/or reliance upon this document and/or further communication given in relation to this document. This document is not to be construed as an offer or a solicitation of an offer to buy or sell any securities. The DBS Group, along with its affiliates and/or persons associated with any of them may from time to time have interests in the securities mentioned in this document. The DBS Group may have positions in, and may effect transactions in securities mentioned herein and may also perform or seek to perform broking, investment banking and other banking services for these companies. Any valuations, opinions, estimates, forecasts, ratings or risk assessments herein constitutes a judgment as of the date of this report, and there can be no assurance that future results or events will be consistent with any such valuations, opinions, estimates, forecasts, ratings or risk assessments. The information in this document is subject to change without notice, its accuracy is not guaranteed, it may be incomplete or condensed and it may not contain all material information concerning the company (or companies) referred to in this report. The valuations, opinions, estimates, forecasts, ratings or risk assessments described in this report were based upon a number of estimates and assumptions and are inherently subject to significant uncertainties and contingencies. It can be expected that one or more of the estimates on which the valuations, opinions, estimates, forecasts, ratings or risk assessments were based will not materialize or will vary significantly from actual results. Therefore, the inclusion of the valuations, opinions, estimates, forecasts, ratings or risk assessments described herein IS NOT TO BE RELIED UPON as a representation and/or warranty by the DBS Group (and/or any persons associated with the aforesaid entities), that: (a) such valuations, opinions, estimates, forecasts, ratings or risk assessments or their underlying assumptions will be achieved, and (b) there is any assurance that future results or events will be consistent with any such valuations, opinions, estimates, forecasts, ratings or risk assessments
stated therein. Any assumptions made in this report that refers to commodities, are for the purposes of making forecasts for the company (or companies) mentioned herein. They are not to be construed as recommendations to trade in the physical commodity or in the futures contract relating to the commodity referred to in this report. DBS Vickers Securities (USA) Inc ("DBSVUSA")"), a U.S.-registered broker-dealer, does not have its own investment banking or research department, has not participated in any public offering of securities as a manager or co-manager or in any other investment banking transaction in the past twelve months and does not engage in market-making. ANALYST CERTIFICATION The research analyst(s) primarily responsible for the content of this research report, in part or in whole, certifies that the views about the companies and their securities expressed in this report accurately reflect his/her personal views. The analyst(s) also certifies that no part of his/her compensation was, is, or will be, directly, or indirectly, related to specific recommendations or views expressed in this report. As of 2 March 2016, the analyst(s) and his/her spouse and/or relatives who are financially dependent on the analyst(s), do not hold interests in the securities recommended in this report (“interest” includes direct or indirect ownership of securities).
COMPANY-SPECIFIC / REGULATORY DISCLOSURES
1. PT. DBS Vickers Securities Indonesia ("DBSVI") does not have a proprietary position in the securities recommended in this report as of 1 March 2016.
2.
Compensation for investment banking services:
DBSVUSA does not have its own investment banking or research department, nor has it participated in any public offering of securities
Industry Focus
Indonesia Cement Sector
Page 25
as a manager or co-manager or in any other investment banking transaction in the past twelve months. Any US persons wishing to obtain further information, including any clarification on disclosures in this disclaimer, or to effect a transaction in any security discussed in this document should contact DBSVUSA exclusively.
RESTRICTIONS ON DISTRIBUTION
General This report is not directed to, or intended for distribution to or use by, any person or entity who is a citizen or resident of or located in any locality, state, country or other jurisdiction where such distribution, publication, availability or use would be contrary to law or regulation.
Australia This report is being distributed in Australia by DBS Bank Ltd. (“DBS”) or DBS Vickers Securities (Singapore) Pte Ltd (“DBSVS”), both of which are exempted from the requirement to hold an Australian Financial Services Licence under the Corporation Act 2001 (“CA”) in respect of financial services provided to the recipients. Both DBS and DBSVS are regulated by the Monetary Authority of Singapore under the laws of Singapore, which differ from Australian laws. Distribution of this report is intended only for “wholesale investors” within the meaning of the CA.
Hong Kong This report is being distributed in Hong Kong by DBS Vickers (Hong Kong) Limited which is licensed and regulated by the Hong Kong Securities and Futures Commission.
Indonesia This report is being distributed in Indonesia by PT DBS Vickers Securities Indonesia.
Malaysia This report is distributed in Malaysia by AllianceDBS Research Sdn Bhd ("ADBSR"). Recipients of this report, received from ADBSR are to contact the undersigned at 603-2604 3333 in respect of any matters arising from or in connection with this report. In addition to the General Disclosure/Disclaimer found at the preceding page, recipients of this report are advised that ADBSR (the preparer of this report), its holding company Alliance Investment Bank Berhad, their respective connected and associated corporations, affiliates, their directors, officers, employees, agents and parties related or associated with any of them may have positions in, and may effect transactions in the securities mentioned herein and may also perform or seek to perform broking, investment banking/corporate advisory and other services for the subject companies. They may also have received compensation and/or seek to obtain compensation for broking, investment banking/corporate advisory and other services from the subject companies.
Wong Ming Tek, Executive Director, ADBSR
Singapore This report is distributed in Singapore by DBS Bank Ltd (Company Regn. No. 196800306E) or DBSVS (Company Regn No. 198600294G), both of which are Exempt Financial Advisers as defined in the Financial Advisers Act and regulated by the Monetary Authority of Singapore. DBS Bank Ltd and/or DBSVS, may distribute reports produced by its respective foreign entities, affiliates or other foreign research houses pursuant to an arrangement under Regulation 32C of the Financial Advisers Regulations. Where the report is distributed in Singapore to a person who is not an Accredited Investor, Expert Investor or an Institutional Investor, DBS Bank Ltd accepts legal responsibility for the contents of the report to such persons only to the extent required by law. Singapore recipients should contact DBS Bank Ltd at 6327 2288 for matters arising from, or in connection with the report.
Thailand This report is being distributed in Thailand by DBS Vickers Securities (Thailand) Co Ltd. Research reports distributed are only intended for institutional clients only and no other person may act upon it.
United Kingdom
This report is being distributed in the UK by DBS Vickers Securities (UK) Ltd, who is an authorised person in the meaning of the Financial Services and Markets Act and is regulated by The Financial Conduct Authority. Research distributed in the UK is intended only for institutional clients.
Dubai
This research report is being distributed in The Dubai International Financial Centre (“DIFC”) by DBS Bank Ltd., (DIFC Branch) having its office at PO Box 506538, 3rd Floor, Building 3, East Wing, Gate Precinct, Dubai International Financial Centre (DIFC), Dubai, United Arab Emirates. DBS Bank Ltd., (DIFC Branch) is regulated by The Dubai Financial Services Authority. This research report is intended only for professional clients (as defined in the DFSA rulebook) and no other person may act upon it.
United States This report was prepared by DBS Vickers Securities Indonesia (“DBSVI”). DBSVUSA did not participate in its preparation. The research analyst(s) named on this report are not registered as research analysts with FINRA and are not associated persons of DBSVUSA. The research analyst(s) are not subject to FINRA Rule 2241 restrictions on analyst compensation, communications with a subject company, public appearances and trading securities held by a research analyst. This report is being distributed in the United States by DBSVUSA, which accepts responsibility for its contents. This report may only be distributed to Major U.S. Institutional Investors (as defined in SEC Rule 15a-6) and to such other institutional investors and qualified persons as DBSVUSA may authorize. Any U.S. person receiving this report who wishes to effect transactions in any securities referred to herein should contact DBSVUSA directly and not its affiliate.
Other jurisdictions
In any other jurisdictions, except if otherwise restricted by laws or regulations, this report is intended only for qualified, professional, institutional or sophisticated investors as defined in the laws and regulations of such jurisdictions.
PT. DBS Vickers Securities Indonesia
DBS Bank Tower, Ciputra World 1, 32/F Jl. Prof. Dr. Satrio Kav. 3-5, Jakarta 12940, Indonesia
Tel. 6221-3003 4900, Fax: 6221-3003 4943