Embed Size (px)
Citation preview

55
Indonesia
Indonesia-9: Kali Tuntang
Indonesia-10: Jeneberang River
Nusa Tenggara

56
Introduction
The Indonesia archipelago, situated in South-east Asia, consists of five main islands (Sumatra,Kalimantan, Sulawesi, Java and Irian Jaya) and some 13,667 other smaller islands with a total area of1.9 x 106 km2. Geographically, Indonesia is located between the latitudes 6° 08' N - 11° 15' S, andlongitudes 94° 45' E - 141° 05' E. The total population according to the 1990 census was 179.4 millionwith the forecast increase at about 1.98 % per year. Population distribution is uneven throughout thecountry. Java Island has the highest population density whereas the outer islands have very much lowerdensities.
Politically, Indonesia is divided into 27 provinces, 241 districts, 55 urban municipalities, 3,625 sub-districts and 67,033 villages. Most of the rivers are short, steep and productive in sedimentation.Indonesia is a tropical country affected by tropical monsoon rainfall and has distinct dry and wetseasons. In the wet season, heavy rainfall occurs, ranging from 2,500 up to 6,000 mm/year. The dryseason is normally between July and September.
The two rivers catalogued in this volume are the Kali Tuntang located in Java Island, and theJeneberang River located in Sulawesi Island. They are representative rivers of flood, urban megalopolisconditions, industrial development and agricultural areas.
The Kali Tuntang is located in the Central Java Province, Java Island. The river leaves the lake of RawaPening to the northeast, and then changes direction to flow to the northwest before flowing out into theJava Sea on the north coast of Java. The main problem caused by the river is flooding especiallydownstream of the Glapan Weir. The water of Rawa Pening Lake is used for irrigation, hydropower,fisheries, tourism and water sport, and domestic water supply.
The Jeneberang River is located in the South Sulawesi Province, Sulawesi Island. A major reservoirand a number of small irrigation ponds have been constructed in this basin. It has a long history offlooding and provides water for agricultural and urban needs
Acknowledgements
A working group was established for the preparation of the catalogue, and a number of Institutes andindividuals collaborated. The working group, chaired by Supardijono Sobirin, Director of the ResearchInstitute for Water Resources, consisted of:
Joesron Loebis (Ass.Res.Professor), Nana Terangna Ginting (Head of Environment and Water QualityDivision), Sutjipto and Conny Amalia.
Dyah Rahayu Pangesti (Research Professor), Darjanta Budihardja, Syaifuddin (Experimental Stationfor River and Sabo)
The organizations that have contributed include:
Badan Pertanahan Nasional (National Board for Land Administration).Badan Perencanaan dan Pembangunan Daerah (Provincial Development Planning Board).Badan Meteorologi dan Geofisika (Agency for Meteorology and Geophysics).Direktorat Geologi (Directorate of Geology)Kantor Statistik Propoinsi Jawa Tengah (Central Java Provincial Office of Statistics).Proyek Induk Pengembangan Wilayah Sungai Jratunseluna (Jratunseluna River Basin DevelopmentProject).Proyek Induk Pengembangan Wilayah Sungai Jeneberang (Jeneberang River Basin DevelopmentProject).Pusat Penelitian dan Pengembangan Sumber Daya Air (Research Institute for Water Resources).

57
Indonesia―9
Kali Tuntang
Map of River
Table of Basic Data
Serial No. : Indonesia-9
Location: Java Island, Indonesia
Area: 798 km2
Origin: Mt. Merbabu (3,142 m)
Outlet: Java sea
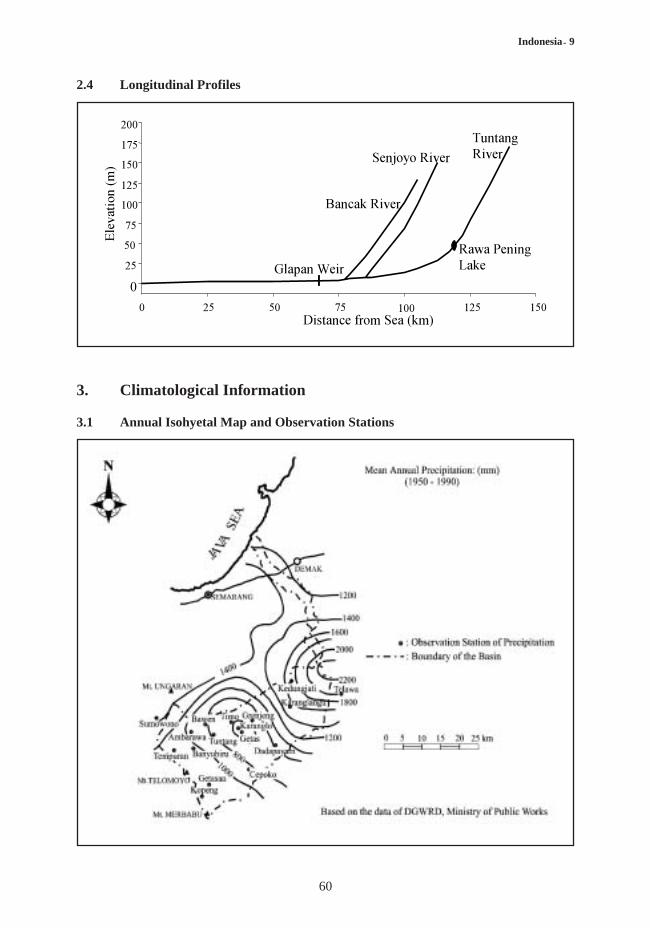
Main tributaries: Senjoyo River (120 km2), Bancak River (140 km2).
Main geological features: Alluvial, Miocene sedimentary, Plio-pleistocene sedimentary, Neogene sedimentary,Miocene- sedimentary, Holocene volcanics, Lava flows and flow breccia.
Main reservoirs: -
Main lakes: Rawa Pening
Mean annual precipitation: 2,588 mm (1917 - 1989) (basin average)
Mean annual runoff: 28.43 m3/s at Glapan (798 km2) (1953 - 1989)
Population: 738,000 (1997)
Land use: Forest (21.3%), Paddy Field (30.5%), Agriculture (37.5%), Urban (7.7%), Water surface (3.0%)(1993)
S 06° 51' 25" - 07° 26' 40"
Length of the main stream: 139 km
Highest Point: Mt. Merbabu (3,142 m)
Lowest Point: River mouth (0 m)
E 110° 15' 50" - 110° 33' 20"
Main cities: Salatiga, Ambarawa
Name(s): Tuntang River

58
Indonesia―9
1. General Description
The Tuntang River is one of the major rivers located to the east of Semarang, the capital city of CentralJava Province, and to the west of the town of Demak. The river drains the northern part of Mt. Merbabu(3,142 m), the southern part of Mt. Ungaran (2,050 m), the northern and eastern flanks of Mt.Telomoyo (1,994 m), the Rawa Pening, the hills forming the divide between the Rawa Pening and themiddle Tuntang, the hills between the Serang and Tuntang rivers and, finally, the hills dividing theTuntang and Jragung catchments. Mt. Merbabu, Mt. Ungaran, and Mt. Telomoyo are extinct volcanoes.Rawa Pening is a large natural depression fed by rivers draining Mts. Merbabu, Ungaran andTelomoyo, and by a number of springs. The only outlet from the Rawa Pening is the Tuntang riverwhich leaves to the northeast, then changes direction downstream of the Glapan Weir to flow to thenorthwest before flowing out into the Java Sea. The Glapan Weir was constructed between 1853-1859at the location where the Tuntang River enters the alluvial coastal plain. It was built for irrigation ofboth the left and right banks of river. The Tuntang River has a catchment area of 798 km2 at the GlapanWeir, including 282 km2 of the upper catchment, which drains directly into Rawa Pening. Below theGlapan Weir there are no additional inflows to the Tuntang River. The length of the river between Mt.Merbabu and the site of the Glapan Weir is approximately 70.5 km and the whole length of the TuntangRiver is about 139 km. The average annual rainfall in the basin is 2,588 mm. The basin population wasabout 738,000 in 1997.
2. Geographical Information
2.1 Geological Map

59
Indonesia―9
No.
1
Names ofRivers
Tuntang River(Main River)
Length [km]Catchment area
[km2]
139798
Highest peak [m]Lowest point [m]
Mt. Merbabu, 3,142River mouth, 0
CitiesPopulation (1997)
Ambarawa42,900
Land use[%] (1993)
A(37.5)F (21.3)L (3.0)P (30.5)U(7.7)
2Senjoyo River
(Tributary)37120
Mt. Merbabu, 3,142Confluence, 75
Salatiga104,834
3Bancak River
(Tributary)30140
-------Confluence, 50
A: Agricultural F: Forest L: Lake, river, marsh P: Paddy Field U: Urban
2.2 Land Use Map
2.3 Characteristics of the River and the Main Tributaries
60
Indonesia―9
2.4 Longitudinal Profiles
3. Climatological Information
3.1 Annual Isohyetal Map and Observation Stations

61
Indonesia―9
3.2 List of Meteorological Observation Stations
No.
1.
2.
Station
Semarang
Paras
Elevation[m]
3
23
Location
S 06° 59' 09"E 110° 19' 10"
S 07° 05' 54"E 110° 33' 20"
ObservationPeriod
1983 - 1999
1984 - 1999
Mean annualprecipitation
[mm]
2,233
2,643
Mean annualEvaporation
[mm]
1,607
1,280
Observationitems
DS, E, RH, T,WV
DS, E, RH, T,WV
3. Getas 300S 07° 16' 09"E 110° 26' 00"
1983 - 1999 2,357 1,082 DS, E, T, WV
4. Gubug 24S 07° 01' 22"E 110° 37' 10"
1983 - 1999 2,208 1,466DS, E, RH, T,
WV
T: Temperature RH: Relative Humidity E: Evaporation WV: Wind VelocityDS: Duration of Sunshine
* Average using Class A Pan
3.3 Monthly Climate Data
Station: Gubug
Observation item Jan Feb Mar Apr May Jun Jul Aug Sep Oct Nov Dec AnnualPeriod forthe mean
25.2 25.6 26.2 26.3 26.7 26.1 26.1 26.5 26.8 26.7 26.1 25.6 26.1 1983-1999
91.8 92.2 106.3 108.4 122.8 107.6 119.1 154.8 159.5 159.7 122.1 100 1,466 1983-1999
84.5 84.9 83.9 83.8 83.0 83.1 81.9 80.6 78.4 80.3 81.5 82.8 82.2 1983-1999
167 188 199 238 269 271 285 296 298 274 224 189 2,905 1983-1999
Temperature [°C]
Evaporation*
[mm]
Relative Humidity [%]
Duration ofsunshine [hr]
3.4 Long-term Variation of Monthly Precipitation

62
Indonesia―9
4. Hydrological Information
4.1 Map of Streamflow Observation Stations
4.2 List of Hydrological Observation Stations
No.
1 Glapan
Station
E 110° 04' 40"S 07° 07' 11"
Location
798
Catchment area[km2]
1952 - 1999
Observationperiod
Q
Observation items1)
(frequency)
No.
1 27.7 1,088. 500. 4.50 3.48 1.37 1952 - 1999
-Qa)
[m3/s]Qmaxb)
[m3/s]
-Qmaxc)
[m3/s]
-Qmind)
[m3/s]
-Q/A[m3/s/100km2]
Qmax/A[m3/s/km2]
Period ofstatistics
b mean annual discharge c maximum discharge d mean annual maximum dischargee mean annual minimum discharge measured over half months
1 Q: discharge

63
Indonesia―9
4.5 Unique Hydrological Features
Where the Tuntang River enters the alluvial coastal plain, the Glapan Weir was constructed during1853-1859 for irrigation of both the left and right banks of the downstream area. Below the GlapanWeir, the channel of the Tuntang River is enclosed between levees that were constructed in the periodof 1886-1890 to protect the surrounding area that had just been brought under irrigation. Due toaccretion of the channel the levees have had to be raised repeatedly over time, so that now the riverbedis higher than the surrounding area. From the Glapan Weir to the river mouth there are no additionalinflows to the river and this brings about the unusual shape of the catchment. Below the Glapan Weirthe lower the elevation of the river, the lower is the maximum discharge. Originally, the Tuntang Riverused to run through the town of Demak. To prevent the recurrent inundations of Demak, a short cut wasmade from Wonosalam to the sea at the time the levees were built. This cut, which bears the name KaliKontrak, is the present lower course of the Tuntang River. Originally a gated structure at Wonosalampermitted release of some water to the old Tuntang River (Kali Tuntang Lama). The remains of thisstructure can still be seen, although it has been closed and is partially buried under fill.
4.3 Long-term Variation of Monthly Discharge
4.4 Annual Pattern of Discharge

64
Indonesia―9
*) Instantaneous observation from a recording chart
4.6 Annual Maximum and Minimum Discharges at Glapan (798 km2)
Year
1955 11.20 414 10 7.6 1974 3.05 468 9 2.2
1958 3.13 363 10 12.3 1975 5.25 437 10 6.5
1959 7.02 425 9 7.5 1976 3.19 635 10 2.5
1960 5.29 348 9 7.7 1977 11.30 428 10 2.5
1961 5.03 477 10 2.5 1978 1.19 325 7 6.2
1962 1.21 287 10 2.5 1979 1.16 462 9 2.5
1963 1.10 635 9 6.4 1980 1.22 1,088 1 4.9
1964 2.01 308 10 4.8 1981 4.21 582 11 7.4
1965 4.09 442 9 3.2 1982 2.06 718 11 3.1
1966 2.18 356 10 3.3 1983 2.22 1,084 9 3.3
1967 1.02 323 9 3.8 1984 2.01 652 8 8.0
1968 1.02 486 10 3 1985 2.22 489 9 2.6
1969 2.18 406 11 0.2 1986 6.04 556 9 7.3
1970 4.05 287 10 2.4 1987 2.25 519 10 1.0
1971 4.11 384 9 6.9 1988 2.10 477 9 2.5
1972 12.18 420 9 6.9 1989 2.13 847 10 2.2
1973 5.29 522 10 2.7 1990 2.25 335 10 0.7
Maximum*)
Date [m3/s]
Minimum*)
Date [m3/s]Year
Maximum*)
Date [m3/s]
Minimum*)
Date [m3/s]
4.7 Hyetographs and Hydrographs of Major Floods

65
Indonesia―9
5. Water Resources
5.1 General Description
The 798 km2 catchment of the Tuntang River is 2.45 % of the land area of Central Java Province(32,544 km2). The Rawa Pening Lake has a maximum storage capacity of 65 x 106 m3 fed by 9 smallrivers and 4 springs, the most important of which are the so called Muncul springs which have a firmyield of approximately 2 m3/s. The Rawa Pening Lake is used for irrigation, hydropower, fisheries,tourism and water sport, and domestic water supply especially for the Demak District. The Jelok Weirat the outlet of Rawa Pening acts as the intake structure for the Jelok and Timo power stations. Fromthe Jelok Weir, the water is diverted nearly 3 km to the Jelok power station via a 15 m3/s waterway(mostly in tunnels). The 21 MW Jelok power station was built in 1938, while the 12 MW Timo powerstation was built in 1963. The Glapan Weir (approximately 60 km downstream of the Jelok Weir) wasconstructed for irrigation of 20,508 ha of paddy fields. In the tributaries, especially in the SenjoyoRiver, many small weirs have been built. A barrage is proposed approximately 500 m upstream of theGlapan Weir.
5.2 Map of Water Resources System

66
Indonesia―9
Tuntang Rawa Pening 282 65 25 A, P Natural lake
Name of river Name of lakeCatchment
Area[km2]
Maximumcapacity[106m3]
Minimumcapacity[106m3]
Purpose1) Year ofcompletion
5.3 List of Major Water Resources Facilities
Major Lakes
Others
Name of River Facilities Purpose1) Capacity Year of completion
Tuntang Glapan Weir A 20,508 ha 1859
Tuntang Jelok Weir A 279 ha 1938
Tuntang Jelok Power Station P 2,098 MW 1938
Tuntang Timo Power Station P 1,200 MW 1963
Senjoyo Senjoyo Weir A 2,356 ha
Senjoyo Grenjeng Weir A 750 ha
Senjoyo Cepoko Weir A 621 ha
Senjoyo Sucen Weir A 595 ha
Senjoyo Belon Weir A 319 ha
Senjoyo Gendor Weir A 138 ha
Senjoyo Aji Getas Weir A 119 ha
Bancak Sicangkring Weir A 273 ha
1) A: Agricultural use, P: Hydro-power.
*) Membrane Filter Methods, colonies/100ml
5.5 Water Quality
River Water Quality at Pantura Bridge
Date November 10, 1998
pH 7.6
DO [mg/l] 5.4
COD [mg/l] 6.2
Suspended Solid [mg/l] 420
Fecal coli x 104*) 5.5

67
Indonesia―9
6. Socio-Cultural Characteristics
Many people in the catchment area still conduct a traditional ceremony called “Selamatan” (meal-ceremony) connected with agricultural activities, in which they ask God’s blessing. In the non-irrigatedarea, all of the villagers still conduct this kind of selamatan, while in the irrigated area approximately50% of the inhabitants no longer conduct the ceremony. It seems that villagers in the irrigated area aremore rational than in the non-irrigated area. The religious life of the community is dominated by Islam,and spread by the famous “Wali Songo” (Nine Moslems Saint). With the influence of Islam, thetraditional ceremony has taken on a Moslem tinge and now is connected with Islam. There is a legendof Rawa Pening Lake in which a poor ugly boy namely Baru Klinting won a contest to pull out a palmleaf rib that was embedded in the earth. As soon as the boy pulled out the rib, water spurted from theearth and created the lake of Rawa Pening. The legend is still famous, especially in the Java Island.
7. References, Databooks and Bibliography
Bappeda TK.I Jawa Tengah kerjasama dengan BPN (1993): Peta Penggunaan Tanah Propinsi JawaTengah Tahun 1993.
Badan Meteorologi dan Geofisika Propinsi Jawa Tengah: Data Klimatologi.CV Java Books (1997): Periplus Travel Map, Indonesia Regional Map of Java, Scale 1:1 500,000.Directorate of Geology (1999): Regional Geological Map of Middle part of Java, Scale 1:500,000.Haskoning (1992): Tuntang-Jragung Area Studies and Design, Feasibility Study Annex A, Hydrology
and Sedimentology.Kantor Statistik Propinsi Jawa Tengah (1998): Jawa Tengah Dalam Angka 1998.Snowy Mountains Engineering Corporation (1999): Final Report on Flood Control for Tuntang-
Jragung River System.