Embed Size (px)
Citation preview
Indofood Agri Resources Ltd
CSP Program – March 2014
181 210 83
250 250 221
219 110 10
Working Draft v4
Disclaimer
2
Please note that the information is provided for you by way of information only. All the information, report and analysis were and should be taken as having been prepared for the purpose of general circulation and that none were made with regard to any specific investment objectives, financial situation and particular needs of any particular person who may receive the information, report or analysis (including yourself). Any recommendation or advice that maybe expressed in or inferred from such information, reports or analysis therefore does not take into account and may not be suitable for your investment objectives, financial situation and particular needs. You understand that you buy and/or sell and/or take any position in/or on the market, in any of the stocks, shares, products or instruments etc. based on your own decision(s). This is regardless of whether the information is analysed or not, regardless of the details or information related to price levels, support/resistance levels and any information based on technical or fundamental analysis. You understand and accept that nothing told or provided to you whether directly or indirectly is to be a basis for your decision(s) in relation to the market or your trades or transaction(s). Please see a registered trading representative or financial adviser for formal advice.
Company Overview
Section I
181 210 83
250 250 221
219 110 10
Leading Southeast Asian agribusiness company…
Financials summary (USD mn)
4
Corporate structure
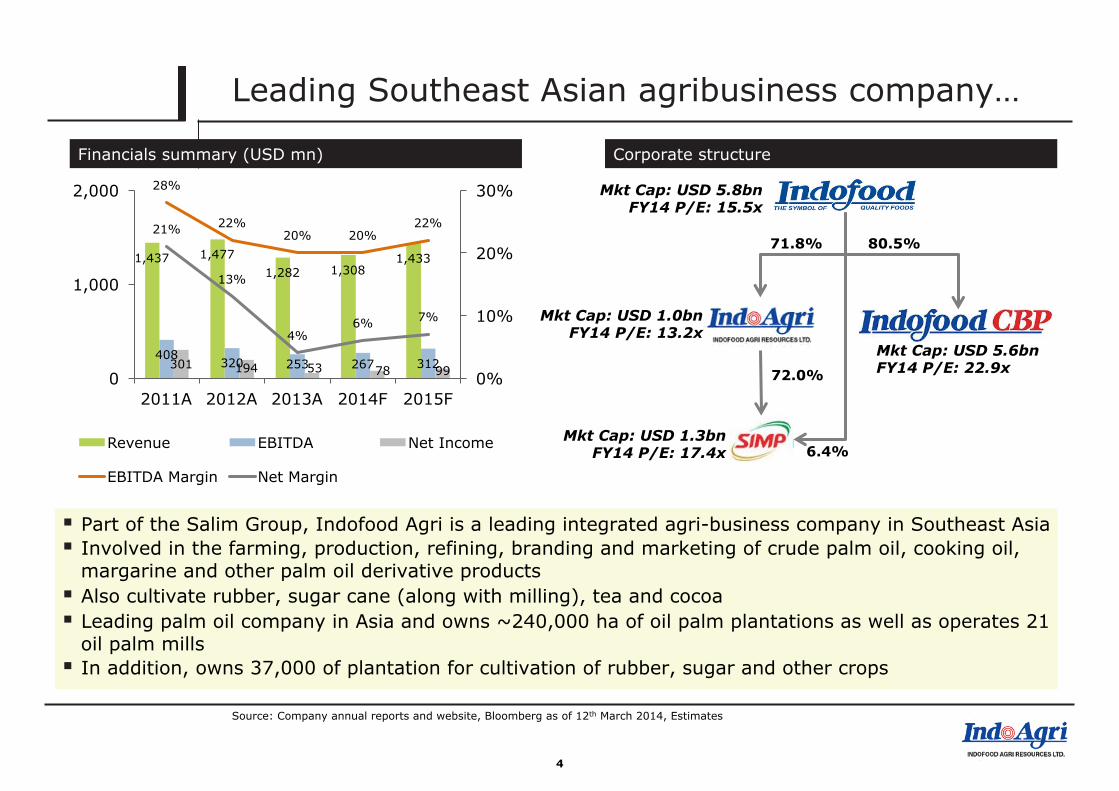
§ Part of the Salim Group, Indofood Agri is a leading integrated agri-business company in Southeast Asia § Involved in the farming, production, refining, branding and marketing of crude palm oil, cooking oil,
margarine and other palm oil derivative products § Also cultivate rubber, sugar cane (along with milling), tea and cocoa § Leading palm oil company in Asia and owns ~240,000 ha of oil palm plantations as well as operates 21
oil palm mills § In addition, owns 37,000 of plantation for cultivation of rubber, sugar and other crops
181 210 83
250 250 221
219 110 10
1,437 1,477 1,282 1,308
1,433
408 320 253 267 312 301 194 53 78 99
28%
22% 20% 20%
22% 21%
13%
4% 6% 7%
0%
10%
20%
30%
0
1,000
2,000
2011A 2012A 2013A 2014F 2015F
Revenue EBITDA Net Income
EBITDA Margin Net Margin
Source: Company annual reports and website, Bloomberg as of 12th March 2014, Estimates
6.4%
80.5% 71.8%
72.0%
Mkt Cap: USD 5.8bn FY14 P/E: 15.5x
Mkt Cap: USD 5.6bn FY14 P/E: 22.9x
Mkt Cap: USD 1.3bn FY14 P/E: 17.4x
Mkt Cap: USD 1.0bn FY14 P/E: 13.2x
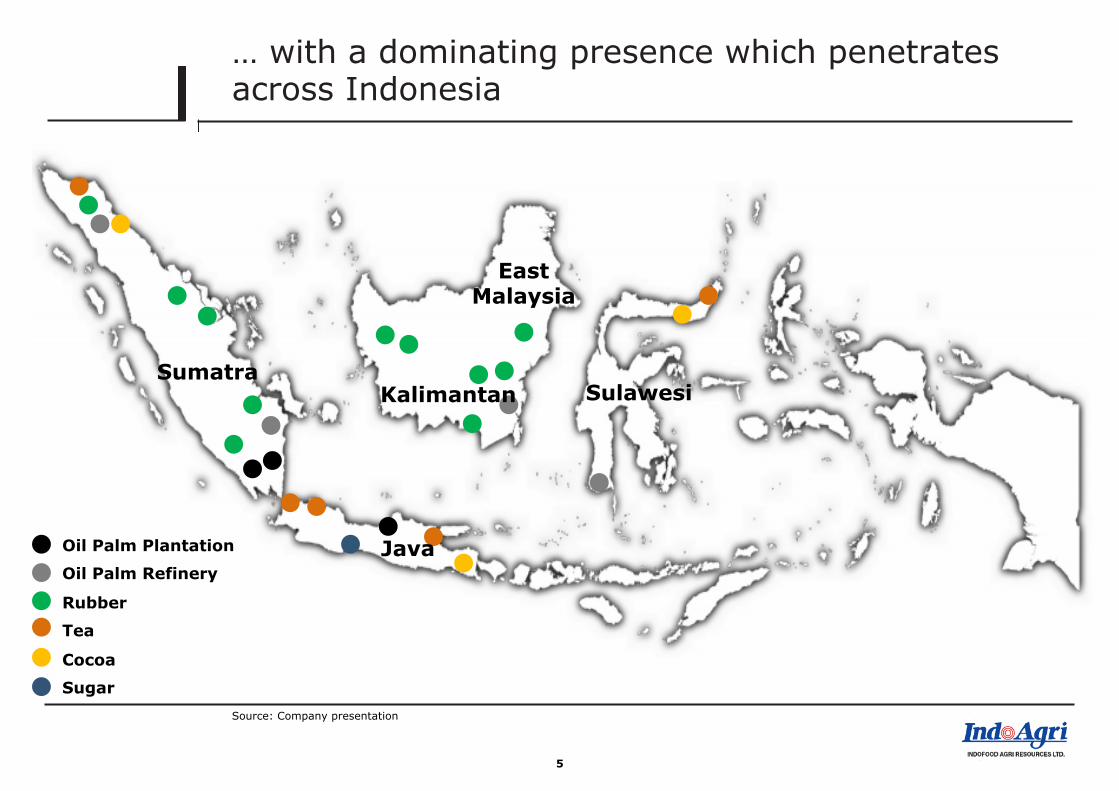
… with a dominating presence which penetrates across Indonesia
5
Source: Company presentation
Oil Palm Plantation
Oil Palm Refinery
Rubber
Tea
Cocoa
Sugar
Sumatra Kalimantan Sulawesi
Java
East Malaysia
2013
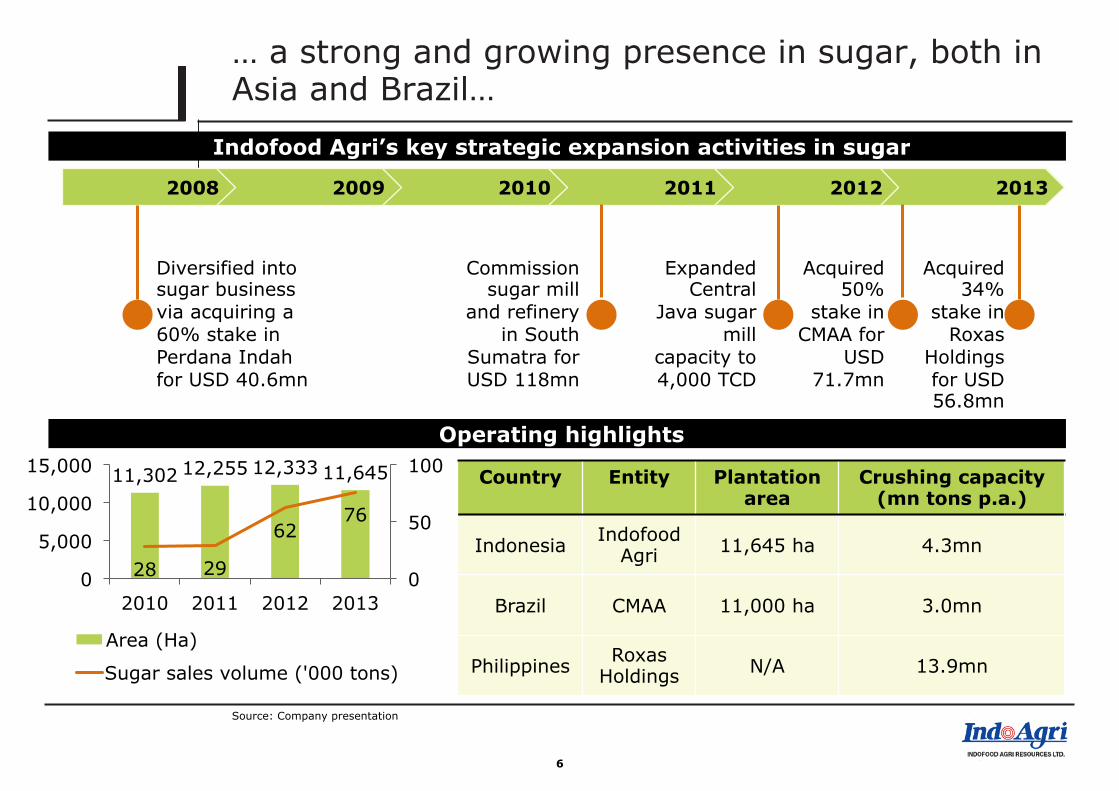
… a strong and growing presence in sugar, both in Asia and Brazil…
Indofood Agri’s key strategic expansion activities in sugar
11,302 12,255 12,333 11,645
28 29
62 76
0
50
100
0
5,000
10,000
15,000
2010 2011 2012 2013
Area (Ha)
Sugar sales volume ('000 tons)
Country Entity Plantation area
Crushing capacity (mn tons p.a.)
Indonesia Indofood Agri 11,645 ha 4.3mn
Brazil CMAA 11,000 ha 3.0mn
Philippines Roxas Holdings N/A 13.9mn
6
2012 2011 2010 2009 2008 181 210 83
250 250 221
219 110 10
Diversified into sugar business via acquiring a 60% stake in Perdana Indah for USD 40.6mn
Commission sugar mill
and refinery in South
Sumatra for USD 118mn
Expanded Central
Java sugar mill
capacity to 4,000 TCD
Acquired 50%
stake in CMAA for
USD 71.7mn
Acquired 34%
stake in Roxas
Holdings for USD 56.8mn
Operating highlights
Source: Company presentation

Industry overview
Section II
181 210 83
250 250 221
219 110 10
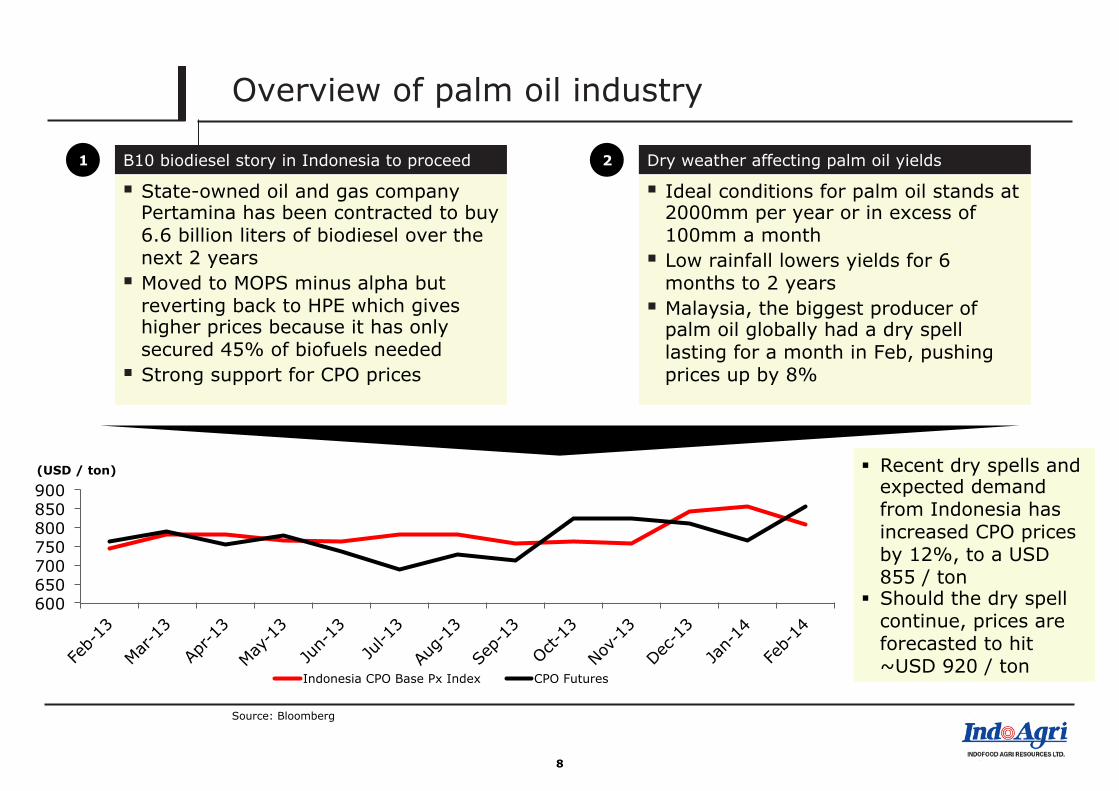
Overview of palm oil industry
§ State-owned oil and gas company Pertamina has been contracted to buy 6.6 billion liters of biodiesel over the next 2 years
§ Moved to MOPS minus alpha but reverting back to HPE which gives higher prices because it has only secured 45% of biofuels needed
§ Strong support for CPO prices
B10 biodiesel story in Indonesia to proceed
8
§ Ideal conditions for palm oil stands at 2000mm per year or in excess of 100mm a month
§ Low rainfall lowers yields for 6 months to 2 years
§ Malaysia, the biggest producer of palm oil globally had a dry spell lasting for a month in Feb, pushing prices up by 8%
Dry weather affecting palm oil yields 1 2
600 650 700 750 800 850 900 (USD / ton)
Indonesia CPO Base Px Index CPO Futures
Source: Bloomberg
§ Recent dry spells and expected demand from Indonesia has increased CPO prices by 12%, to a USD 855 / ton
§ Should the dry spell continue, prices are forecasted to hit ~USD 920 / ton
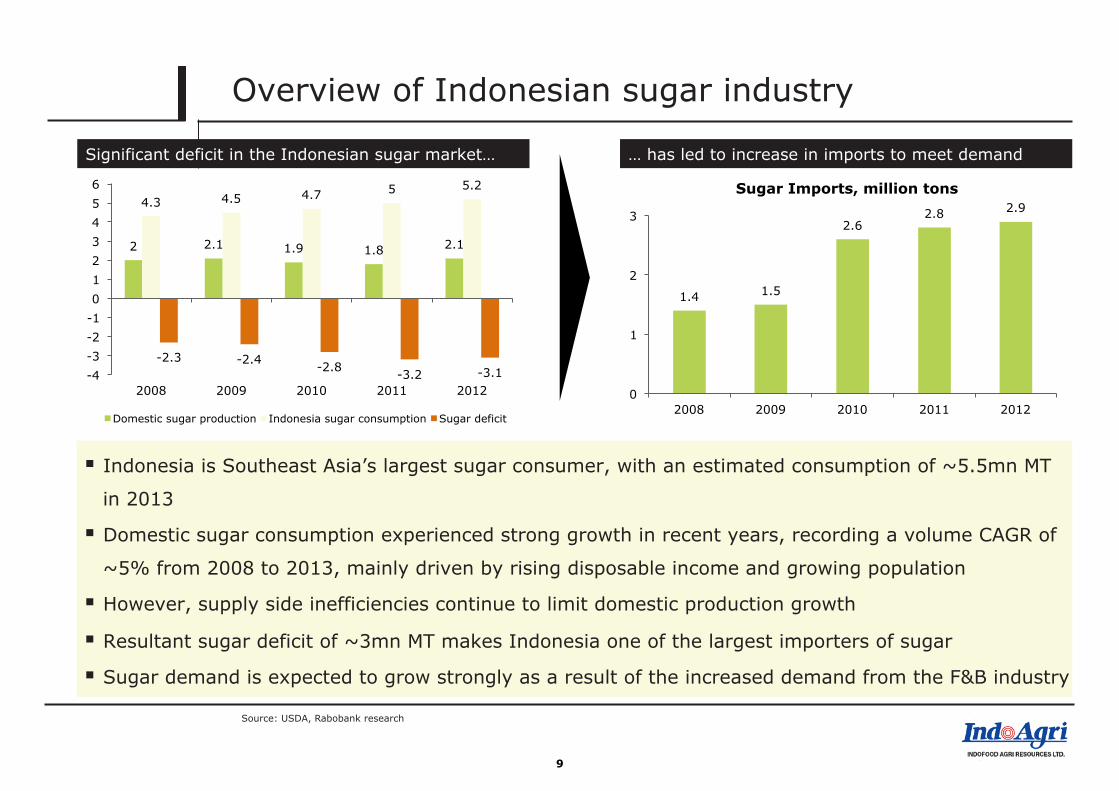
Overview of Indonesian sugar industry
Significant deficit in the Indonesian sugar market…
Source: USDA, Rabobank research
9
… has led to increase in imports to meet demand
2 2.1 1.9 1.8 2.1
4.3 4.5 4.7 5 5.2
-2.3 -2.4 -2.8 -3.2 -3.1 -4 -3 -2 -1 0 1 2 3 4 5 6
2008 2009 2010 2011 2012
Domestic sugar production Indonesia sugar consumption Sugar deficit
1.4 1.5
2.6 2.8 2.9
0
1
2
3
2008 2009 2010 2011 2012
Sugar Imports, million tons
§ Indonesia is Southeast Asia’s largest sugar consumer, with an estimated consumption of ~5.5mn MT
in 2013
§ Domestic sugar consumption experienced strong growth in recent years, recording a volume CAGR of
~5% from 2008 to 2013, mainly driven by rising disposable income and growing population
§ However, supply side inefficiencies continue to limit domestic production growth
§ Resultant sugar deficit of ~3mn MT makes Indonesia one of the largest importers of sugar
§ Sugar demand is expected to grow strongly as a result of the increased demand from the F&B industry
181 210 83
250 250 221
219 110 10
Valuation and market data
Section III
181 210 83
250 250 221
219 110 10
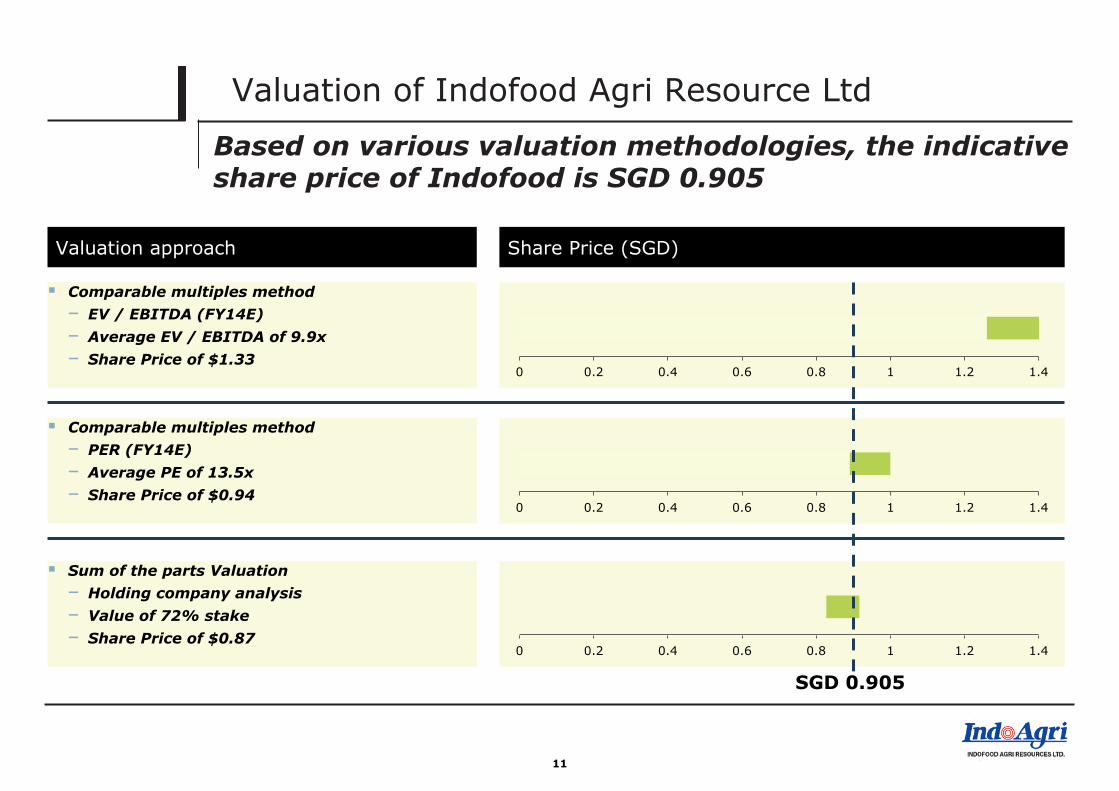
Valuation of Indofood Agri Resource Ltd
Based on various valuation methodologies, the indicative share price of Indofood is SGD 0.905
11
Valuation approach Share Price (SGD)
§ Comparable multiples method – EV / EBITDA (FY14E) – Average EV / EBITDA of 9.9x – Share Price of $1.33
§ Sum of the parts Valuation – Holding company analysis – Value of 72% stake – Share Price of $0.87
0 0.2 0.4 0.6 0.8 1 1.2 1.4
0 0.2 0.4 0.6 0.8 1 1.2 1.4
§ Comparable multiples method – PER (FY14E) – Average PE of 13.5x – Share Price of $0.94
0 0.2 0.4 0.6 0.8 1 1.2 1.4
SGD 0.905
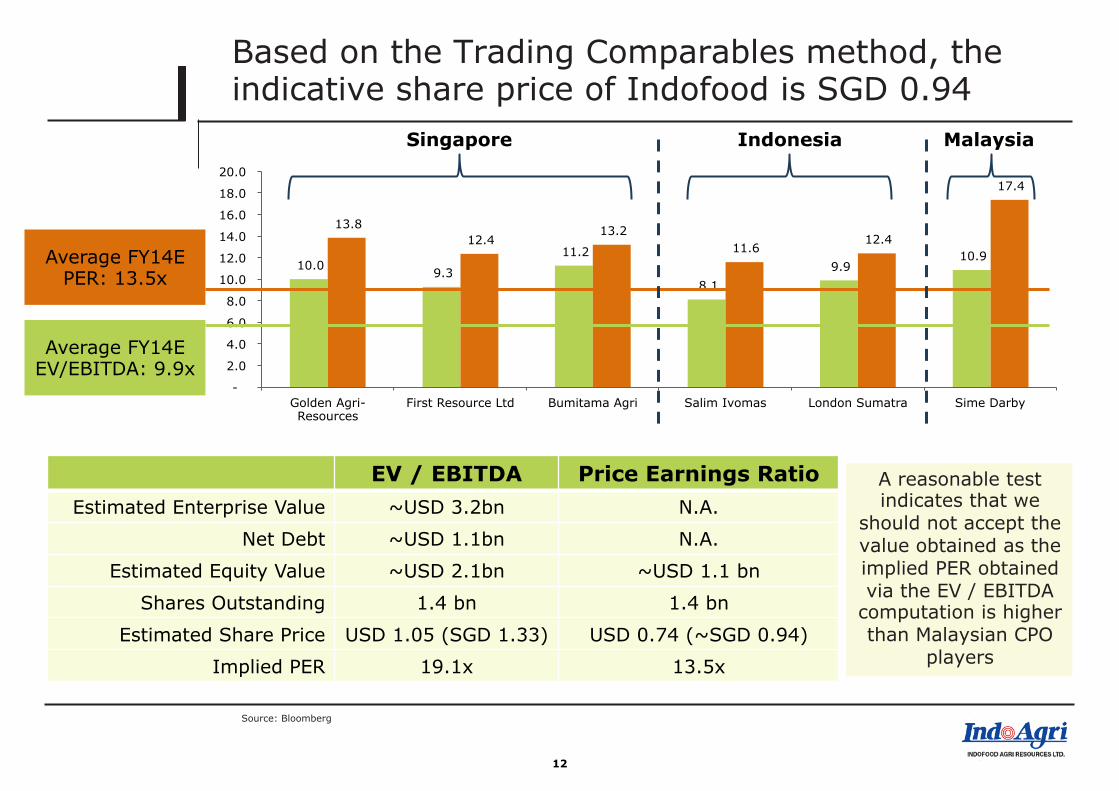
Based on the Trading Comparables method, the indicative share price of Indofood is SGD 0.94
12
10.0 9.3
11.2
8.1 9.9
10.9
13.8 12.4
13.2 11.6
12.4
17.4
-
2.0
4.0
6.0
8.0
10.0
12.0
14.0
16.0
18.0
20.0
Golden Agri-Resources
First Resource Ltd Bumitama Agri Salim Ivomas London Sumatra Sime Darby
Average FY14E EV/EBITDA: 9.9x
Average FY14E PER: 13.5x
EV / EBITDA Price Earnings Ratio Estimated Enterprise Value ~USD 3.2bn N.A.
Net Debt ~USD 1.1bn N.A.
Estimated Equity Value ~USD 2.1bn ~USD 1.1 bn
Shares Outstanding 1.4 bn 1.4 bn
Estimated Share Price USD 1.05 (SGD 1.33) USD 0.74 (~SGD 0.94)
Implied PER 19.1x 13.5x
Source: Bloomberg
Singapore Indonesia Malaysia
A reasonable test indicates that we
should not accept the value obtained as the implied PER obtained via the EV / EBITDA
computation is higher than Malaysian CPO
players
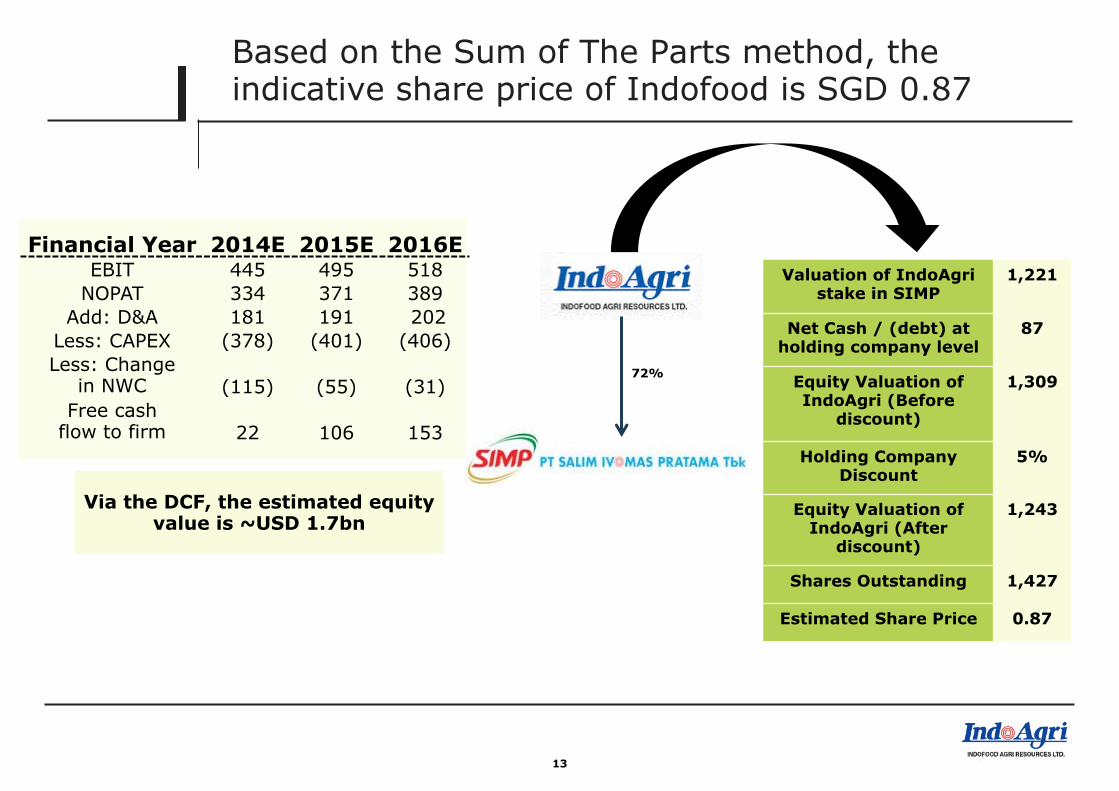
Based on the Sum of The Parts method, the indicative share price of Indofood is SGD 0.87
13
72%
Valuation of IndoAgri stake in SIMP
1,221
Net Cash / (debt) at holding company level
87
Equity Valuation of IndoAgri (Before
discount)
1,309
Holding Company Discount
5%
Equity Valuation of IndoAgri (After
discount)
1,243
Shares Outstanding 1,427
Estimated Share Price 0.87
Financial Year 2014E 2015E 2016E EBIT 445 495 518
NOPAT 334 371 389 Add: D&A 181 191 202
Less: CAPEX (378) (401) (406) Less: Change
in NWC (115) (55) (31) Free cash
flow to firm 22 106 153
Via the DCF, the estimated equity value is ~USD 1.7bn
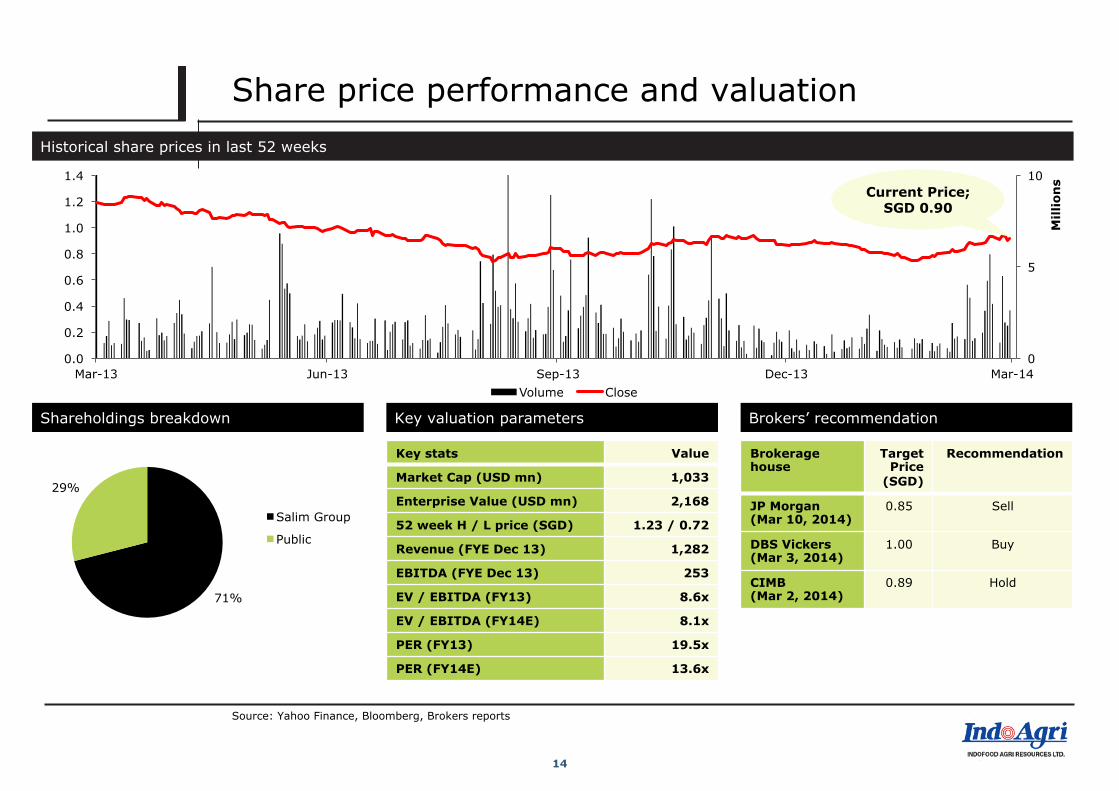
Share price performance and valuation
Shareholdings breakdown
0
5
10
0.0
0.2
0.4
0.6
0.8
1.0
1.2
1.4
Mar-13 Jun-13 Sep-13 Dec-13 Mar-14
Mill
ion
s
Volume Close
Source: Yahoo Finance, Bloomberg, Brokers reports
71%
29%
Salim Group
Public
14
Historical share prices in last 52 weeks
Key valuation parameters
Key stats Value
Market Cap (USD mn) 1,033
Enterprise Value (USD mn) 2,168
52 week H / L price (SGD) 1.23 / 0.72
Revenue (FYE Dec 13) 1,282
EBITDA (FYE Dec 13) 253
EV / EBITDA (FY13) 8.6x
EV / EBITDA (FY14E) 8.1x
PER (FY13) 19.5x
PER (FY14E) 13.6x
Brokers’ recommendation
Brokerage house
Target Price
(SGD)
Recommendation
JP Morgan (Mar 10, 2014)
0.85 Sell
DBS Vickers (Mar 3, 2014)
1.00 Buy
CIMB (Mar 2, 2014)
0.89 Hold
Current Price; SGD 0.90
Downside risks
Section IV
181 210 83
250 250 221
219 110 10
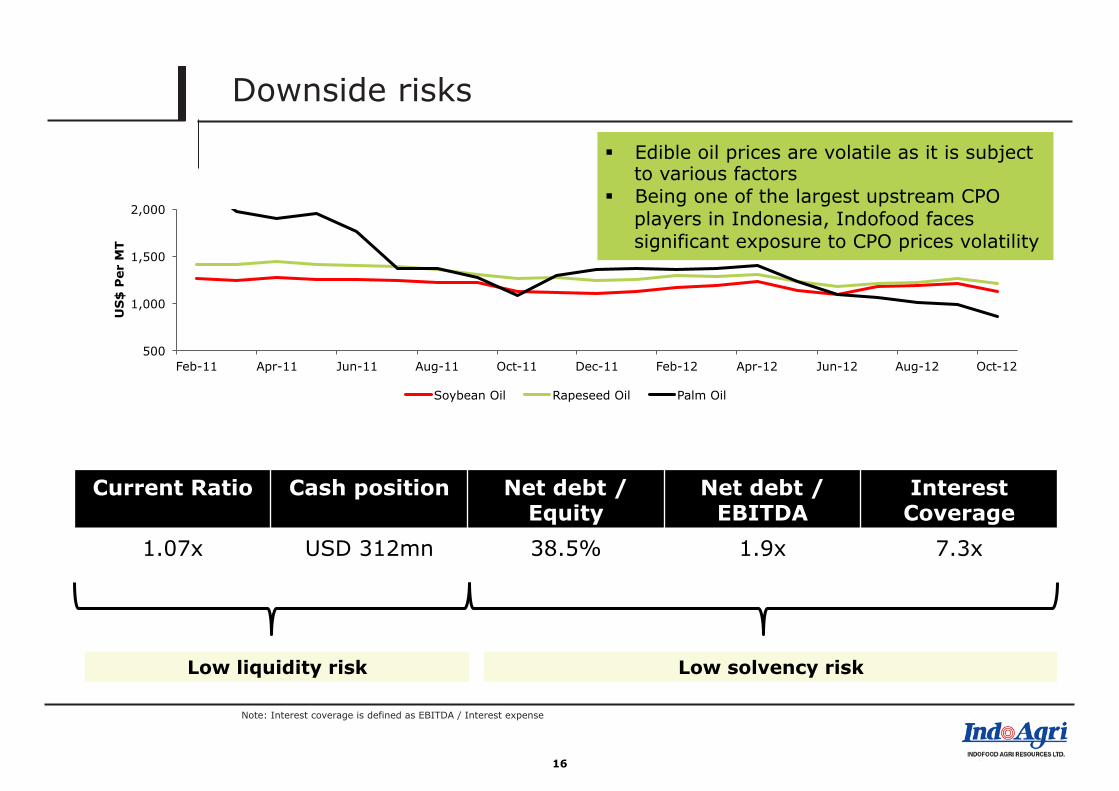
Downside risks
Note: Interest coverage is defined as EBITDA / Interest expense
16
Current Ratio Cash position Net debt / Equity
Net debt / EBITDA
Interest Coverage
1.07x USD 312mn 38.5% 1.9x 7.3x
Low liquidity risk Low solvency risk
500
1,000
1,500
2,000
Feb-11 Apr-11 Jun-11 Aug-11 Oct-11 Dec-11 Feb-12 Apr-12 Jun-12 Aug-12 Oct-12
US
$ P
er M
T
Soybean Oil Rapeseed Oil Palm Oil
§ Edible oil prices are volatile as it is subject to various factors
§ Being one of the largest upstream CPO players in Indonesia, Indofood faces significant exposure to CPO prices volatility
Holding company discount analysis
Section V
181 210 83
250 250 221
219 110 10
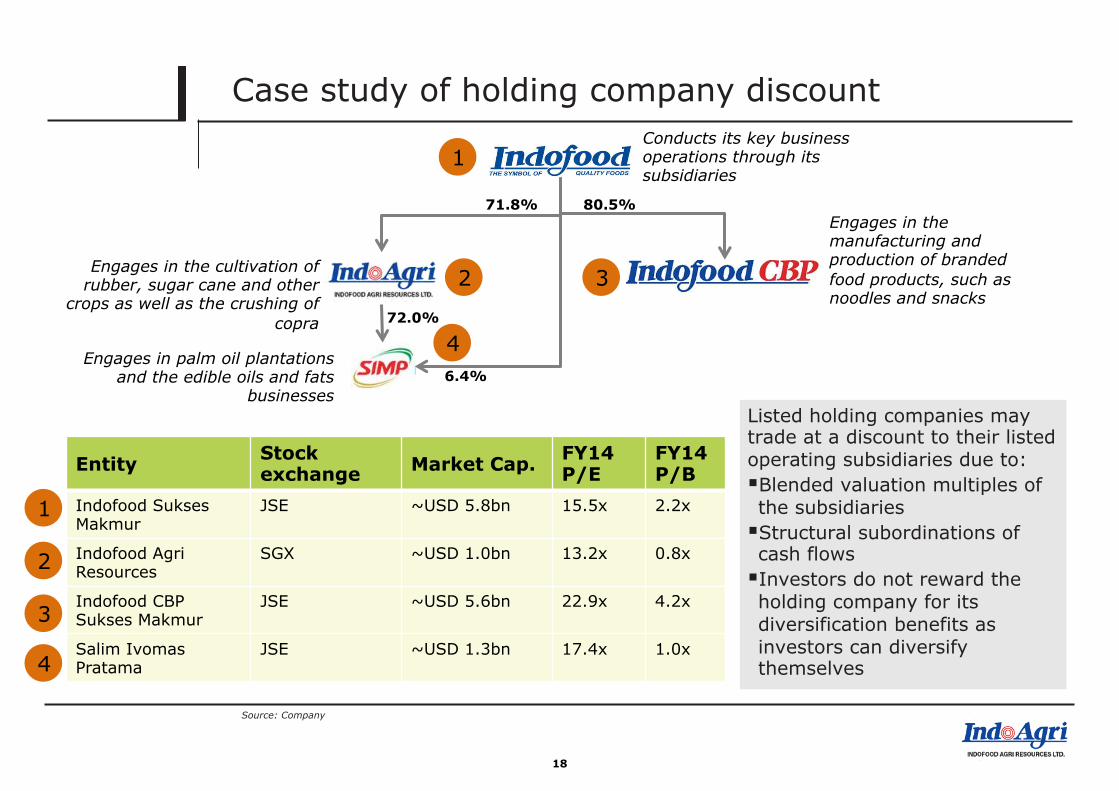
Case study of holding company discount
Source: Company
18
6.4%
80.5% 71.8%
72.0%
Conducts its key business operations through its subsidiaries
Engages in the manufacturing and production of branded food products, such as noodles and snacks
Engages in palm oil plantations and the edible oils and fats
businesses
Engages in the cultivation of rubber, sugar cane and other
crops as well as the crushing of copra
Entity Stock exchange Market Cap. FY14
P/E FY14 P/B
Indofood Sukses Makmur
JSE ~USD 5.8bn 15.5x 2.2x
Indofood Agri Resources
SGX ~USD 1.0bn 13.2x 0.8x
Indofood CBP Sukses Makmur
JSE ~USD 5.6bn 22.9x 4.2x
Salim Ivomas Pratama
JSE ~USD 1.3bn 17.4x 1.0x
1
2
4
3
1
2 3
4
Listed holding companies may trade at a discount to their listed operating subsidiaries due to: § Blended valuation multiples of the subsidiaries § Structural subordinations of cash flows § Investors do not reward the holding company for its diversification benefits as investors can diversify themselves
Question and Answer
Thank you very much
19