Embed Size (px)
Citation preview

Broiler sector scenarios study
Peter van Horne and Ferry Leenstra
Wageningen UR
Jakarta, september 2015
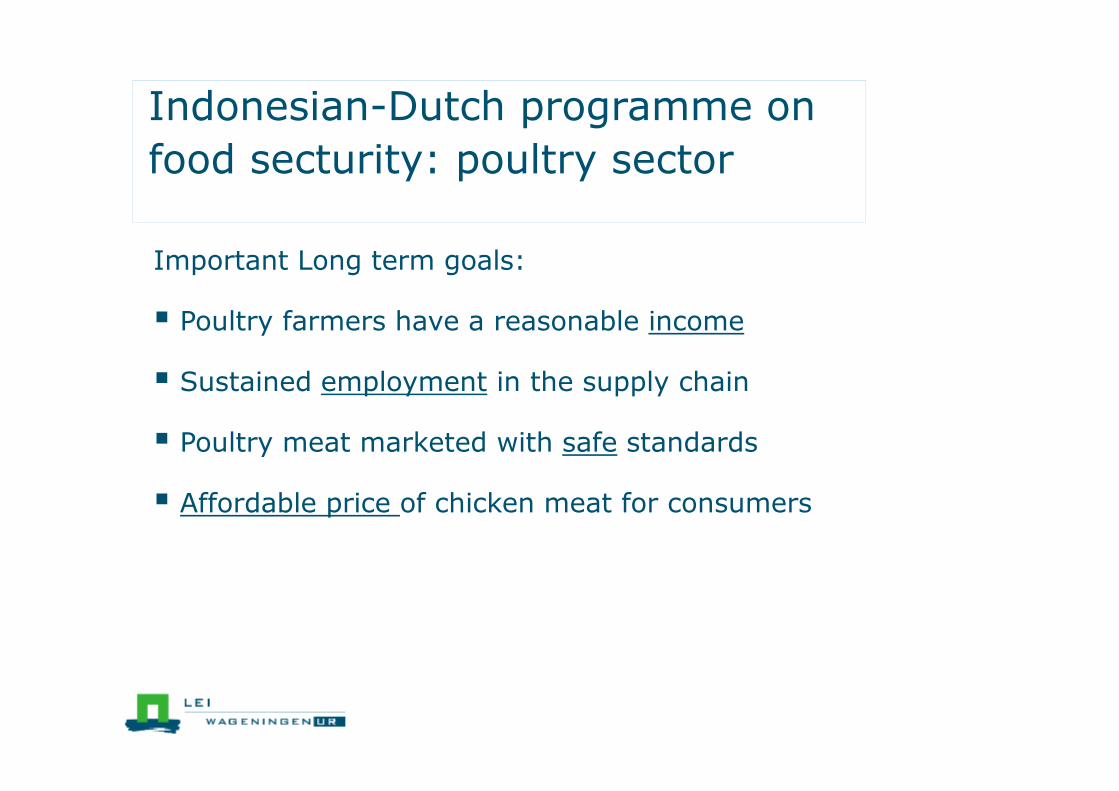
Indonesian-Dutch programme on
food secturity: poultry sector
Important Long term goals:
� Poultry farmers have a reasonable income
� Sustained employment in the supply chain
� Poultry meat marketed with safe standards
� Affordable price of chicken meat for consumers
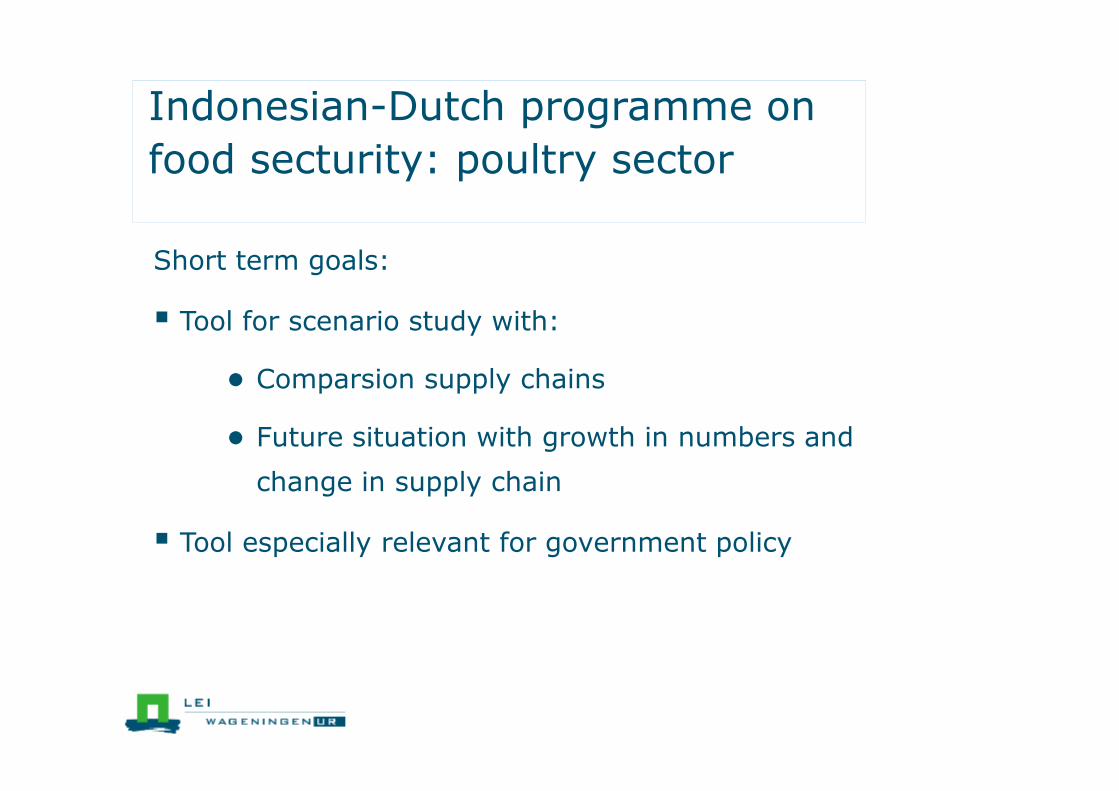
Indonesian-Dutch programme on
food secturity: poultry sector
Short term goals:
� Tool for scenario study with:
● Comparsion supply chains
● Future situation with growth in numbers and
change in supply chain
� Tool especially relevant for government policy

Sector development scenarios
Part of Work Package 1:
Indonesian Poultry Industry towards 2025
Peter van Horne and Ferry Leenstra, Wageningen UR
In cooperation with IPB and Rabobank Int.
Focus on west Java
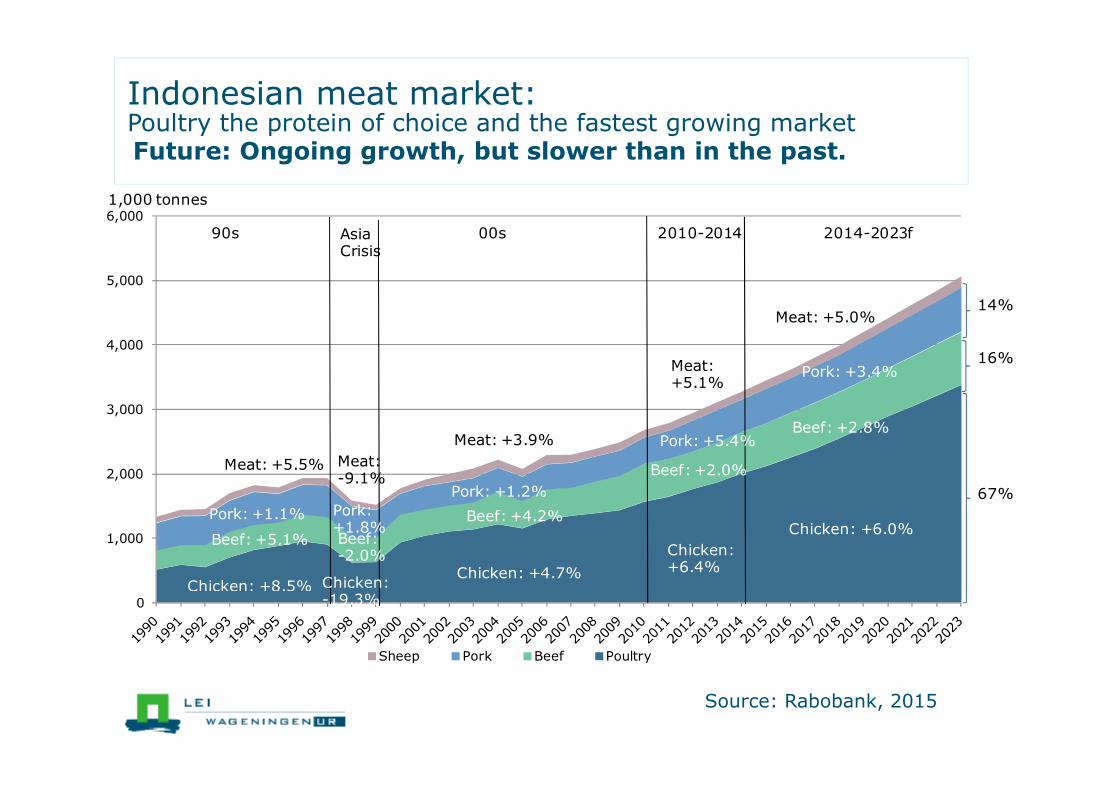
Source: Rabobank, 2015
0
1,000
2,000
3,000
4,000
5,000
6,000
Sheep Pork Beef Poultry
1,000 tonnes
90s Asia Crisis
00s 2010-2014 2014-2023f
Chicken: +8.5%
Beef: +5.1%
Pork: +1.1%
Chicken: +4.7%
Beef: +4.2%
Pork: +1.2%
Chicken:-19.3%
Beef: -2.0%
Pork: +1.8%
Chicken:+6.4%
Beef: +2.0%
Pork: +5.4%
Chicken: +6.0%
Beef: +2.8%
Pork: +3.4%
Meat: +5.5% Meat:-9.1%
Meat: +3.9%
Meat:+5.1%
Meat: +5.0%
67%
16%
14%
Indonesian meat market: Poultry the protein of choice and the fastest growing marketFuture: Ongoing growth, but slower than in the past.
-
50,000
100,000
150,000
200,000
250,000
300,000
1990
1992
1994
1996
1998
2000
2002
2004
2006
2008
2010
2012
2014
2016
2018
2020
2022
Urban
Rural
X Million
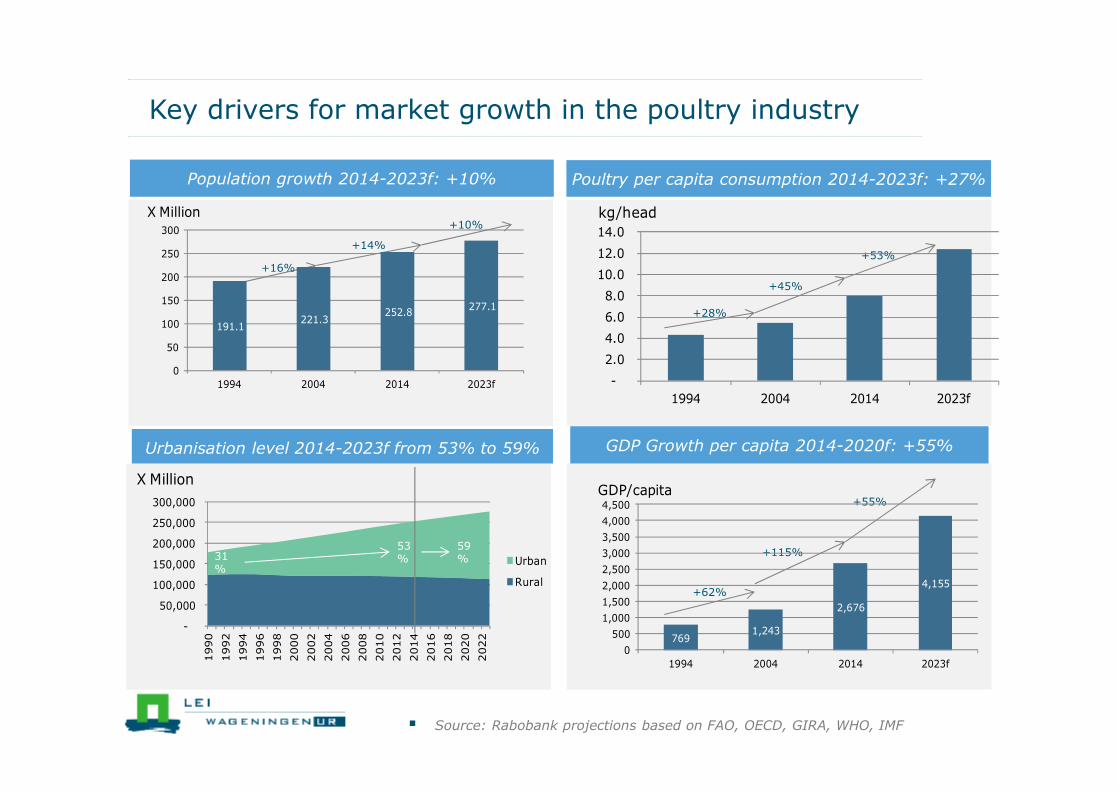
Key drivers for market growth in the poultry industry
� Source: Rabobank projections based on FAO, OECD, GIRA, WHO, IMF
Urbanisation level 2014-2023f from 53% to 59% GDP Growth per capita 2014-2020f: +55%
Population growth 2014-2023f: +10% Poultry per capita consumption 2014-2023f: +27%
+28%
+45%
+53%+16%
+14%
+10%
31%
53%
59%
+62%
+115%
+55%
191.1 221.3
252.8 277.1
0
50
100
150
200
250
300
1994 2004 2014 2023f
X Million
-
2.0
4.0
6.0
8.0
10.0
12.0
14.0
1994 2004 2014 2023f
kg/head
7691,243
2,676
4,155
0
500
1,000
1,500
2,000
2,500
3,000
3,500
4,000
4,500
1994 2004 2014 2023f
GDP/capita
Source: Rabobank, WUR 2015
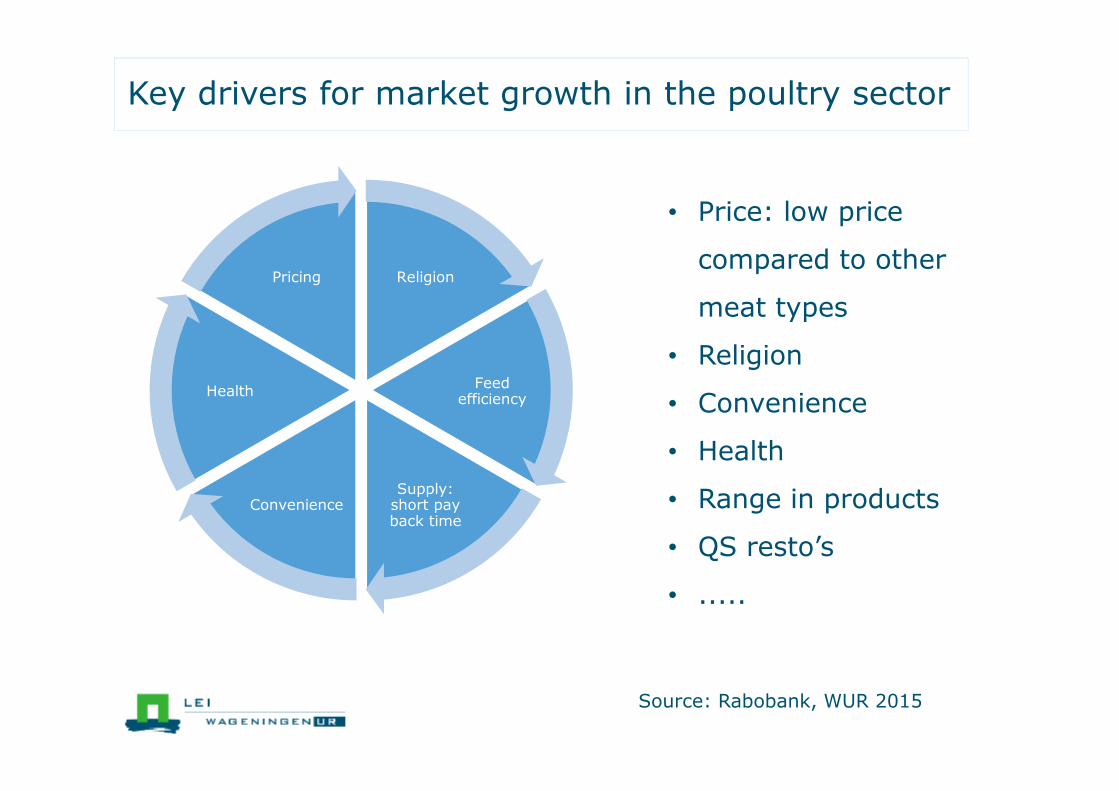
Key drivers for market growth in the poultry sector
Religion
Feed efficiency
Supply: short pay back time
Convenience
Health
Pricing
• Price: low price
compared to other
meat types
• Religion
• Convenience
• Health
• Range in products
• QS resto’s
• .....

Source: Rabobank, 2015
Poultry meat consumption in other countries
0
5
10
15
20
25
30
35
40
45
50
Poultry consumption (kg/year)
Income per capita (USD 1000)
-Hybrid between Wet market and
grocery retail
- Wide assortment of meat, poultry
and seafood
- Non-airconditioned but with
cooling facilities
- Linked to local night markets
Malaysia: NSK Trade City
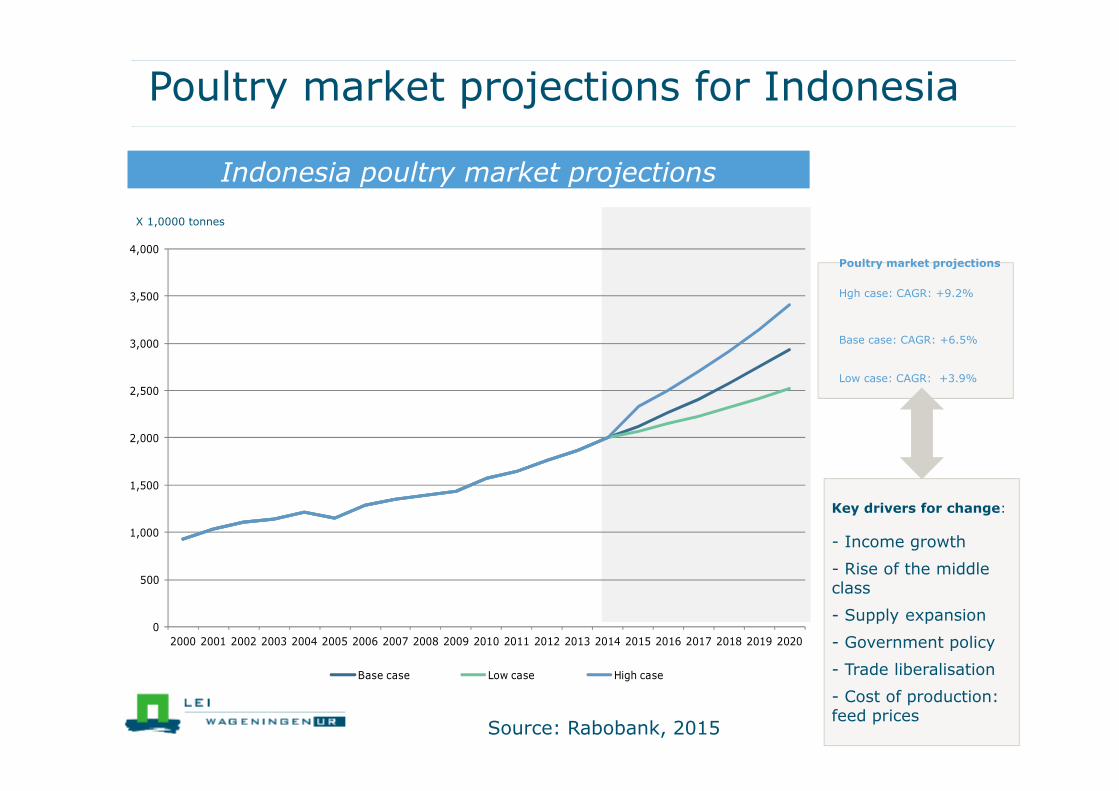
Poultry market projections for Indonesia
Indonesia poultry market projections
X 1,0000 tonnes
Key drivers for change:
- Income growth
- Rise of the middleclass
- Supply expansion
- Government policy
- Trade liberalisation
- Cost of production: feed prices
Hgh case: CAGR: +9.2%
Base case: CAGR: +6.5%
Low case: CAGR: +3.9%
Poultry market projections
0
500
1,000
1,500
2,000
2,500
3,000
3,500
4,000
2000 2001 2002 2003 2004 2005 2006 2007 2008 2009 2010 2011 2012 2013 2014 2015 2016 2017 2018 2019 2020
Base case Low case High case
Source: Rabobank, 2015
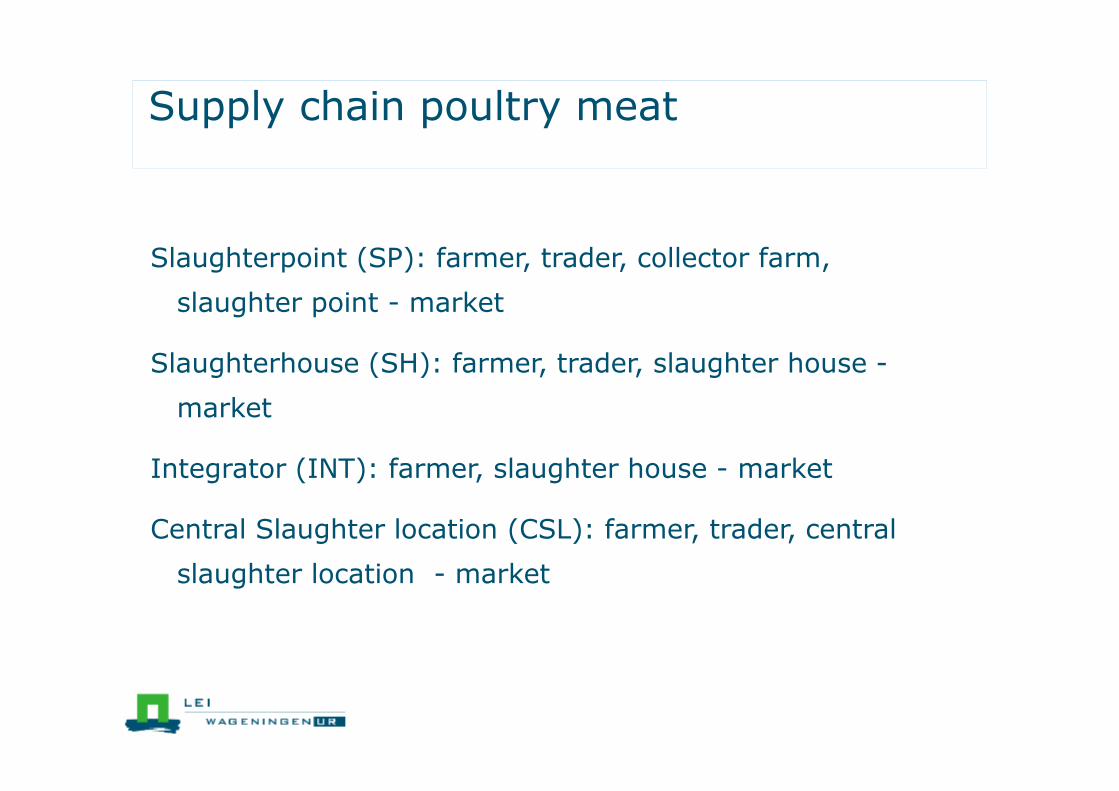
Supply chain poultry meat
Slaughterpoint (SP): farmer, trader, collector farm,
slaughter point - market
Slaughterhouse (SH): farmer, trader, slaughter house -
market
Integrator (INT): farmer, slaughter house - market
Central Slaughter location (CSL): farmer, trader, central
slaughter location - market
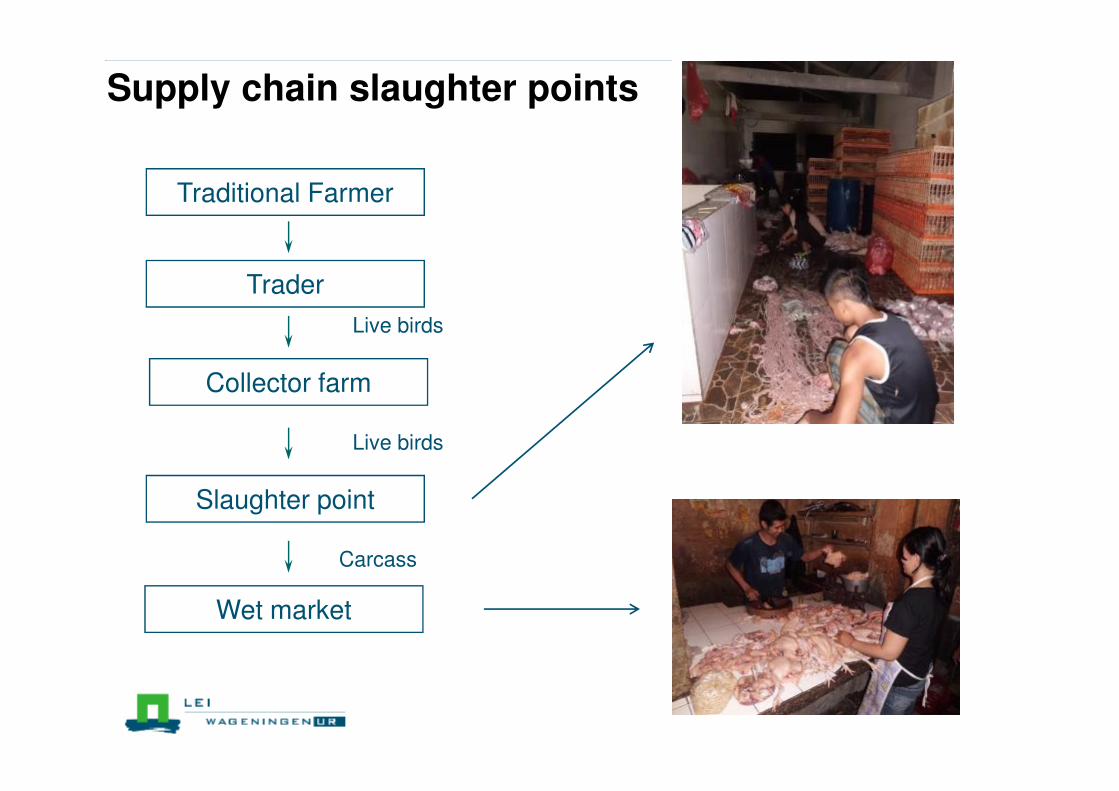
Supply chain slaughter points
Live birds
Traditional Farmer
Trader
Collector farm
Slaughter point
Wet market
Live birds
Carcass
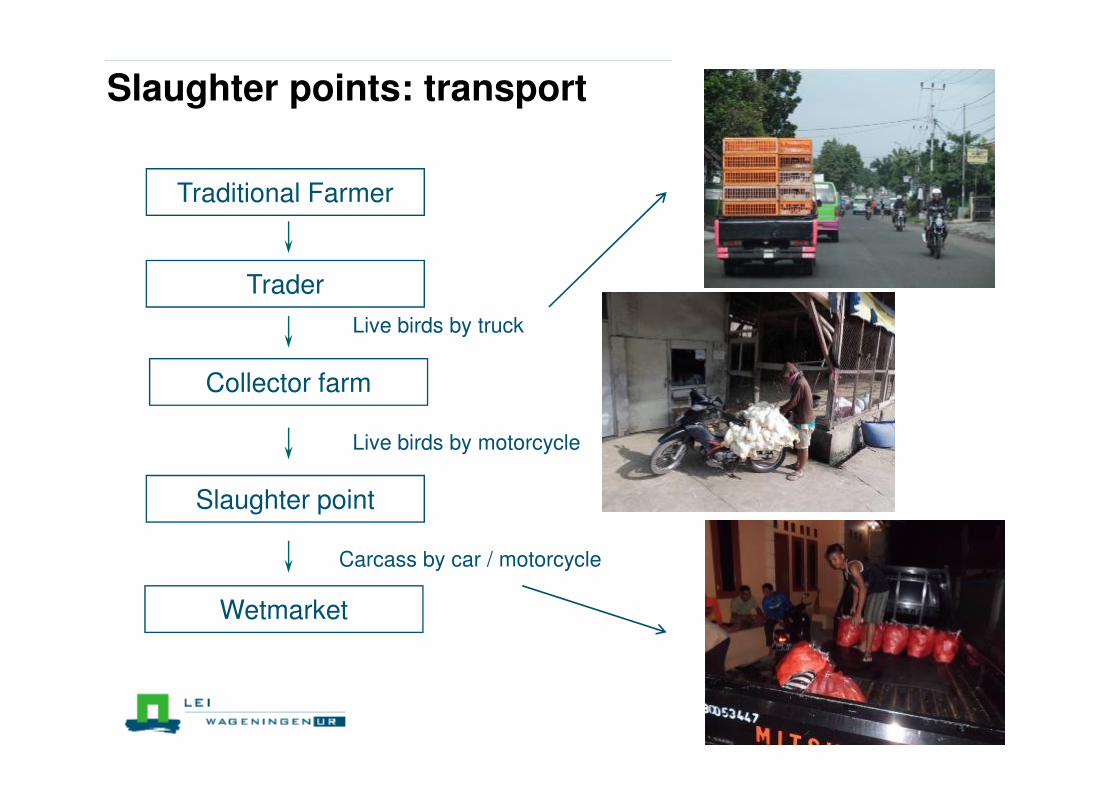
Slaughter points: transport
Live birds by truck
Traditional Farmer
Trader
Collector farm
Slaughter point
Wetmarket
Live birds by motorcycle
Carcass by car / motorcycle

Supply chain: central slaughter location
Live birds
Traditional Farmer
Trader
Collector farm
Slaughter point
Wetmarket
Central
slaughter
location

Central slaughter location: advantages
Live birds
Traditional Farmer
Trader
Collector farm
Slaughter point
Wetmarket
Central
slaughter
location
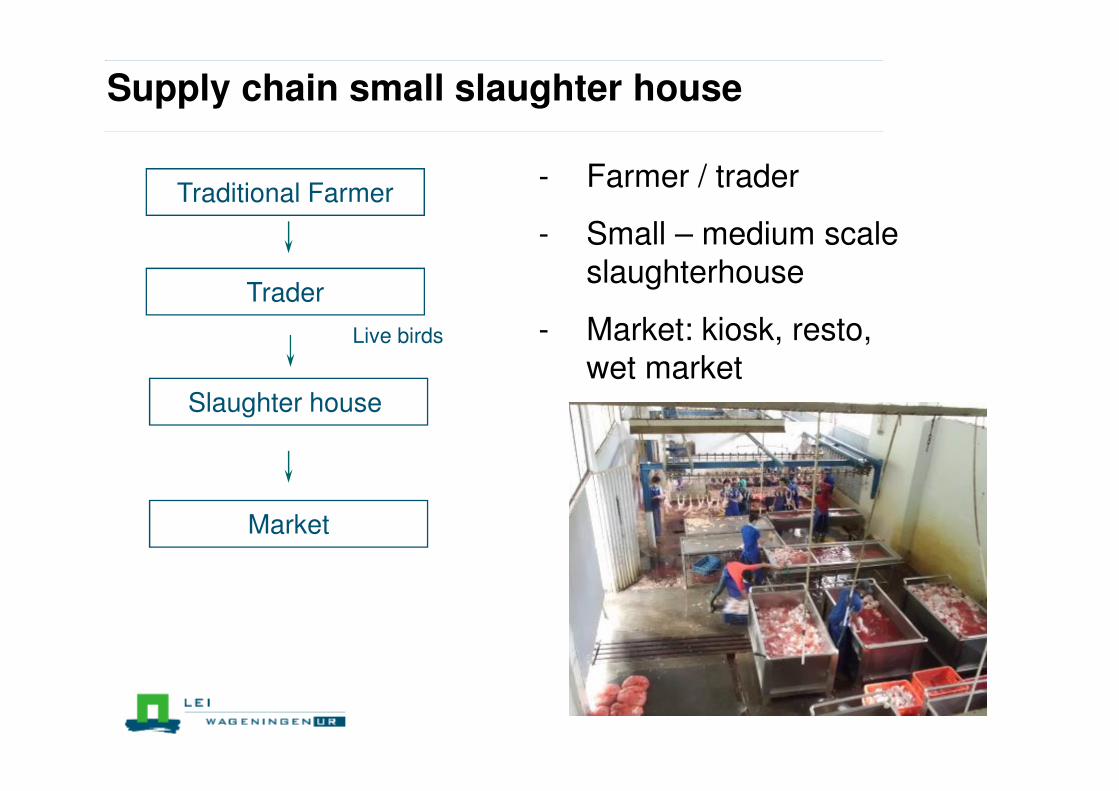
Supply chain small slaughter house
Live birds
Traditional Farmer
Trader
Slaughter house
Market
- Farmer / trader
- Small – medium scale
slaughterhouse
- Market: kiosk, resto,
wet market
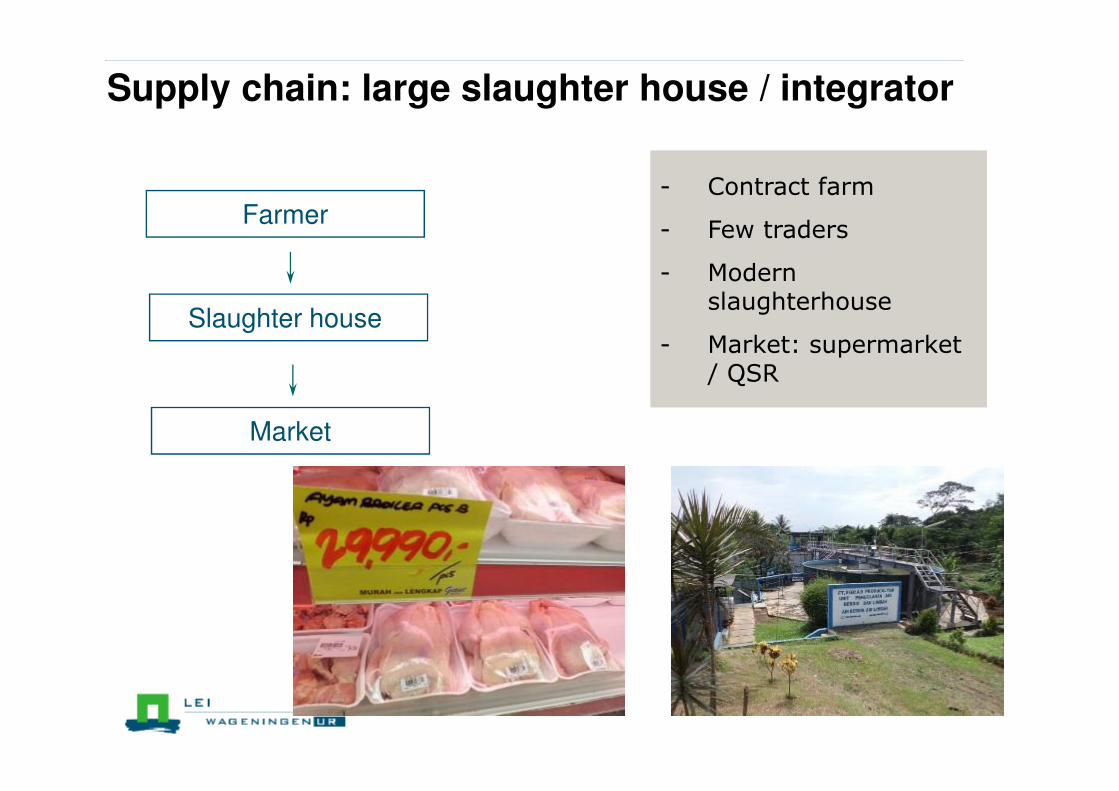
Supply chain: large slaughter house / integrator
Farmer
Slaughter house
Market
- Contract farm
- Few traders
- Modern slaughterhouse
- Market: supermarket / QSR
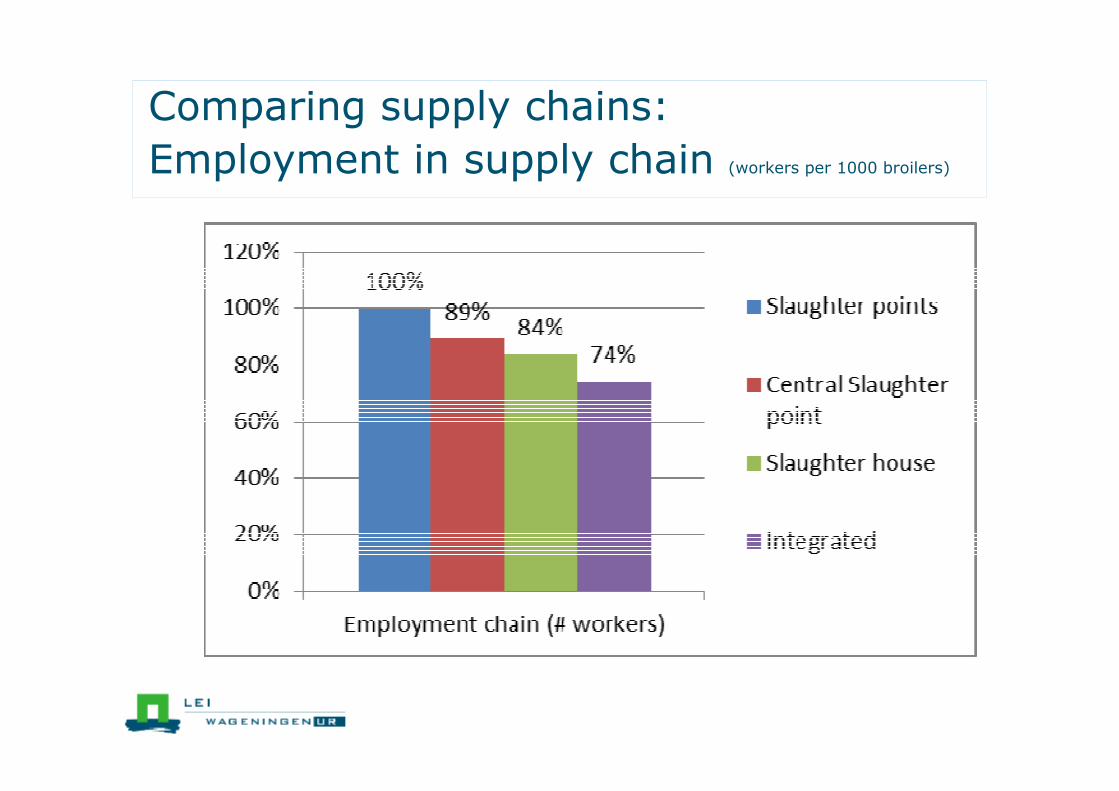
Comparing supply chains:
Employment in supply chain (workers per 1000 broilers)
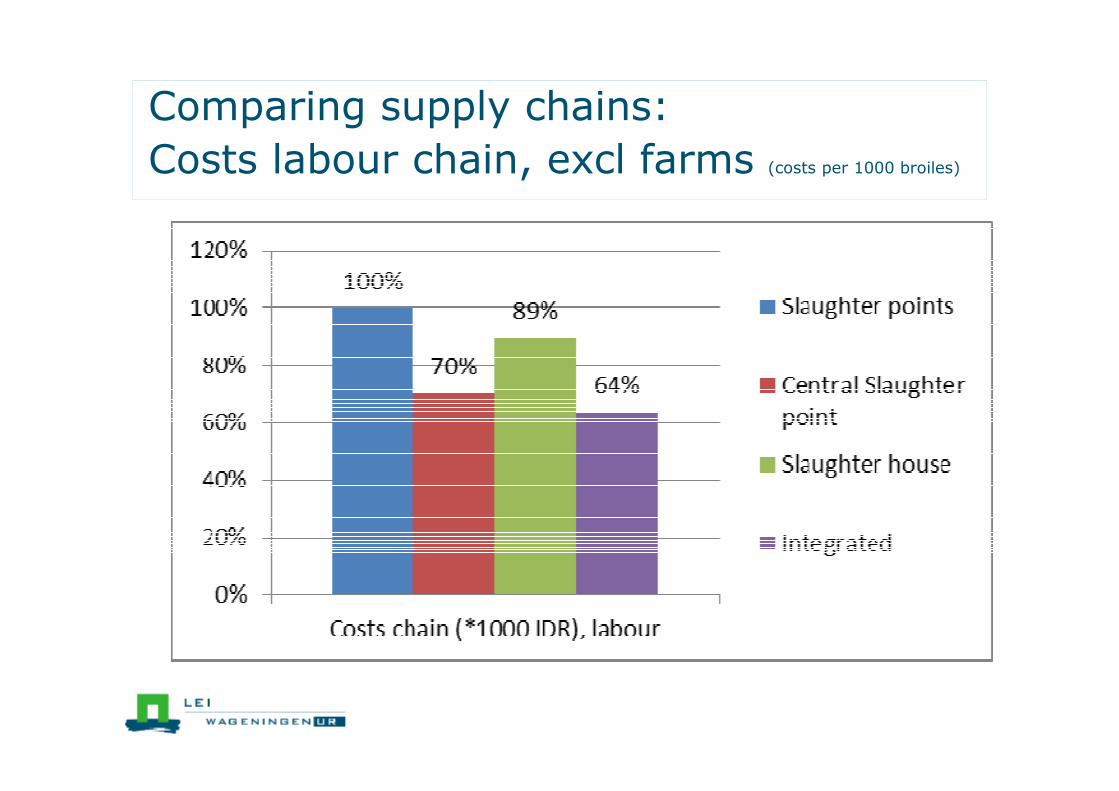
Comparing supply chains:
Costs labour chain, excl farms (costs per 1000 broiles)
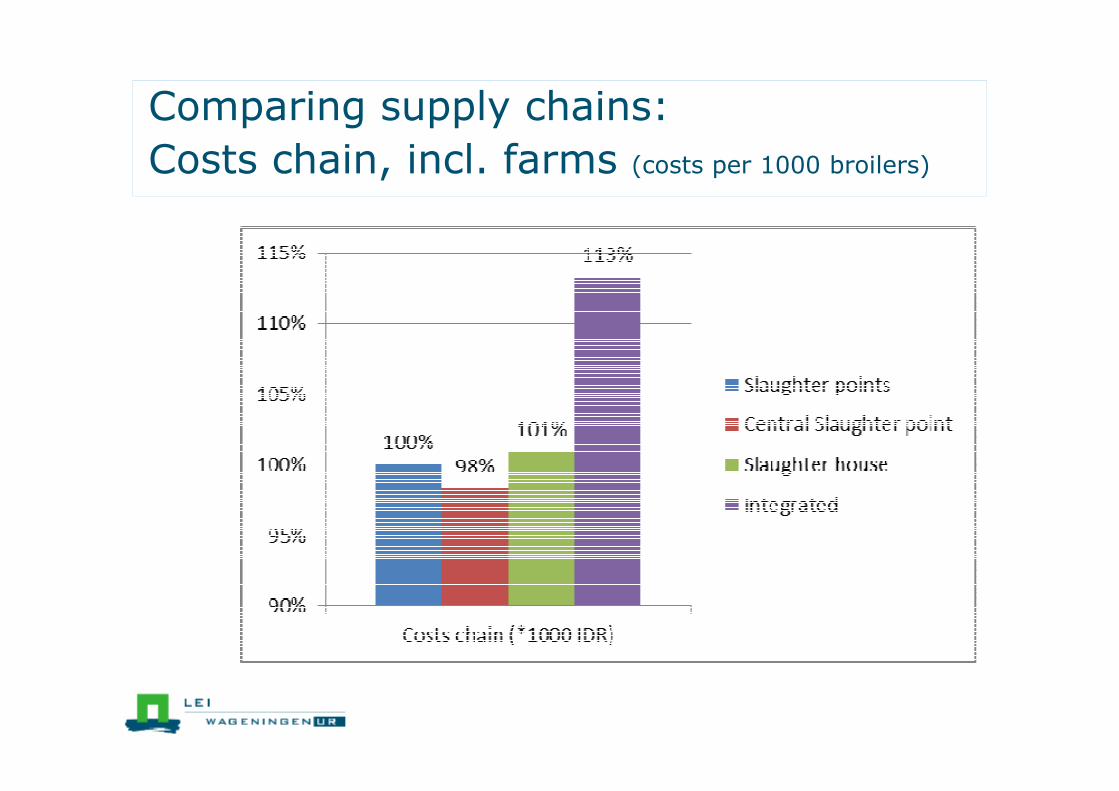
Comparing supply chains:
Costs chain, incl. farms (costs per 1000 broilers)

Comparing supply chains:
Transport by truck / motorcylce (km per 1000 broilers)
Motorcycle:
233,000 km/day.
Half with live birds
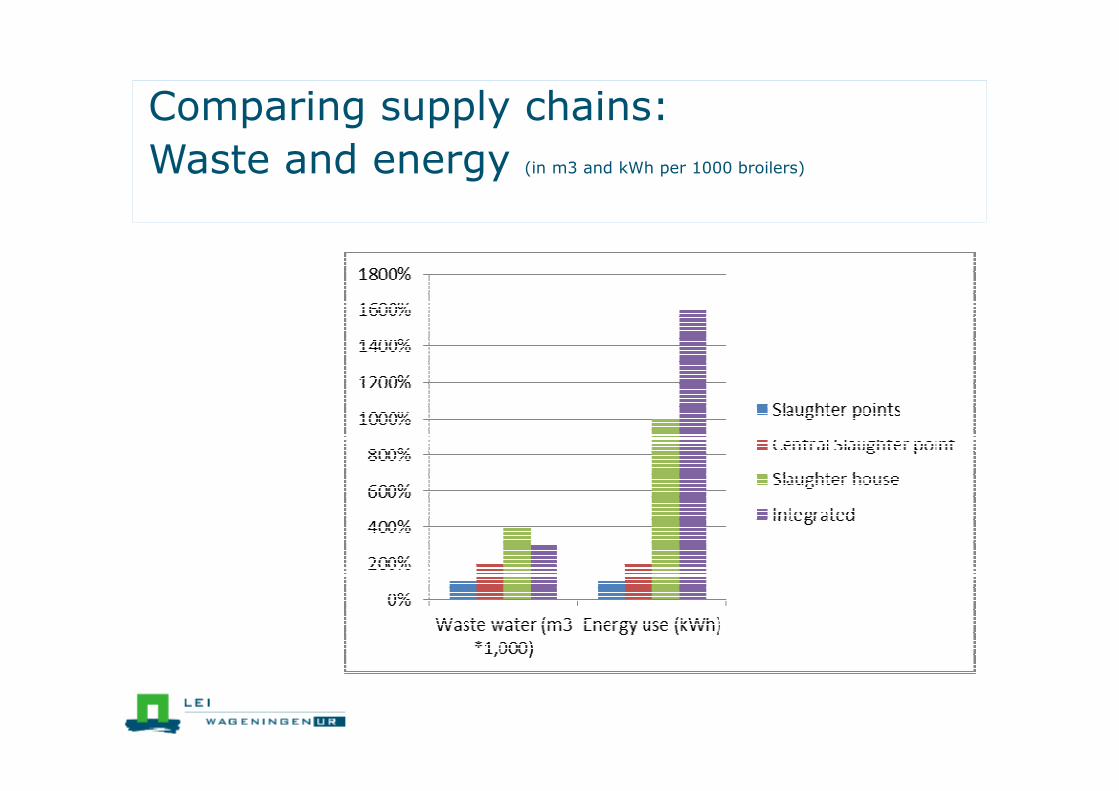
Comparing supply chains:
Waste and energy (in m3 and kWh per 1000 broilers)

Supply chain development: a scenario
Slaughter
points
Central
slaughter
point
Slaughter-
houses Integrated
in 2015: 70% 0% 10% 20%
in 2020: 35% 30% 10% 25%
in 2025: 0% 60% 10% 30%
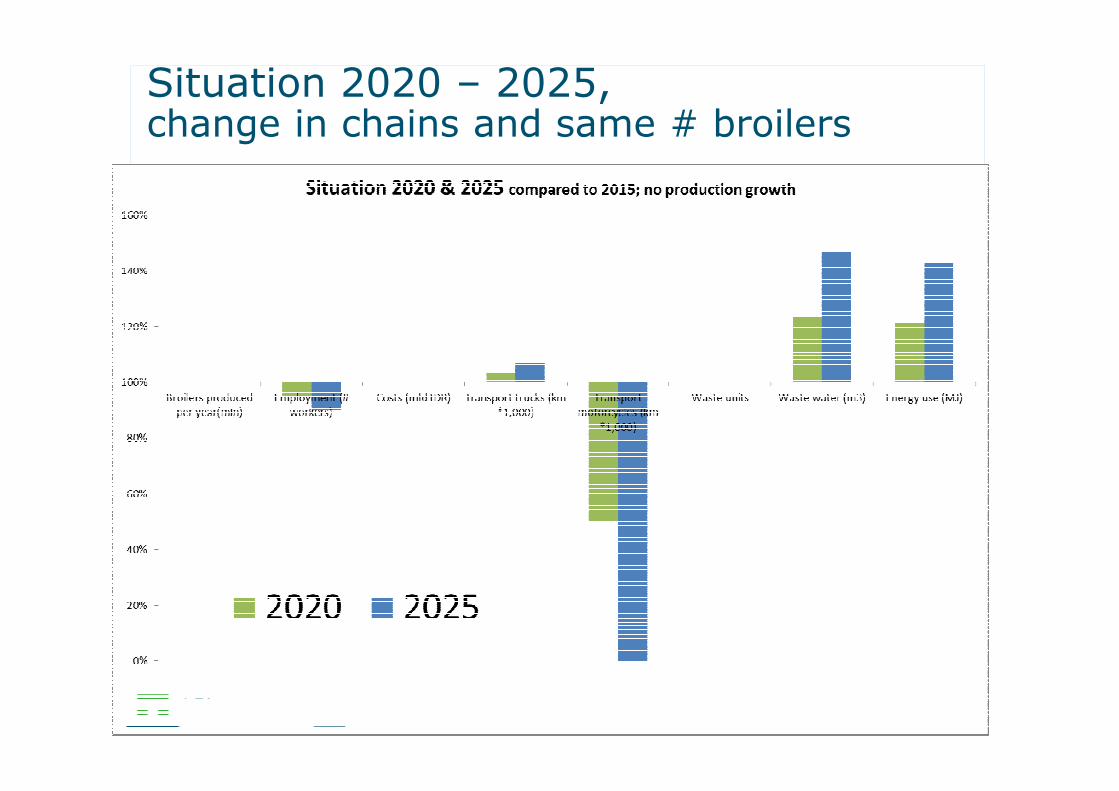
Situation 2020 – 2025, change in chains and same # broilers
Scenario with increase in # broilers
Demand for broilers is 1 million per day.
(based on population greater Jakarta and cons/head)
Growth per year of 6%:
2015 = 365 mln per year
2020 = 488 mln per year (135%)
2025 = 654 mln per year (180%)
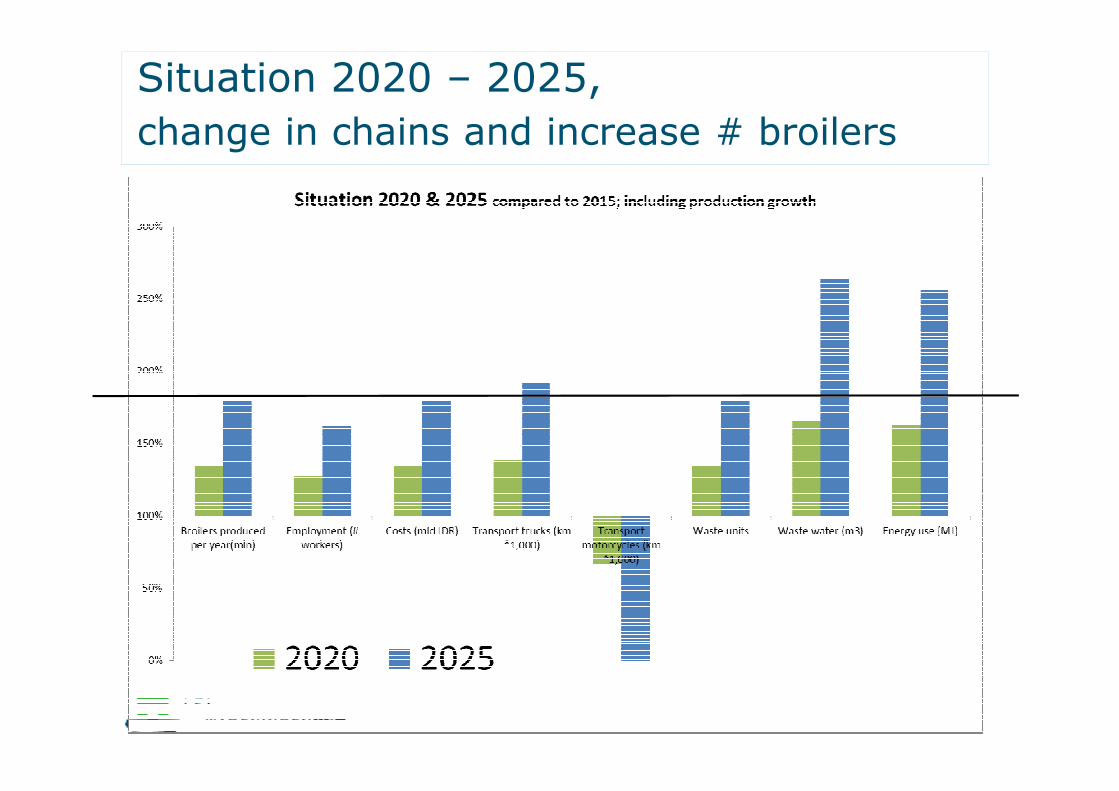
Situation 2020 – 2025,
change in chains and increase # broilers
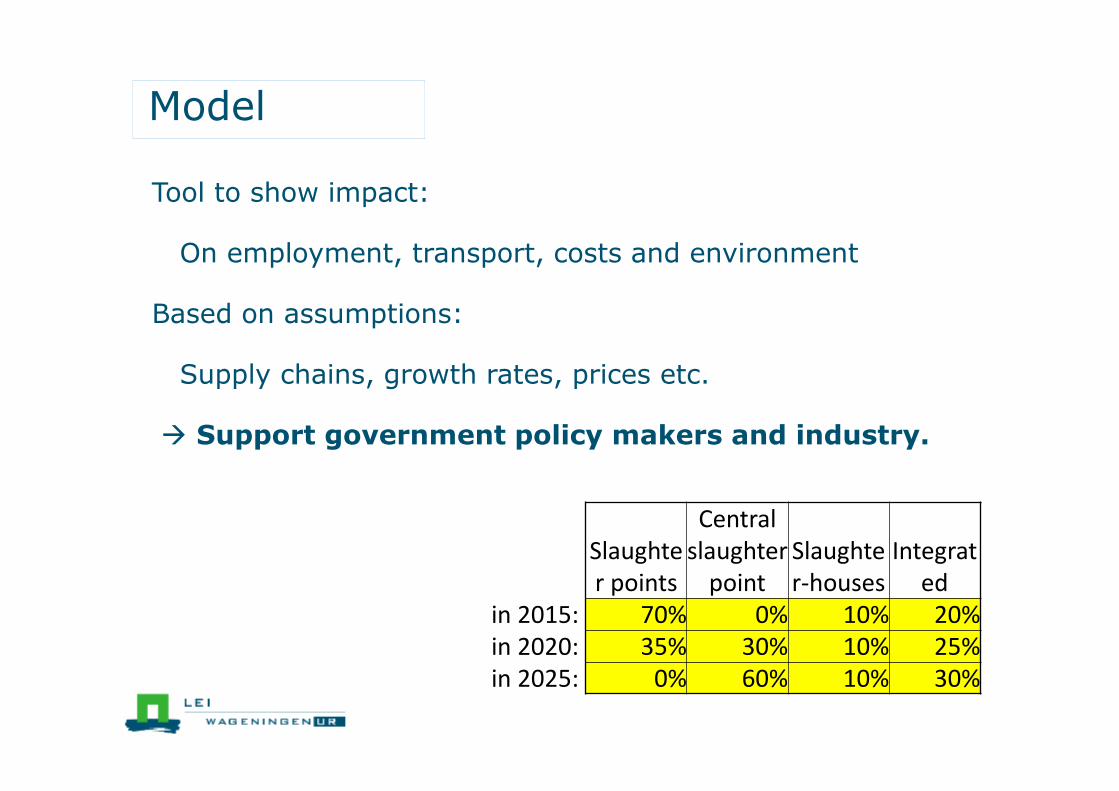
Model
Tool to show impact:
On employment, transport, costs and environment
Based on assumptions:
Supply chains, growth rates, prices etc.
� Support government policy makers and industry.
Slaughte
r points
Central
slaughter
point
Slaughte
r-houses
Integrat
ed
in 2015: 70% 0% 10% 20%
in 2020: 35% 30% 10% 25%
in 2025: 0% 60% 10% 30%
Conclusions (1)
� Estimated growth rate of production 6% (range 4 – 9%)
� Consumption/head increase based on GDP and urbanisation
� Total production increase due cons/head and population growth
� Low consumption compared to neighbouring countries
� Supply chain Slaughter point: long with many actors
� Move to central slaughter location: shorter chain, no transport
motorcycle, better hygiene, less environmental pressure
� Slaughterhouse: less employment, but better hygiene and less
environmental pressure
Conclusions (2)
2020/2025: change in supply chain and increase in
broilers results:
● Increase in employment
● Slightly higher production costs
● Controlled transport by truck
● Less or none motorcycle transport of live chicken
● More waste water
● Higher use of electricity