Embed Size (px)
Citation preview
Coverage: United Kingdom Theme: The Economy Latest Release: April 2018 – Tables 9.7 to 9.12 Next Release: August 2018 – Tables 9.4 and 9.6 Reporting Periods: Personal Tax Years Media contact: HMRC Press Office (Individuals) 03000 585020 Out-of-hours: 07860 359544 HMRC ISA Savings Helpline: 0300 200 3312 Statistical contacts: Freddie Mitchell Tel: 03000 564470 [email protected]
Stephen Lewis Tel: 03000 598074 [email protected] HM Revenue and Customs 100 Parliament Street London SW1A 2BQ Website: https://www.gov.uk/government/collections/individual-savings-accounts-isa-statistics
Individual Savings Account
(ISA) Statistics
Individual Savings Account (ISA) Statistics, April 2018
HM Revenue and Customs
2
A National Statistics Publication National Statistics are produced to high professional standards set out in the Code of Practice for Official Statistics. They undergo regular quality assurance reviews to ensure that they meet customer needs. They are produced free from any political interference. For general enquiries about National Statistics contact the National Statistics Public Enquiry Service. Telephone: 0845 601 3034 Overseas: +44 (1633) 653 599 Minicom: 01633 812399 Email: [email protected] Fax: 01633 652747 Letters: Customer Contact Centre, Room 1.015, Cardiff Road, Newport, NP10 8XG You can also find National Statistics on the internet at www.statistics.gov.uk.
Individual Savings Account (ISA) Statistics, April 2018
HM Revenue and Customs
3
Contents Page
Introduction .................................................................................................................................. 4
About these statistics ................................................................................................................ 4 New or updated statistics in this release ................................................................................... 4 User Feedback ......................................................................................................................... 5 Developments ........................................................................................................................... 5
Section 1 – Key features of ISAs ................................................................................................. 6
The introduction of ISAs ............................................................................................................ 6 Adult ISAs ................................................................................................................................. 6 Junior ISAs ............................................................................................................................... 7 Help to Buy: ISAs ...................................................................................................................... 7 Lifetime ISAs ............................................................................................................................. 7 ISA limits ................................................................................................................................... 7
Section 2 – Commentary and analysis ........................................................................................ 9
Section 3 – Tables .......................................................................................................................19
Section 4 – Data, methodology and publication timetable .......................................................30
Data sources ............................................................................................................................30 Method of preparing tables ......................................................................................................30 Timeline for the Publication of ISA Statistics ............................................................................31
Individual Savings Account (ISA) Statistics, April 2018
HM Revenue and Customs
4
Introduction
About these statistics
This publication contains information on tax exempt Individual Savings Accounts (ISAs) drawn from the data that Financial Institutions (also referred to as ‘ISA providers’ or ‘ISA managers’) are required to report to HM Revenue and Customs. It is divided into four sections:
Section 1 sets out the key features of ISAs;
Section 2 provides commentary and analysis of the key trends in the ISA market and the characteristics of ISA holders based on the statistics contained in this release;
Section 3 contains detailed statistical tables; and
Section 4 contains details of the data used in this publication and the estimation methodologies.
New or updated statistics in this release
This publication updates six tables for the 2015-16 tax year (i.e. ISA saving up to 5th April 2016);
9.7, number of adults subscribing to an ISA by income during the year
9.8, number of adults subscribing to an ISA during the year by age and gender
9.9, number of adults subscribing to an ISA during the year by region
9.10, market value of adult ISA funds by income level
9.11, market value of adult ISA funds by age and gender
9.12, market value of adult ISA funds by country and region
Table 9.7 now utilises a new subscription range in light of the increased subscription limit for 2015-16 of £15,240 compared with £15,000 for 2014-15.
This release marks Innovative Finance ISA figures in table 9.4 as having low reliability because its likely HMRC does not yet hold complete data for this ISA type.
ISA managers supply information at different times of the year and this results in tables being updated at different intervals dependent on data availability.
Tables 9.4 and 9.6 are produced following the end of the tax year and published in late summer;
Tables 9.7 to 9.12 are produced in the April two years after the end of the tax year. This is because they are dependent on income information that is not immediately available.
A more precise timeline is given at the end of this document.
Release dates will be announced on the UK Statistics Hub and the HMRC National Statistics release schedule. Any delays to the publication date will be announced on the HMRC National Statistics website.
Individual Savings Account (ISA) Statistics, April 2018
HM Revenue and Customs
5
User Feedback
HMRC are committed to providing impartial quality statistics that meet our customers’ needs. Feedback from users is welcome at any time, and you can contact the responsible statisticians (see page 1) or use the feedback form on the HMRC website at https://www.gov.uk/government/organisations/hm-revenue-customs/about/statistics. Developments
The UK Statistics Authority’s review of HMRC savings statistics, including information published on ISAs, can be found by following the attached link:- http://www.statisticsauthority.gov.uk/assessment/assessment/assessment-reports/assessment-report-235---hm-revenue-and-customs-statistics.pdf We would welcome any comments or feedback from users of our ISA statistics in relation to the recommendations made by UKSA, in particular with regard to the timing of the publication of our various tables.
Individual Savings Account (ISA) Statistics, April 2018
HM Revenue and Customs
6
Section 1 – Key features of ISAs
The introduction of ISAs
Individual savings accounts (ISAs) were introduced on 6 April 1999, replacing the earlier Personal Equity Plans (PEPs) and Tax-Exempt Special Savings Accounts (TESSAs). ISAs are tax exempt cash, stocks and shares and/or innovative finance accounts under which any income received in the form of interest and dividends is free of tax, and on which there is exemption from capital gains tax on any capital growth. The estimated Exchequer cost of the tax relief for ISAs in 2016-17 was around £2.7 billion1.
Savings that are newly invested in an ISA account in a particular tax year are referred to in this publication as ISA ‘subscriptions’, although income earned in an ISA account remains tax free whether or not further subscriptions are made. The value of savings accumulated in an ISA account (as measured at the end of the tax year) including capital growth and any interest and dividend income retained in the account is referred to here as ISA ‘holdings’.
Because the subscription limits are tax year based, ISA statistics are analysed using income tax years (running 6th April to the following 5th April).
Adult ISAs
ISAs initially comprised three types of account: cash, stocks and shares, and life insurance. Insurance ISAs enabled savers to invest with insurance companies in funds offering potential for higher returns than cash ISAs at lower risk than stocks and shares ISAs. However there was a relatively low uptake for these accounts and the separate life insurance ISA was abolished in April 2005.
Between 1999 and 2008 there was a distinction between mini and maxi ISAs.
The maxi ISA was aimed at individuals who wanted mainly to invest in stocks and shares, and were subject to an annual subscription limit of £7,000. However, individuals were allowed to combine cash with stocks and shares, as long as the entire package was offered by the same ISA manager. There was a £3,000 limit on the cash element. In practice many maxi ISA managers did not offer a cash option so maxi ISAs tended to be heavily weighted towards stocks and shares.
The mini ISA was principally targeted at savers who wanted to hold some of their money in an account which paid interest (mini cash ISAs), although individuals were allowed to hold a mini cash ISA, a mini stocks and shares ISA, and between 1999-00 and 2004-05 a mini insurance ISA.
Following a comprehensive review, changes to ISAs were announced in July 2007. From April 2008 the mini/maxi distinction was abolished in favour of a simple cash and stocks and shares distinction with an overall limit on the amount that could be invested in any one tax year, and rules concerning the maximum that could be invested in cash.
Since the review, the main features of ISAs are as follows:
There are three main types of ISA - cash ISA, stocks and shares ISA, and innovative finance ISA;
In each tax year individuals may subscribe to separate cash, stocks and shares, and innovative finance ISAs;
There is no income tax to pay on the income received from ISA savings and investments, nor is there any tax to be paid on capital gains arising from ISA investments;
Individuals have the right to access their investment at any time and there are no statutory lock-in periods;
Each ISA manager must offer the ISA holder the opportunity to transfer their account to another manager. Funds invested in a stocks and shares ISA can only be transferred to another stocks
1 https://www.gov.uk/government/statistics/main-tax-expenditures-and-structural-reliefs
Individual Savings Account (ISA) Statistics, April 2018
HM Revenue and Customs
7
and shares ISA; however funds invested in a cash ISA can be transferred either to a stocks and shares ISA or another cash ISA;
Investments in approved life products can be held in either a cash ISA or a stocks and shares ISA;
There is no life time limit on the amount that can be saved in an ISA (other than the annual subscription limit) or on the amount of income that can be earned tax free.
Junior ISAs
Junior ISA accounts have been available since 1 November 2011 to children under the age of 18 who do not own a Child Trust Fund account (available to eligible children born on or between 1 September 2002 and 2 January 2011). Unlike an Adult ISA the savings in a Junior ISA account cannot be withdrawn until the child reaches 18. Only then can the savings either be withdrawn or the balance transferred into an Adult ISA. Adult cash ISAs are available to children from the age of 16, and eligible children can hold both a cash Junior ISA as well as an Adult cash ISA from that age. Children can open a cash as well as a stocks and shares account.
Help to Buy: ISAs
The Help to Buy: ISA scheme was launched on 1 December 2015 with accounts available through banks, building societies and credit unions. The scheme enables people saving for their first home to receive a 25% bonus to their savings from the government when they buy a property of £250,000 or less (£450,000 in London). This means that for every £200 saved, first-time buyers can receive a government bonus of £50. The maximum government bonus is £3,000.
The scheme will be open to new savers until 30 November 2019, though Help to Buy: ISA account holders can continue saving into their account until 30 November 2029. The Help to Buy: ISA government bonus must be claimed by 1 December 2030.
Help to Buy: ISAs are included within these statistics under cash subscriptions and market values, but the information is not separated out. This is because it is not captured in the methodology. Further information on the methodology of these statistics can be found in ‘Section 4: Data, methodology and publication timeline’. For official statistics on the Help to Buy: ISA scheme specifically, please refer to the GOV.UK website at:
https://www.gov.uk/government/collections/official-statistics-on-the-help-to-buy-isa-scheme.
Lifetime ISAs
The Lifetime ISA was announced at Budget 2016 and became available in April 2017. People who are under the age of 40 can open a Lifetime ISA and save up to £4,000 per year. The government will then top this amount up by 25%. This means that for people who save the maximum each year, the government will top up the account with £1,000, paid at the end of the tax year.
Lifetime ISA funds can be put toward a deposit for a home that is worth a maximum of £450,000 in all areas of the UK, or taken at age 60 to be used as retirement income.
ISA limits
ISA limits remained unchanged between the personal tax years of 1999-00 and 2007-08, and with the exception of the jump in 2010-11 have since increased annually in line with inflation until changes announced in Budget 2014.
For the tax year starting 6th April 2014 but prior to 1st July 2014 the limit on the amount that could be subscribed into a combination of an Adult stocks & shares ISA and/or cash ISA was set at £11,880, providing that the amount subscribed into a cash ISA did not exceed £5,940.
From 1st July 2014 all ISAs became New ISAs (NISAs). The NISA offers flexibility to save the NISA annual allowance of £15,000 in cash, stocks and shares or any combination of the two. Under the NISA
Individual Savings Account (ISA) Statistics, April 2018
HM Revenue and Customs
8
rules savers can transfer previous years’ ISA savings freely between stocks and shares and cash if they wish.
Therefore from 1st July 2014, savers have been able to split the amount they subscribe into an ISA between a Cash ISA and a Stocks and Shares ISA as they choose - up to the new overall annual ISA limit. The limit was increased to £15,240 for the 2015-16 tax year, from £15,000 in 2014-15, and remained at this limit for 2016-17. The ISA limit for 2017-18 is £20,000.
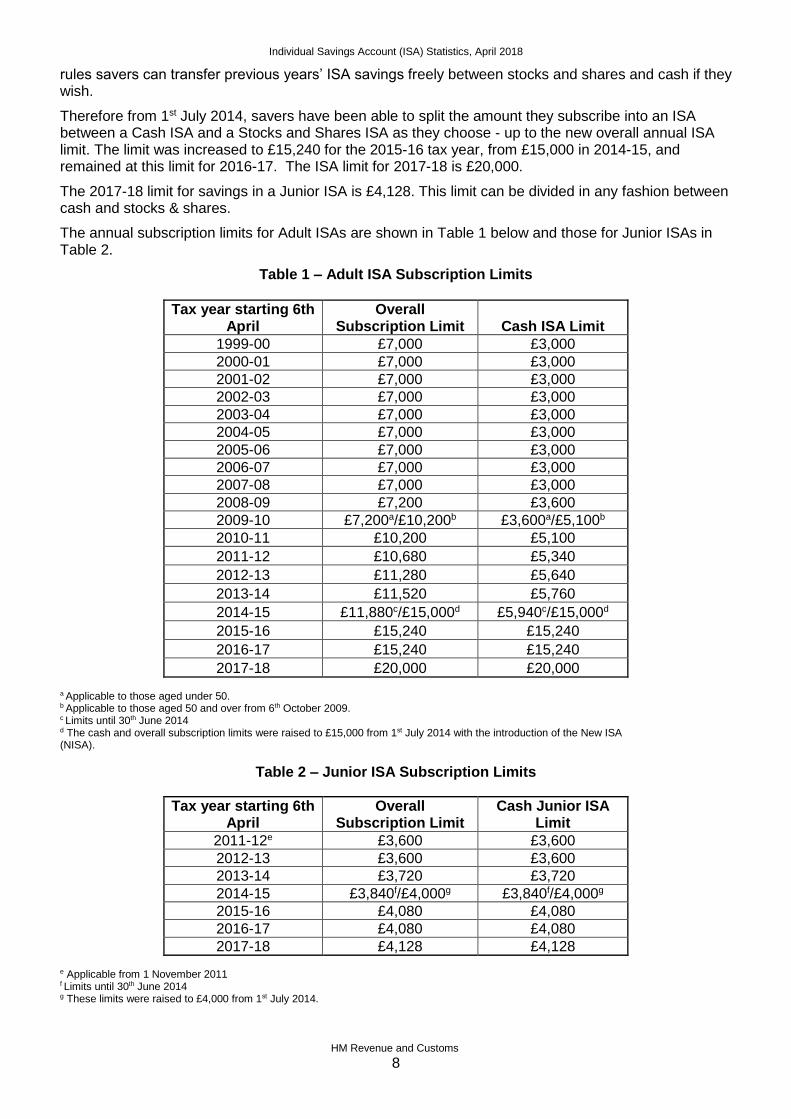
The 2017-18 limit for savings in a Junior ISA is £4,128. This limit can be divided in any fashion between cash and stocks & shares.
The annual subscription limits for Adult ISAs are shown in Table 1 below and those for Junior ISAs in Table 2.
Table 1 – Adult ISA Subscription Limits
Tax year starting 6th April
Overall Subscription Limit Cash ISA Limit
1999-00 £7,000 £3,000
2000-01 £7,000 £3,000
2001-02 £7,000 £3,000
2002-03 £7,000 £3,000
2003-04 £7,000 £3,000
2004-05 £7,000 £3,000
2005-06 £7,000 £3,000
2006-07 £7,000 £3,000
2007-08 £7,000 £3,000
2008-09 £7,200 £3,600
2009-10 £7,200a/£10,200b £3,600a/£5,100b
2010-11 £10,200 £5,100
2011-12 £10,680 £5,340
2012-13 £11,280 £5,640
2013-14 £11,520 £5,760
2014-15 £11,880c/£15,000d £5,940c/£15,000d
2015-16 £15,240 £15,240
2016-17 £15,240 £15,240
2017-18 £20,000 £20,000
a Applicable to those aged under 50. b Applicable to those aged 50 and over from 6th October 2009. c Limits until 30th June 2014 d The cash and overall subscription limits were raised to £15,000 from 1st July 2014 with the introduction of the New ISA (NISA).
Table 2 – Junior ISA Subscription Limits
Tax year starting 6th April
Overall Subscription Limit
Cash Junior ISA Limit
2011-12e £3,600 £3,600
2012-13 £3,600 £3,600
2013-14 £3,720 £3,720
2014-15 £3,840f/£4,000g £3,840f/£4,000g
2015-16 £4,080 £4,080
2016-17 £4,080 £4,080
2017-18 £4,128 £4,128 e Applicable from 1 November 2011 f Limits until 30th June 2014 g These limits were raised to £4,000 from 1st July 2014.
Individual Savings Account (ISA) Statistics, April 2018
HM Revenue and Customs
9
Section 2 – Commentary and analysis
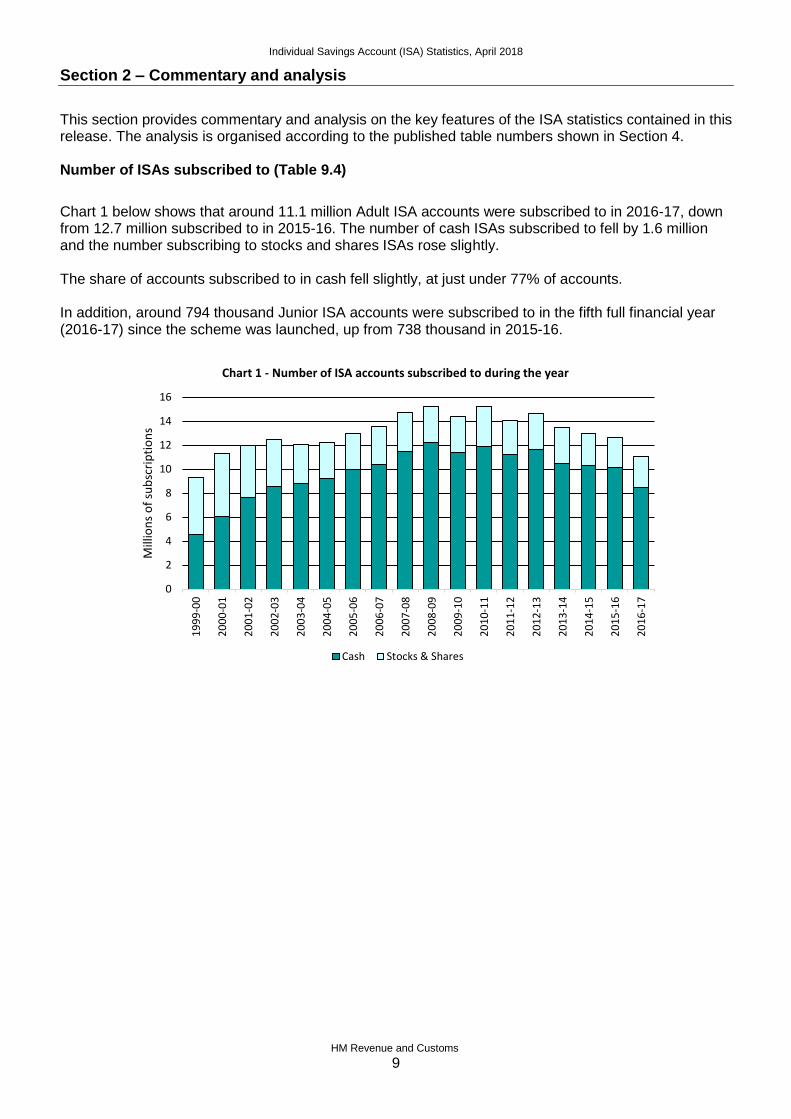
This section provides commentary and analysis on the key features of the ISA statistics contained in this release. The analysis is organised according to the published table numbers shown in Section 4. Number of ISAs subscribed to (Table 9.4)
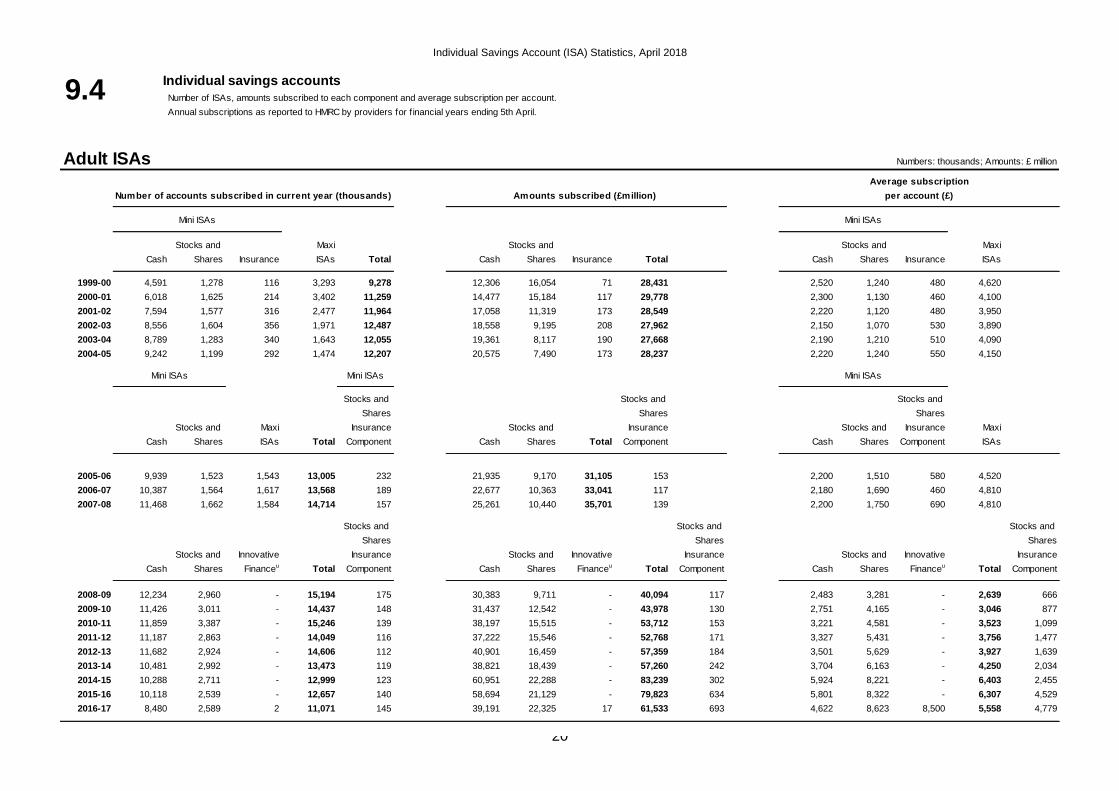
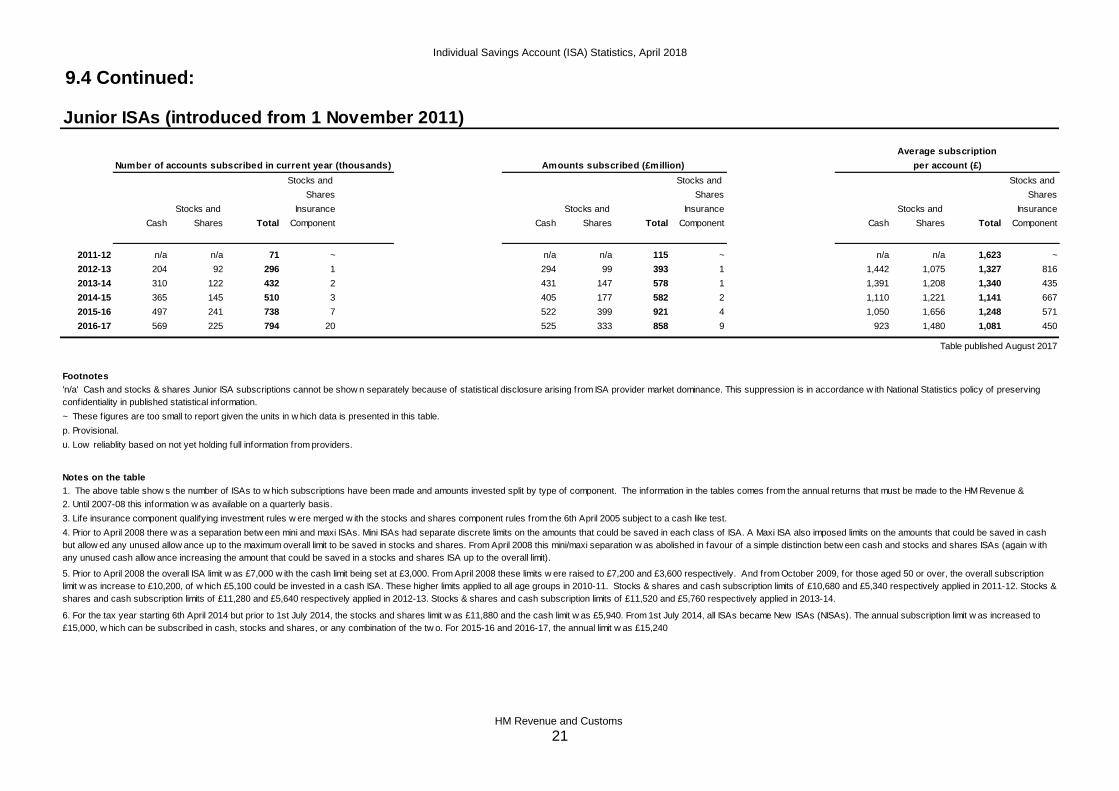
Chart 1 below shows that around 11.1 million Adult ISA accounts were subscribed to in 2016-17, down from 12.7 million subscribed to in 2015-16. The number of cash ISAs subscribed to fell by 1.6 million and the number subscribing to stocks and shares ISAs rose slightly. The share of accounts subscribed to in cash fell slightly, at just under 77% of accounts. In addition, around 794 thousand Junior ISA accounts were subscribed to in the fifth full financial year (2016-17) since the scheme was launched, up from 738 thousand in 2015-16.
0
2
4
6
8
10
12
14
16
19
99
-00
20
00
-01
20
01
-02
20
02
-03
20
03
-04
20
04
-05
20
05
-06
20
06
-07
20
07
-08
20
08
-09
20
09
-10
20
10
-11
20
11
-12
20
12
-13
20
13
-14
20
14
-15
20
15
-16
20
16
-17
Mill
ion
s o
f su
bsc
rip
tio
ns
Chart 1 - Number of ISA accounts subscribed to during the year
Cash Stocks & Shares
Individual Savings Account (ISA) Statistics, April 2018
HM Revenue and Customs
10
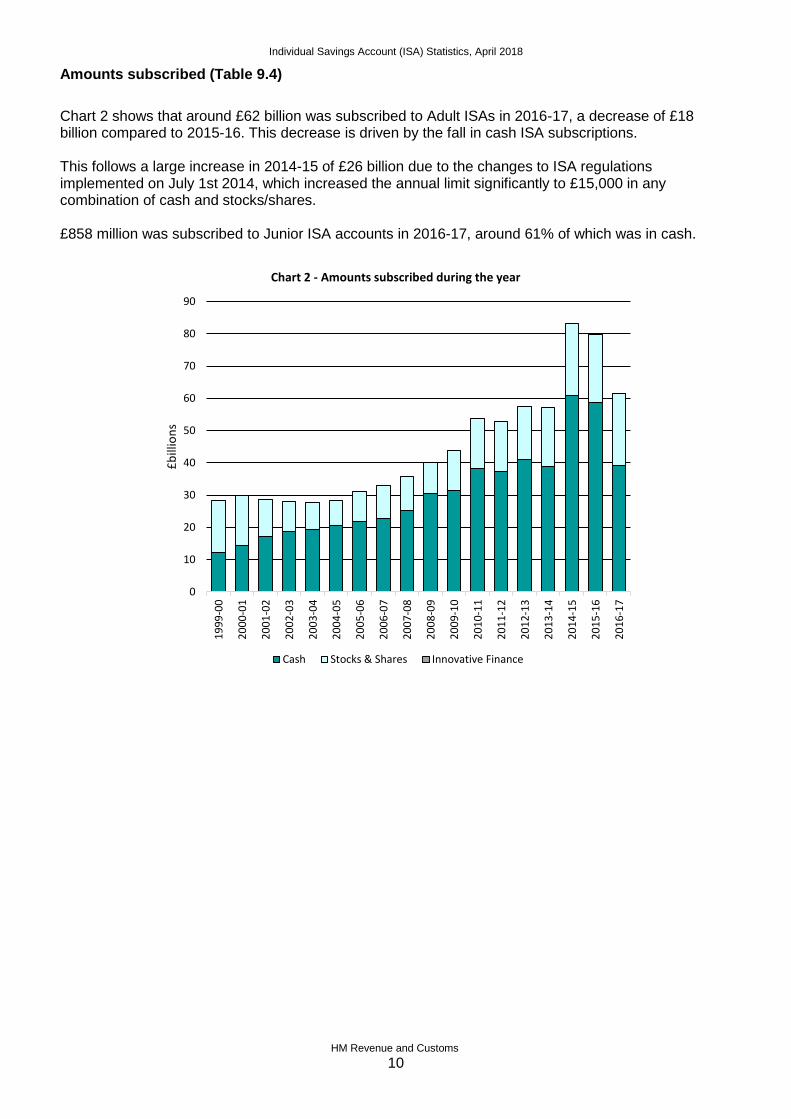
Amounts subscribed (Table 9.4)
Chart 2 shows that around £62 billion was subscribed to Adult ISAs in 2016-17, a decrease of £18 billion compared to 2015-16. This decrease is driven by the fall in cash ISA subscriptions. This follows a large increase in 2014-15 of £26 billion due to the changes to ISA regulations implemented on July 1st 2014, which increased the annual limit significantly to £15,000 in any combination of cash and stocks/shares. £858 million was subscribed to Junior ISA accounts in 2016-17, around 61% of which was in cash.
0
10
20
30
40
50
60
70
80
90
19
99
-00
20
00
-01
20
01
-02
20
02
-03
20
03
-04
20
04
-05
20
05
-06
20
06
-07
20
07
-08
20
08
-09
20
09
-10
20
10
-11
20
11
-12
20
12
-13
20
13
-14
20
14
-15
20
15
-16
20
16
-17
£b
illio
ns
Chart 2 - Amounts subscribed during the year
Cash Stocks & Shares Innovative Finance
Individual Savings Account (ISA) Statistics, April 2018
HM Revenue and Customs
11
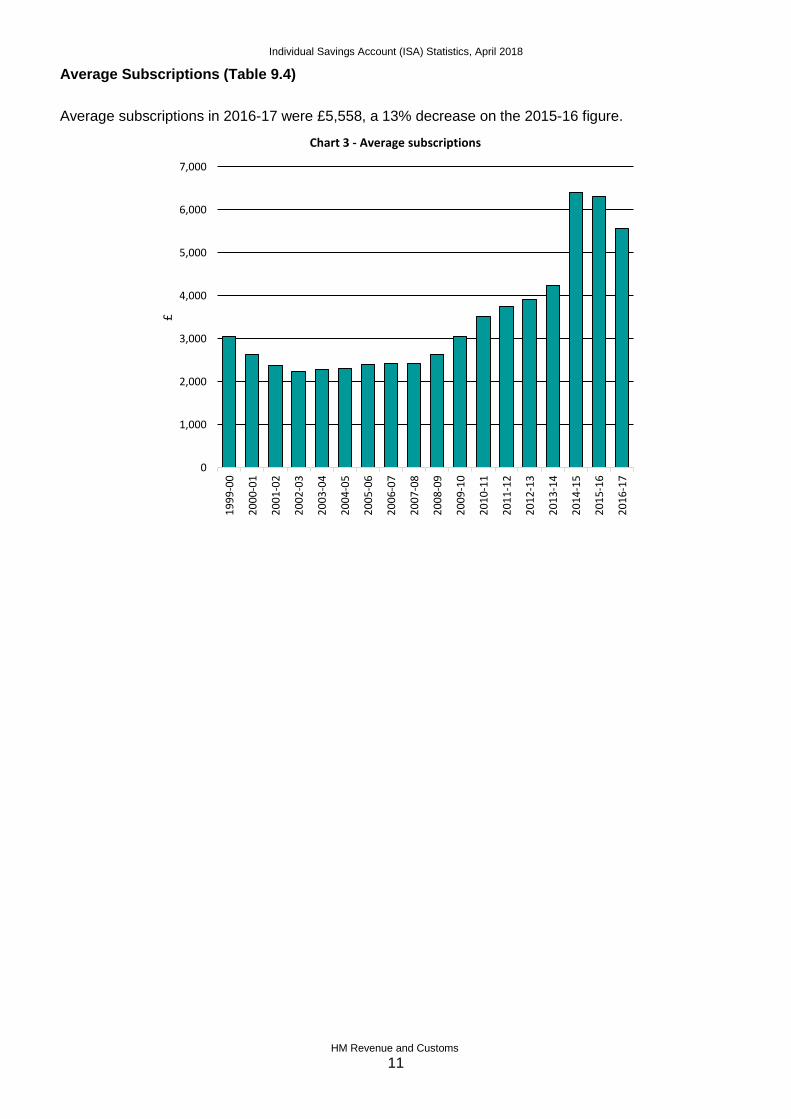
Average Subscriptions (Table 9.4)
Average subscriptions in 2016-17 were £5,558, a 13% decrease on the 2015-16 figure.
0
1,000
2,000
3,000
4,000
5,000
6,000
7,000
19
99
-00
20
00
-01
20
01
-02
20
02
-03
20
03
-04
20
04
-05
20
05
-06
20
06
-07
20
07
-08
20
08
-09
20
09
-10
20
10
-11
20
11
-12
20
12
-13
20
13
-14
20
14
-15
20
15
-16
20
16
-17
£
Chart 3 - Average subscriptions
Individual Savings Account (ISA) Statistics, April 2018
HM Revenue and Customs
12
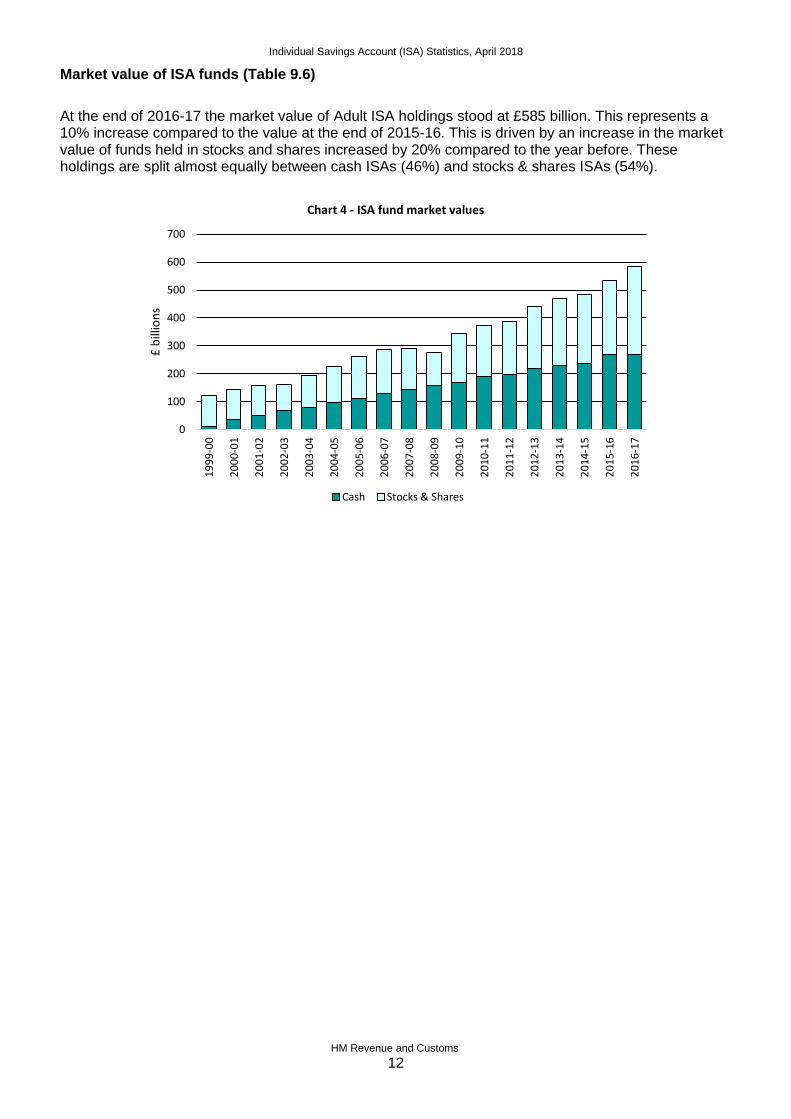
Market value of ISA funds (Table 9.6)
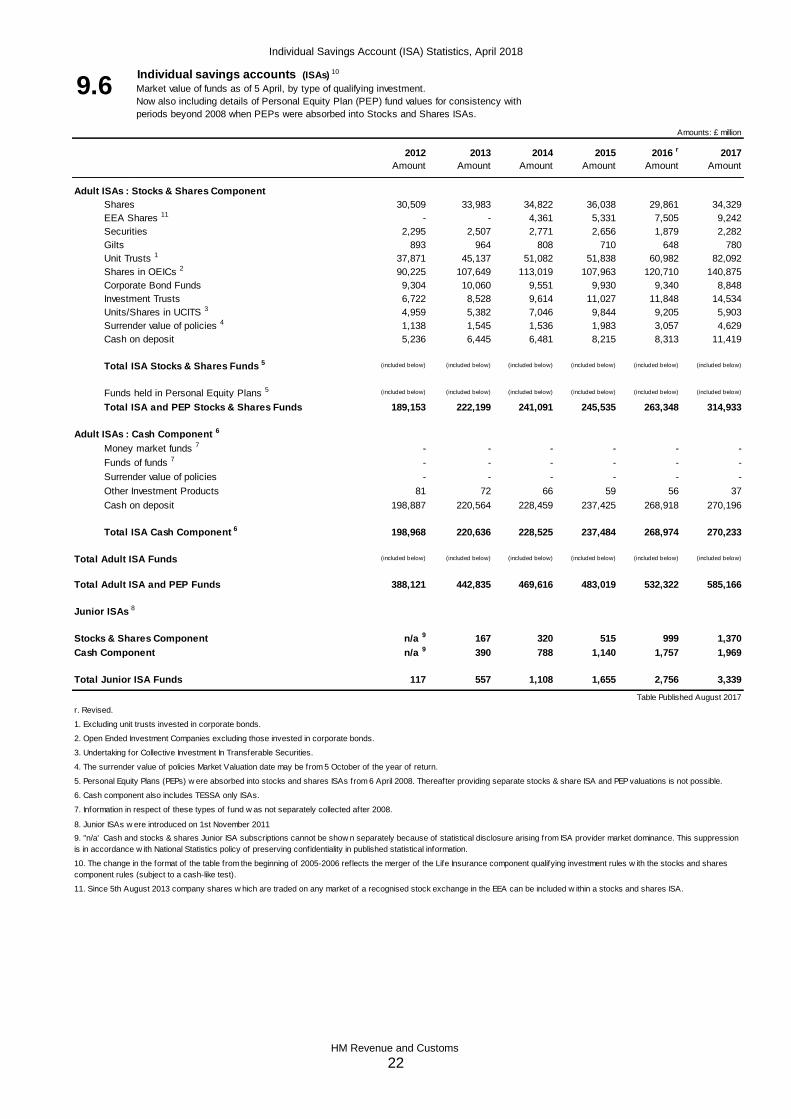
At the end of 2016-17 the market value of Adult ISA holdings stood at £585 billion. This represents a 10% increase compared to the value at the end of 2015-16. This is driven by an increase in the market value of funds held in stocks and shares increased by 20% compared to the year before. These holdings are split almost equally between cash ISAs (46%) and stocks & shares ISAs (54%).
0
100
200
300
400
500
600
700
19
99
-00
20
00
-01
20
01
-02
20
02
-03
20
03
-04
20
04
-05
20
05
-06
20
06
-07
20
07
-08
20
08
-09
20
09
-10
20
10
-11
20
11
-12
20
12
-13
20
13
-14
20
14
-15
20
15
-16
20
16
-17
£ b
illio
ns
Chart 4 - ISA fund market values
Cash Stocks & Shares
Individual Savings Account (ISA) Statistics, April 2018
HM Revenue and Customs
13
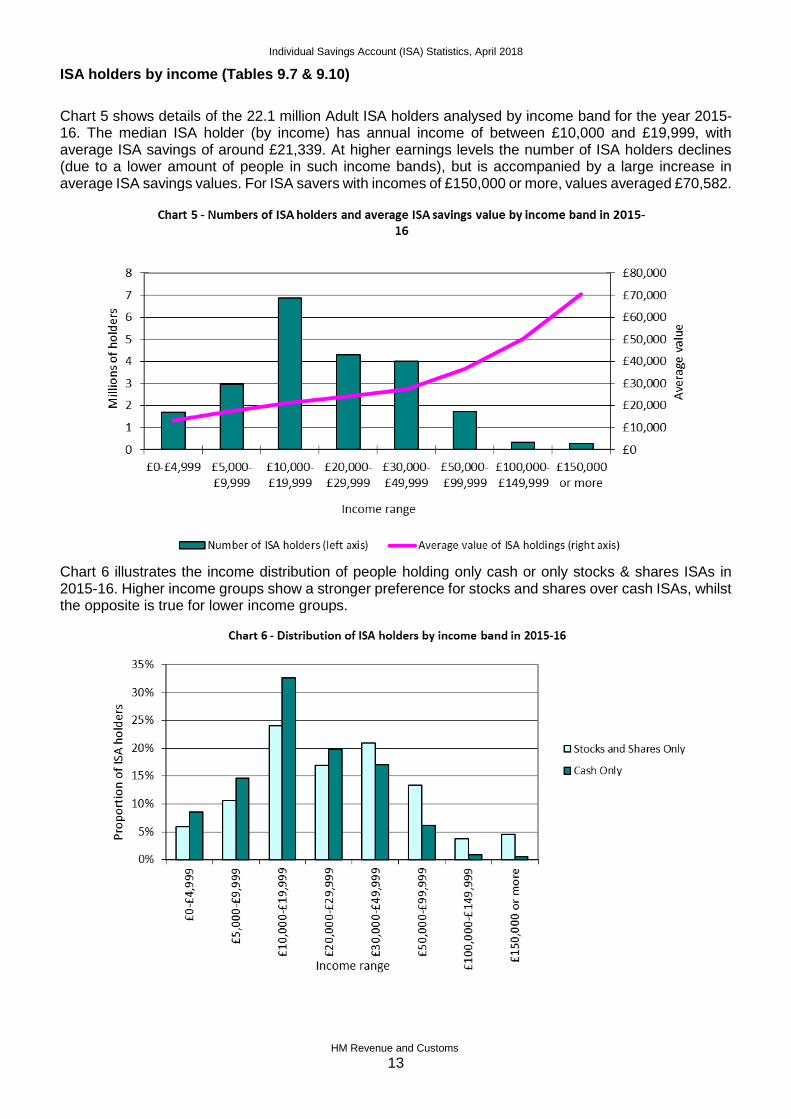
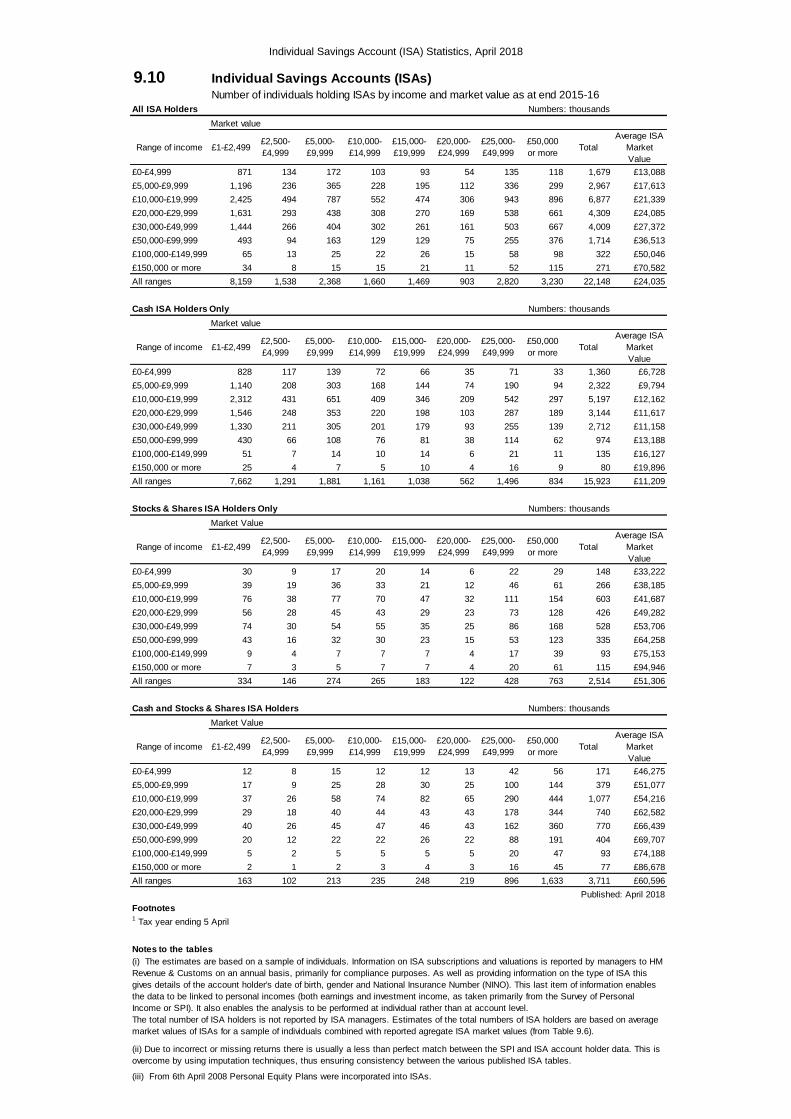
ISA holders by income (Tables 9.7 & 9.10)
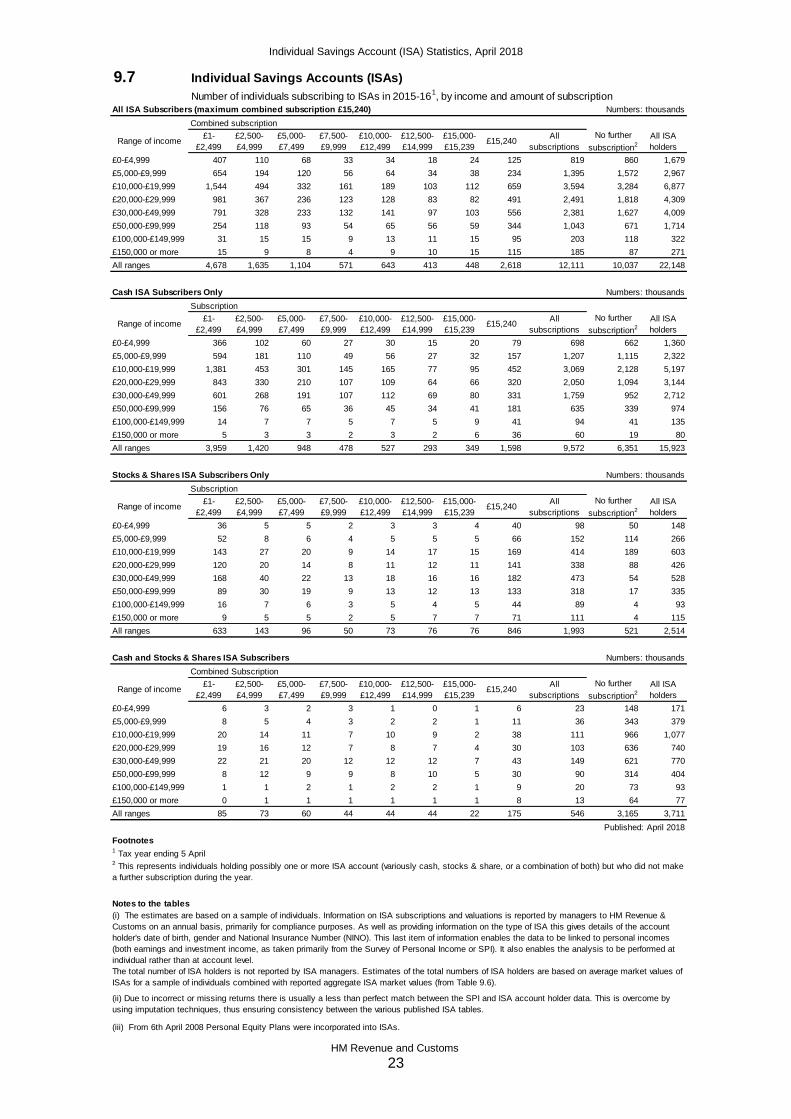
Chart 5 shows details of the 22.1 million Adult ISA holders analysed by income band for the year 2015-16. The median ISA holder (by income) has annual income of between £10,000 and £19,999, with average ISA savings of around £21,339. At higher earnings levels the number of ISA holders declines (due to a lower amount of people in such income bands), but is accompanied by a large increase in average ISA savings values. For ISA savers with incomes of £150,000 or more, values averaged £70,582.
Chart 6 illustrates the income distribution of people holding only cash or only stocks & shares ISAs in 2015-16. Higher income groups show a stronger preference for stocks and shares over cash ISAs, whilst the opposite is true for lower income groups.
Individual Savings Account (ISA) Statistics, April 2018
HM Revenue and Customs
14
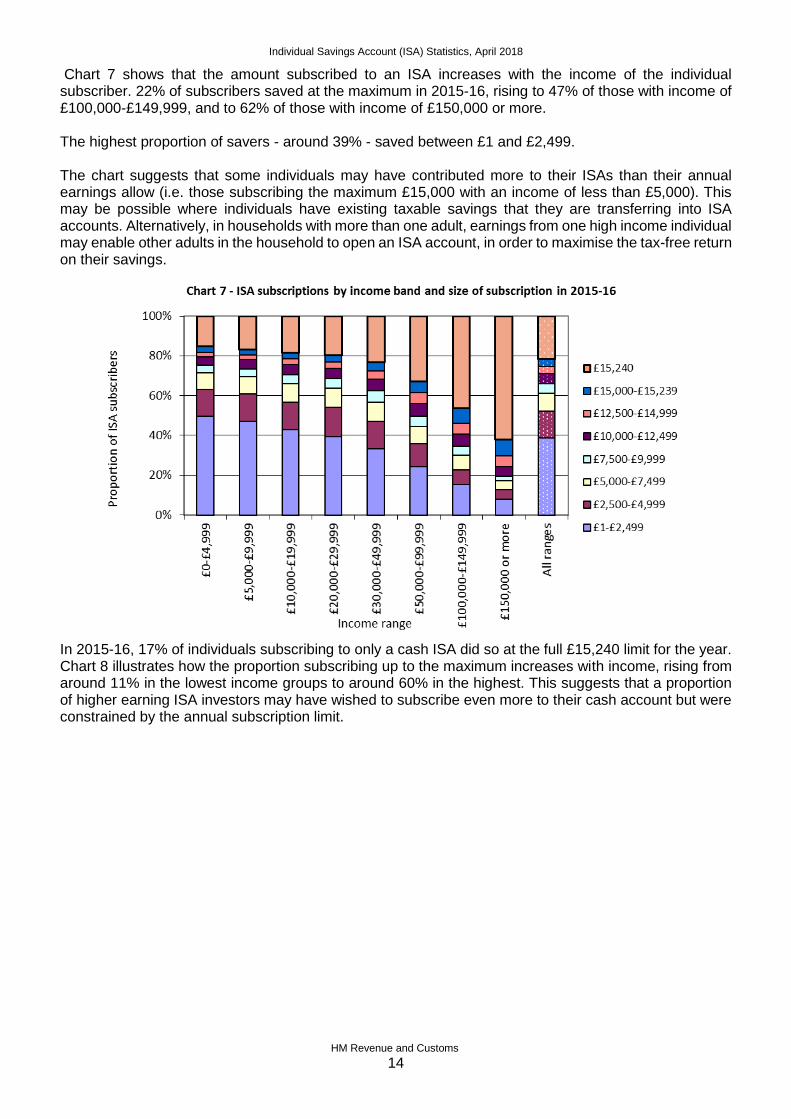
Chart 7 shows that the amount subscribed to an ISA increases with the income of the individual subscriber. 22% of subscribers saved at the maximum in 2015-16, rising to 47% of those with income of £100,000-£149,999, and to 62% of those with income of £150,000 or more. The highest proportion of savers - around 39% - saved between £1 and £2,499. The chart suggests that some individuals may have contributed more to their ISAs than their annual earnings allow (i.e. those subscribing the maximum £15,000 with an income of less than £5,000). This may be possible where individuals have existing taxable savings that they are transferring into ISA accounts. Alternatively, in households with more than one adult, earnings from one high income individual may enable other adults in the household to open an ISA account, in order to maximise the tax-free return on their savings.
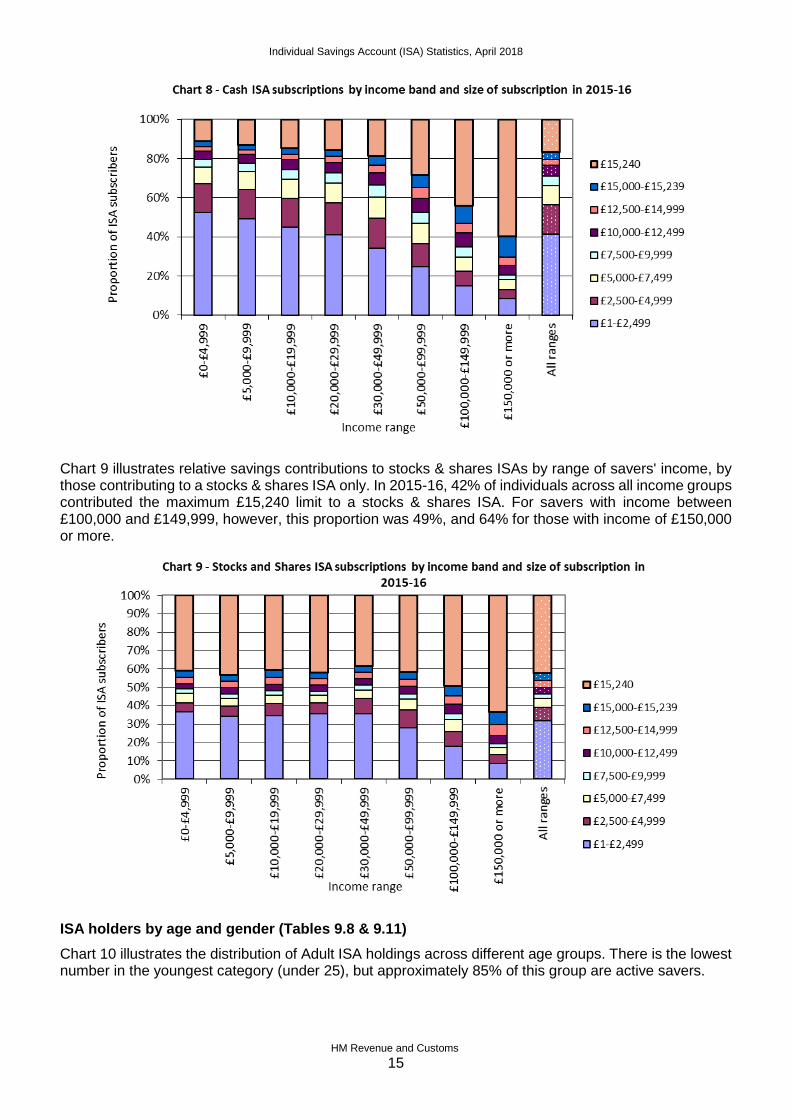
In 2015-16, 17% of individuals subscribing to only a cash ISA did so at the full £15,240 limit for the year. Chart 8 illustrates how the proportion subscribing up to the maximum increases with income, rising from around 11% in the lowest income groups to around 60% in the highest. This suggests that a proportion of higher earning ISA investors may have wished to subscribe even more to their cash account but were constrained by the annual subscription limit.
Individual Savings Account (ISA) Statistics, April 2018
HM Revenue and Customs
15
Chart 9 illustrates relative savings contributions to stocks & shares ISAs by range of savers' income, by those contributing to a stocks & shares ISA only. In 2015-16, 42% of individuals across all income groups contributed the maximum £15,240 limit to a stocks & shares ISA. For savers with income between £100,000 and £149,999, however, this proportion was 49%, and 64% for those with income of £150,000 or more.
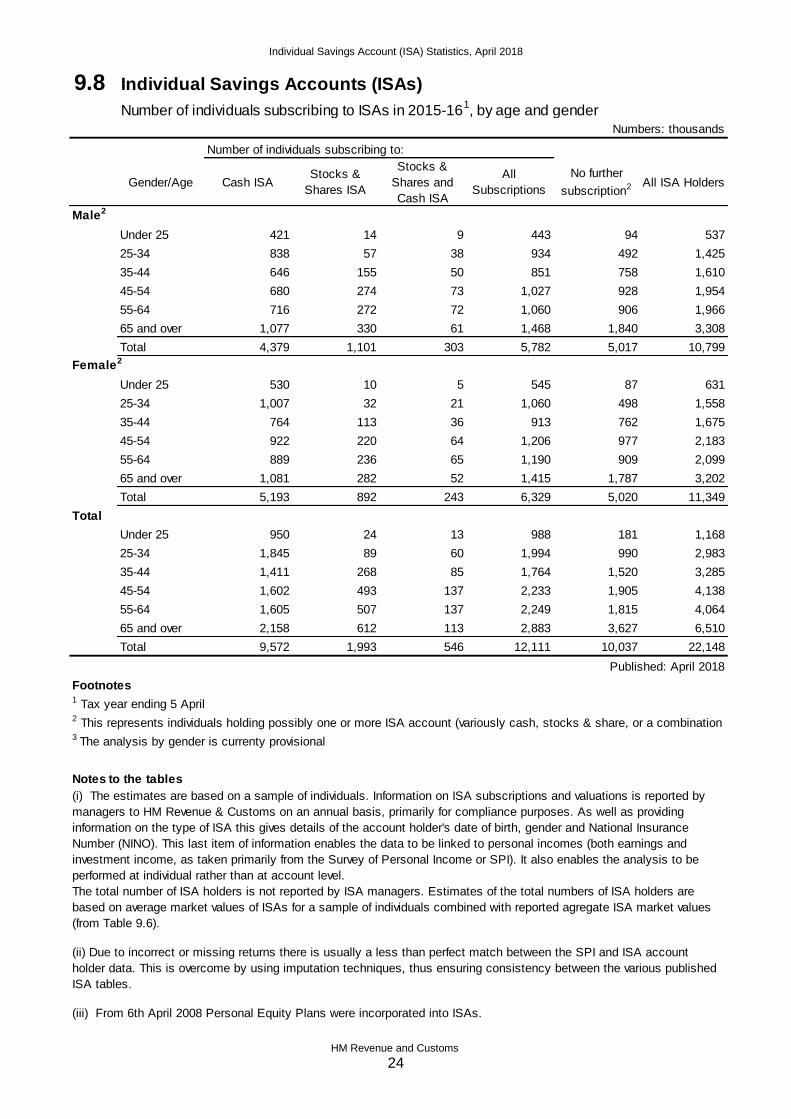
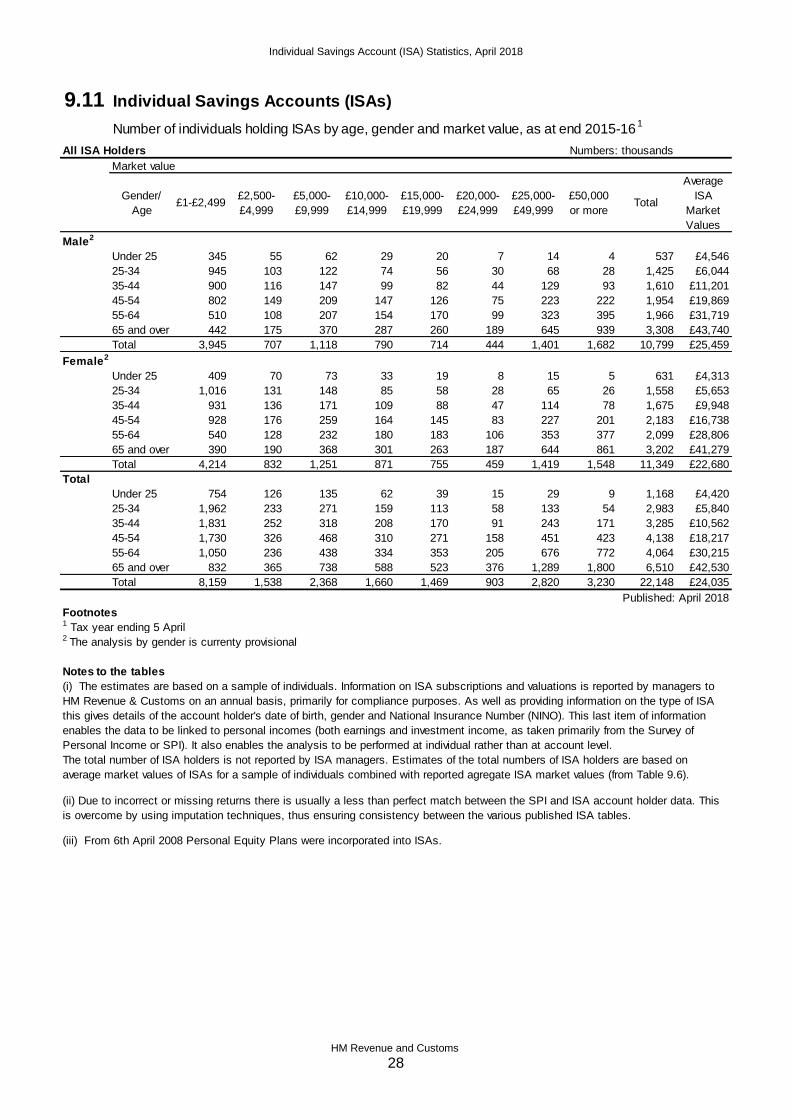
ISA holders by age and gender (Tables 9.8 & 9.11)
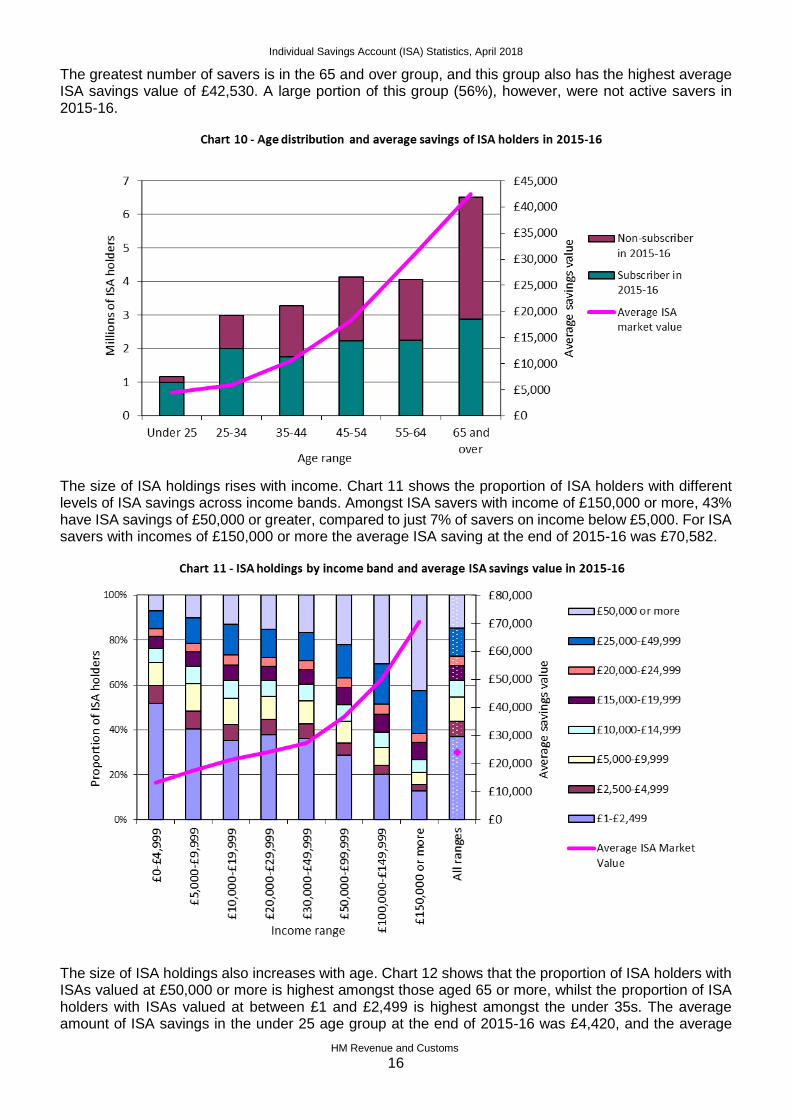
Chart 10 illustrates the distribution of Adult ISA holdings across different age groups. There is the lowest number in the youngest category (under 25), but approximately 85% of this group are active savers.
Individual Savings Account (ISA) Statistics, April 2018
HM Revenue and Customs
16
The greatest number of savers is in the 65 and over group, and this group also has the highest average ISA savings value of £42,530. A large portion of this group (56%), however, were not active savers in 2015-16.
The size of ISA holdings rises with income. Chart 11 shows the proportion of ISA holders with different levels of ISA savings across income bands. Amongst ISA savers with income of £150,000 or more, 43% have ISA savings of £50,000 or greater, compared to just 7% of savers on income below £5,000. For ISA savers with incomes of £150,000 or more the average ISA saving at the end of 2015-16 was £70,582.
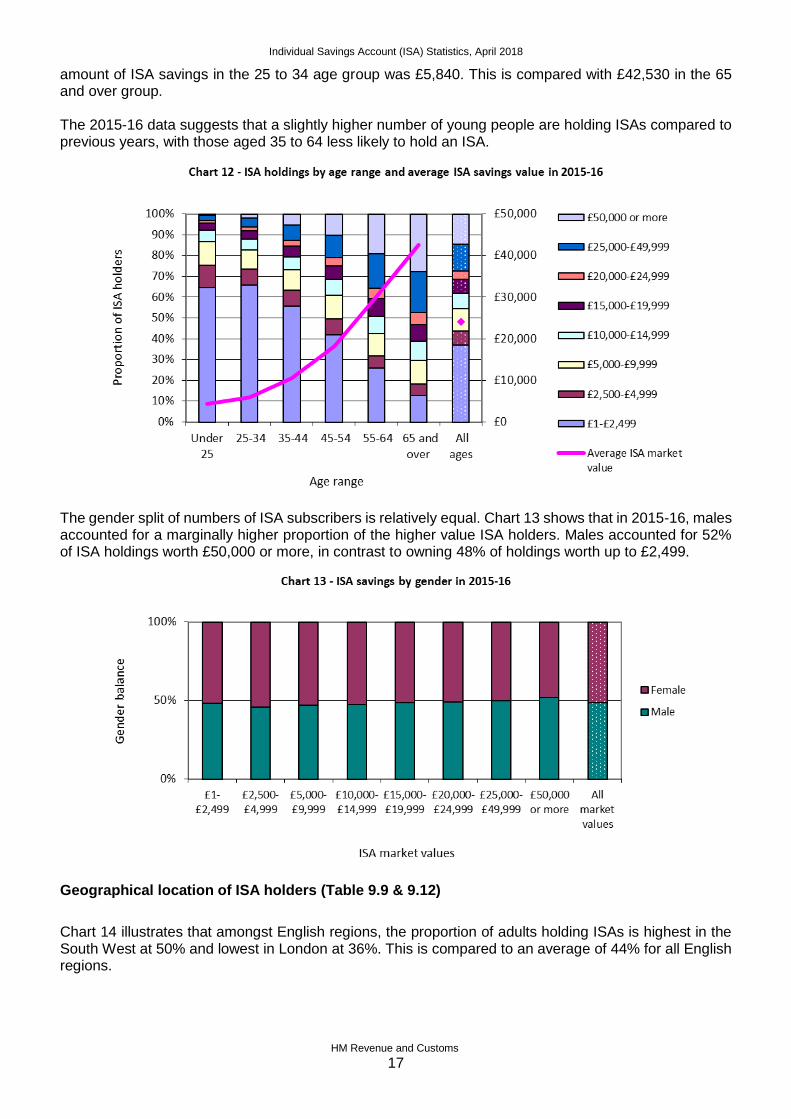
The size of ISA holdings also increases with age. Chart 12 shows that the proportion of ISA holders with ISAs valued at £50,000 or more is highest amongst those aged 65 or more, whilst the proportion of ISA holders with ISAs valued at between £1 and £2,499 is highest amongst the under 35s. The average amount of ISA savings in the under 25 age group at the end of 2015-16 was £4,420, and the average
Individual Savings Account (ISA) Statistics, April 2018
HM Revenue and Customs
17
amount of ISA savings in the 25 to 34 age group was £5,840. This is compared with £42,530 in the 65 and over group. The 2015-16 data suggests that a slightly higher number of young people are holding ISAs compared to previous years, with those aged 35 to 64 less likely to hold an ISA.
The gender split of numbers of ISA subscribers is relatively equal. Chart 13 shows that in 2015-16, males accounted for a marginally higher proportion of the higher value ISA holders. Males accounted for 52% of ISA holdings worth £50,000 or more, in contrast to owning 48% of holdings worth up to £2,499.
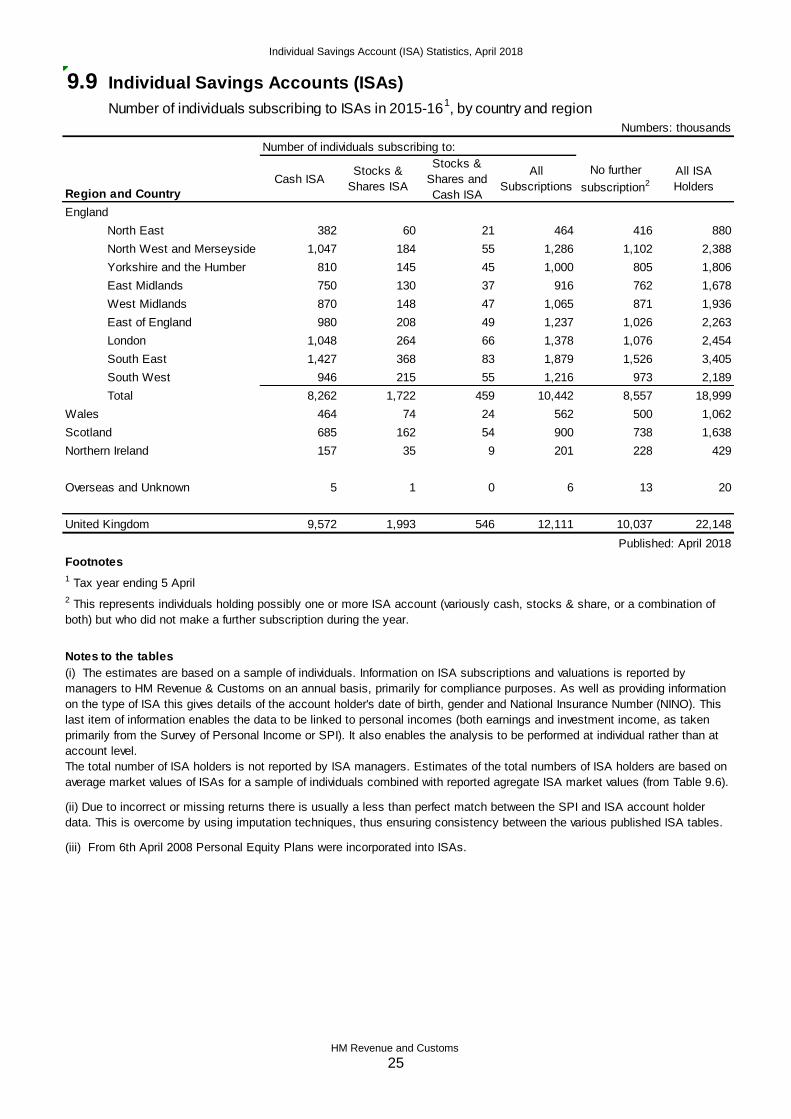
Geographical location of ISA holders (Table 9.9 & 9.12)
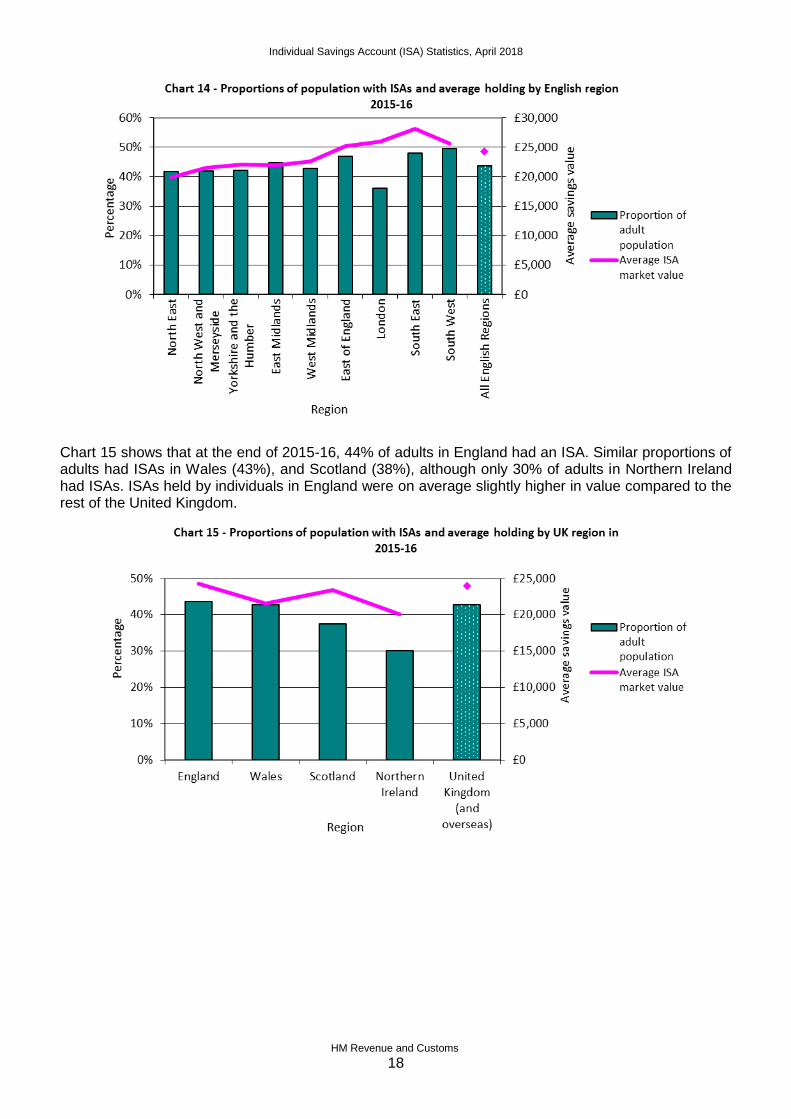
Chart 14 illustrates that amongst English regions, the proportion of adults holding ISAs is highest in the South West at 50% and lowest in London at 36%. This is compared to an average of 44% for all English regions.
Individual Savings Account (ISA) Statistics, April 2018
HM Revenue and Customs
18
Chart 15 shows that at the end of 2015-16, 44% of adults in England had an ISA. Similar proportions of adults had ISAs in Wales (43%), and Scotland (38%), although only 30% of adults in Northern Ireland had ISAs. ISAs held by individuals in England were on average slightly higher in value compared to the rest of the United Kingdom.
Individual Savings Account (ISA) Statistics, April 2018
HM Revenue and Customs
19
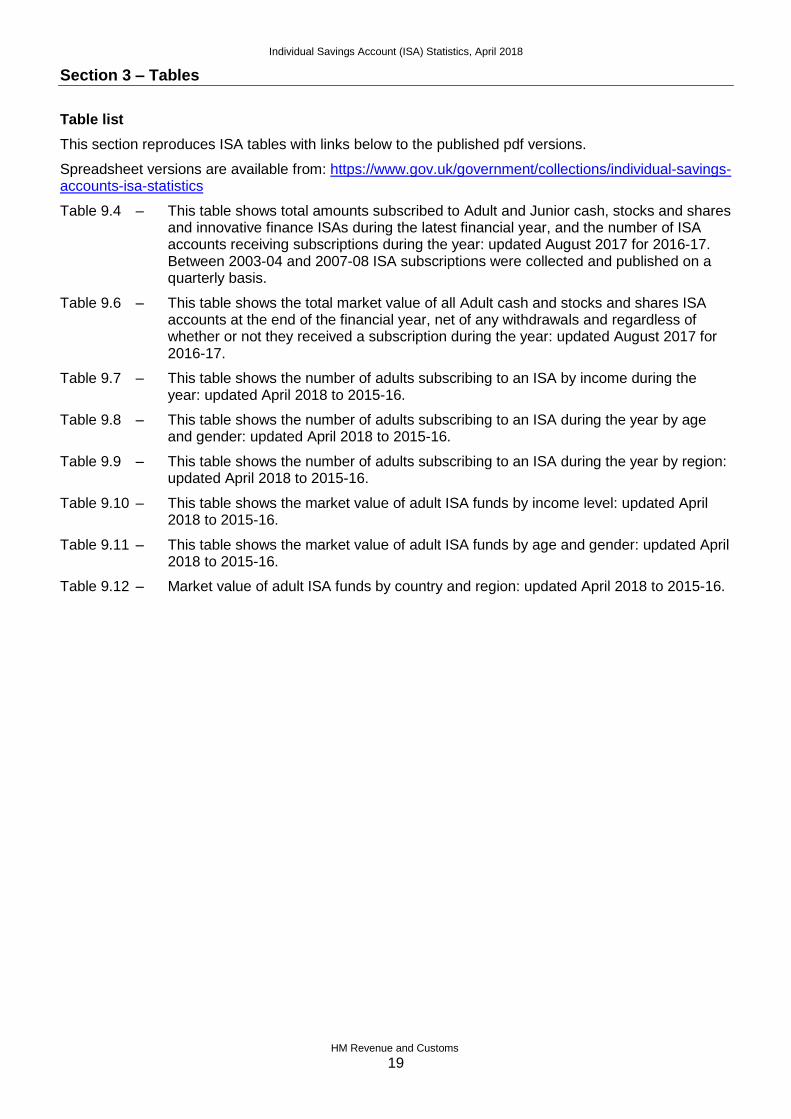
Section 3 – Tables
Table list
This section reproduces ISA tables with links below to the published pdf versions.
Spreadsheet versions are available from: https://www.gov.uk/government/collections/individual-savings-accounts-isa-statistics
Table 9.4 – This table shows total amounts subscribed to Adult and Junior cash, stocks and shares and innovative finance ISAs during the latest financial year, and the number of ISA accounts receiving subscriptions during the year: updated August 2017 for 2016-17. Between 2003-04 and 2007-08 ISA subscriptions were collected and published on a quarterly basis.
Table 9.6 – This table shows the total market value of all Adult cash and stocks and shares ISA accounts at the end of the financial year, net of any withdrawals and regardless of whether or not they received a subscription during the year: updated August 2017 for 2016-17.
Table 9.7 – This table shows the number of adults subscribing to an ISA by income during the year: updated April 2018 to 2015-16.
Table 9.8 – This table shows the number of adults subscribing to an ISA during the year by age and gender: updated April 2018 to 2015-16.
Table 9.9 – This table shows the number of adults subscribing to an ISA during the year by region: updated April 2018 to 2015-16.
Table 9.10 – This table shows the market value of adult ISA funds by income level: updated April 2018 to 2015-16.
Table 9.11 – This table shows the market value of adult ISA funds by age and gender: updated April 2018 to 2015-16.
Table 9.12 – Market value of adult ISA funds by country and region: updated April 2018 to 2015-16.
Individual Savings Account (ISA) Statistics, April 2018
HM Revenue and Customs
20
Individual savings accounts
Number of ISAs, amounts subscribed to each component and average subscription per account.
Annual subscriptions as reported to HMRC by providers for f inancial years ending 5th April.
Adult ISAs Numbers: thousands; Amounts: £ million
Stocks and Maxi Stocks and Stocks and Maxi
Cash Shares Insurance ISAs Total Cash Shares Insurance Total Cash Shares Insurance ISAs
1999-00 4,591 1,278 116 3,293 9,278 12,306 16,054 71 28,431 2,520 1,240 480 4,620
2000-01 6,018 1,625 214 3,402 11,259 14,477 15,184 117 29,778 2,300 1,130 460 4,100
2001-02 7,594 1,577 316 2,477 11,964 17,058 11,319 173 28,549 2,220 1,120 480 3,950
2002-03 8,556 1,604 356 1,971 12,487 18,558 9,195 208 27,962 2,150 1,070 530 3,890
2003-04 8,789 1,283 340 1,643 12,055 19,361 8,117 190 27,668 2,190 1,210 510 4,090
2004-05 9,242 1,199 292 1,474 12,207 20,575 7,490 173 28,237 2,220 1,240 550 4,150
Mini ISAs
Stocks and Stocks and Stocks and
Shares Shares Shares
Stocks and Maxi Insurance Stocks and Insurance Stocks and Insurance Maxi
Cash Shares ISAs Total Component Cash Shares Total Component Cash Shares Component ISAs
2005-06 9,939 1,523 1,543 13,005 232 21,935 9,170 31,105 153 2,200 1,510 580 4,520
2006-07 10,387 1,564 1,617 13,568 189 22,677 10,363 33,041 117 2,180 1,690 460 4,810
2007-08 11,468 1,662 1,584 14,714 157 25,261 10,440 35,701 139 2,200 1,750 690 4,810
Stocks and Stocks and Stocks and
Shares Shares Shares
Stocks and Innovative Insurance Stocks and Innovative Insurance Stocks and Innovative Insurance
Cash Shares Financeu Total Component Cash Shares Financeu Total Component Cash Shares Financeu Total Component
2008-09 12,234 2,960 - 15,194 175 30,383 9,711 - 40,094 117 2,483 3,281 - 2,639 666
2009-10 11,426 3,011 - 14,437 148 31,437 12,542 - 43,978 130 2,751 4,165 - 3,046 877
2010-11 11,859 3,387 - 15,246 139 38,197 15,515 - 53,712 153 3,221 4,581 - 3,523 1,099
2011-12 11,187 2,863 - 14,049 116 37,222 15,546 - 52,768 171 3,327 5,431 - 3,756 1,477
2012-13 11,682 2,924 - 14,606 112 40,901 16,459 - 57,359 184 3,501 5,629 - 3,927 1,639
2013-14 10,481 2,992 - 13,473 119 38,821 18,439 - 57,260 242 3,704 6,163 - 4,250 2,034
2014-15 10,288 2,711 - 12,999 123 60,951 22,288 - 83,239 302 5,924 8,221 - 6,403 2,455
2015-16 10,118 2,539 - 12,657 140 58,694 21,129 - 79,823 634 5,801 8,322 - 6,307 4,529
2016-17 8,480 2,589 2 11,071 145 39,191 22,325 17 61,533 693 4,622 8,623 8,500 5,558 4,779
Mini ISAs
Number of accounts subscribed in current year (thousands) Amounts subscribed (£million) per account (£)
Average subscription
Mini ISAs
Mini ISAs Mini ISAs
9.4
Individual Savings Account (ISA) Statistics, April 2018
HM Revenue and Customs
21
9.4 Continued:
Junior ISAs (introduced from 1 November 2011)
Stocks and Stocks and Stocks and
Shares Shares Shares
Stocks and Insurance Stocks and Insurance Stocks and Insurance
Cash Shares Total Component Cash Shares Total Component Cash Shares Total Component
2011-12 n/a n/a 71 ~ n/a n/a 115 ~ n/a n/a 1,623 ~
2012-13 204 92 296 1 294 99 393 1 1,442 1,075 1,327 816
2013-14 310 122 432 2 431 147 578 1 1,391 1,208 1,340 435
2014-15 365 145 510 3 405 177 582 2 1,110 1,221 1,141 667
2015-16 497 241 738 7 522 399 921 4 1,050 1,656 1,248 571
2016-17 569 225 794 20 525 333 858 9 923 1,480 1,081 450
Table published August 2017
Footnotes
p. Provisional.
u. Low reliablity based on not yet holding full information from providers.
Notes on the table
Average subscription
Number of accounts subscribed in current year (thousands) Amounts subscribed (£million) per account (£)
5. Prior to April 2008 the overall ISA limit w as £7,000 w ith the cash limit being set at £3,000. From April 2008 these limits w ere raised to £7,200 and £3,600 respectively. And from October 2009, for those aged 50 or over, the overall subscription
limit w as increase to £10,200, of w hich £5,100 could be invested in a cash ISA. These higher limits applied to all age groups in 2010-11. Stocks & shares and cash subscription limits of £10,680 and £5,340 respectively applied in 2011-12. Stocks &
shares and cash subscription limits of £11,280 and £5,640 respectively applied in 2012-13. Stocks & shares and cash subscription limits of £11,520 and £5,760 respectively applied in 2013-14.
6. For the tax year starting 6th April 2014 but prior to 1st July 2014, the stocks and shares limit w as £11,880 and the cash limit w as £5,940. From 1st July 2014, all ISAs became New ISAs (NISAs). The annual subscription limit w as increased to
£15,000, w hich can be subscribed in cash, stocks and shares, or any combination of the tw o. For 2015-16 and 2016-17, the annual limit w as £15,240
'n/a' Cash and stocks & shares Junior ISA subscriptions cannot be show n separately because of statistical disclosure arising from ISA provider market dominance. This suppression is in accordance w ith National Statistics policy of preserving
confidentiality in published statistical information.
~ These figures are too small to report given the units in w hich data is presented in this table.
1. The above table show s the number of ISAs to w hich subscriptions have been made and amounts invested split by type of component. The information in the tables comes from the annual returns that must be made to the HM Revenue &
2. Until 2007-08 this information w as available on a quarterly basis.
3. Life insurance component qualifying investment rules w ere merged w ith the stocks and shares component rules from the 6th April 2005 subject to a cash like test.
4. Prior to April 2008 there w as a separation betw een mini and maxi ISAs. Mini ISAs had separate discrete limits on the amounts that could be saved in each class of ISA. A Maxi ISA also imposed limits on the amounts that could be saved in cash
but allow ed any unused allow ance up to the maximum overall limit to be saved in stocks and shares. From April 2008 this mini/maxi separation w as abolished in favour of a simple distinction betw een cash and stocks and shares ISAs (again w ith
any unused cash allow ance increasing the amount that could be saved in a stocks and shares ISA up to the overall limit).
Individual Savings Account (ISA) Statistics, April 2018
HM Revenue and Customs
22
Individual savings accounts (ISAs) 10
Market value of funds as of 5 April, by type of qualifying investment.
Now also including details of Personal Equity Plan (PEP) fund values for consistency with
periods beyond 2008 when PEPs were absorbed into Stocks and Shares ISAs.
Amounts: £ million
2012 2013 2014 2015 2016 r 2017
Amount Amount Amount Amount Amount Amount
Adult ISAs : Stocks & Shares Component
Shares 30,509 33,983 34,822 36,038 29,861 34,329
EEA Shares 11 - - 4,361 5,331 7,505 9,242
Securities 2,295 2,507 2,771 2,656 1,879 2,282
Gilts 893 964 808 710 648 780
Unit Trusts 1 37,871 45,137 51,082 51,838 60,982 82,092
Shares in OEICs 2 90,225 107,649 113,019 107,963 120,710 140,875
Corporate Bond Funds 9,304 10,060 9,551 9,930 9,340 8,848
Investment Trusts 6,722 8,528 9,614 11,027 11,848 14,534
Units/Shares in UCITS 3 4,959 5,382 7,046 9,844 9,205 5,903
Surrender value of policies 4 1,138 1,545 1,536 1,983 3,057 4,629
Cash on deposit 5,236 6,445 6,481 8,215 8,313 11,419
Total ISA Stocks & Shares Funds 5 (included below) (included below) (included below) (included below) (included below) (included below)
Funds held in Personal Equity Plans 5 (included below) (included below) (included below) (included below) (included below) (included below)
Total ISA and PEP Stocks & Shares Funds 189,153 222,199 241,091 245,535 263,348 314,933
Adult ISAs : Cash Component 6
Money market funds 7 - - - - - -
Funds of funds 7 - - - - - -
Surrender value of policies - - - - - -
Other Investment Products 81 72 66 59 56 37
Cash on deposit 198,887 220,564 228,459 237,425 268,918 270,196
Total ISA Cash Component 6 198,968 220,636 228,525 237,484 268,974 270,233
Total Adult ISA Funds (included below) (included below) (included below) (included below) (included below) (included below)
Total Adult ISA and PEP Funds 388,121 442,835 469,616 483,019 532,322 585,166
Junior ISAs 8
Stocks & Shares Component n/a 9 167 320 515 999 1,370
Cash Component n/a 9 390 788 1,140 1,757 1,969
Total Junior ISA Funds 117 557 1,108 1,655 2,756 3,339
Table Published August 2017
8. Junior ISAs w ere introduced on 1st November 2011
11. Since 5th August 2013 company shares w hich are traded on any market of a recognised stock exchange in the EEA can be included w ithin a stocks and shares ISA.
r. Revised.
1. Excluding unit trusts invested in corporate bonds.
2. Open Ended Investment Companies excluding those invested in corporate bonds.
3. Undertaking for Collective Investment In Transferable Securities.
4. The surrender value of policies Market Valuation date may be from 5 October of the year of return.
5. Personal Equity Plans (PEPs) w ere absorbed into stocks and shares ISAs from 6 April 2008. Thereafter providing separate stocks & share ISA and PEP valuations is not possible.
6. Cash component also includes TESSA only ISAs.
7. Information in respect of these types of fund w as not separately collected after 2008.
9. ''n/a' Cash and stocks & shares Junior ISA subscriptions cannot be show n separately because of statistical disclosure arising from ISA provider market dominance. This suppression
is in accordance w ith National Statistics policy of preserving confidentiality in published statistical information.
10. The change in the format of the table from the beginning of 2005-2006 reflects the merger of the Life Insurance component qualifying investment rules w ith the stocks and shares
component rules (subject to a cash-like test).
9.6
Individual Savings Account (ISA) Statistics, April 2018
HM Revenue and Customs
23
9.7 Individual Savings Accounts (ISAs)
Number of individuals subscribing to ISAs in 2015-161, by income and amount of subscription
All ISA Subscribers (maximum combined subscription £15,240) Numbers: thousands
Combined subscription
Range of income£1-
£2,499
£2,500-
£4,999
£5,000-
£7,499
£7,500-
£9,999
£10,000-
£12,499
£12,500-
£14,999
£15,000-
£15,239£15,240
All
subscriptions
No further
subscription2
All ISA
holders
£0-£4,999 407 110 68 33 34 18 24 125 819 860 1,679
£5,000-£9,999 654 194 120 56 64 34 38 234 1,395 1,572 2,967
£10,000-£19,999 1,544 494 332 161 189 103 112 659 3,594 3,284 6,877
£20,000-£29,999 981 367 236 123 128 83 82 491 2,491 1,818 4,309
£30,000-£49,999 791 328 233 132 141 97 103 556 2,381 1,627 4,009
£50,000-£99,999 254 118 93 54 65 56 59 344 1,043 671 1,714
£100,000-£149,999 31 15 15 9 13 11 15 95 203 118 322
£150,000 or more 15 9 8 4 9 10 15 115 185 87 271
All ranges 4,678 1,635 1,104 571 643 413 448 2,618 12,111 10,037 22,148
Cash ISA Subscribers Only Numbers: thousands
Subscription
Range of income£1-
£2,499
£2,500-
£4,999
£5,000-
£7,499
£7,500-
£9,999
£10,000-
£12,499
£12,500-
£14,999
£15,000-
£15,239£15,240
All
subscriptions
No further
subscription2
All ISA
holders
£0-£4,999 366 102 60 27 30 15 20 79 698 662 1,360
£5,000-£9,999 594 181 110 49 56 27 32 157 1,207 1,115 2,322
£10,000-£19,999 1,381 453 301 145 165 77 95 452 3,069 2,128 5,197
£20,000-£29,999 843 330 210 107 109 64 66 320 2,050 1,094 3,144
£30,000-£49,999 601 268 191 107 112 69 80 331 1,759 952 2,712
£50,000-£99,999 156 76 65 36 45 34 41 181 635 339 974
£100,000-£149,999 14 7 7 5 7 5 9 41 94 41 135
£150,000 or more 5 3 3 2 3 2 6 36 60 19 80
All ranges 3,959 1,420 948 478 527 293 349 1,598 9,572 6,351 15,923
Stocks & Shares ISA Subscribers Only Numbers: thousands
Subscription
Range of income£1-
£2,499
£2,500-
£4,999
£5,000-
£7,499
£7,500-
£9,999
£10,000-
£12,499
£12,500-
£14,999
£15,000-
£15,239£15,240
All
subscriptions
No further
subscription2
All ISA
holders
£0-£4,999 36 5 5 2 3 3 4 40 98 50 148
£5,000-£9,999 52 8 6 4 5 5 5 66 152 114 266
£10,000-£19,999 143 27 20 9 14 17 15 169 414 189 603
£20,000-£29,999 120 20 14 8 11 12 11 141 338 88 426
£30,000-£49,999 168 40 22 13 18 16 16 182 473 54 528
£50,000-£99,999 89 30 19 9 13 12 13 133 318 17 335
£100,000-£149,999 16 7 6 3 5 4 5 44 89 4 93
£150,000 or more 9 5 5 2 5 7 7 71 111 4 115
All ranges 633 143 96 50 73 76 76 846 1,993 521 2,514
Cash and Stocks & Shares ISA Subscribers Numbers: thousands
Combined Subscription
Range of income£1-
£2,499
£2,500-
£4,999
£5,000-
£7,499
£7,500-
£9,999
£10,000-
£12,499
£12,500-
£14,999
£15,000-
£15,239£15,240
All
subscriptions
No further
subscription2
All ISA
holders
£0-£4,999 6 3 2 3 1 0 1 6 23 148 171
£5,000-£9,999 8 5 4 3 2 2 1 11 36 343 379
£10,000-£19,999 20 14 11 7 10 9 2 38 111 966 1,077
£20,000-£29,999 19 16 12 7 8 7 4 30 103 636 740
£30,000-£49,999 22 21 20 12 12 12 7 43 149 621 770
£50,000-£99,999 8 12 9 9 8 10 5 30 90 314 404
£100,000-£149,999 1 1 2 1 2 2 1 9 20 73 93
£150,000 or more 0 1 1 1 1 1 1 8 13 64 77
All ranges 85 73 60 44 44 44 22 175 546 3,165 3,711
Published: April 2018
Footnotes
Notes to the tables
1 Tax year ending 5 April2 This represents individuals holding possibly one or more ISA account (variously cash, stocks & share, or a combination of both) but who did not make
a further subscription during the year.
(i) The estimates are based on a sample of individuals. Information on ISA subscriptions and valuations is reported by managers to HM Revenue &
Customs on an annual basis, primarily for compliance purposes. As well as providing information on the type of ISA this gives details of the account
holder's date of birth, gender and National Insurance Number (NINO). This last item of information enables the data to be linked to personal incomes
(both earnings and investment income, as taken primarily from the Survey of Personal Income or SPI). It also enables the analysis to be performed at
individual rather than at account level.
The total number of ISA holders is not reported by ISA managers. Estimates of the total numbers of ISA holders are based on average market values of
ISAs for a sample of individuals combined with reported aggregate ISA market values (from Table 9.6).
(ii) Due to incorrect or missing returns there is usually a less than perfect match between the SPI and ISA account holder data. This is overcome by
using imputation techniques, thus ensuring consistency between the various published ISA tables.
(iii) From 6th April 2008 Personal Equity Plans were incorporated into ISAs.
Individual Savings Account (ISA) Statistics, April 2018
HM Revenue and Customs
24
9.8 Individual Savings Accounts (ISAs)
Number of individuals subscribing to ISAs in 2015-161, by age and gender
Numbers: thousands
Number of individuals subscribing to:
Gender/Age Cash ISAStocks &
Shares ISA
Stocks &
Shares and
Cash ISA
All
Subscriptions
No further
subscription2 All ISA Holders
Male2
Under 25 421 14 9 443 94 537
25-34 838 57 38 934 492 1,425
35-44 646 155 50 851 758 1,610
45-54 680 274 73 1,027 928 1,954
55-64 716 272 72 1,060 906 1,966
65 and over 1,077 330 61 1,468 1,840 3,308
Total 4,379 1,101 303 5,782 5,017 10,799
Female2
Under 25 530 10 5 545 87 631
25-34 1,007 32 21 1,060 498 1,558
35-44 764 113 36 913 762 1,675
45-54 922 220 64 1,206 977 2,183
55-64 889 236 65 1,190 909 2,099
65 and over 1,081 282 52 1,415 1,787 3,202
Total 5,193 892 243 6,329 5,020 11,349
Total
Under 25 950 24 13 988 181 1,168
25-34 1,845 89 60 1,994 990 2,983
35-44 1,411 268 85 1,764 1,520 3,285
45-54 1,602 493 137 2,233 1,905 4,138
55-64 1,605 507 137 2,249 1,815 4,064
65 and over 2,158 612 113 2,883 3,627 6,510
Total 9,572 1,993 546 12,111 10,037 22,148
Published: April 2018
Footnotes
Notes to the tables
(iii) From 6th April 2008 Personal Equity Plans were incorporated into ISAs.
1 Tax year ending 5 April2 This represents individuals holding possibly one or more ISA account (variously cash, stocks & share, or a combination 3 The analysis by gender is currenty provisional
(i) The estimates are based on a sample of individuals. Information on ISA subscriptions and valuations is reported by
managers to HM Revenue & Customs on an annual basis, primarily for compliance purposes. As well as providing
information on the type of ISA this gives details of the account holder's date of birth, gender and National Insurance
Number (NINO). This last item of information enables the data to be linked to personal incomes (both earnings and
investment income, as taken primarily from the Survey of Personal Income or SPI). It also enables the analysis to be
performed at individual rather than at account level.
The total number of ISA holders is not reported by ISA managers. Estimates of the total numbers of ISA holders are
based on average market values of ISAs for a sample of individuals combined with reported agregate ISA market values
(from Table 9.6).
(ii) Due to incorrect or missing returns there is usually a less than perfect match between the SPI and ISA account
holder data. This is overcome by using imputation techniques, thus ensuring consistency between the various published
ISA tables.
Individual Savings Account (ISA) Statistics, April 2018
HM Revenue and Customs
25
9.9 Individual Savings Accounts (ISAs)
Number of individuals subscribing to ISAs in 2015-161, by country and region
Numbers: thousands
Number of individuals subscribing to:
Region and Country
Cash ISAStocks &
Shares ISA
Stocks &
Shares and
Cash ISA
All
Subscriptions
No further
subscription2
All ISA
Holders
England
North East 382 60 21 464 416 880
North West and Merseyside 1,047 184 55 1,286 1,102 2,388
Yorkshire and the Humber 810 145 45 1,000 805 1,806
East Midlands 750 130 37 916 762 1,678
West Midlands 870 148 47 1,065 871 1,936
East of England 980 208 49 1,237 1,026 2,263
London 1,048 264 66 1,378 1,076 2,454
South East 1,427 368 83 1,879 1,526 3,405
South West 946 215 55 1,216 973 2,189
Total 8,262 1,722 459 10,442 8,557 18,999
Wales 464 74 24 562 500 1,062
Scotland 685 162 54 900 738 1,638
Northern Ireland 157 35 9 201 228 429
Overseas and Unknown 5 1 0 6 13 20
United Kingdom 9,572 1,993 546 12,111 10,037 22,148
Published: April 2018
Footnotes
Notes to the tables
2 This represents individuals holding possibly one or more ISA account (variously cash, stocks & share, or a combination of
both) but who did not make a further subscription during the year.
(i) The estimates are based on a sample of individuals. Information on ISA subscriptions and valuations is reported by
managers to HM Revenue & Customs on an annual basis, primarily for compliance purposes. As well as providing information
on the type of ISA this gives details of the account holder's date of birth, gender and National Insurance Number (NINO). This
last item of information enables the data to be linked to personal incomes (both earnings and investment income, as taken
primarily from the Survey of Personal Income or SPI). It also enables the analysis to be performed at individual rather than at
account level.
The total number of ISA holders is not reported by ISA managers. Estimates of the total numbers of ISA holders are based on
average market values of ISAs for a sample of individuals combined with reported agregate ISA market values (from Table 9.6).
(ii) Due to incorrect or missing returns there is usually a less than perfect match between the SPI and ISA account holder
data. This is overcome by using imputation techniques, thus ensuring consistency between the various published ISA tables.
(iii) From 6th April 2008 Personal Equity Plans were incorporated into ISAs.
1 Tax year ending 5 April

Individual Savings Account (ISA) Statistics, April 2018
HM Revenue and Customs
26
Individual Savings Account (ISA) Statistics, April 2018
HM Revenue and Customs
27
9.10 Individual Savings Accounts (ISAs)
Number of individuals holding ISAs by income and market value as at end 2015-16
All ISA Holders Numbers: thousands
Market value
Range of income £1-£2,499£2,500-
£4,999
£5,000-
£9,999
£10,000-
£14,999
£15,000-
£19,999
£20,000-
£24,999
£25,000-
£49,999
£50,000
or moreTotal
Average ISA
Market
Value
£0-£4,999 871 134 172 103 93 54 135 118 1,679 £13,088
£5,000-£9,999 1,196 236 365 228 195 112 336 299 2,967 £17,613
£10,000-£19,999 2,425 494 787 552 474 306 943 896 6,877 £21,339
£20,000-£29,999 1,631 293 438 308 270 169 538 661 4,309 £24,085
£30,000-£49,999 1,444 266 404 302 261 161 503 667 4,009 £27,372
£50,000-£99,999 493 94 163 129 129 75 255 376 1,714 £36,513
£100,000-£149,999 65 13 25 22 26 15 58 98 322 £50,046
£150,000 or more 34 8 15 15 21 11 52 115 271 £70,582
All ranges 8,159 1,538 2,368 1,660 1,469 903 2,820 3,230 22,148 £24,035
Cash ISA Holders Only Numbers: thousands
Market value
Range of income £1-£2,499£2,500-
£4,999
£5,000-
£9,999
£10,000-
£14,999
£15,000-
£19,999
£20,000-
£24,999
£25,000-
£49,999
£50,000
or moreTotal
Average ISA
Market
Value
£0-£4,999 828 117 139 72 66 35 71 33 1,360 £6,728
£5,000-£9,999 1,140 208 303 168 144 74 190 94 2,322 £9,794
£10,000-£19,999 2,312 431 651 409 346 209 542 297 5,197 £12,162
£20,000-£29,999 1,546 248 353 220 198 103 287 189 3,144 £11,617
£30,000-£49,999 1,330 211 305 201 179 93 255 139 2,712 £11,158
£50,000-£99,999 430 66 108 76 81 38 114 62 974 £13,188
£100,000-£149,999 51 7 14 10 14 6 21 11 135 £16,127
£150,000 or more 25 4 7 5 10 4 16 9 80 £19,896
All ranges 7,662 1,291 1,881 1,161 1,038 562 1,496 834 15,923 £11,209
Stocks & Shares ISA Holders Only Numbers: thousands
Market Value
Range of income £1-£2,499£2,500-
£4,999
£5,000-
£9,999
£10,000-
£14,999
£15,000-
£19,999
£20,000-
£24,999
£25,000-
£49,999
£50,000
or moreTotal
Average ISA
Market
Value
£0-£4,999 30 9 17 20 14 6 22 29 148 £33,222
£5,000-£9,999 39 19 36 33 21 12 46 61 266 £38,185
£10,000-£19,999 76 38 77 70 47 32 111 154 603 £41,687
£20,000-£29,999 56 28 45 43 29 23 73 128 426 £49,282
£30,000-£49,999 74 30 54 55 35 25 86 168 528 £53,706
£50,000-£99,999 43 16 32 30 23 15 53 123 335 £64,258
£100,000-£149,999 9 4 7 7 7 4 17 39 93 £75,153
£150,000 or more 7 3 5 7 7 4 20 61 115 £94,946
All ranges 334 146 274 265 183 122 428 763 2,514 £51,306
Cash and Stocks & Shares ISA Holders Numbers: thousands
Market Value
Range of income £1-£2,499£2,500-
£4,999
£5,000-
£9,999
£10,000-
£14,999
£15,000-
£19,999
£20,000-
£24,999
£25,000-
£49,999
£50,000
or moreTotal
Average ISA
Market
Value
£0-£4,999 12 8 15 12 12 13 42 56 171 £46,275
£5,000-£9,999 17 9 25 28 30 25 100 144 379 £51,077
£10,000-£19,999 37 26 58 74 82 65 290 444 1,077 £54,216
£20,000-£29,999 29 18 40 44 43 43 178 344 740 £62,582
£30,000-£49,999 40 26 45 47 46 43 162 360 770 £66,439
£50,000-£99,999 20 12 22 22 26 22 88 191 404 £69,707
£100,000-£149,999 5 2 5 5 5 5 20 47 93 £74,188
£150,000 or more 2 1 2 3 4 3 16 45 77 £86,678
All ranges 163 102 213 235 248 219 896 1,633 3,711 £60,596
Published: April 2018
Footnotes
Notes to the tables
1 Tax year ending 5 April
(i) The estimates are based on a sample of individuals. Information on ISA subscriptions and valuations is reported by managers to HM
Revenue & Customs on an annual basis, primarily for compliance purposes. As well as providing information on the type of ISA this
gives details of the account holder's date of birth, gender and National Insurance Number (NINO). This last item of information enables
the data to be linked to personal incomes (both earnings and investment income, as taken primarily from the Survey of Personal
Income or SPI). It also enables the analysis to be performed at individual rather than at account level.
The total number of ISA holders is not reported by ISA managers. Estimates of the total numbers of ISA holders are based on average
market values of ISAs for a sample of individuals combined with reported agregate ISA market values (from Table 9.6).
(ii) Due to incorrect or missing returns there is usually a less than perfect match between the SPI and ISA account holder data. This is
overcome by using imputation techniques, thus ensuring consistency between the various published ISA tables.
(iii) From 6th April 2008 Personal Equity Plans were incorporated into ISAs.
Individual Savings Account (ISA) Statistics, April 2018
HM Revenue and Customs
28
9.11 Individual Savings Accounts (ISAs)
Number of individuals holding ISAs by age, gender and market value, as at end 2015-161
All ISA Holders Numbers: thousands
Market value
Gender/
Age£1-£2,499
£2,500-
£4,999
£5,000-
£9,999
£10,000-
£14,999
£15,000-
£19,999
£20,000-
£24,999
£25,000-
£49,999
£50,000
or moreTotal
Average
ISA
Market
Values
Male2
Under 25 345 55 62 29 20 7 14 4 537 £4,546
25-34 945 103 122 74 56 30 68 28 1,425 £6,044
35-44 900 116 147 99 82 44 129 93 1,610 £11,201
45-54 802 149 209 147 126 75 223 222 1,954 £19,869
55-64 510 108 207 154 170 99 323 395 1,966 £31,719
65 and over 442 175 370 287 260 189 645 939 3,308 £43,740
Total 3,945 707 1,118 790 714 444 1,401 1,682 10,799 £25,459
Female2
Under 25 409 70 73 33 19 8 15 5 631 £4,313
25-34 1,016 131 148 85 58 28 65 26 1,558 £5,653
35-44 931 136 171 109 88 47 114 78 1,675 £9,948
45-54 928 176 259 164 145 83 227 201 2,183 £16,738
55-64 540 128 232 180 183 106 353 377 2,099 £28,806
65 and over 390 190 368 301 263 187 644 861 3,202 £41,279
Total 4,214 832 1,251 871 755 459 1,419 1,548 11,349 £22,680
Total
Under 25 754 126 135 62 39 15 29 9 1,168 £4,420
25-34 1,962 233 271 159 113 58 133 54 2,983 £5,840
35-44 1,831 252 318 208 170 91 243 171 3,285 £10,562
45-54 1,730 326 468 310 271 158 451 423 4,138 £18,217
55-64 1,050 236 438 334 353 205 676 772 4,064 £30,215
65 and over 832 365 738 588 523 376 1,289 1,800 6,510 £42,530
Total 8,159 1,538 2,368 1,660 1,469 903 2,820 3,230 22,148 £24,035
Published: April 2018
Footnotes
Notes to the tables
1 Tax year ending 5 April2 The analysis by gender is currenty provisional
(i) The estimates are based on a sample of individuals. Information on ISA subscriptions and valuations is reported by managers to
HM Revenue & Customs on an annual basis, primarily for compliance purposes. As well as providing information on the type of ISA
this gives details of the account holder's date of birth, gender and National Insurance Number (NINO). This last item of information
enables the data to be linked to personal incomes (both earnings and investment income, as taken primarily from the Survey of
Personal Income or SPI). It also enables the analysis to be performed at individual rather than at account level.
The total number of ISA holders is not reported by ISA managers. Estimates of the total numbers of ISA holders are based on
average market values of ISAs for a sample of individuals combined with reported agregate ISA market values (from Table 9.6).
(ii) Due to incorrect or missing returns there is usually a less than perfect match between the SPI and ISA account holder data. This
is overcome by using imputation techniques, thus ensuring consistency between the various published ISA tables.
(iii) From 6th April 2008 Personal Equity Plans were incorporated into ISAs.
Individual Savings Account (ISA) Statistics, April 2018
HM Revenue and Customs
29
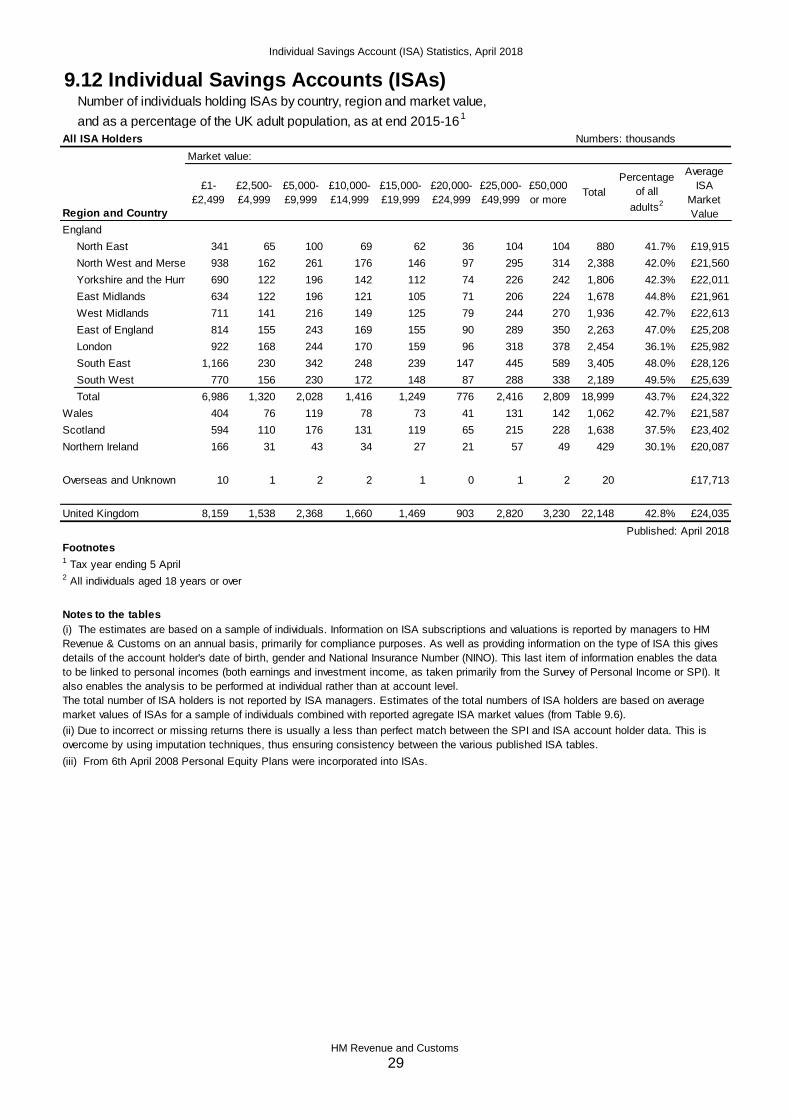
9.12 Individual Savings Accounts (ISAs)Number of individuals holding ISAs by country, region and market value,
and as a percentage of the UK adult population, as at end 2015-161
All ISA Holders Numbers: thousands
Market value:
Region and Country
£1-
£2,499
£2,500-
£4,999
£5,000-
£9,999
£10,000-
£14,999
£15,000-
£19,999
£20,000-
£24,999
£25,000-
£49,999
£50,000
or moreTotal
Percentage
of all
adults2
Average
ISA
Market
Value
England
North East 341 65 100 69 62 36 104 104 880 41.7% £19,915
North West and Merseyside938 162 261 176 146 97 295 314 2,388 42.0% £21,560
Yorkshire and the Humber 690 122 196 142 112 74 226 242 1,806 42.3% £22,011
East Midlands 634 122 196 121 105 71 206 224 1,678 44.8% £21,961
West Midlands 711 141 216 149 125 79 244 270 1,936 42.7% £22,613
East of England 814 155 243 169 155 90 289 350 2,263 47.0% £25,208
London 922 168 244 170 159 96 318 378 2,454 36.1% £25,982
South East 1,166 230 342 248 239 147 445 589 3,405 48.0% £28,126
South West 770 156 230 172 148 87 288 338 2,189 49.5% £25,639
Total 6,986 1,320 2,028 1,416 1,249 776 2,416 2,809 18,999 43.7% £24,322
Wales 404 76 119 78 73 41 131 142 1,062 42.7% £21,587
Scotland 594 110 176 131 119 65 215 228 1,638 37.5% £23,402
Northern Ireland 166 31 43 34 27 21 57 49 429 30.1% £20,087
Overseas and Unknown 10 1 2 2 1 0 1 2 20 £17,713
United Kingdom 8,159 1,538 2,368 1,660 1,469 903 2,820 3,230 22,148 42.8% £24,035
Published: April 2018
Footnotes
Notes to the tables
1 Tax year ending 5 April2 All individuals aged 18 years or over
(i) The estimates are based on a sample of individuals. Information on ISA subscriptions and valuations is reported by managers to HM
Revenue & Customs on an annual basis, primarily for compliance purposes. As well as providing information on the type of ISA this gives
details of the account holder's date of birth, gender and National Insurance Number (NINO). This last item of information enables the data
to be linked to personal incomes (both earnings and investment income, as taken primarily from the Survey of Personal Income or SPI). It
also enables the analysis to be performed at individual rather than at account level.
The total number of ISA holders is not reported by ISA managers. Estimates of the total numbers of ISA holders are based on average
market values of ISAs for a sample of individuals combined with reported agregate ISA market values (from Table 9.6).
(ii) Due to incorrect or missing returns there is usually a less than perfect match between the SPI and ISA account holder data. This is
overcome by using imputation techniques, thus ensuring consistency between the various published ISA tables.
(iii) From 6th April 2008 Personal Equity Plans were incorporated into ISAs.
Individual Savings Account (ISA) Statistics, April 2018
HM Revenue and Customs
30
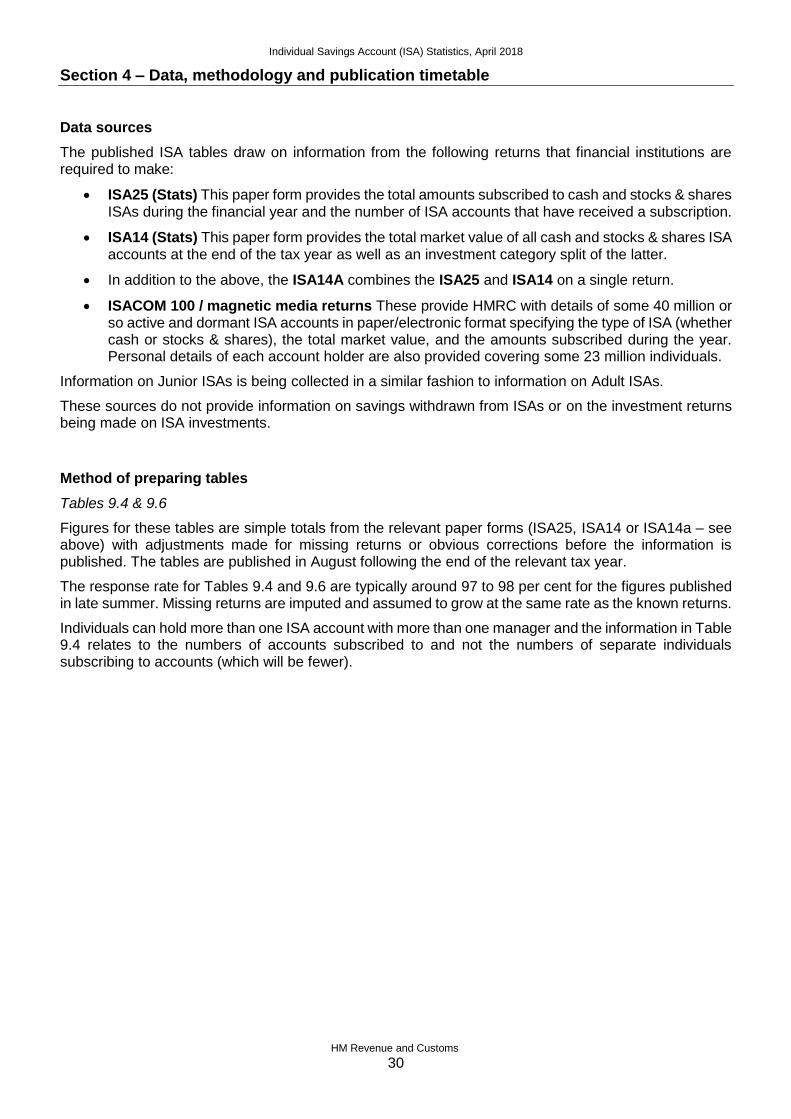
Section 4 – Data, methodology and publication timetable
Data sources
The published ISA tables draw on information from the following returns that financial institutions are required to make:
ISA25 (Stats) This paper form provides the total amounts subscribed to cash and stocks & shares ISAs during the financial year and the number of ISA accounts that have received a subscription.
ISA14 (Stats) This paper form provides the total market value of all cash and stocks & shares ISA accounts at the end of the tax year as well as an investment category split of the latter.
In addition to the above, the ISA14A combines the ISA25 and ISA14 on a single return.
ISACOM 100 / magnetic media returns These provide HMRC with details of some 40 million or so active and dormant ISA accounts in paper/electronic format specifying the type of ISA (whether cash or stocks & shares), the total market value, and the amounts subscribed during the year. Personal details of each account holder are also provided covering some 23 million individuals.
Information on Junior ISAs is being collected in a similar fashion to information on Adult ISAs.
These sources do not provide information on savings withdrawn from ISAs or on the investment returns being made on ISA investments.
Method of preparing tables
Tables 9.4 & 9.6
Figures for these tables are simple totals from the relevant paper forms (ISA25, ISA14 or ISA14a – see above) with adjustments made for missing returns or obvious corrections before the information is published. The tables are published in August following the end of the relevant tax year.
The response rate for Tables 9.4 and 9.6 are typically around 97 to 98 per cent for the figures published in late summer. Missing returns are imputed and assumed to grow at the same rate as the known returns.
Individuals can hold more than one ISA account with more than one manager and the information in Table 9.4 relates to the numbers of accounts subscribed to and not the numbers of separate individuals subscribing to accounts (which will be fewer).
Individual Savings Account (ISA) Statistics, April 2018
HM Revenue and Customs
31
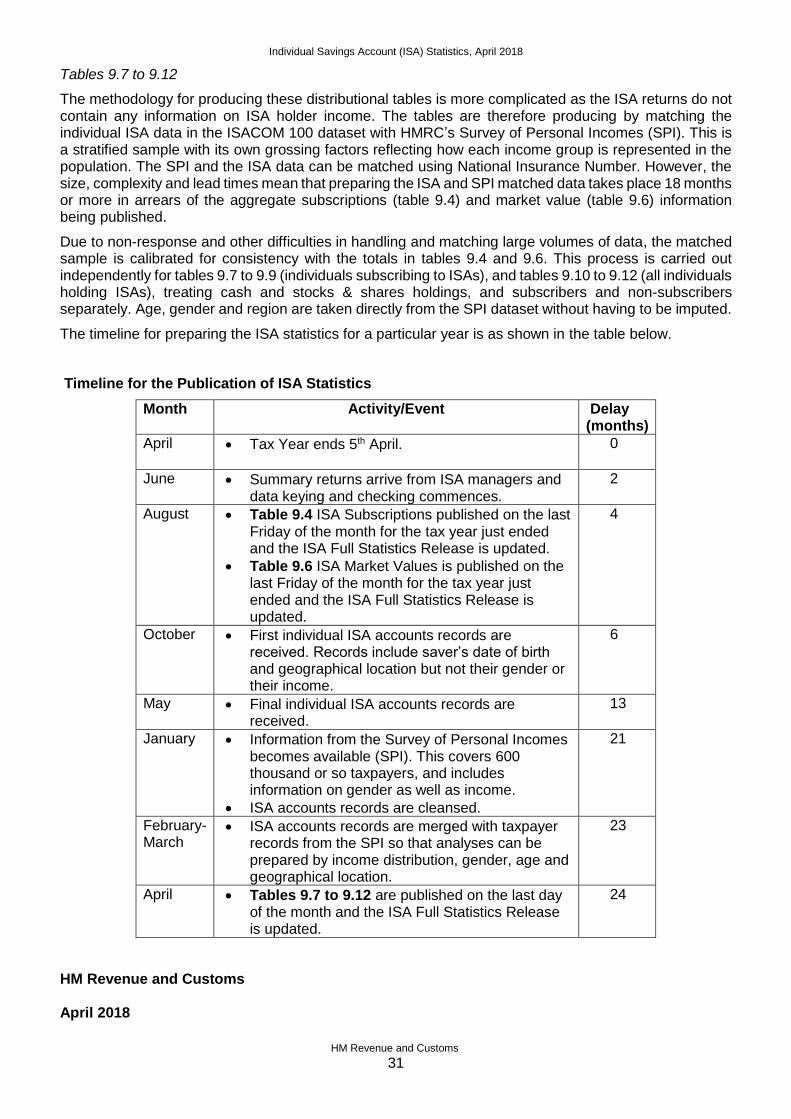
Tables 9.7 to 9.12
The methodology for producing these distributional tables is more complicated as the ISA returns do not contain any information on ISA holder income. The tables are therefore producing by matching the individual ISA data in the ISACOM 100 dataset with HMRC’s Survey of Personal Incomes (SPI). This is a stratified sample with its own grossing factors reflecting how each income group is represented in the population. The SPI and the ISA data can be matched using National Insurance Number. However, the size, complexity and lead times mean that preparing the ISA and SPI matched data takes place 18 months or more in arrears of the aggregate subscriptions (table 9.4) and market value (table 9.6) information being published.
Due to non-response and other difficulties in handling and matching large volumes of data, the matched sample is calibrated for consistency with the totals in tables 9.4 and 9.6. This process is carried out independently for tables 9.7 to 9.9 (individuals subscribing to ISAs), and tables 9.10 to 9.12 (all individuals holding ISAs), treating cash and stocks & shares holdings, and subscribers and non-subscribers separately. Age, gender and region are taken directly from the SPI dataset without having to be imputed.
The timeline for preparing the ISA statistics for a particular year is as shown in the table below.
Timeline for the Publication of ISA Statistics
Month Activity/Event Delay (months)
April Tax Year ends 5th April.
0
June Summary returns arrive from ISA managers and data keying and checking commences.
2
August Table 9.4 ISA Subscriptions published on the last Friday of the month for the tax year just ended and the ISA Full Statistics Release is updated.
Table 9.6 ISA Market Values is published on the last Friday of the month for the tax year just ended and the ISA Full Statistics Release is updated.
4
October First individual ISA accounts records are received. Records include saver’s date of birth and geographical location but not their gender or their income.
6
May Final individual ISA accounts records are received.
13
January Information from the Survey of Personal Incomes becomes available (SPI). This covers 600 thousand or so taxpayers, and includes information on gender as well as income.
ISA accounts records are cleansed.
21
February- March
ISA accounts records are merged with taxpayer records from the SPI so that analyses can be prepared by income distribution, gender, age and geographical location.
23
April Tables 9.7 to 9.12 are published on the last day of the month and the ISA Full Statistics Release is updated.
24
HM Revenue and Customs April 2018