Embed Size (px)
Citation preview
1
Wisconsin Department of Revenue Division of Research and Policy February 28, 2018
INDIVIDUAL INCOME TAX STATISTICS REPORT FOR TAX YEAR 2016
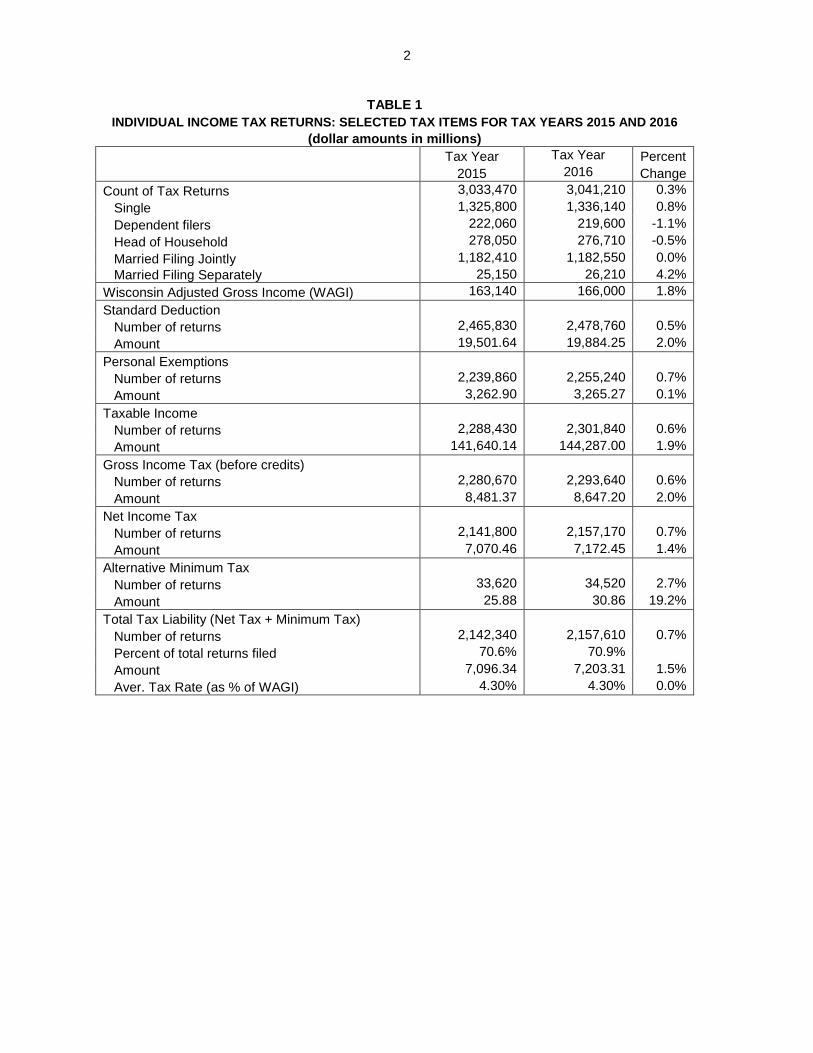
This report summarizes data from individual income tax returns for tax year 2016 that were filed by October 15, 2017. COMPARISON WITH TAX YEAR 2014 (Table 1) Taxpayers filed 3.04 million tax returns for tax year 2016, an increase of 0.3% over the 3.03 million returns filed for 2015. In 2016, there were 1.3 million single filers (43.9% of total), and 277,000 head-of-household filers (9.1%). Married joint filers numbered 1.2 million (38.9%) while married separate filers numbered around 26,000 (0.9%). In addition, there were about 220,000 dependent filers (filers who were claimed as dependents on someone else's tax return) (7.2%). Wisconsin adjusted gross income (WAGI) was $166.0 billion in tax year 2016, a 1.8% increase from 2015. Total standard deductions equaled $19.9 billion in tax year 2016, compared to $19.5 billion for 2015, an increase of 2.0%. Personal exemptions were $3.265 billion in 2016 compared to $3.263 billion in 2015, a 0.1% increase. Total income tax liability (before the minimum tax) increased 1.4% to $7.17 billion and the alternative minimum tax, paid by 35,000 filers, generated $30.9 million in tax year 2016, a 19.2% increase from tax year 2015. Of the 3.04 million tax returns filed for 2016, 2.16 million, or 70.9%, showed a net income tax liability. The average tax rate, equal to net tax divided by WAGI, was 4.3%.
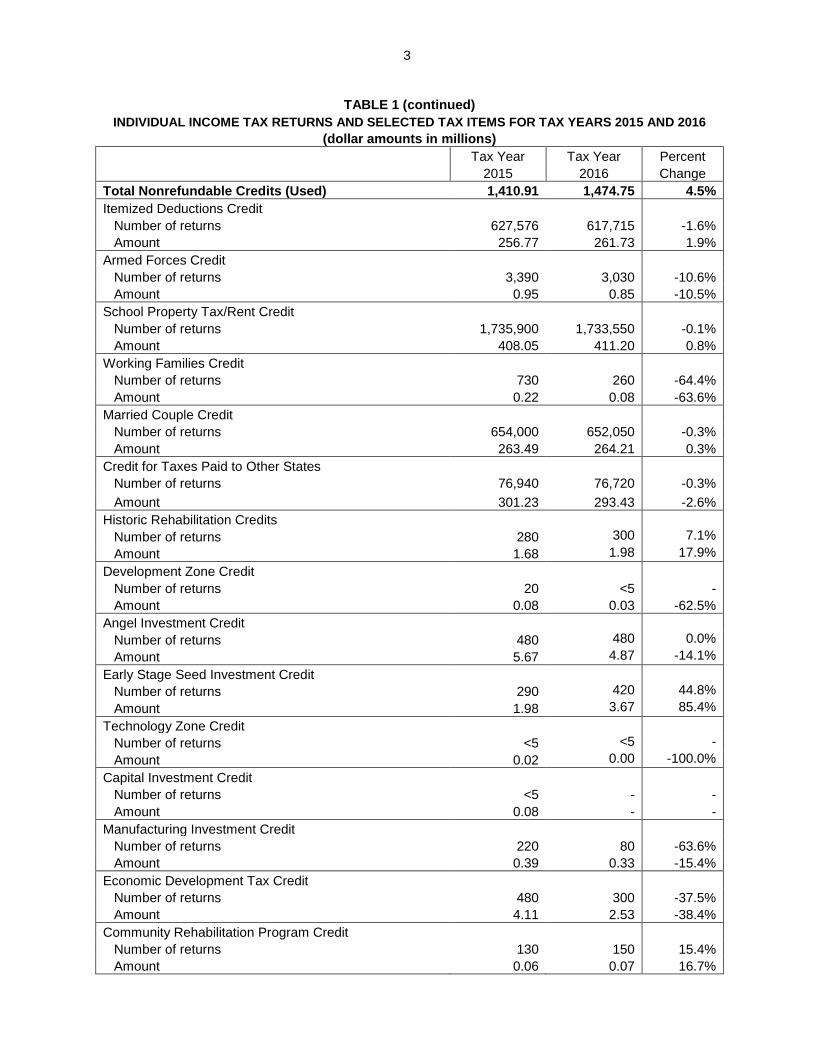
Net income tax equals gross tax, calculated by applying the statutory tax rates and brackets to taxable income, less nonrefundable tax credits. Nonrefundable tax credits can only be used to offset tax liability. Since some taxpayers have low gross tax prior to credits, they are able to use only part of the credits that are claimed. Nonrefundable credits include the itemized deduction credit, the armed forces member credit, the school property tax credit, the working families credit, the married couple credit, the credit for taxes paid to other states, and a number of business and economic development related tax credits. These credits increased 4.5% to $1.47 billion in 2016. The five largest nonrefundable credits -- the school property tax credit ($411.2 million), the credit for taxes paid to other states ($293.4 million), the married couple credit ($264.2 million), the itemized deduction credit ($261.7 million), and the manufacturing and agriculture credit ($221.6 million) -- accounted for 98% of the total used credits.
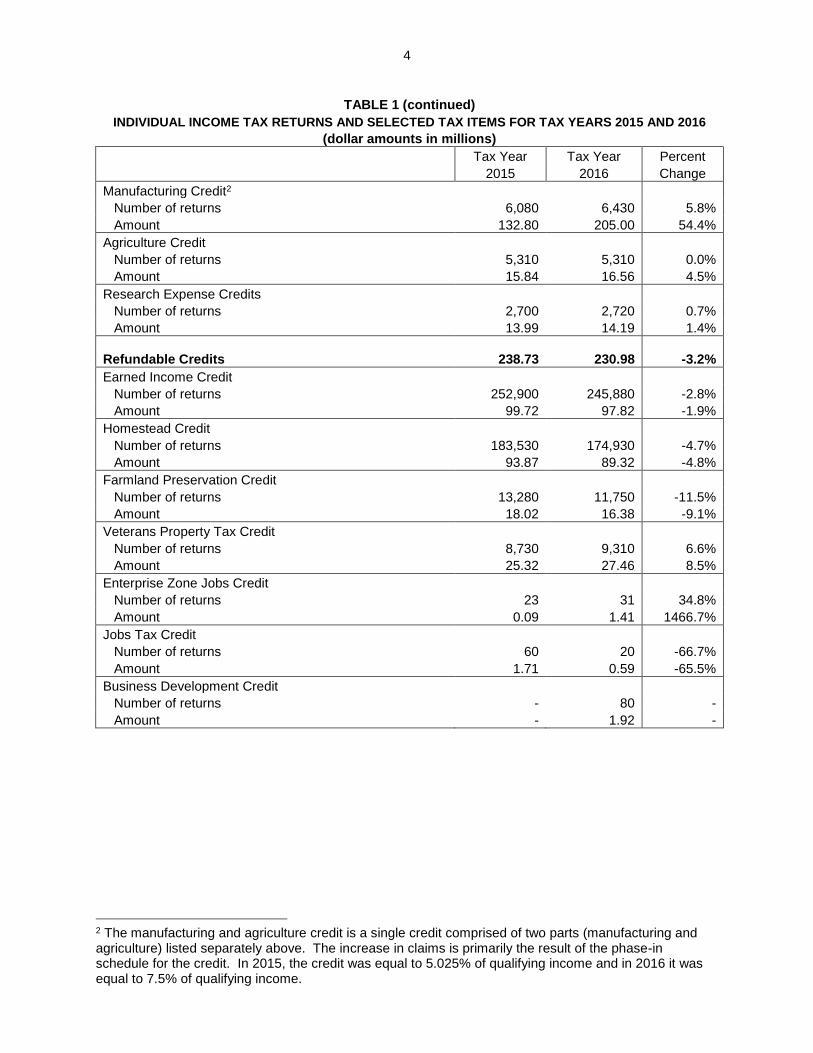
Wisconsin also allows refundable credits, with credit amounts in excess of tax liability refunded to the taxpayer. These credits include the earned income tax credit, the homestead credit, the farmland preservation credit, the veterans and surviving spouses property tax credit, and the business development credit.1 Refundable credits decreased 1.9% from $243.3 million in 2014 to $238.7 million in 2015. The largest of these credits was the earned income tax credit at $97.8 million, followed by the homestead tax credit at $89.3 million. Separate reports on certain refundable credits are available on the Department of Revenue website, www.revenue.wi.gov.
1 The business development credit replaced the economic development credit and the jobs tax credit for tax year 2016 and after. Economic development and jobs tax credits may still be awarded to businesses that had a contract in force with the Wisconsin Economic Development Corporation (WEDC) on January 1, 2016.
2
2
TABLE 1
INDIVIDUAL INCOME TAX RETURNS: SELECTED TAX ITEMS FOR TAX YEARS 2015 AND 2016
(dollar amounts in millions)
Tax Year Tax Year Percent
2015 2016 Change
Count of Tax Returns 3,033,470 3,041,210 0.3%
Single 1,325,800 1,336,140 0.8%
Dependent filers 222,060 219,600 -1.1%
Head of Household 278,050 276,710 -0.5%
Married Filing Jointly 1,182,410 1,182,550 0.0%
Married Filing Separately 25,150 26,210 4.2%
Wisconsin Adjusted Gross Income (WAGI) 163,140 166,000 1.8%
Standard Deduction
Number of returns 2,465,830 2,478,760 0.5%
Amount 19,501.64 19,884.25 2.0%
Personal Exemptions
Number of returns 2,239,860 2,255,240 0.7%
Amount 3,262.90 3,265.27 0.1%
Taxable Income
Number of returns 2,288,430 2,301,840 0.6%
Amount 141,640.14 144,287.00 1.9%
Gross Income Tax (before credits)
Number of returns 2,280,670 2,293,640 0.6%
Amount 8,481.37 8,647.20 2.0%
Net Income Tax
Number of returns 2,141,800 2,157,170 0.7%
Amount 7,070.46 7,172.45 1.4%
Alternative Minimum Tax
Number of returns 33,620 34,520 2.7%
Amount 25.88 30.86 19.2%
Total Tax Liability (Net Tax + Minimum Tax)
Number of returns 2,142,340 2,157,610 0.7%
Percent of total returns filed 70.6% 70.9%
Amount 7,096.34 7,203.31 1.5%
Aver. Tax Rate (as % of WAGI) 4.30% 4.30% 0.0%
3
3
TABLE 1 (continued)
INDIVIDUAL INCOME TAX RETURNS AND SELECTED TAX ITEMS FOR TAX YEARS 2015 AND 2016
(dollar amounts in millions)
Tax Year Tax Year Percent
2015 2016 Change
Total Nonrefundable Credits (Used) 1,410.91 1,474.75 4.5%
Itemized Deductions Credit
Number of returns 627,576 617,715 -1.6%
Amount 256.77 261.73 1.9%
Armed Forces Credit Number of returns 3,390 3,030 -10.6%
Amount 0.95 0.85 -10.5%
School Property Tax/Rent Credit Number of returns 1,735,900 1,733,550 -0.1%
Amount 408.05 411.20 0.8%
Working Families Credit Number of returns 730 260 -64.4%
Amount 0.22 0.08 -63.6%
Married Couple Credit Number of returns 654,000 652,050 -0.3%
Amount 263.49 264.21 0.3%
Credit for Taxes Paid to Other States Number of returns 76,940 76,720 -0.3%
Amount 301.23 293.43 -2.6%
Historic Rehabilitation Credits
Number of returns 280 300 7.1%
Amount 1.68 1.98 17.9%
Development Zone Credit
Number of returns 20 <5 -
Amount 0.08 0.03 -62.5%
Angel Investment Credit
Number of returns 480 480 0.0%
Amount 5.67 4.87 -14.1%
Early Stage Seed Investment Credit
Number of returns 290 420 44.8%
Amount 1.98 3.67 85.4%
Technology Zone Credit
Number of returns <5 <5 -
Amount 0.02 0.00 -100.0%
Capital Investment Credit
Number of returns <5 - -
Amount 0.08 - -
Manufacturing Investment Credit
Number of returns 220 80 -63.6%
Amount 0.39 0.33 -15.4%
Economic Development Tax Credit
Number of returns 480 300 -37.5%
Amount 4.11 2.53 -38.4%
Community Rehabilitation Program Credit
Number of returns 130 150 15.4%
Amount 0.06 0.07 16.7%
4
4
TABLE 1 (continued)
INDIVIDUAL INCOME TAX RETURNS AND SELECTED TAX ITEMS FOR TAX YEARS 2015 AND 2016
(dollar amounts in millions)
Tax Year Tax Year Percent
2015 2016 Change
Manufacturing Credit2
Number of returns 6,080 6,430 5.8%
Amount 132.80 205.00 54.4%
Agriculture Credit
Number of returns 5,310 5,310 0.0%
Amount 15.84 16.56 4.5%
Research Expense Credits
Number of returns 2,700 2,720 0.7%
Amount 13.99 14.19 1.4%
Refundable Credits
238.73 230.98 -3.2%
Earned Income Credit
Number of returns 252,900 245,880 -2.8%
Amount 99.72 97.82 -1.9%
Homestead Credit
Number of returns 183,530 174,930 -4.7%
Amount 93.87 89.32 -4.8%
Farmland Preservation Credit
Number of returns 13,280 11,750 -11.5%
Amount 18.02 16.38 -9.1%
Veterans Property Tax Credit
Number of returns 8,730 9,310 6.6%
Amount 25.32 27.46 8.5%
Enterprise Zone Jobs Credit
Number of returns 23 31 34.8%
Amount 0.09 1.41 1466.7%
Jobs Tax Credit
Number of returns 60 20 -66.7%
Amount 1.71 0.59 -65.5%
Business Development Credit
Number of returns - 80 -
Amount - 1.92 -
2 The manufacturing and agriculture credit is a single credit comprised of two parts (manufacturing and agriculture) listed separately above. The increase in claims is primarily the result of the phase-in schedule for the credit. In 2015, the credit was equal to 5.025% of qualifying income and in 2016 it was equal to 7.5% of qualifying income.
5
5
TABLE 1 (continued)
INDIVIDUAL INCOME TAX RETURNS AND SELECTED TAX ITEMS FOR TAX YEARS 2015 AND 2016
(dollar amounts in millions)
Tax Year Tax Year Percent
2015 2016 Change
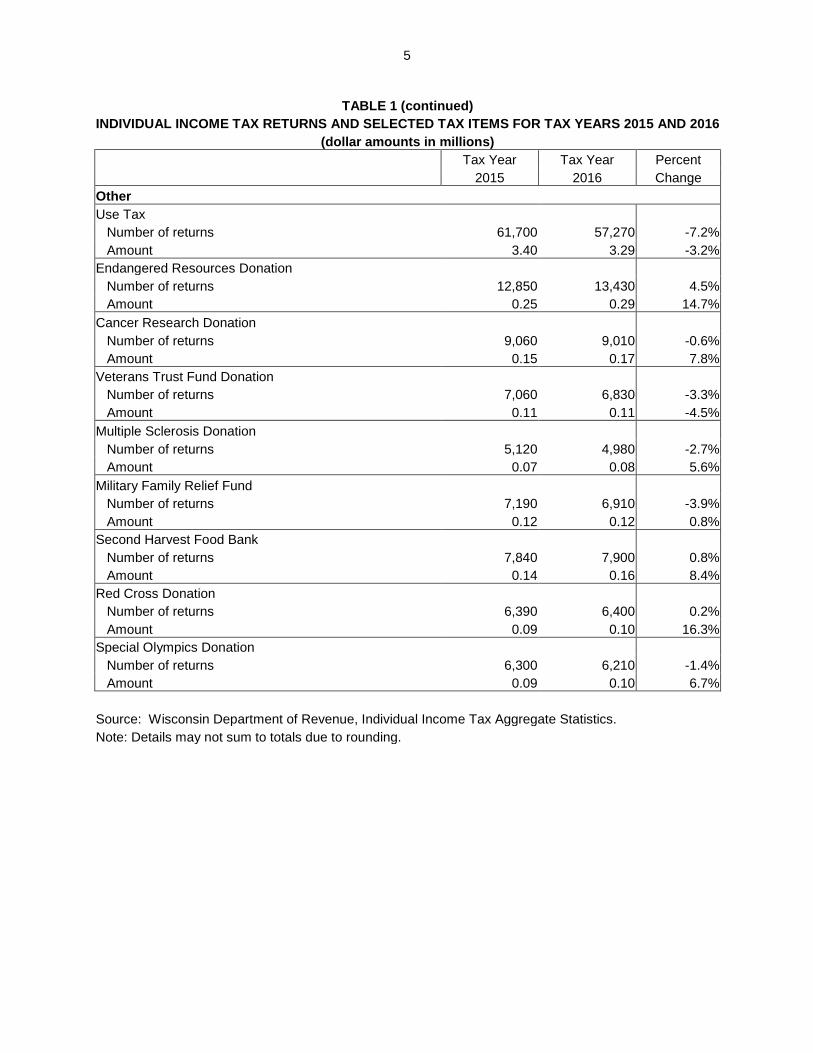
Other
Use Tax
Number of returns 61,700 57,270 -7.2%
Amount 3.40 3.29 -3.2%
Endangered Resources Donation
Number of returns 12,850 13,430 4.5%
Amount 0.25 0.29 14.7%
Cancer Research Donation
Number of returns 9,060 9,010 -0.6%
Amount 0.15 0.17 7.8%
Veterans Trust Fund Donation
Number of returns 7,060 6,830 -3.3%
Amount 0.11 0.11 -4.5%
Multiple Sclerosis Donation
Number of returns 5,120 4,980 -2.7%
Amount 0.07 0.08 5.6%
Military Family Relief Fund
Number of returns 7,190 6,910 -3.9%
Amount 0.12 0.12 0.8%
Second Harvest Food Bank
Number of returns 7,840 7,900 0.8%
Amount 0.14 0.16 8.4%
Red Cross Donation
Number of returns 6,390 6,400 0.2%
Amount 0.09 0.10 16.3%
Special Olympics Donation
Number of returns 6,300 6,210 -1.4%
Amount 0.09 0.10 6.7%
Source: Wisconsin Department of Revenue, Individual Income Tax Aggregate Statistics. Note: Details may not sum to totals due to rounding.
6
6
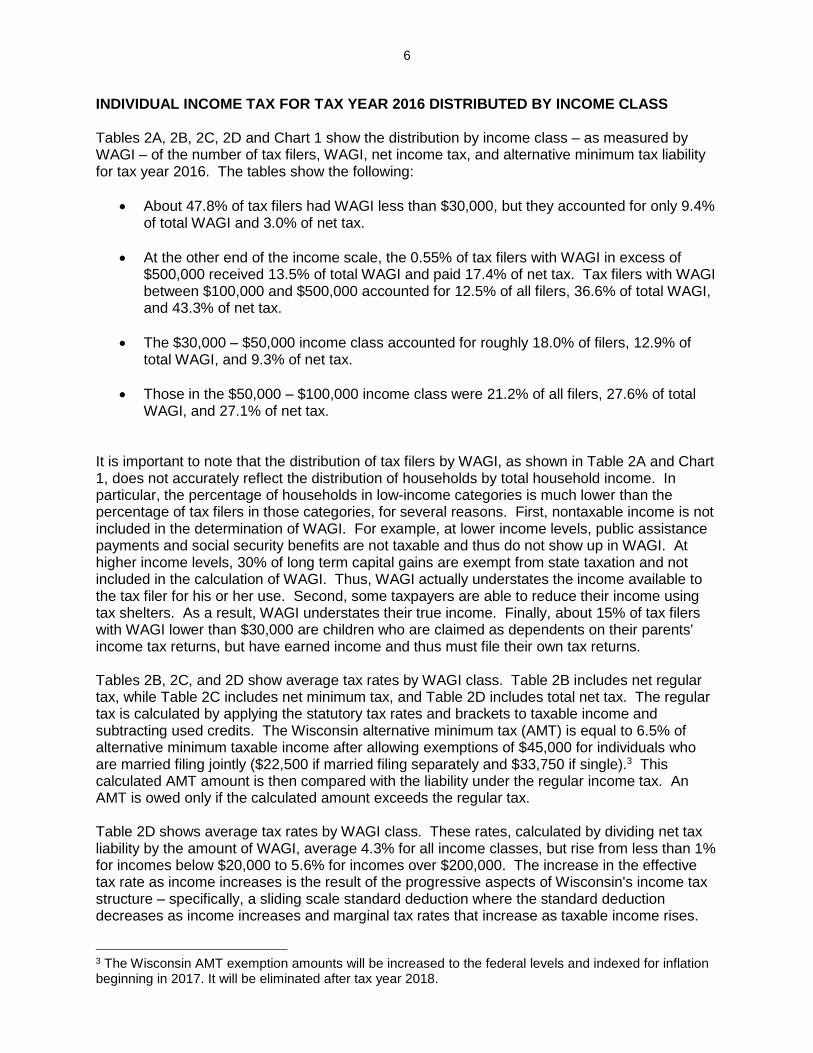
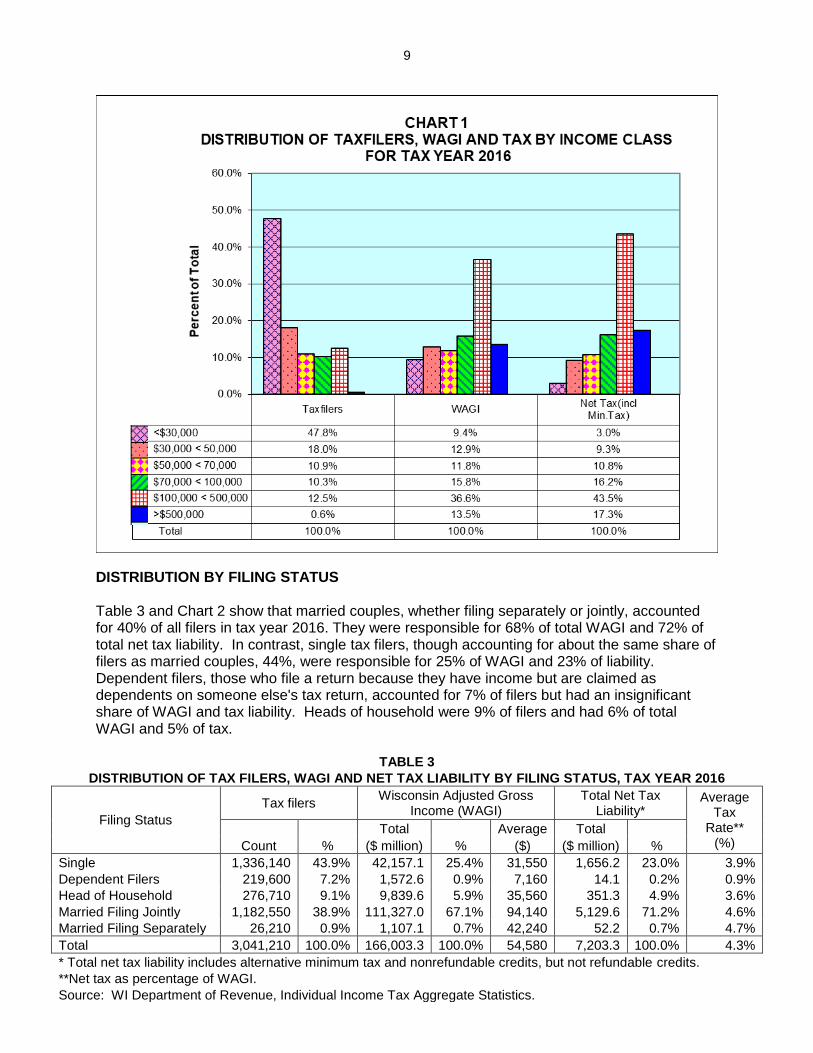
INDIVIDUAL INCOME TAX FOR TAX YEAR 2016 DISTRIBUTED BY INCOME CLASS Tables 2A, 2B, 2C, 2D and Chart 1 show the distribution by income class – as measured by WAGI – of the number of tax filers, WAGI, net income tax, and alternative minimum tax liability for tax year 2016. The tables show the following:
About 47.8% of tax filers had WAGI less than $30,000, but they accounted for only 9.4% of total WAGI and 3.0% of net tax.
At the other end of the income scale, the 0.55% of tax filers with WAGI in excess of $500,000 received 13.5% of total WAGI and paid 17.4% of net tax. Tax filers with WAGI between $100,000 and $500,000 accounted for 12.5% of all filers, 36.6% of total WAGI, and 43.3% of net tax.
The $30,000 – $50,000 income class accounted for roughly 18.0% of filers, 12.9% of total WAGI, and 9.3% of net tax.
Those in the $50,000 – $100,000 income class were 21.2% of all filers, 27.6% of total WAGI, and 27.1% of net tax.
It is important to note that the distribution of tax filers by WAGI, as shown in Table 2A and Chart 1, does not accurately reflect the distribution of households by total household income. In particular, the percentage of households in low-income categories is much lower than the percentage of tax filers in those categories, for several reasons. First, nontaxable income is not included in the determination of WAGI. For example, at lower income levels, public assistance payments and social security benefits are not taxable and thus do not show up in WAGI. At higher income levels, 30% of long term capital gains are exempt from state taxation and not included in the calculation of WAGI. Thus, WAGI actually understates the income available to the tax filer for his or her use. Second, some taxpayers are able to reduce their income using tax shelters. As a result, WAGI understates their true income. Finally, about 15% of tax filers with WAGI lower than $30,000 are children who are claimed as dependents on their parents' income tax returns, but have earned income and thus must file their own tax returns.
Tables 2B, 2C, and 2D show average tax rates by WAGI class. Table 2B includes net regular tax, while Table 2C includes net minimum tax, and Table 2D includes total net tax. The regular tax is calculated by applying the statutory tax rates and brackets to taxable income and subtracting used credits. The Wisconsin alternative minimum tax (AMT) is equal to 6.5% of alternative minimum taxable income after allowing exemptions of $45,000 for individuals who are married filing jointly ($22,500 if married filing separately and $33,750 if single).3 This calculated AMT amount is then compared with the liability under the regular income tax. An AMT is owed only if the calculated amount exceeds the regular tax. Table 2D shows average tax rates by WAGI class. These rates, calculated by dividing net tax liability by the amount of WAGI, average 4.3% for all income classes, but rise from less than 1% for incomes below $20,000 to 5.6% for incomes over $200,000. The increase in the effective tax rate as income increases is the result of the progressive aspects of Wisconsin's income tax structure – specifically, a sliding scale standard deduction where the standard deduction decreases as income increases and marginal tax rates that increase as taxable income rises.
3 The Wisconsin AMT exemption amounts will be increased to the federal levels and indexed for inflation beginning in 2017. It will be eliminated after tax year 2018.
7
7
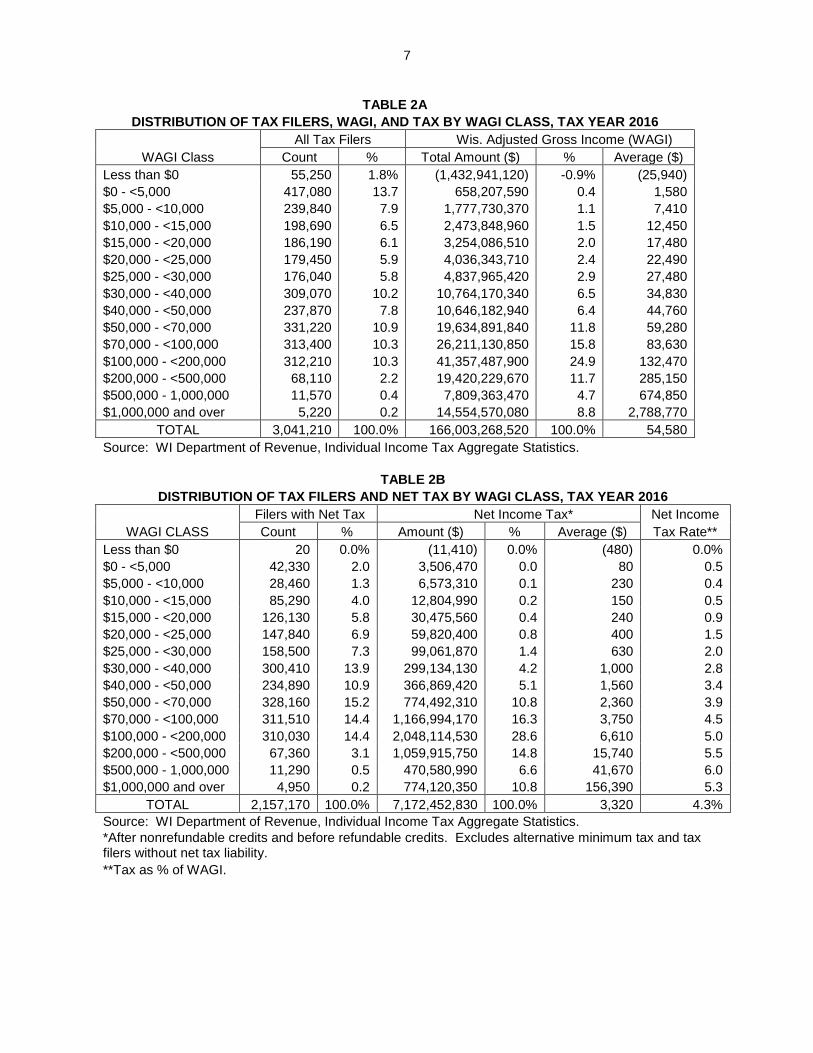
TABLE 2A
DISTRIBUTION OF TAX FILERS, WAGI, AND TAX BY WAGI CLASS, TAX YEAR 2016
All Tax Filers Wis. Adjusted Gross Income (WAGI)
WAGI Class Count % Total Amount ($) % Average ($)
Less than $0 55,250 1.8% (1,432,941,120) -0.9% (25,940)
$0 - <5,000 417,080 13.7 658,207,590 0.4 1,580
$5,000 - <10,000 239,840 7.9 1,777,730,370 1.1 7,410
$10,000 - <15,000 198,690 6.5 2,473,848,960 1.5 12,450
$15,000 - <20,000 186,190 6.1 3,254,086,510 2.0 17,480
$20,000 - <25,000 179,450 5.9 4,036,343,710 2.4 22,490
$25,000 - <30,000 176,040 5.8 4,837,965,420 2.9 27,480
$30,000 - <40,000 309,070 10.2 10,764,170,340 6.5 34,830
$40,000 - <50,000 237,870 7.8 10,646,182,940 6.4 44,760
$50,000 - <70,000 331,220 10.9 19,634,891,840 11.8 59,280
$70,000 - <100,000 313,400 10.3 26,211,130,850 15.8 83,630
$100,000 - <200,000 312,210 10.3 41,357,487,900 24.9 132,470
$200,000 - <500,000 68,110 2.2 19,420,229,670 11.7 285,150
$500,000 - 1,000,000 11,570 0.4 7,809,363,470 4.7 674,850
$1,000,000 and over 5,220 0.2 14,554,570,080 8.8 2,788,770
TOTAL 3,041,210 100.0% 166,003,268,520 100.0% 54,580
Source: WI Department of Revenue, Individual Income Tax Aggregate Statistics.
TABLE 2B
DISTRIBUTION OF TAX FILERS AND NET TAX BY WAGI CLASS, TAX YEAR 2016
Filers with Net Tax Net Income Tax* Net Income
WAGI CLASS Count % Amount ($) % Average ($) Tax Rate**
Less than $0 20 0.0% (11,410) 0.0% (480) 0.0%
$0 - <5,000 42,330 2.0 3,506,470 0.0 80 0.5
$5,000 - <10,000 28,460 1.3 6,573,310 0.1 230 0.4
$10,000 - <15,000 85,290 4.0 12,804,990 0.2 150 0.5
$15,000 - <20,000 126,130 5.8 30,475,560 0.4 240 0.9
$20,000 - <25,000 147,840 6.9 59,820,400 0.8 400 1.5
$25,000 - <30,000 158,500 7.3 99,061,870 1.4 630 2.0
$30,000 - <40,000 300,410 13.9 299,134,130 4.2 1,000 2.8
$40,000 - <50,000 234,890 10.9 366,869,420 5.1 1,560 3.4
$50,000 - <70,000 328,160 15.2 774,492,310 10.8 2,360 3.9
$70,000 - <100,000 311,510 14.4 1,166,994,170 16.3 3,750 4.5
$100,000 - <200,000 310,030 14.4 2,048,114,530 28.6 6,610 5.0
$200,000 - <500,000 67,360 3.1 1,059,915,750 14.8 15,740 5.5
$500,000 - 1,000,000 11,290 0.5 470,580,990 6.6 41,670 6.0
$1,000,000 and over 4,950 0.2 774,120,350 10.8 156,390 5.3
TOTAL 2,157,170 100.0% 7,172,452,830 100.0% 3,320 4.3%
Source: WI Department of Revenue, Individual Income Tax Aggregate Statistics.
*After nonrefundable credits and before refundable credits. Excludes alternative minimum tax and tax filers without net tax liability.
**Tax as % of WAGI.
8
8
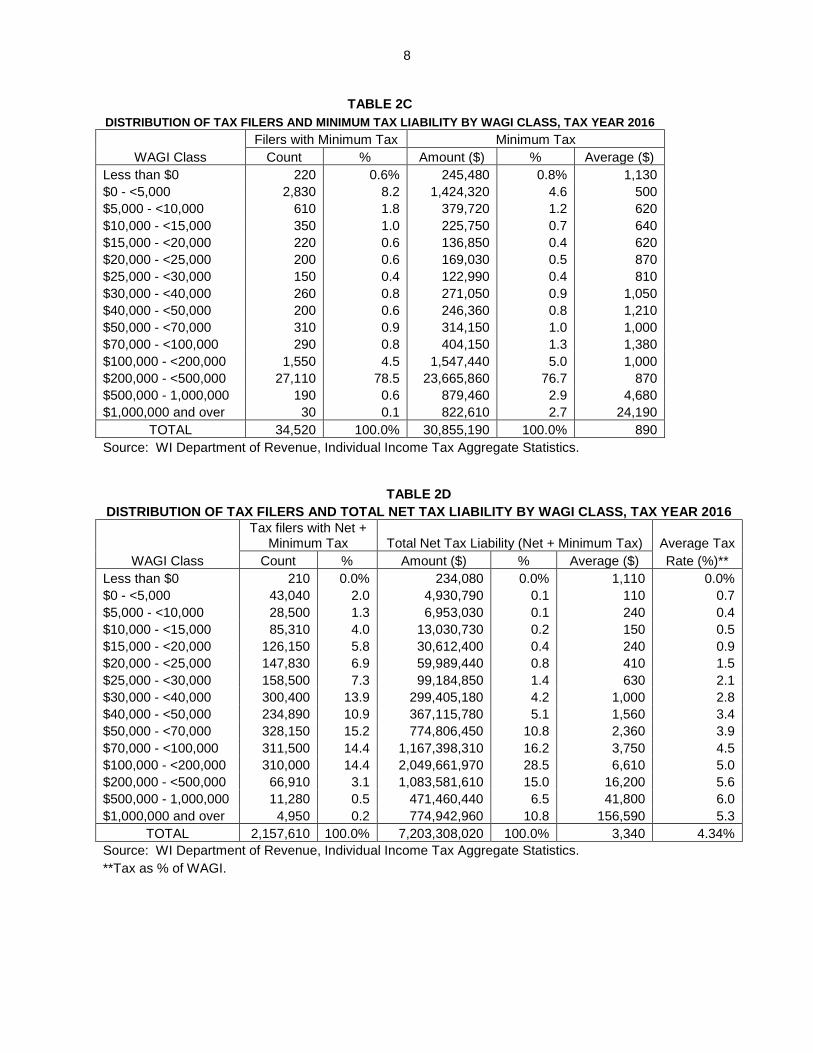
TABLE 2C
DISTRIBUTION OF TAX FILERS AND MINIMUM TAX LIABILITY BY WAGI CLASS, TAX YEAR 2016
Filers with Minimum Tax Minimum Tax
WAGI Class Count % Amount ($) % Average ($)
Less than $0 220 0.6% 245,480 0.8% 1,130
$0 - <5,000 2,830 8.2 1,424,320 4.6 500
$5,000 - <10,000 610 1.8 379,720 1.2 620
$10,000 - <15,000 350 1.0 225,750 0.7 640
$15,000 - <20,000 220 0.6 136,850 0.4 620
$20,000 - <25,000 200 0.6 169,030 0.5 870
$25,000 - <30,000 150 0.4 122,990 0.4 810
$30,000 - <40,000 260 0.8 271,050 0.9 1,050
$40,000 - <50,000 200 0.6 246,360 0.8 1,210
$50,000 - <70,000 310 0.9 314,150 1.0 1,000
$70,000 - <100,000 290 0.8 404,150 1.3 1,380
$100,000 - <200,000 1,550 4.5 1,547,440 5.0 1,000
$200,000 - <500,000 27,110 78.5 23,665,860 76.7 870
$500,000 - 1,000,000 190 0.6 879,460 2.9 4,680
$1,000,000 and over 30 0.1 822,610 2.7 24,190
TOTAL 34,520 100.0% 30,855,190 100.0% 890
Source: WI Department of Revenue, Individual Income Tax Aggregate Statistics.
TABLE 2D
DISTRIBUTION OF TAX FILERS AND TOTAL NET TAX LIABILITY BY WAGI CLASS, TAX YEAR 2016
Tax filers with Net +
Minimum Tax Total Net Tax Liability (Net + Minimum Tax) Average Tax
WAGI Class Count % Amount ($) % Average ($) Rate (%)**
Less than $0 210 0.0% 234,080 0.0% 1,110 0.0%
$0 - <5,000 43,040 2.0 4,930,790 0.1 110 0.7
$5,000 - <10,000 28,500 1.3 6,953,030 0.1 240 0.4
$10,000 - <15,000 85,310 4.0 13,030,730 0.2 150 0.5
$15,000 - <20,000 126,150 5.8 30,612,400 0.4 240 0.9
$20,000 - <25,000 147,830 6.9 59,989,440 0.8 410 1.5
$25,000 - <30,000 158,500 7.3 99,184,850 1.4 630 2.1
$30,000 - <40,000 300,400 13.9 299,405,180 4.2 1,000 2.8
$40,000 - <50,000 234,890 10.9 367,115,780 5.1 1,560 3.4
$50,000 - <70,000 328,150 15.2 774,806,450 10.8 2,360 3.9
$70,000 - <100,000 311,500 14.4 1,167,398,310 16.2 3,750 4.5
$100,000 - <200,000 310,000 14.4 2,049,661,970 28.5 6,610 5.0
$200,000 - <500,000 66,910 3.1 1,083,581,610 15.0 16,200 5.6
$500,000 - 1,000,000 11,280 0.5 471,460,440 6.5 41,800 6.0
$1,000,000 and over 4,950 0.2 774,942,960 10.8 156,590 5.3
TOTAL 2,157,610 100.0% 7,203,308,020 100.0% 3,340 4.34%
Source: WI Department of Revenue, Individual Income Tax Aggregate Statistics.
**Tax as % of WAGI.
9
9
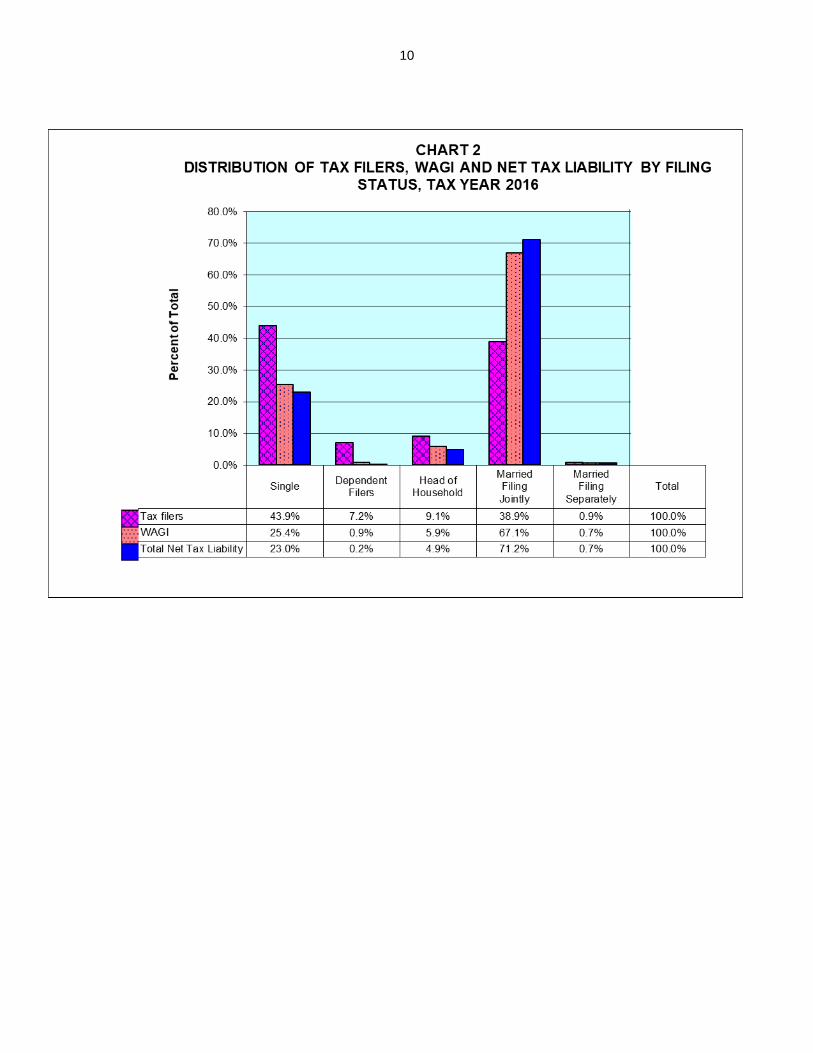
DISTRIBUTION BY FILING STATUS Table 3 and Chart 2 show that married couples, whether filing separately or jointly, accounted for 40% of all filers in tax year 2016. They were responsible for 68% of total WAGI and 72% of total net tax liability. In contrast, single tax filers, though accounting for about the same share of filers as married couples, 44%, were responsible for 25% of WAGI and 23% of liability. Dependent filers, those who file a return because they have income but are claimed as dependents on someone else's tax return, accounted for 7% of filers but had an insignificant share of WAGI and tax liability. Heads of household were 9% of filers and had 6% of total WAGI and 5% of tax.
TABLE 3
DISTRIBUTION OF TAX FILERS, WAGI AND NET TAX LIABILITY BY FILING STATUS, TAX YEAR 2016
Filing Status
Tax filers Wisconsin Adjusted Gross
Income (WAGI) Total Net Tax
Liability* Average
Tax Rate**
(%) Total Average Total
Count % ($ million) % ($) ($ million) %
Single 1,336,140 43.9% 42,157.1 25.4% 31,550 1,656.2 23.0% 3.9%
Dependent Filers 219,600 7.2% 1,572.6 0.9% 7,160 14.1 0.2% 0.9%
Head of Household 276,710 9.1% 9,839.6 5.9% 35,560 351.3 4.9% 3.6%
Married Filing Jointly 1,182,550 38.9% 111,327.0 67.1% 94,140 5,129.6 71.2% 4.6%
Married Filing Separately 26,210 0.9% 1,107.1 0.7% 42,240 52.2 0.7% 4.7%
Total 3,041,210 100.0% 166,003.3 100.0% 54,580 7,203.3 100.0% 4.3%
* Total net tax liability includes alternative minimum tax and nonrefundable credits, but not refundable credits.
**Net tax as percentage of WAGI. Source: WI Department of Revenue, Individual Income Tax Aggregate Statistics.
10
10
11
11
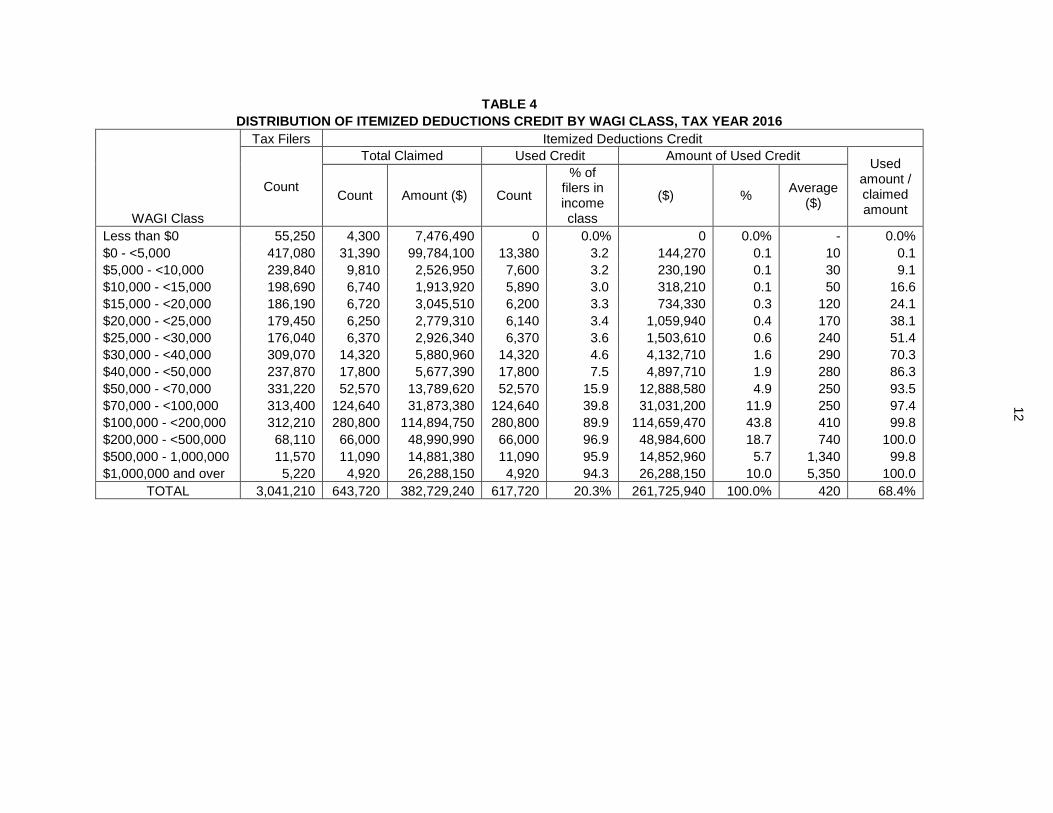
CREDITS An income tax credit is a subtraction from gross tax liability. There are two kinds of credits: nonrefundable credits and refundable credits. Nonrefundable credits can only be used to reduce tax liability; in some cases unused amounts of credits can be carried forward for up to 15 years to offset tax liability. The four largest nonrefundable credits are the itemized deduction credit, the school property tax credit, the credit for taxes paid to other states, and the married couple credit. Itemized Deductions Credit Unlike the federal income tax, the Wisconsin income tax does not allow itemized deductions. Instead, certain expenses are eligible for an itemized deduction credit. The credit equals 5% of the amount of eligible expenses in excess of the sliding scale standard deduction. Expenses qualifying for the credit include mortgage interest on a primary residence located in Wisconsin, charitable contributions, medical expenses in excess of 10% (7.5% for elderly filers) of the taxpayer's federal adjusted gross income, and certain casualty losses directly related to a federally declared disaster. The distribution of the itemized deductions credit by income class is shown in Table 4. Out of a total of 3.04 million tax filers, about 644,000 (21.2%) claim the credit, but 618,000 have enough liability to use the credit. The percentage of filers within an income class using the credit tends to rise with income. While only 3% of filers with incomes below $30,000 used the itemized deductions credit, more than 90% of filers with incomes of $100,000 or more used the credit. The total amount of the used itemized deductions credit was $262 million. About 95% of the credits used were accounted for by filers with WAGI exceeding $50,000. The itemized deductions credit primarily benefits higher-income filers for two reasons. First, the expenses that qualify for the credit, mortgage interest and charitable contributions, tend to be larger for persons with higher incomes. Second, expenses are eligible for the credit only to the extent that they exceed the standard deduction. The design of the sliding scale standard deduction ensures that the standard deduction is reduced as income increases. Thus, lower income filers have larger standard deductions that typically exceed their qualified itemized deductions, so they seldom claim the itemized deductions credit. By contrast, higher income filers are allowed only a small or no standard deduction. These filers tend to have a large amount of eligible expenses against which the 5% itemized deductions credit is applied.
12
TABLE 4
DISTRIBUTION OF ITEMIZED DEDUCTIONS CREDIT BY WAGI CLASS, TAX YEAR 2016
WAGI Class
Tax Filers Itemized Deductions Credit
Count
Total Claimed Used Credit Amount of Used Credit Used
amount / claimed amount
Count Amount ($) Count
% of filers in income class
($) % Average
($)
Less than $0 55,250 4,300 7,476,490 0 0.0% 0 0.0% - 0.0%
$0 - <5,000 417,080 31,390 99,784,100 13,380 3.2 144,270 0.1 10 0.1
$5,000 - <10,000 239,840 9,810 2,526,950 7,600 3.2 230,190 0.1 30 9.1
$10,000 - <15,000 198,690 6,740 1,913,920 5,890 3.0 318,210 0.1 50 16.6
$15,000 - <20,000 186,190 6,720 3,045,510 6,200 3.3 734,330 0.3 120 24.1
$20,000 - <25,000 179,450 6,250 2,779,310 6,140 3.4 1,059,940 0.4 170 38.1
$25,000 - <30,000 176,040 6,370 2,926,340 6,370 3.6 1,503,610 0.6 240 51.4
$30,000 - <40,000 309,070 14,320 5,880,960 14,320 4.6 4,132,710 1.6 290 70.3
$40,000 - <50,000 237,870 17,800 5,677,390 17,800 7.5 4,897,710 1.9 280 86.3
$50,000 - <70,000 331,220 52,570 13,789,620 52,570 15.9 12,888,580 4.9 250 93.5
$70,000 - <100,000 313,400 124,640 31,873,380 124,640 39.8 31,031,200 11.9 250 97.4
$100,000 - <200,000 312,210 280,800 114,894,750 280,800 89.9 114,659,470 43.8 410 99.8
$200,000 - <500,000 68,110 66,000 48,990,990 66,000 96.9 48,984,600 18.7 740 100.0
$500,000 - 1,000,000 11,570 11,090 14,881,380 11,090 95.9 14,852,960 5.7 1,340 99.8
$1,000,000 and over 5,220 4,920 26,288,150 4,920 94.3 26,288,150 10.0 5,350 100.0
TOTAL 3,041,210 643,720 382,729,240 617,720 20.3% 261,725,940 100.0% 420 68.4%
13
13
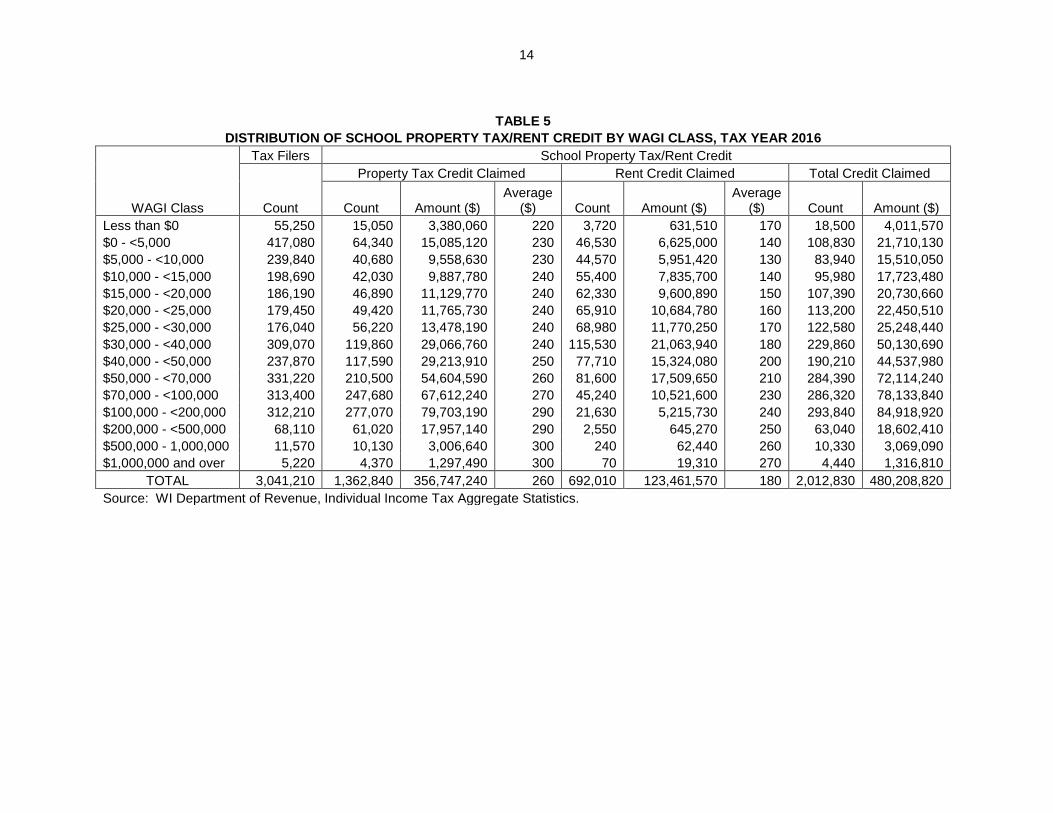
School Property Tax Credit The school property tax credit for tax year 2016 is equal to 12% of the first $2,500 of property taxes (or rent equivalent) paid on a principal residence, with a maximum credit of $300. The rent equivalent of property tax is equal to 20% of rent if heat is included in the rent and 25% if the tenant paid for heat separately from his or her rent.
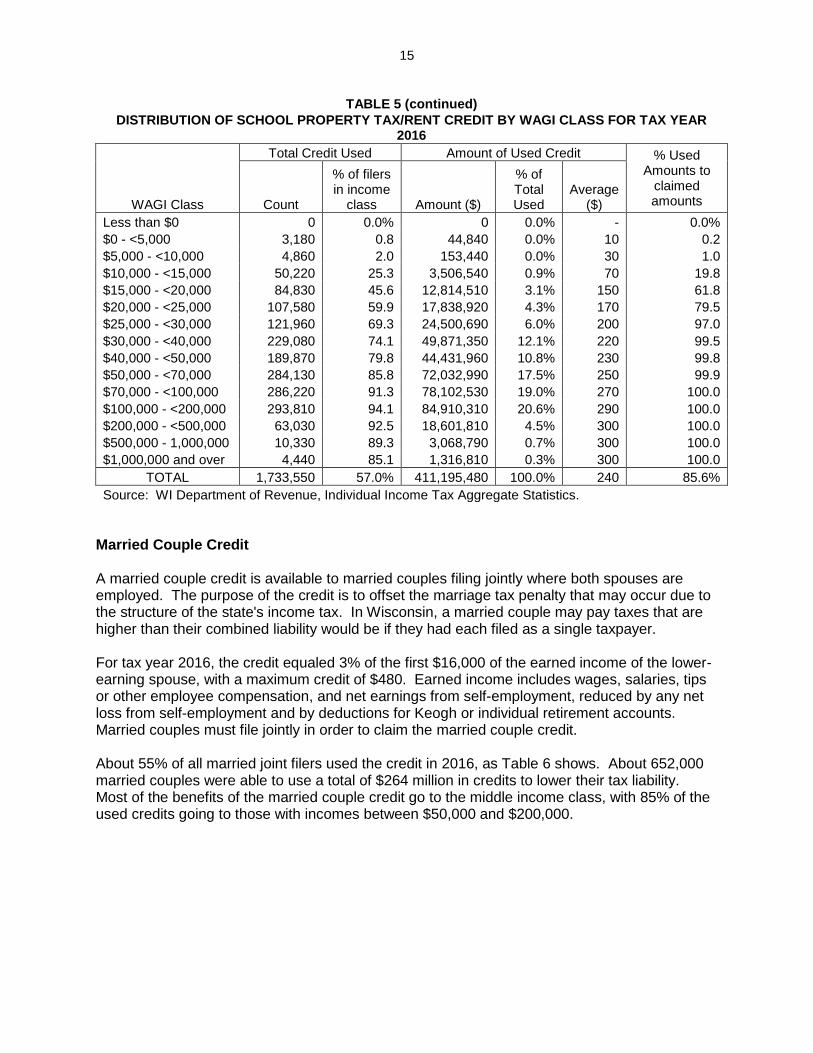
The school property tax credit has the highest participation rate of all the nonrefundable credits. As Table 5 shows, out of 3.04 million tax filers, 2.01 million (or 66%) claimed a total of $480 million in credits: $354 million in property tax credits and $124 million in rent credits. (The total number of claimants is less than the sum of property tax credit claimants and rent credit claimants because some filers claim both credits if they were renters for part of the year and homeowners for the remainder of the year.) The credit is nonrefundable, so some filers who claim it may not be able to fully use it if they have more credit than tax liability. As such, 1.73 million filers were able to use the credit, and the total amount of used credit was $411 million, or 86% of the amount claimed.
Low-income filers were less likely to fully use their credit. Credits used are less than 1% of credits claimed for filers with WAGI less than $10,000, but close to 100% for filers with WAGI of $25,000 or more. Of the $411 million in total used school property tax/rent credit, 40% went to those with incomes of $30,000 - $70,000. The $2,500 cap on property taxes or rent equivalent that are eligible for the credit limits the value of the credit to upper-income filers who tend to live in homes with higher property values and thus pay higher property taxes. As seen in Table 5, filers with WAGI of $100,000 or more had average credits that approach the $300 maximum.
14
TABLE 5
DISTRIBUTION OF SCHOOL PROPERTY TAX/RENT CREDIT BY WAGI CLASS, TAX YEAR 2016
WAGI Class
Tax Filers School Property Tax/Rent Credit
Count
Property Tax Credit Claimed Rent Credit Claimed Total Credit Claimed
Count Amount ($) Average
($) Count Amount ($) Average
($) Count Amount ($)
Less than $0 55,250 15,050 3,380,060 220 3,720 631,510 170 18,500 4,011,570
$0 - <5,000 417,080 64,340 15,085,120 230 46,530 6,625,000 140 108,830 21,710,130
$5,000 - <10,000 239,840 40,680 9,558,630 230 44,570 5,951,420 130 83,940 15,510,050
$10,000 - <15,000 198,690 42,030 9,887,780 240 55,400 7,835,700 140 95,980 17,723,480
$15,000 - <20,000 186,190 46,890 11,129,770 240 62,330 9,600,890 150 107,390 20,730,660
$20,000 - <25,000 179,450 49,420 11,765,730 240 65,910 10,684,780 160 113,200 22,450,510
$25,000 - <30,000 176,040 56,220 13,478,190 240 68,980 11,770,250 170 122,580 25,248,440
$30,000 - <40,000 309,070 119,860 29,066,760 240 115,530 21,063,940 180 229,860 50,130,690
$40,000 - <50,000 237,870 117,590 29,213,910 250 77,710 15,324,080 200 190,210 44,537,980
$50,000 - <70,000 331,220 210,500 54,604,590 260 81,600 17,509,650 210 284,390 72,114,240
$70,000 - <100,000 313,400 247,680 67,612,240 270 45,240 10,521,600 230 286,320 78,133,840
$100,000 - <200,000 312,210 277,070 79,703,190 290 21,630 5,215,730 240 293,840 84,918,920
$200,000 - <500,000 68,110 61,020 17,957,140 290 2,550 645,270 250 63,040 18,602,410
$500,000 - 1,000,000 11,570 10,130 3,006,640 300 240 62,440 260 10,330 3,069,090
$1,000,000 and over 5,220 4,370 1,297,490 300 70 19,310 270 4,440 1,316,810
TOTAL 3,041,210 1,362,840 356,747,240 260 692,010 123,461,570 180 2,012,830 480,208,820
Source: WI Department of Revenue, Individual Income Tax Aggregate Statistics.
15
TABLE 5 (continued)
DISTRIBUTION OF SCHOOL PROPERTY TAX/RENT CREDIT BY WAGI CLASS FOR TAX YEAR 2016
WAGI Class
Total Credit Used Amount of Used Credit % Used Amounts to
claimed amounts Count
% of filers in income
class Amount ($)
% of Total Used
Average ($)
Less than $0 0 0.0% 0 0.0% - 0.0%
$0 - <5,000 3,180 0.8 44,840 0.0% 10 0.2
$5,000 - <10,000 4,860 2.0 153,440 0.0% 30 1.0
$10,000 - <15,000 50,220 25.3 3,506,540 0.9% 70 19.8
$15,000 - <20,000 84,830 45.6 12,814,510 3.1% 150 61.8
$20,000 - <25,000 107,580 59.9 17,838,920 4.3% 170 79.5
$25,000 - <30,000 121,960 69.3 24,500,690 6.0% 200 97.0
$30,000 - <40,000 229,080 74.1 49,871,350 12.1% 220 99.5
$40,000 - <50,000 189,870 79.8 44,431,960 10.8% 230 99.8
$50,000 - <70,000 284,130 85.8 72,032,990 17.5% 250 99.9
$70,000 - <100,000 286,220 91.3 78,102,530 19.0% 270 100.0
$100,000 - <200,000 293,810 94.1 84,910,310 20.6% 290 100.0
$200,000 - <500,000 63,030 92.5 18,601,810 4.5% 300 100.0
$500,000 - 1,000,000 10,330 89.3 3,068,790 0.7% 300 100.0
$1,000,000 and over 4,440 85.1 1,316,810 0.3% 300 100.0
TOTAL 1,733,550 57.0% 411,195,480 100.0% 240 85.6%
Source: WI Department of Revenue, Individual Income Tax Aggregate Statistics.
Married Couple Credit A married couple credit is available to married couples filing jointly where both spouses are employed. The purpose of the credit is to offset the marriage tax penalty that may occur due to the structure of the state's income tax. In Wisconsin, a married couple may pay taxes that are higher than their combined liability would be if they had each filed as a single taxpayer.
For tax year 2016, the credit equaled 3% of the first $16,000 of the earned income of the lower-earning spouse, with a maximum credit of $480. Earned income includes wages, salaries, tips or other employee compensation, and net earnings from self-employment, reduced by any net loss from self-employment and by deductions for Keogh or individual retirement accounts. Married couples must file jointly in order to claim the married couple credit.
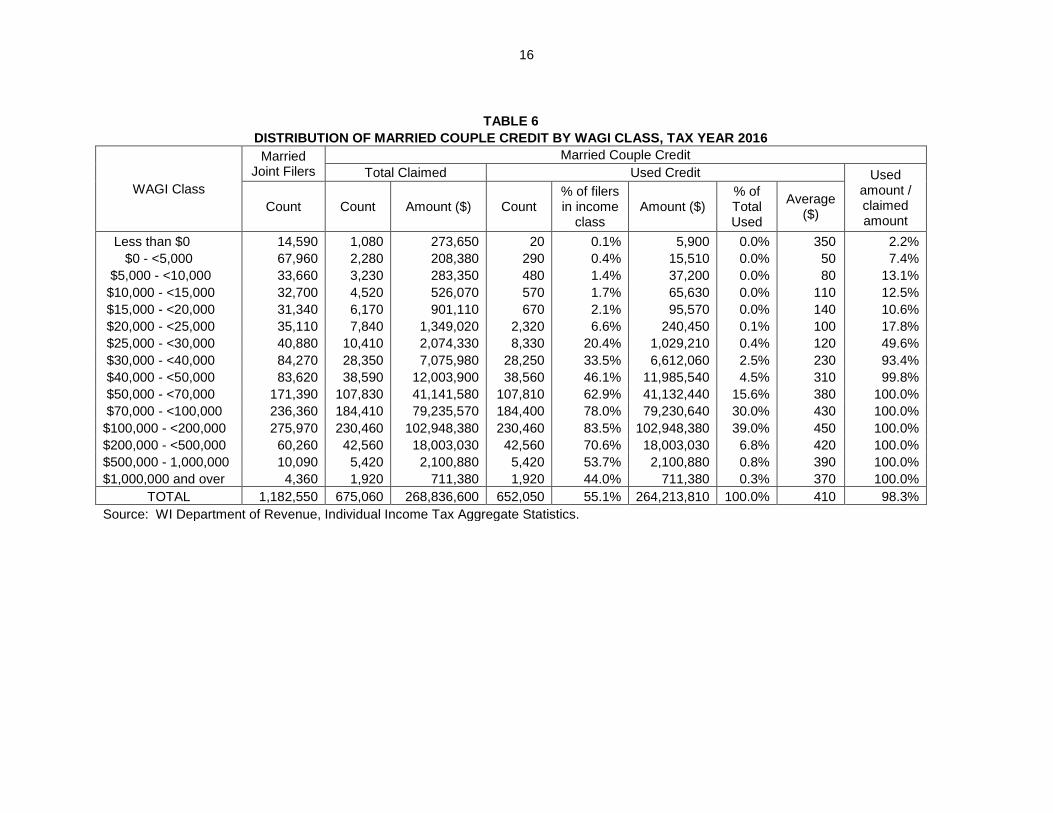
About 55% of all married joint filers used the credit in 2016, as Table 6 shows. About 652,000 married couples were able to use a total of $264 million in credits to lower their tax liability. Most of the benefits of the married couple credit go to the middle income class, with 85% of the used credits going to those with incomes between $50,000 and $200,000.
16
TABLE 6
DISTRIBUTION OF MARRIED COUPLE CREDIT BY WAGI CLASS, TAX YEAR 2016
WAGI Class
Married Joint Filers
Married Couple Credit
Total Claimed Used Credit Used amount / claimed amount
Count Count Amount ($) Count % of filers in income
class Amount ($)
% of Total Used
Average ($)
Less than $0 14,590 1,080 273,650 20 0.1% 5,900 0.0% 350 2.2%
$0 - <5,000 67,960 2,280 208,380 290 0.4% 15,510 0.0% 50 7.4%
$5,000 - <10,000 33,660 3,230 283,350 480 1.4% 37,200 0.0% 80 13.1%
$10,000 - <15,000 32,700 4,520 526,070 570 1.7% 65,630 0.0% 110 12.5%
$15,000 - <20,000 31,340 6,170 901,110 670 2.1% 95,570 0.0% 140 10.6%
$20,000 - <25,000 35,110 7,840 1,349,020 2,320 6.6% 240,450 0.1% 100 17.8%
$25,000 - <30,000 40,880 10,410 2,074,330 8,330 20.4% 1,029,210 0.4% 120 49.6%
$30,000 - <40,000 84,270 28,350 7,075,980 28,250 33.5% 6,612,060 2.5% 230 93.4%
$40,000 - <50,000 83,620 38,590 12,003,900 38,560 46.1% 11,985,540 4.5% 310 99.8%
$50,000 - <70,000 171,390 107,830 41,141,580 107,810 62.9% 41,132,440 15.6% 380 100.0%
$70,000 - <100,000 236,360 184,410 79,235,570 184,400 78.0% 79,230,640 30.0% 430 100.0%
$100,000 - <200,000 275,970 230,460 102,948,380 230,460 83.5% 102,948,380 39.0% 450 100.0%
$200,000 - <500,000 60,260 42,560 18,003,030 42,560 70.6% 18,003,030 6.8% 420 100.0%
$500,000 - 1,000,000 10,090 5,420 2,100,880 5,420 53.7% 2,100,880 0.8% 390 100.0%
$1,000,000 and over 4,360 1,920 711,380 1,920 44.0% 711,380 0.3% 370 100.0%
TOTAL 1,182,550 675,060 268,836,600 652,050 55.1% 264,213,810 100.0% 410 98.3%
Source: WI Department of Revenue, Individual Income Tax Aggregate Statistics.

17
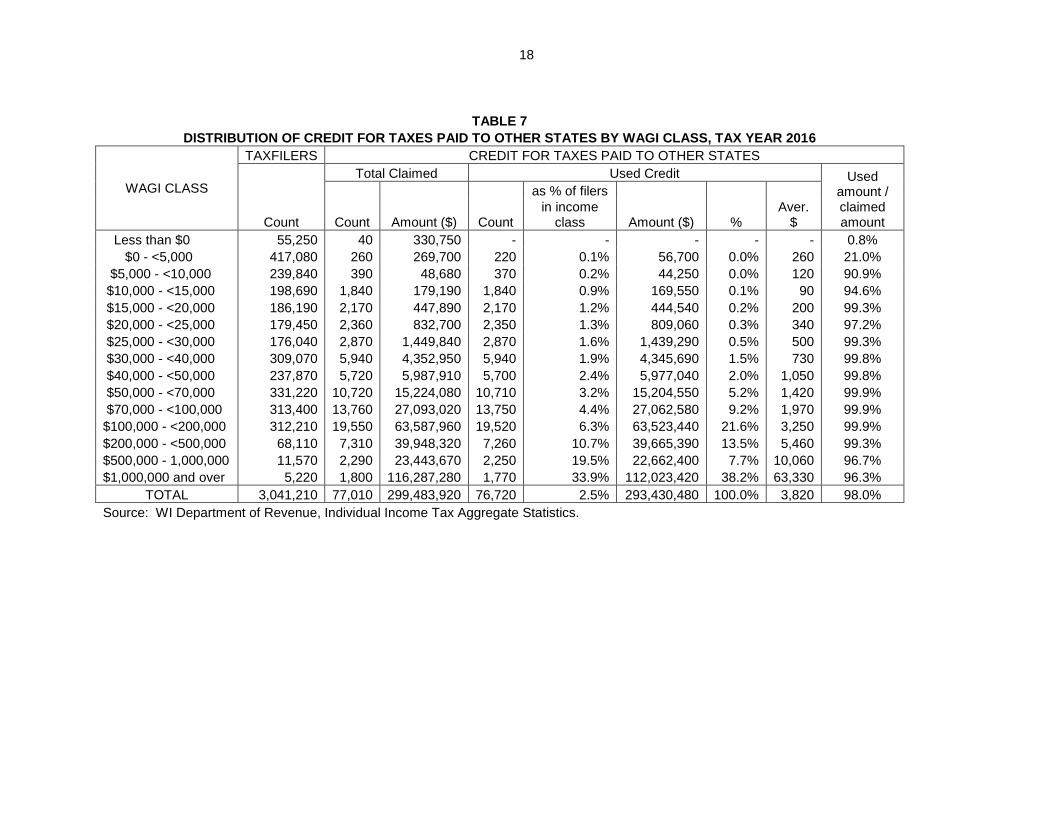
Credit for Taxes Paid to Other States The credit for taxes paid to other states ensures that individuals who live in Wisconsin do not have to pay state income tax on income that has also been taxed by another state. In general, residents of a state are required to report all of their taxable income to their state of residency and calculate gross tax using all income, regardless of where it was earned. States also tax nonresident individuals on income earned in the state. The result is that some income may be taxable to more than one state. As such, every state offers a credit for residents to offset taxes paid to other states. Similar to the credit, Wisconsin also has income tax reciprocity agreements with Illinois, Indiana, Kentucky, and Michigan for personal service income. Under these agreements, individuals who live in Wisconsin and work in the other states are not taxed by the other states on personal service income and consequently may not claim a credit for tax paid to the other state for that income. Wisconsin has also agreed to forgo taxing personal service income earned in Wisconsin by residents of the other states. These agreements allow individuals to file a tax return only for their resident state. Individuals with income above $200,000 claim about 60% of the total credit. Meanwhile, individuals with income below $50,000 claim about 5% of the total credit. This generally reflects that high income filers have a larger share of income derived from out-of-state sources.
18
TABLE 7
DISTRIBUTION OF CREDIT FOR TAXES PAID TO OTHER STATES BY WAGI CLASS, TAX YEAR 2016
WAGI CLASS
TAXFILERS CREDIT FOR TAXES PAID TO OTHER STATES
Total Claimed Used Credit Used
amount / claimed amount
as % of filers
Count Count Amount ($) Count in income
class Amount ($) % Aver.
$
Less than $0 55,250 40 330,750 - - - - - 0.8%
$0 - <5,000 417,080 260 269,700 220 0.1% 56,700 0.0% 260 21.0%
$5,000 - <10,000 239,840 390 48,680 370 0.2% 44,250 0.0% 120 90.9%
$10,000 - <15,000 198,690 1,840 179,190 1,840 0.9% 169,550 0.1% 90 94.6%
$15,000 - <20,000 186,190 2,170 447,890 2,170 1.2% 444,540 0.2% 200 99.3%
$20,000 - <25,000 179,450 2,360 832,700 2,350 1.3% 809,060 0.3% 340 97.2%
$25,000 - <30,000 176,040 2,870 1,449,840 2,870 1.6% 1,439,290 0.5% 500 99.3%
$30,000 - <40,000 309,070 5,940 4,352,950 5,940 1.9% 4,345,690 1.5% 730 99.8%
$40,000 - <50,000 237,870 5,720 5,987,910 5,700 2.4% 5,977,040 2.0% 1,050 99.8%
$50,000 - <70,000 331,220 10,720 15,224,080 10,710 3.2% 15,204,550 5.2% 1,420 99.9%
$70,000 - <100,000 313,400 13,760 27,093,020 13,750 4.4% 27,062,580 9.2% 1,970 99.9%
$100,000 - <200,000 312,210 19,550 63,587,960 19,520 6.3% 63,523,440 21.6% 3,250 99.9%
$200,000 - <500,000 68,110 7,310 39,948,320 7,260 10.7% 39,665,390 13.5% 5,460 99.3%
$500,000 - 1,000,000 11,570 2,290 23,443,670 2,250 19.5% 22,662,400 7.7% 10,060 96.7%
$1,000,000 and over 5,220 1,800 116,287,280 1,770 33.9% 112,023,420 38.2% 63,330 96.3%
TOTAL 3,041,210 77,010 299,483,920 76,720 2.5% 293,430,480 100.0% 3,820 98.0%
Source: WI Department of Revenue, Individual Income Tax Aggregate Statistics.
19
Other Nonrefundable Credits
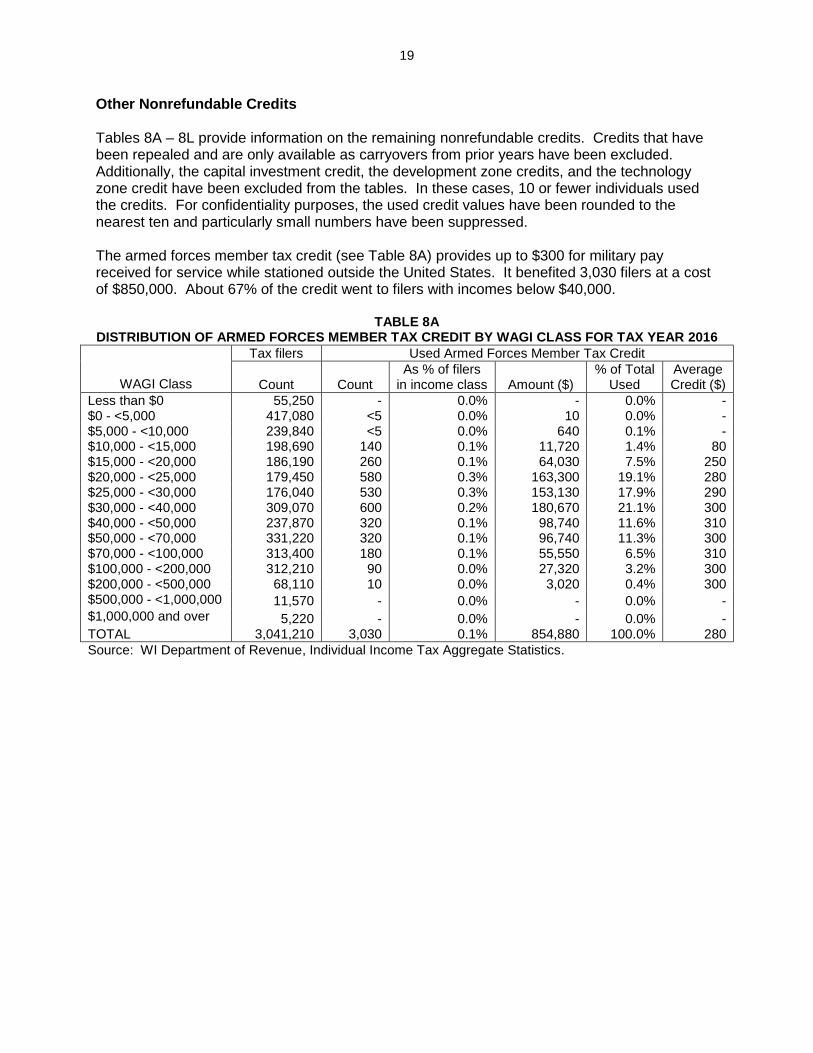
Tables 8A – 8L provide information on the remaining nonrefundable credits. Credits that have been repealed and are only available as carryovers from prior years have been excluded. Additionally, the capital investment credit, the development zone credits, and the technology zone credit have been excluded from the tables. In these cases, 10 or fewer individuals used the credits. For confidentiality purposes, the used credit values have been rounded to the nearest ten and particularly small numbers have been suppressed. The armed forces member tax credit (see Table 8A) provides up to $300 for military pay received for service while stationed outside the United States. It benefited 3,030 filers at a cost of $850,000. About 67% of the credit went to filers with incomes below $40,000.
TABLE 8A DISTRIBUTION OF ARMED FORCES MEMBER TAX CREDIT BY WAGI CLASS FOR TAX YEAR 2016
WAGI Class
Tax filers Used Armed Forces Member Tax Credit
Count
Count
As % of filers in income class
Amount ($)
% of Total Used
Average Credit ($)
Less than $0 55,250 - 0.0% - 0.0% - $0 - <5,000 417,080 <5 0.0% 10 0.0% - $5,000 - <10,000 239,840 <5 0.0% 640 0.1% - $10,000 - <15,000 198,690 140 0.1% 11,720 1.4% 80 $15,000 - <20,000 186,190 260 0.1% 64,030 7.5% 250 $20,000 - <25,000 179,450 580 0.3% 163,300 19.1% 280 $25,000 - <30,000 176,040 530 0.3% 153,130 17.9% 290 $30,000 - <40,000 309,070 600 0.2% 180,670 21.1% 300 $40,000 - <50,000 237,870 320 0.1% 98,740 11.6% 310 $50,000 - <70,000 331,220 320 0.1% 96,740 11.3% 300 $70,000 - <100,000 313,400 180 0.1% 55,550 6.5% 310 $100,000 - <200,000 312,210 90 0.0% 27,320 3.2% 300 $200,000 - <500,000 68,110 10 0.0% 3,020 0.4% 300 $500,000 - <1,000,000 11,570 - 0.0% - 0.0% - $1,000,000 and over 5,220 - 0.0% - 0.0% - TOTAL 3,041,210 3,030 0.1% 854,880 100.0% 280
Source: WI Department of Revenue, Individual Income Tax Aggregate Statistics.
20
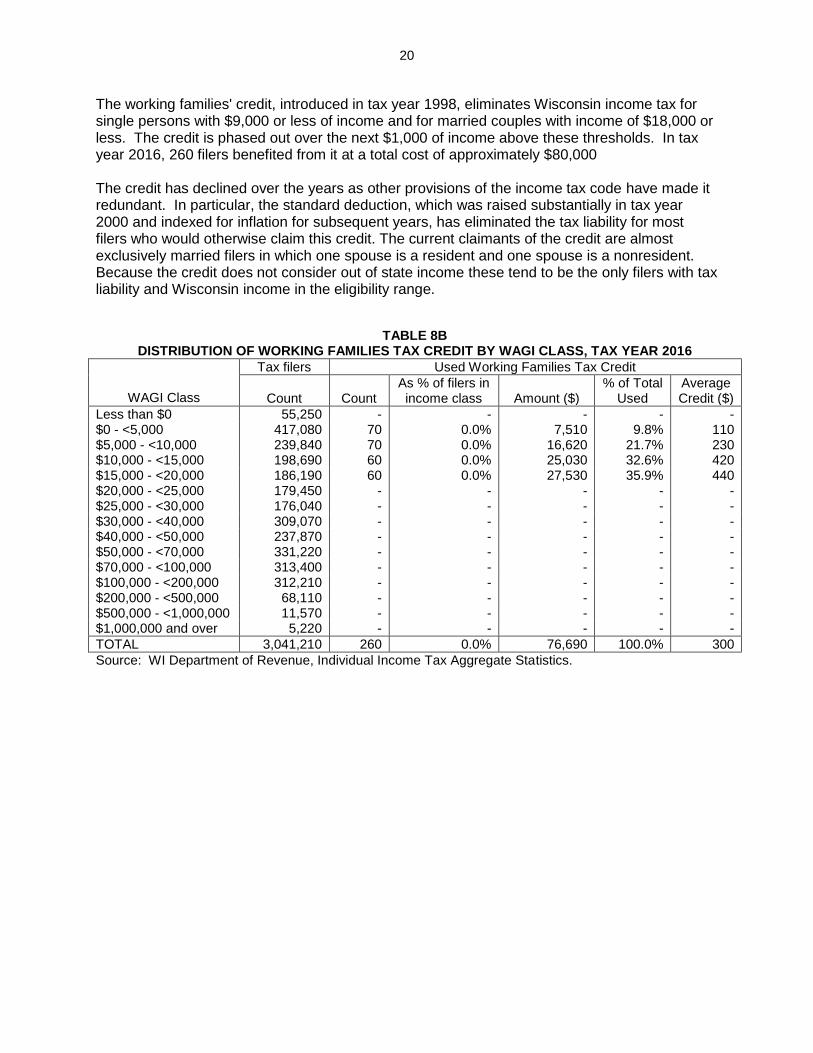
The working families' credit, introduced in tax year 1998, eliminates Wisconsin income tax for single persons with $9,000 or less of income and for married couples with income of $18,000 or less. The credit is phased out over the next $1,000 of income above these thresholds. In tax year 2016, 260 filers benefited from it at a total cost of approximately $80,000 The credit has declined over the years as other provisions of the income tax code have made it redundant. In particular, the standard deduction, which was raised substantially in tax year 2000 and indexed for inflation for subsequent years, has eliminated the tax liability for most filers who would otherwise claim this credit. The current claimants of the credit are almost exclusively married filers in which one spouse is a resident and one spouse is a nonresident. Because the credit does not consider out of state income these tend to be the only filers with tax liability and Wisconsin income in the eligibility range.
TABLE 8B DISTRIBUTION OF WORKING FAMILIES TAX CREDIT BY WAGI CLASS, TAX YEAR 2016
WAGI Class
Tax filers Used Working Families Tax Credit
Count
Count
As % of filers in income class
Amount ($)
% of Total Used
Average Credit ($)
Less than $0 55,250 - - - - - $0 - <5,000 417,080 70 0.0% 7,510 9.8% 110 $5,000 - <10,000 239,840 70 0.0% 16,620 21.7% 230 $10,000 - <15,000 198,690 60 0.0% 25,030 32.6% 420 $15,000 - <20,000 186,190 60 0.0% 27,530 35.9% 440 $20,000 - <25,000 179,450 - - - - - $25,000 - <30,000 176,040 - - - - - $30,000 - <40,000 309,070 - - - - - $40,000 - <50,000 237,870 - - - - - $50,000 - <70,000 331,220 - - - - - $70,000 - <100,000 313,400 - - - - - $100,000 - <200,000 312,210 - - - - - $200,000 - <500,000 68,110 - - - - - $500,000 - <1,000,000 11,570 - - - - - $1,000,000 and over 5,220 - - - - -
TOTAL 3,041,210 260 0.0% 76,690 100.0% 300
Source: WI Department of Revenue, Individual Income Tax Aggregate Statistics.
21
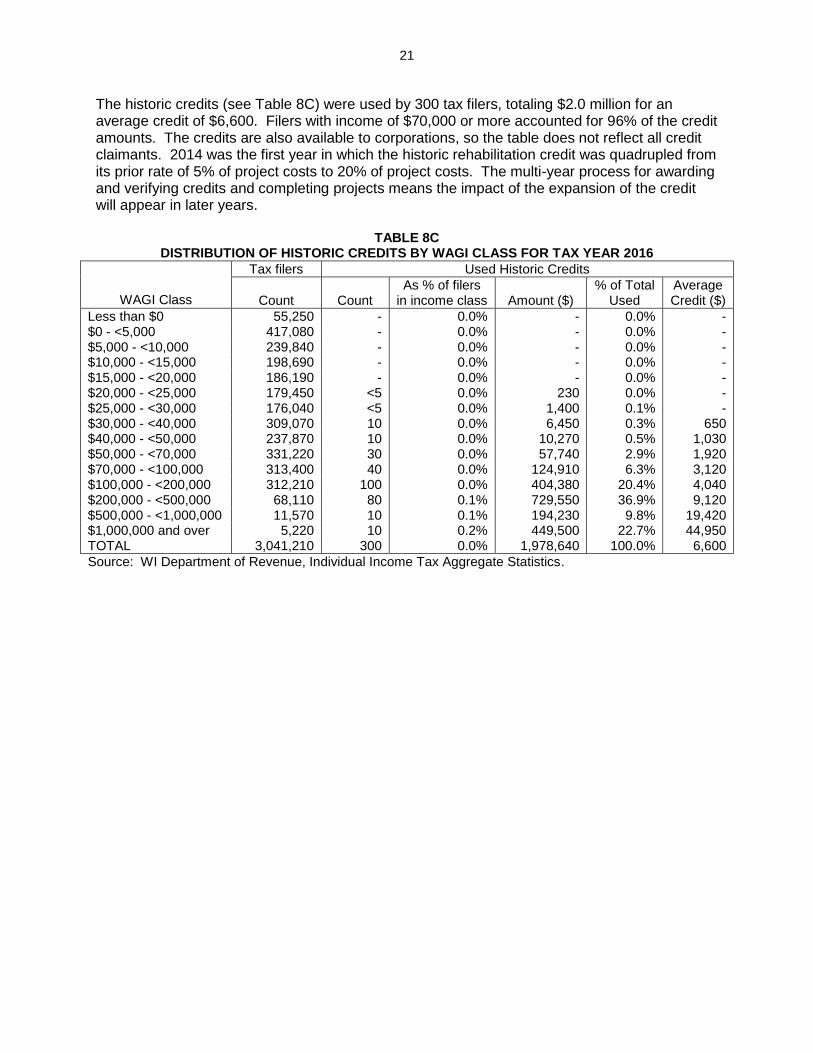
The historic credits (see Table 8C) were used by 300 tax filers, totaling $2.0 million for an average credit of $6,600. Filers with income of $70,000 or more accounted for 96% of the credit amounts. The credits are also available to corporations, so the table does not reflect all credit claimants. 2014 was the first year in which the historic rehabilitation credit was quadrupled from its prior rate of 5% of project costs to 20% of project costs. The multi-year process for awarding and verifying credits and completing projects means the impact of the expansion of the credit will appear in later years.
TABLE 8C DISTRIBUTION OF HISTORIC CREDITS BY WAGI CLASS FOR TAX YEAR 2016
WAGI Class
Tax filers Used Historic Credits
Count
Count
As % of filers in income class
Amount ($)
% of Total Used
Average Credit ($)
Less than $0 55,250 - 0.0% - 0.0% - $0 - <5,000 417,080 - 0.0% - 0.0% - $5,000 - <10,000 239,840 - 0.0% - 0.0% - $10,000 - <15,000 198,690 - 0.0% - 0.0% - $15,000 - <20,000 186,190 - 0.0% - 0.0% - $20,000 - <25,000 179,450 <5 0.0% 230 0.0% - $25,000 - <30,000 176,040 <5 0.0% 1,400 0.1% - $30,000 - <40,000 309,070 10 0.0% 6,450 0.3% 650 $40,000 - <50,000 237,870 10 0.0% 10,270 0.5% 1,030 $50,000 - <70,000 331,220 30 0.0% 57,740 2.9% 1,920 $70,000 - <100,000 313,400 40 0.0% 124,910 6.3% 3,120 $100,000 - <200,000 312,210 100 0.0% 404,380 20.4% 4,040 $200,000 - <500,000 68,110 80 0.1% 729,550 36.9% 9,120 $500,000 - <1,000,000 11,570 10 0.1% 194,230 9.8% 19,420 $1,000,000 and over 5,220 10 0.2% 449,500 22.7% 44,950 TOTAL 3,041,210 300 0.0% 1,978,640 100.0% 6,600
Source: WI Department of Revenue, Individual Income Tax Aggregate Statistics.
22
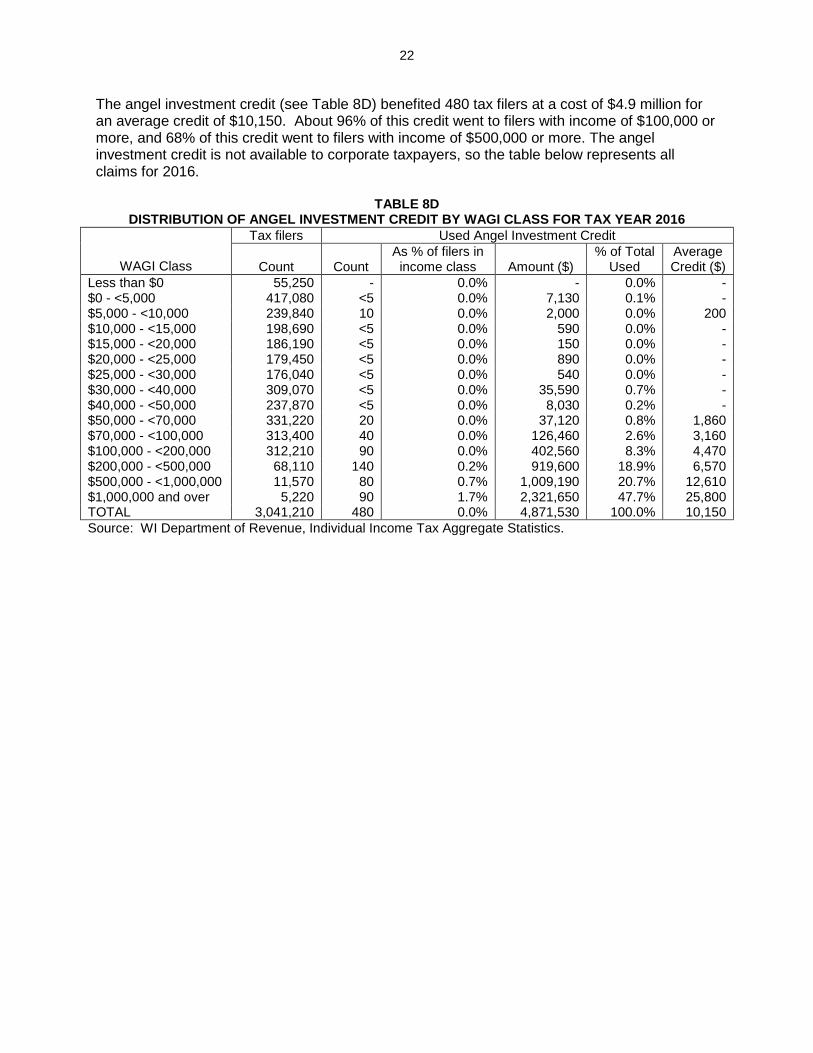
The angel investment credit (see Table 8D) benefited 480 tax filers at a cost of $4.9 million for an average credit of $10,150. About 96% of this credit went to filers with income of $100,000 or more, and 68% of this credit went to filers with income of $500,000 or more. The angel investment credit is not available to corporate taxpayers, so the table below represents all claims for 2016.
TABLE 8D DISTRIBUTION OF ANGEL INVESTMENT CREDIT BY WAGI CLASS FOR TAX YEAR 2016
WAGI Class
Tax filers Used Angel Investment Credit
Count
Count
As % of filers in income class
Amount ($)
% of Total Used
Average Credit ($)
Less than $0 55,250 - 0.0% - 0.0% - $0 - <5,000 417,080 <5 0.0% 7,130 0.1% - $5,000 - <10,000 239,840 10 0.0% 2,000 0.0% 200 $10,000 - <15,000 198,690 <5 0.0% 590 0.0% - $15,000 - <20,000 186,190 <5 0.0% 150 0.0% - $20,000 - <25,000 179,450 <5 0.0% 890 0.0% - $25,000 - <30,000 176,040 <5 0.0% 540 0.0% - $30,000 - <40,000 309,070 <5 0.0% 35,590 0.7% - $40,000 - <50,000 237,870 <5 0.0% 8,030 0.2% - $50,000 - <70,000 331,220 20 0.0% 37,120 0.8% 1,860 $70,000 - <100,000 313,400 40 0.0% 126,460 2.6% 3,160 $100,000 - <200,000 312,210 90 0.0% 402,560 8.3% 4,470 $200,000 - <500,000 68,110 140 0.2% 919,600 18.9% 6,570 $500,000 - <1,000,000 11,570 80 0.7% 1,009,190 20.7% 12,610 $1,000,000 and over 5,220 90 1.7% 2,321,650 47.7% 25,800 TOTAL 3,041,210 480 0.0% 4,871,530 100.0% 10,150
Source: WI Department of Revenue, Individual Income Tax Aggregate Statistics.
23
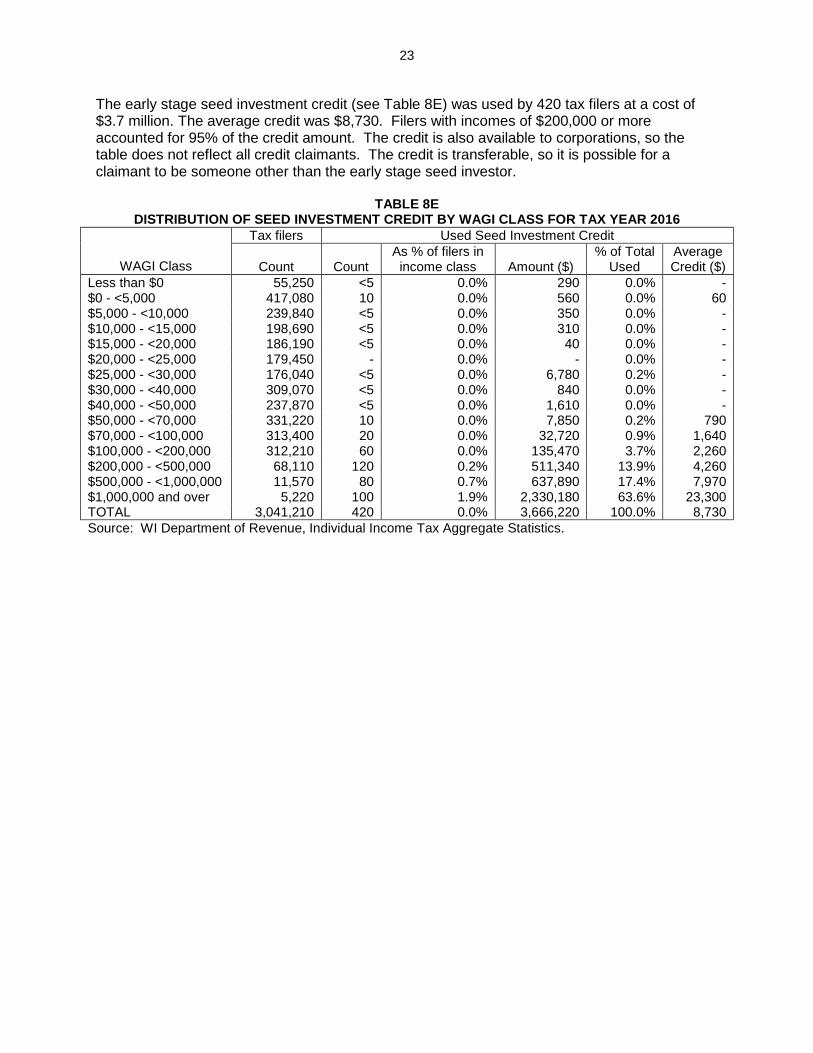
The early stage seed investment credit (see Table 8E) was used by 420 tax filers at a cost of $3.7 million. The average credit was $8,730. Filers with incomes of $200,000 or more accounted for 95% of the credit amount. The credit is also available to corporations, so the table does not reflect all credit claimants. The credit is transferable, so it is possible for a claimant to be someone other than the early stage seed investor.
TABLE 8E DISTRIBUTION OF SEED INVESTMENT CREDIT BY WAGI CLASS FOR TAX YEAR 2016
WAGI Class
Tax filers Used Seed Investment Credit
Count
Count
As % of filers in income class
Amount ($)
% of Total Used
Average Credit ($)
Less than $0 55,250 <5 0.0% 290 0.0% - $0 - <5,000 417,080 10 0.0% 560 0.0% 60 $5,000 - <10,000 239,840 <5 0.0% 350 0.0% - $10,000 - <15,000 198,690 <5 0.0% 310 0.0% - $15,000 - <20,000 186,190 <5 0.0% 40 0.0% - $20,000 - <25,000 179,450 - 0.0% - 0.0% - $25,000 - <30,000 176,040 <5 0.0% 6,780 0.2% - $30,000 - <40,000 309,070 <5 0.0% 840 0.0% - $40,000 - <50,000 237,870 <5 0.0% 1,610 0.0% - $50,000 - <70,000 331,220 10 0.0% 7,850 0.2% 790 $70,000 - <100,000 313,400 20 0.0% 32,720 0.9% 1,640 $100,000 - <200,000 312,210 60 0.0% 135,470 3.7% 2,260 $200,000 - <500,000 68,110 120 0.2% 511,340 13.9% 4,260 $500,000 - <1,000,000 11,570 80 0.7% 637,890 17.4% 7,970 $1,000,000 and over 5,220 100 1.9% 2,330,180 63.6% 23,300 TOTAL 3,041,210 420 0.0% 3,666,220 100.0% 8,730
Source: WI Department of Revenue, Individual Income Tax Aggregate Statistics.
24
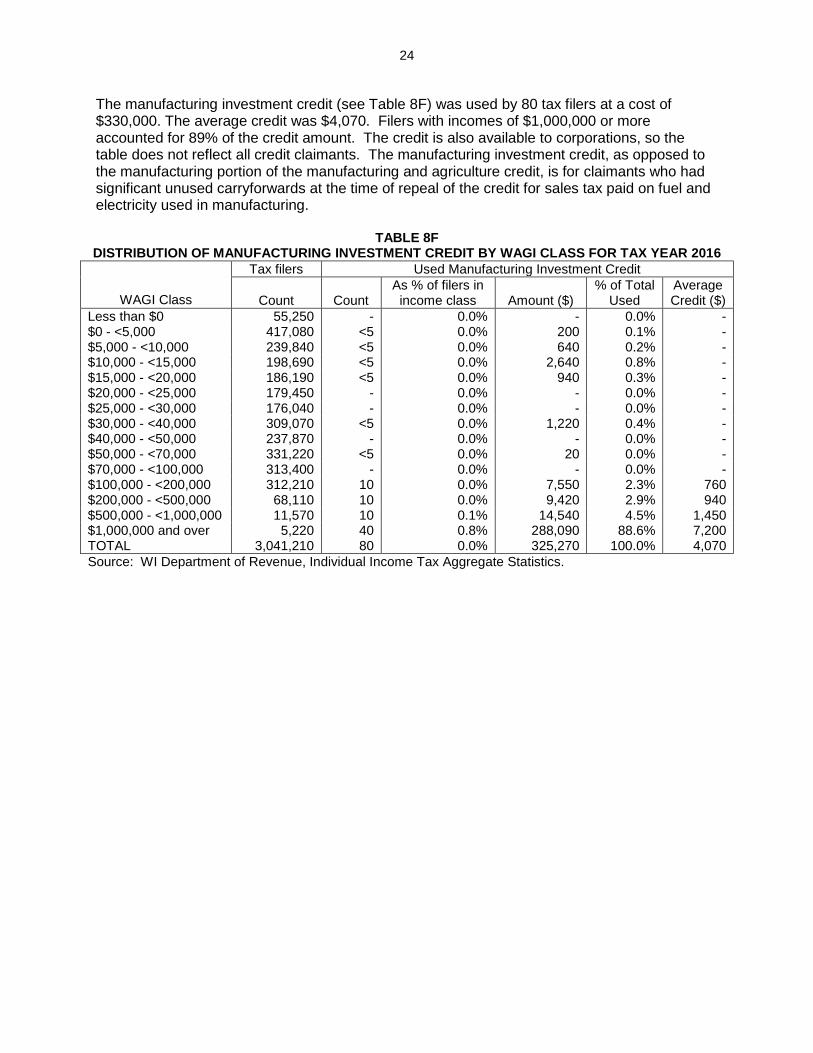
The manufacturing investment credit (see Table 8F) was used by 80 tax filers at a cost of $330,000. The average credit was $4,070. Filers with incomes of $1,000,000 or more accounted for 89% of the credit amount. The credit is also available to corporations, so the table does not reflect all credit claimants. The manufacturing investment credit, as opposed to the manufacturing portion of the manufacturing and agriculture credit, is for claimants who had significant unused carryforwards at the time of repeal of the credit for sales tax paid on fuel and electricity used in manufacturing.
TABLE 8F DISTRIBUTION OF MANUFACTURING INVESTMENT CREDIT BY WAGI CLASS FOR TAX YEAR 2016
WAGI Class
Tax filers Used Manufacturing Investment Credit
Count
Count
As % of filers in income class
Amount ($)
% of Total Used
Average Credit ($)
Less than $0 55,250 - 0.0% - 0.0% - $0 - <5,000 417,080 <5 0.0% 200 0.1% - $5,000 - <10,000 239,840 <5 0.0% 640 0.2% - $10,000 - <15,000 198,690 <5 0.0% 2,640 0.8% - $15,000 - <20,000 186,190 <5 0.0% 940 0.3% - $20,000 - <25,000 179,450 - 0.0% - 0.0% - $25,000 - <30,000 176,040 - 0.0% - 0.0% - $30,000 - <40,000 309,070 <5 0.0% 1,220 0.4% - $40,000 - <50,000 237,870 - 0.0% - 0.0% - $50,000 - <70,000 331,220 <5 0.0% 20 0.0% - $70,000 - <100,000 313,400 - 0.0% - 0.0% - $100,000 - <200,000 312,210 10 0.0% 7,550 2.3% 760 $200,000 - <500,000 68,110 10 0.0% 9,420 2.9% 940 $500,000 - <1,000,000 11,570 10 0.1% 14,540 4.5% 1,450 $1,000,000 and over 5,220 40 0.8% 288,090 88.6% 7,200 TOTAL 3,041,210 80 0.0% 325,270 100.0% 4,070
Source: WI Department of Revenue, Individual Income Tax Aggregate Statistics.
25
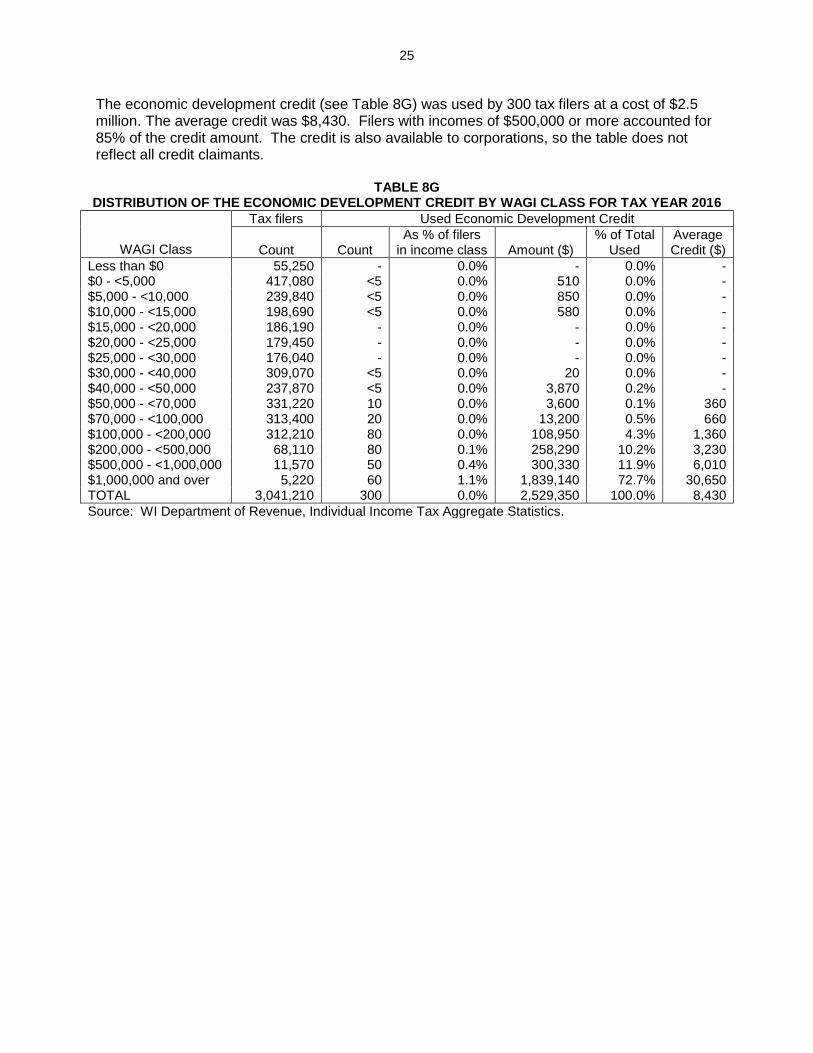
The economic development credit (see Table 8G) was used by 300 tax filers at a cost of $2.5 million. The average credit was $8,430. Filers with incomes of $500,000 or more accounted for 85% of the credit amount. The credit is also available to corporations, so the table does not reflect all credit claimants.
TABLE 8G DISTRIBUTION OF THE ECONOMIC DEVELOPMENT CREDIT BY WAGI CLASS FOR TAX YEAR 2016
WAGI Class
Tax filers Used Economic Development Credit
Count
Count
As % of filers in income class
Amount ($)
% of Total Used
Average Credit ($)
Less than $0 55,250 - 0.0% - 0.0% - $0 - <5,000 417,080 <5 0.0% 510 0.0% - $5,000 - <10,000 239,840 <5 0.0% 850 0.0% - $10,000 - <15,000 198,690 <5 0.0% 580 0.0% - $15,000 - <20,000 186,190 - 0.0% - 0.0% - $20,000 - <25,000 179,450 - 0.0% - 0.0% - $25,000 - <30,000 176,040 - 0.0% - 0.0% - $30,000 - <40,000 309,070 <5 0.0% 20 0.0% - $40,000 - <50,000 237,870 <5 0.0% 3,870 0.2% - $50,000 - <70,000 331,220 10 0.0% 3,600 0.1% 360 $70,000 - <100,000 313,400 20 0.0% 13,200 0.5% 660 $100,000 - <200,000 312,210 80 0.0% 108,950 4.3% 1,360 $200,000 - <500,000 68,110 80 0.1% 258,290 10.2% 3,230 $500,000 - <1,000,000 11,570 50 0.4% 300,330 11.9% 6,010 $1,000,000 and over 5,220 60 1.1% 1,839,140 72.7% 30,650 TOTAL 3,041,210 300 0.0% 2,529,350 100.0% 8,430
Source: WI Department of Revenue, Individual Income Tax Aggregate Statistics.
26
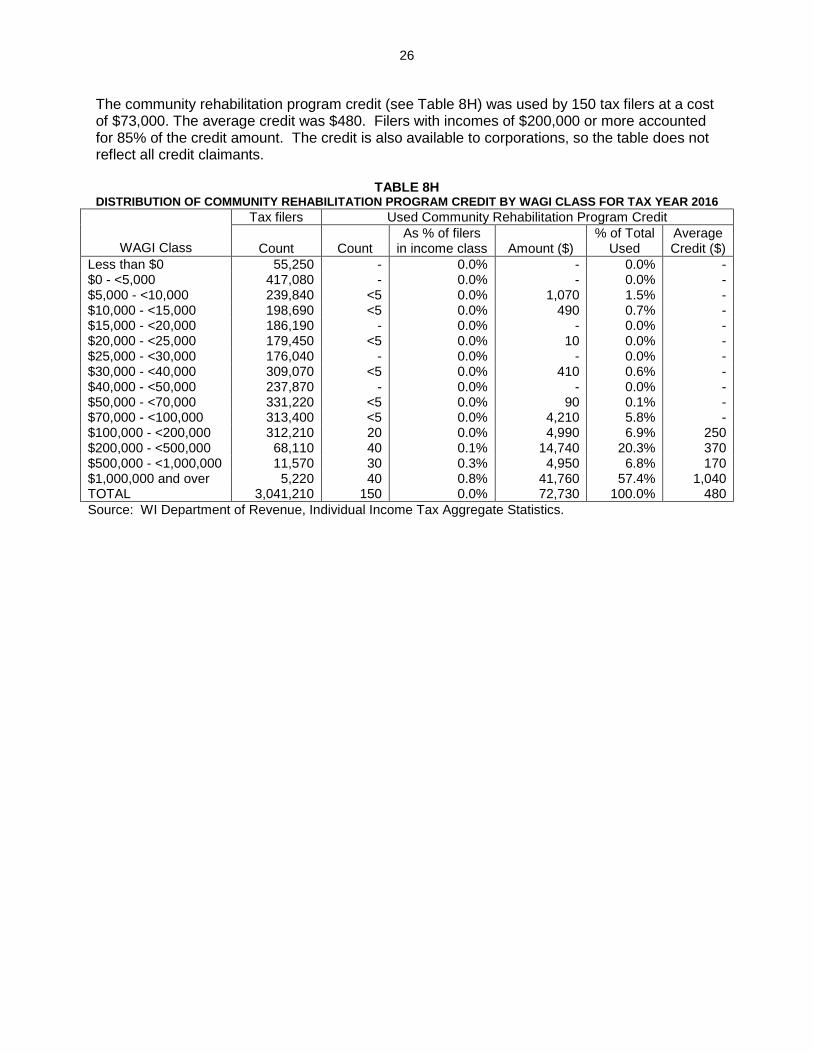
The community rehabilitation program credit (see Table 8H) was used by 150 tax filers at a cost of $73,000. The average credit was $480. Filers with incomes of $200,000 or more accounted for 85% of the credit amount. The credit is also available to corporations, so the table does not reflect all credit claimants.
TABLE 8H DISTRIBUTION OF COMMUNITY REHABILITATION PROGRAM CREDIT BY WAGI CLASS FOR TAX YEAR 2016
WAGI Class
Tax filers Used Community Rehabilitation Program Credit
Count
Count
As % of filers in income class
Amount ($)
% of Total Used
Average Credit ($)
Less than $0 55,250 - 0.0% - 0.0% - $0 - <5,000 417,080 - 0.0% - 0.0% - $5,000 - <10,000 239,840 <5 0.0% 1,070 1.5% - $10,000 - <15,000 198,690 <5 0.0% 490 0.7% - $15,000 - <20,000 186,190 - 0.0% - 0.0% - $20,000 - <25,000 179,450 <5 0.0% 10 0.0% - $25,000 - <30,000 176,040 - 0.0% - 0.0% - $30,000 - <40,000 309,070 <5 0.0% 410 0.6% - $40,000 - <50,000 237,870 - 0.0% - 0.0% - $50,000 - <70,000 331,220 <5 0.0% 90 0.1% - $70,000 - <100,000 313,400 <5 0.0% 4,210 5.8% - $100,000 - <200,000 312,210 20 0.0% 4,990 6.9% 250 $200,000 - <500,000 68,110 40 0.1% 14,740 20.3% 370 $500,000 - <1,000,000 11,570 30 0.3% 4,950 6.8% 170 $1,000,000 and over 5,220 40 0.8% 41,760 57.4% 1,040 TOTAL 3,041,210 150 0.0% 72,730 100.0% 480
Source: WI Department of Revenue, Individual Income Tax Aggregate Statistics.
27
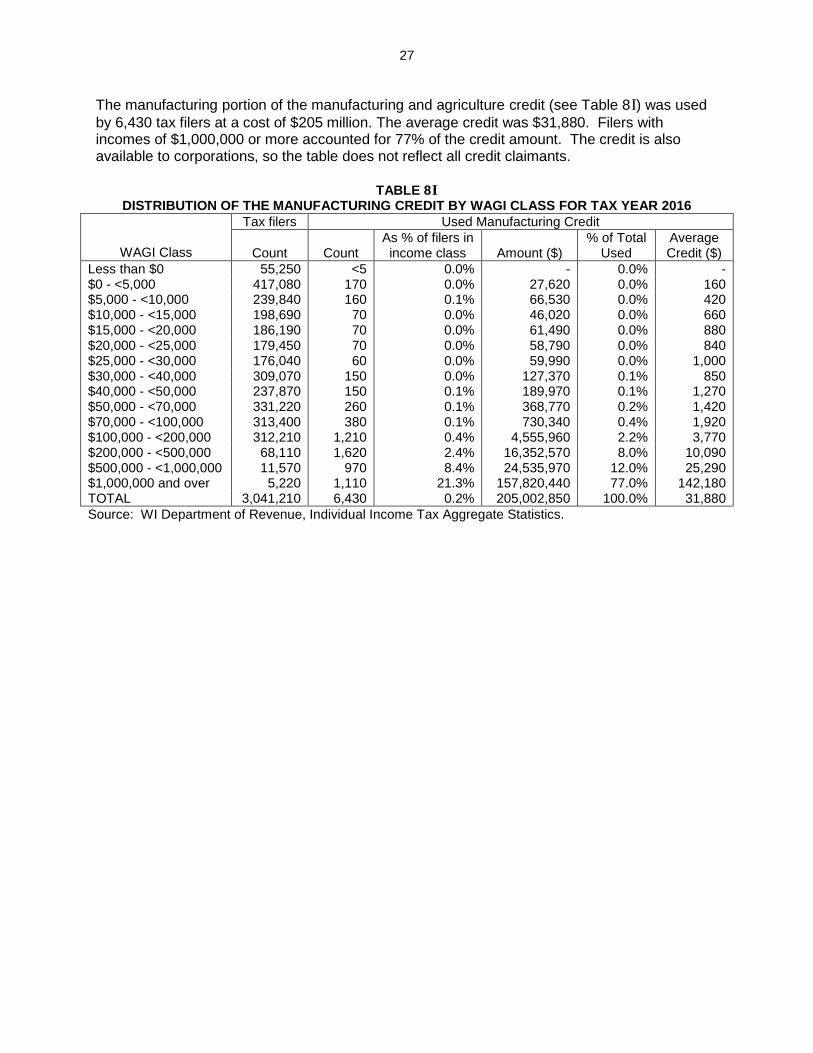
The manufacturing portion of the manufacturing and agriculture credit (see Table 8 I) was used
by 6,430 tax filers at a cost of $205 million. The average credit was $31,880. Filers with incomes of $1,000,000 or more accounted for 77% of the credit amount. The credit is also available to corporations, so the table does not reflect all credit claimants.
TABLE 8 I DISTRIBUTION OF THE MANUFACTURING CREDIT BY WAGI CLASS FOR TAX YEAR 2016
WAGI Class
Tax filers Used Manufacturing Credit
Count
Count
As % of filers in income class
Amount ($)
% of Total Used
Average Credit ($)
Less than $0 55,250 <5 0.0% - 0.0% - $0 - <5,000 417,080 170 0.0% 27,620 0.0% 160 $5,000 - <10,000 239,840 160 0.1% 66,530 0.0% 420 $10,000 - <15,000 198,690 70 0.0% 46,020 0.0% 660 $15,000 - <20,000 186,190 70 0.0% 61,490 0.0% 880 $20,000 - <25,000 179,450 70 0.0% 58,790 0.0% 840 $25,000 - <30,000 176,040 60 0.0% 59,990 0.0% 1,000 $30,000 - <40,000 309,070 150 0.0% 127,370 0.1% 850 $40,000 - <50,000 237,870 150 0.1% 189,970 0.1% 1,270 $50,000 - <70,000 331,220 260 0.1% 368,770 0.2% 1,420 $70,000 - <100,000 313,400 380 0.1% 730,340 0.4% 1,920 $100,000 - <200,000 312,210 1,210 0.4% 4,555,960 2.2% 3,770 $200,000 - <500,000 68,110 1,620 2.4% 16,352,570 8.0% 10,090 $500,000 - <1,000,000 11,570 970 8.4% 24,535,970 12.0% 25,290 $1,000,000 and over 5,220 1,110 21.3% 157,820,440 77.0% 142,180 TOTAL 3,041,210 6,430 0.2% 205,002,850 100.0% 31,880
Source: WI Department of Revenue, Individual Income Tax Aggregate Statistics.
28
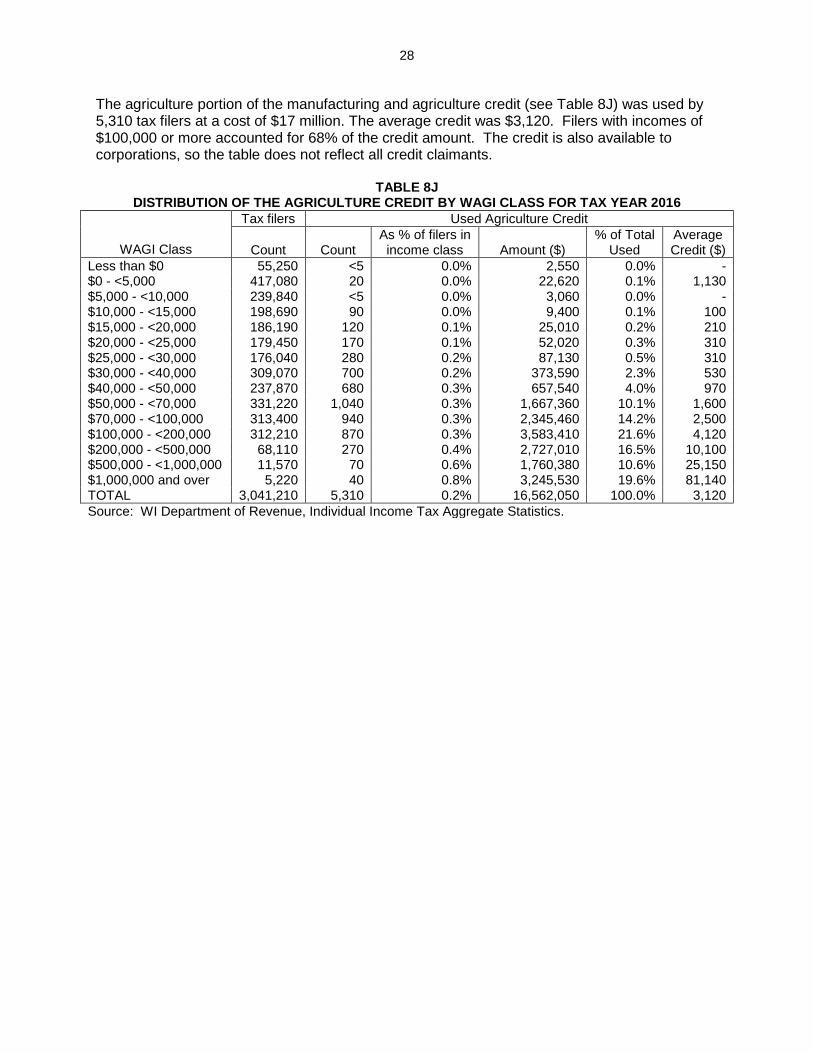
The agriculture portion of the manufacturing and agriculture credit (see Table 8J) was used by 5,310 tax filers at a cost of $17 million. The average credit was $3,120. Filers with incomes of $100,000 or more accounted for 68% of the credit amount. The credit is also available to corporations, so the table does not reflect all credit claimants.
TABLE 8J DISTRIBUTION OF THE AGRICULTURE CREDIT BY WAGI CLASS FOR TAX YEAR 2016
WAGI Class
Tax filers Used Agriculture Credit
Count
Count
As % of filers in income class
Amount ($)
% of Total Used
Average Credit ($)
Less than $0 55,250 <5 0.0% 2,550 0.0% - $0 - <5,000 417,080 20 0.0% 22,620 0.1% 1,130 $5,000 - <10,000 239,840 <5 0.0% 3,060 0.0% - $10,000 - <15,000 198,690 90 0.0% 9,400 0.1% 100 $15,000 - <20,000 186,190 120 0.1% 25,010 0.2% 210 $20,000 - <25,000 179,450 170 0.1% 52,020 0.3% 310 $25,000 - <30,000 176,040 280 0.2% 87,130 0.5% 310 $30,000 - <40,000 309,070 700 0.2% 373,590 2.3% 530 $40,000 - <50,000 237,870 680 0.3% 657,540 4.0% 970 $50,000 - <70,000 331,220 1,040 0.3% 1,667,360 10.1% 1,600 $70,000 - <100,000 313,400 940 0.3% 2,345,460 14.2% 2,500 $100,000 - <200,000 312,210 870 0.3% 3,583,410 21.6% 4,120 $200,000 - <500,000 68,110 270 0.4% 2,727,010 16.5% 10,100 $500,000 - <1,000,000 11,570 70 0.6% 1,760,380 10.6% 25,150 $1,000,000 and over 5,220 40 0.8% 3,245,530 19.6% 81,140 TOTAL 3,041,210 5,310 0.2% 16,562,050 100.0% 3,120
Source: WI Department of Revenue, Individual Income Tax Aggregate Statistics.
29
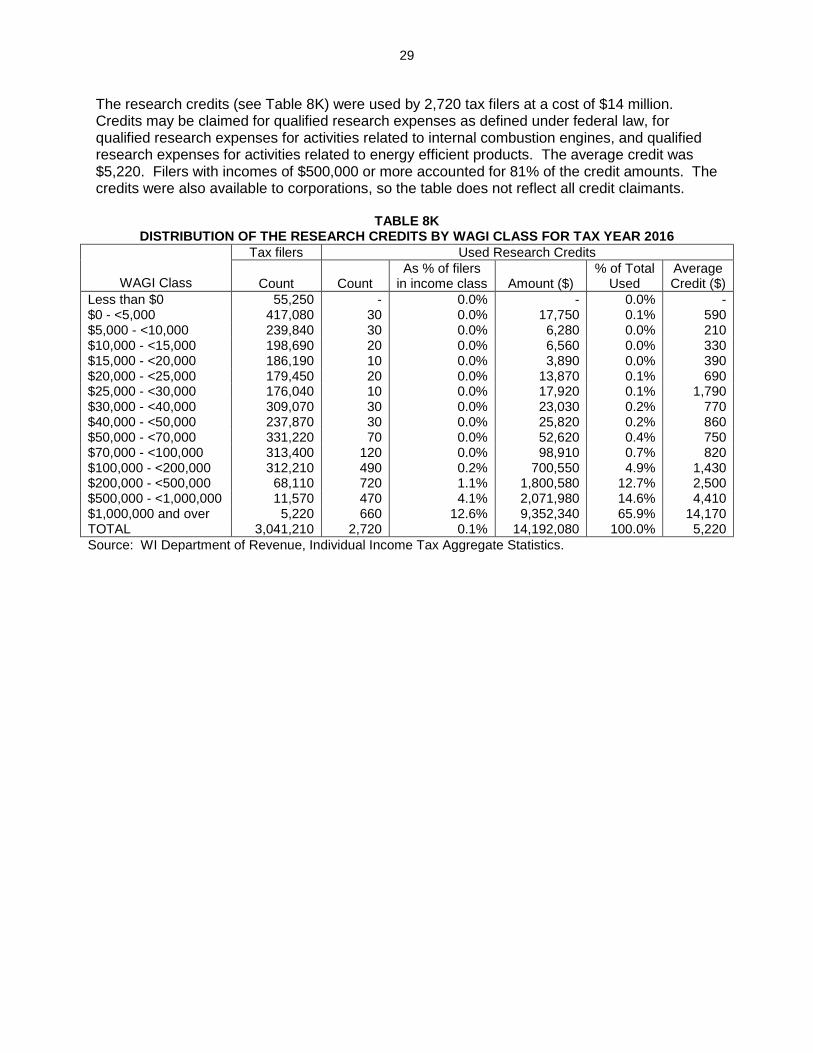
The research credits (see Table 8K) were used by 2,720 tax filers at a cost of $14 million. Credits may be claimed for qualified research expenses as defined under federal law, for qualified research expenses for activities related to internal combustion engines, and qualified research expenses for activities related to energy efficient products. The average credit was $5,220. Filers with incomes of $500,000 or more accounted for 81% of the credit amounts. The credits were also available to corporations, so the table does not reflect all credit claimants.
TABLE 8K DISTRIBUTION OF THE RESEARCH CREDITS BY WAGI CLASS FOR TAX YEAR 2016
WAGI Class
Tax filers Used Research Credits
Count
Count
As % of filers in income class
Amount ($)
% of Total Used
Average Credit ($)
Less than $0 55,250 - 0.0% - 0.0% - $0 - <5,000 417,080 30 0.0% 17,750 0.1% 590 $5,000 - <10,000 239,840 30 0.0% 6,280 0.0% 210 $10,000 - <15,000 198,690 20 0.0% 6,560 0.0% 330 $15,000 - <20,000 186,190 10 0.0% 3,890 0.0% 390 $20,000 - <25,000 179,450 20 0.0% 13,870 0.1% 690 $25,000 - <30,000 176,040 10 0.0% 17,920 0.1% 1,790 $30,000 - <40,000 309,070 30 0.0% 23,030 0.2% 770 $40,000 - <50,000 237,870 30 0.0% 25,820 0.2% 860 $50,000 - <70,000 331,220 70 0.0% 52,620 0.4% 750 $70,000 - <100,000 313,400 120 0.0% 98,910 0.7% 820 $100,000 - <200,000 312,210 490 0.2% 700,550 4.9% 1,430 $200,000 - <500,000 68,110 720 1.1% 1,800,580 12.7% 2,500 $500,000 - <1,000,000 11,570 470 4.1% 2,071,980 14.6% 4,410 $1,000,000 and over 5,220 660 12.6% 9,352,340 65.9% 14,170 TOTAL 3,041,210 2,720 0.1% 14,192,080 100.0% 5,220
Source: WI Department of Revenue, Individual Income Tax Aggregate Statistics.
30
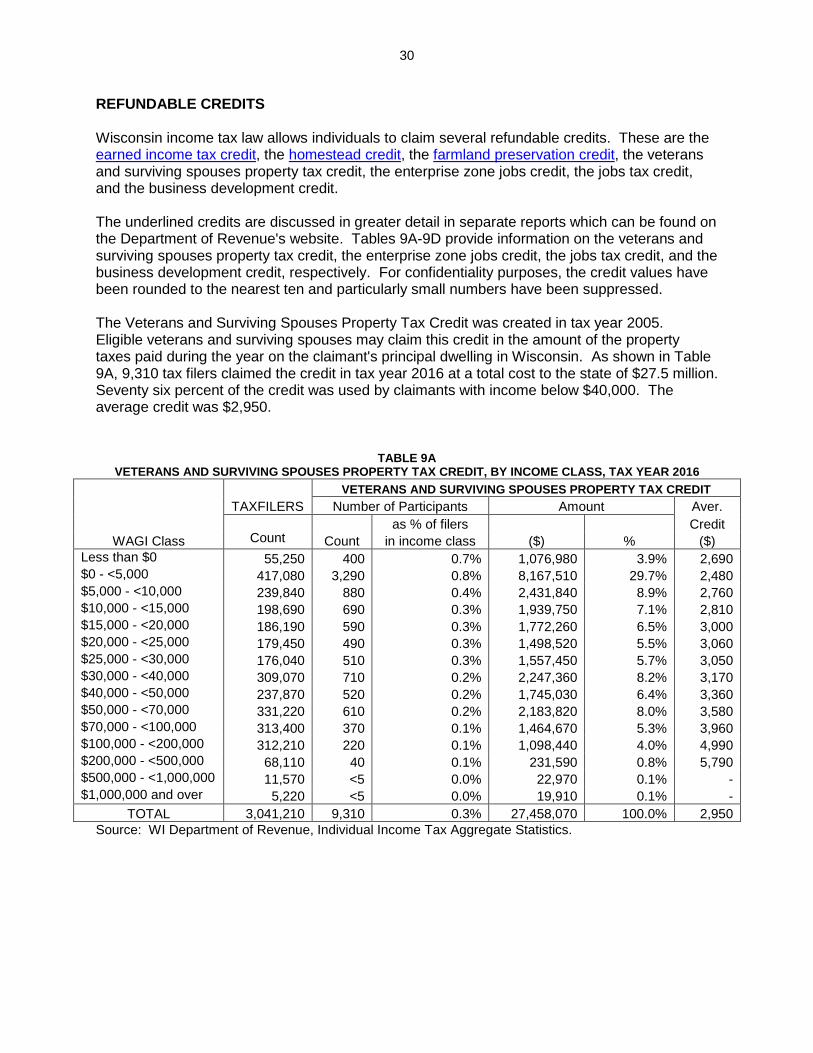
REFUNDABLE CREDITS
Wisconsin income tax law allows individuals to claim several refundable credits. These are the earned income tax credit, the homestead credit, the farmland preservation credit, the veterans and surviving spouses property tax credit, the enterprise zone jobs credit, the jobs tax credit, and the business development credit. The underlined credits are discussed in greater detail in separate reports which can be found on the Department of Revenue's website. Tables 9A-9D provide information on the veterans and surviving spouses property tax credit, the enterprise zone jobs credit, the jobs tax credit, and the business development credit, respectively. For confidentiality purposes, the credit values have been rounded to the nearest ten and particularly small numbers have been suppressed. The Veterans and Surviving Spouses Property Tax Credit was created in tax year 2005. Eligible veterans and surviving spouses may claim this credit in the amount of the property taxes paid during the year on the claimant's principal dwelling in Wisconsin. As shown in Table 9A, 9,310 tax filers claimed the credit in tax year 2016 at a total cost to the state of $27.5 million. Seventy six percent of the credit was used by claimants with income below $40,000. The average credit was $2,950.
Source: WI Department of Revenue, Individual Income Tax Aggregate Statistics.
TABLE 9A VETERANS AND SURVIVING SPOUSES PROPERTY TAX CREDIT, BY INCOME CLASS, TAX YEAR 2016
TAXFILERS
VETERANS AND SURVIVING SPOUSES PROPERTY TAX CREDIT
Number of Participants Amount Aver.
Count
Count
as % of filers Credit
WAGI Class in income class ($) % ($)
Less than $0 55,250 400 0.7% 1,076,980 3.9% 2,690 $0 - <5,000 417,080 3,290 0.8% 8,167,510 29.7% 2,480 $5,000 - <10,000 239,840 880 0.4% 2,431,840 8.9% 2,760 $10,000 - <15,000 198,690 690 0.3% 1,939,750 7.1% 2,810 $15,000 - <20,000 186,190 590 0.3% 1,772,260 6.5% 3,000 $20,000 - <25,000 179,450 490 0.3% 1,498,520 5.5% 3,060 $25,000 - <30,000 176,040 510 0.3% 1,557,450 5.7% 3,050 $30,000 - <40,000 309,070 710 0.2% 2,247,360 8.2% 3,170 $40,000 - <50,000 237,870 520 0.2% 1,745,030 6.4% 3,360 $50,000 - <70,000 331,220 610 0.2% 2,183,820 8.0% 3,580 $70,000 - <100,000 313,400 370 0.1% 1,464,670 5.3% 3,960 $100,000 - <200,000 312,210 220 0.1% 1,098,440 4.0% 4,990 $200,000 - <500,000 68,110 40 0.1% 231,590 0.8% 5,790 $500,000 - <1,000,000 11,570 <5 0.0% 22,970 0.1% - $1,000,000 and over 5,220 <5 0.0% 19,910 0.1% -
TOTAL 3,041,210 9,310 0.3% 27,458,070 100.0% 2,950
31
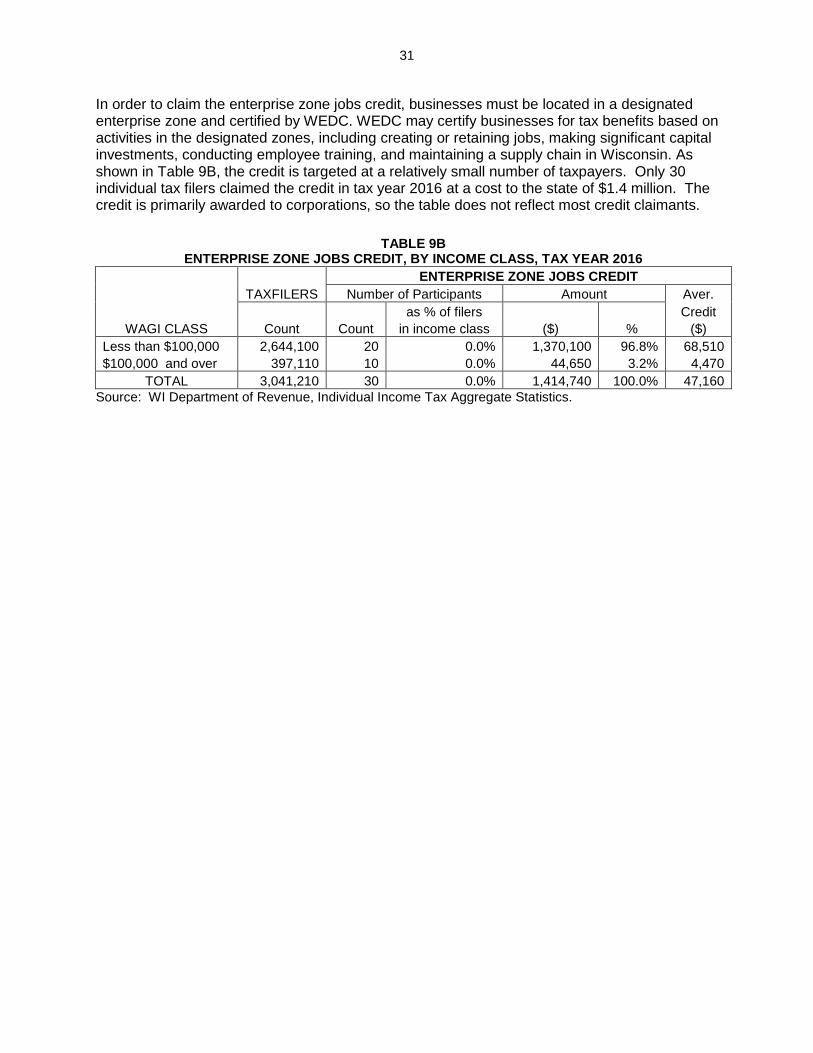
In order to claim the enterprise zone jobs credit, businesses must be located in a designated enterprise zone and certified by WEDC. WEDC may certify businesses for tax benefits based on activities in the designated zones, including creating or retaining jobs, making significant capital investments, conducting employee training, and maintaining a supply chain in Wisconsin. As shown in Table 9B, the credit is targeted at a relatively small number of taxpayers. Only 30 individual tax filers claimed the credit in tax year 2016 at a cost to the state of $1.4 million. The credit is primarily awarded to corporations, so the table does not reflect most credit claimants.
TABLE 9B ENTERPRISE ZONE JOBS CREDIT, BY INCOME CLASS, TAX YEAR 2016
TAXFILERS
ENTERPRISE ZONE JOBS CREDIT
Number of Participants Amount Aver.
as % of filers Credit
WAGI CLASS Count Count in income class ($) % ($)
Less than $100,000 2,644,100 20 0.0% 1,370,100 96.8% 68,510
$100,000 and over 397,110 10 0.0% 44,650 3.2% 4,470
TOTAL 3,041,210 30 0.0% 1,414,740 100.0% 47,160
Source: WI Department of Revenue, Individual Income Tax Aggregate Statistics.
32
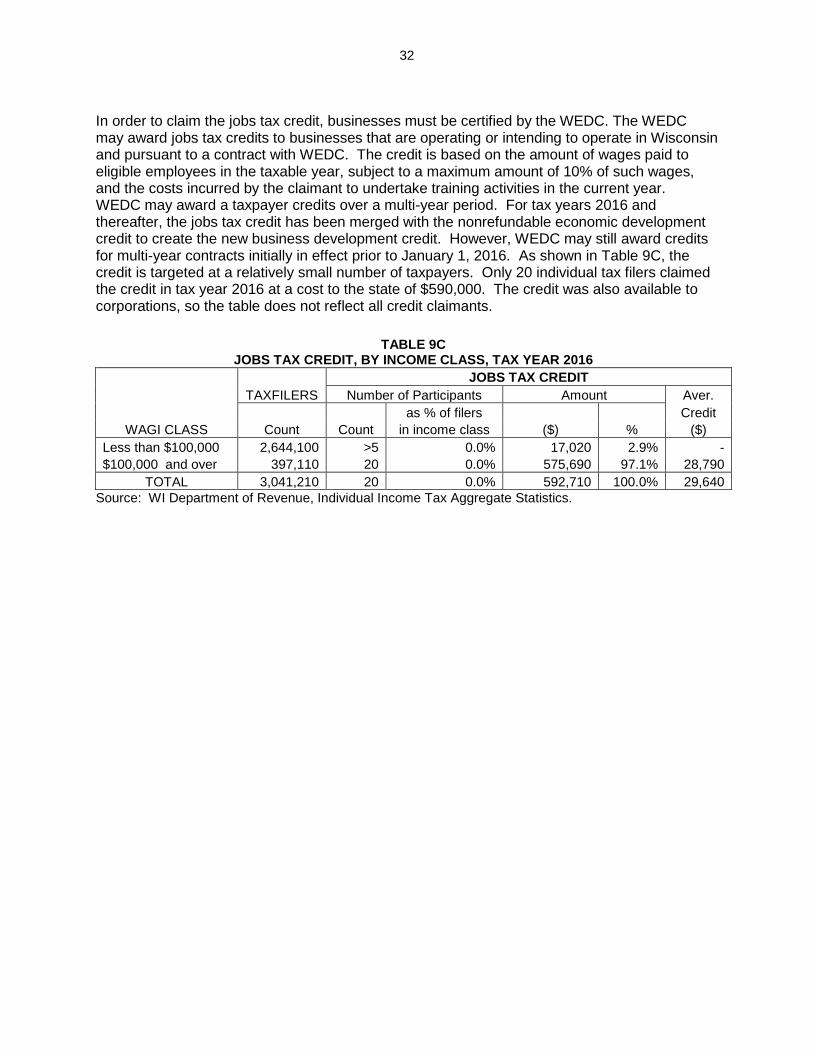
In order to claim the jobs tax credit, businesses must be certified by the WEDC. The WEDC may award jobs tax credits to businesses that are operating or intending to operate in Wisconsin and pursuant to a contract with WEDC. The credit is based on the amount of wages paid to eligible employees in the taxable year, subject to a maximum amount of 10% of such wages, and the costs incurred by the claimant to undertake training activities in the current year. WEDC may award a taxpayer credits over a multi-year period. For tax years 2016 and thereafter, the jobs tax credit has been merged with the nonrefundable economic development credit to create the new business development credit. However, WEDC may still award credits for multi-year contracts initially in effect prior to January 1, 2016. As shown in Table 9C, the credit is targeted at a relatively small number of taxpayers. Only 20 individual tax filers claimed the credit in tax year 2016 at a cost to the state of $590,000. The credit was also available to corporations, so the table does not reflect all credit claimants.
TABLE 9C JOBS TAX CREDIT, BY INCOME CLASS, TAX YEAR 2016
TAXFILERS
JOBS TAX CREDIT
Number of Participants Amount Aver.
as % of filers Credit
WAGI CLASS Count Count in income class ($) % ($)
Less than $100,000 2,644,100 >5 0.0% 17,020 2.9% -
$100,000 and over 397,110 20 0.0% 575,690 97.1% 28,790
TOTAL 3,041,210 20 0.0% 592,710 100.0% 29,640
Source: WI Department of Revenue, Individual Income Tax Aggregate Statistics.
33
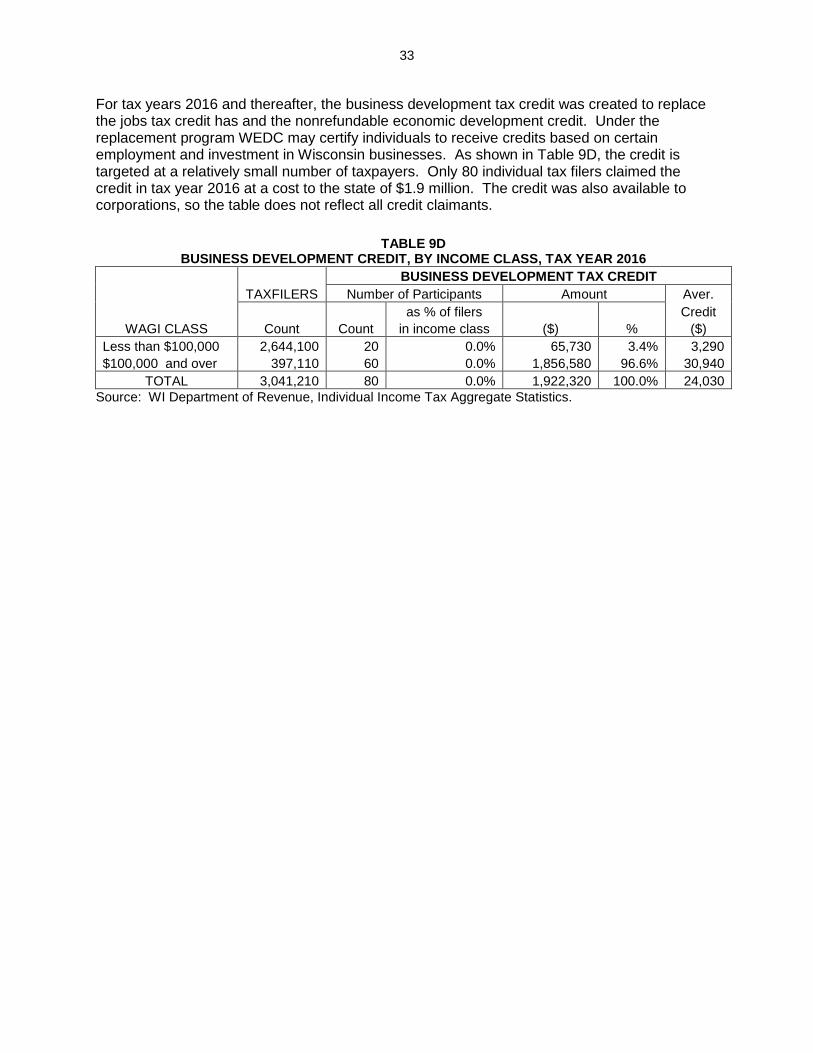
For tax years 2016 and thereafter, the business development tax credit was created to replace the jobs tax credit has and the nonrefundable economic development credit. Under the replacement program WEDC may certify individuals to receive credits based on certain employment and investment in Wisconsin businesses. As shown in Table 9D, the credit is targeted at a relatively small number of taxpayers. Only 80 individual tax filers claimed the credit in tax year 2016 at a cost to the state of $1.9 million. The credit was also available to corporations, so the table does not reflect all credit claimants.
TABLE 9D BUSINESS DEVELOPMENT CREDIT, BY INCOME CLASS, TAX YEAR 2016
TAXFILERS
BUSINESS DEVELOPMENT TAX CREDIT
Number of Participants Amount Aver.
as % of filers Credit
WAGI CLASS Count Count in income class ($) % ($)
Less than $100,000 2,644,100 20 0.0% 65,730 3.4% 3,290
$100,000 and over 397,110 60 0.0% 1,856,580 96.6% 30,940
TOTAL 3,041,210 80 0.0% 1,922,320 100.0% 24,030
Source: WI Department of Revenue, Individual Income Tax Aggregate Statistics.
34
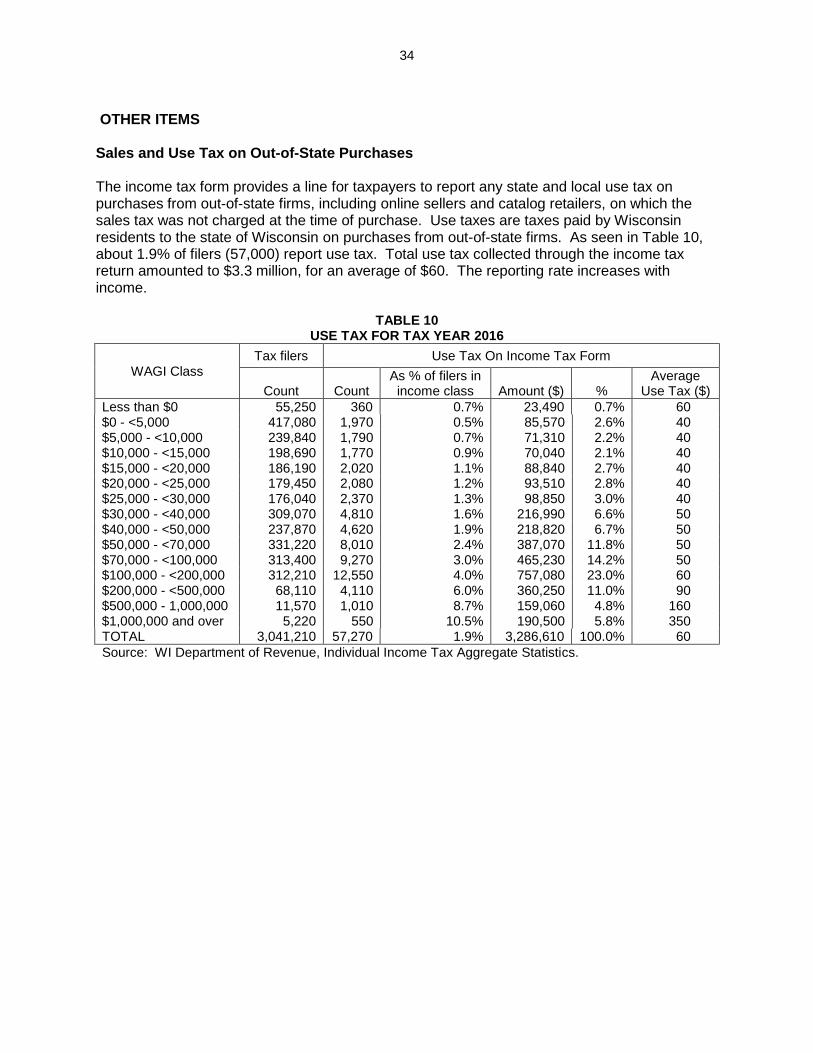
OTHER ITEMS Sales and Use Tax on Out-of-State Purchases The income tax form provides a line for taxpayers to report any state and local use tax on purchases from out-of-state firms, including online sellers and catalog retailers, on which the sales tax was not charged at the time of purchase. Use taxes are taxes paid by Wisconsin residents to the state of Wisconsin on purchases from out-of-state firms. As seen in Table 10, about 1.9% of filers (57,000) report use tax. Total use tax collected through the income tax return amounted to $3.3 million, for an average of $60. The reporting rate increases with income.
TABLE 10 USE TAX FOR TAX YEAR 2016
WAGI Class Tax filers Use Tax On Income Tax Form
Count
Count
As % of filers in income class
Amount ($)
%
Average Use Tax ($)
Less than $0 55,250 360 0.7% 23,490 0.7% 60 $0 - <5,000 417,080 1,970 0.5% 85,570 2.6% 40 $5,000 - <10,000 239,840 1,790 0.7% 71,310 2.2% 40 $10,000 - <15,000 198,690 1,770 0.9% 70,040 2.1% 40 $15,000 - <20,000 186,190 2,020 1.1% 88,840 2.7% 40 $20,000 - <25,000 179,450 2,080 1.2% 93,510 2.8% 40 $25,000 - <30,000 176,040 2,370 1.3% 98,850 3.0% 40 $30,000 - <40,000 309,070 4,810 1.6% 216,990 6.6% 50 $40,000 - <50,000 237,870 4,620 1.9% 218,820 6.7% 50 $50,000 - <70,000 331,220 8,010 2.4% 387,070 11.8% 50 $70,000 - <100,000 313,400 9,270 3.0% 465,230 14.2% 50 $100,000 - <200,000 312,210 12,550 4.0% 757,080 23.0% 60 $200,000 - <500,000 68,110 4,110 6.0% 360,250 11.0% 90 $500,000 - 1,000,000 11,570 1,010 8.7% 159,060 4.8% 160 $1,000,000 and over 5,220 550 10.5% 190,500 5.8% 350 TOTAL 3,041,210 57,270 1.9% 3,286,610 100.0% 60
Source: WI Department of Revenue, Individual Income Tax Aggregate Statistics.
35
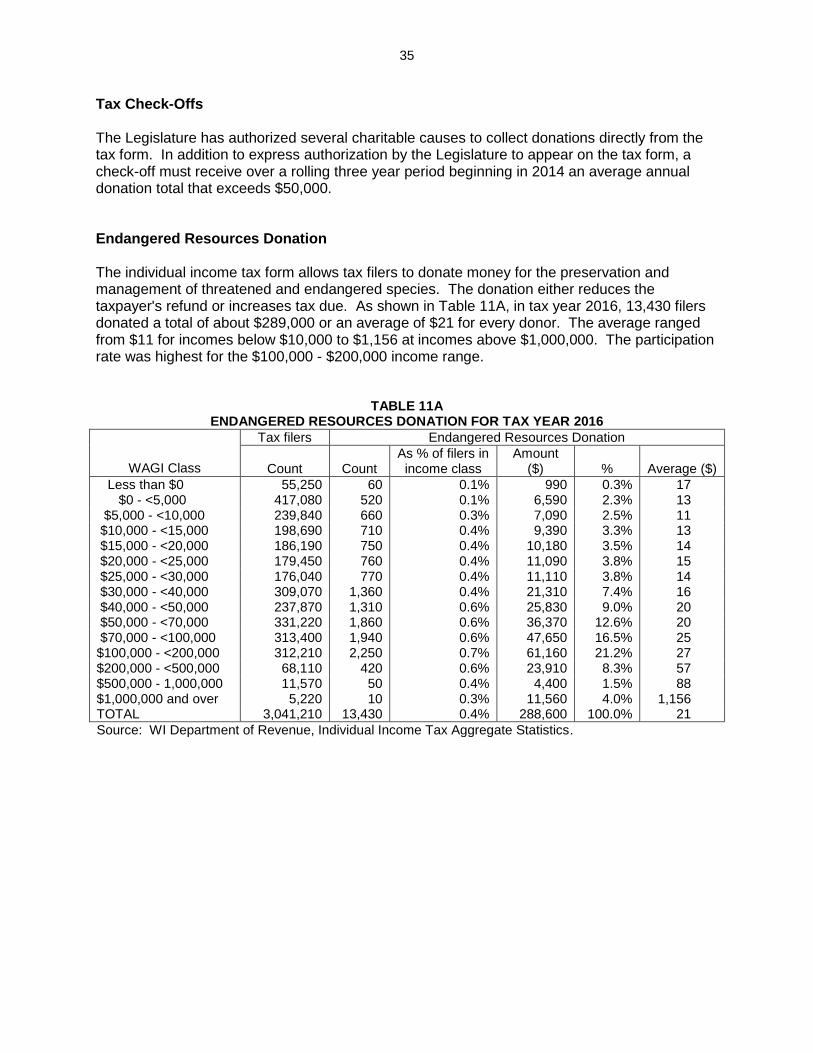
Tax Check-Offs The Legislature has authorized several charitable causes to collect donations directly from the tax form. In addition to express authorization by the Legislature to appear on the tax form, a check-off must receive over a rolling three year period beginning in 2014 an average annual donation total that exceeds $50,000. Endangered Resources Donation The individual income tax form allows tax filers to donate money for the preservation and management of threatened and endangered species. The donation either reduces the taxpayer's refund or increases tax due. As shown in Table 11A, in tax year 2016, 13,430 filers donated a total of about $289,000 or an average of $21 for every donor. The average ranged from $11 for incomes below $10,000 to $1,156 at incomes above $1,000,000. The participation rate was highest for the $100,000 - $200,000 income range.
TABLE 11A ENDANGERED RESOURCES DONATION FOR TAX YEAR 2016
WAGI Class
Tax filers Endangered Resources Donation
Count
Count
As % of filers in income class
Amount ($)
%
Average ($)
Less than $0 55,250 60 0.1% 990 0.3% 17 $0 - <5,000 417,080 520 0.1% 6,590 2.3% 13 $5,000 - <10,000 239,840 660 0.3% 7,090 2.5% 11 $10,000 - <15,000 198,690 710 0.4% 9,390 3.3% 13 $15,000 - <20,000 186,190 750 0.4% 10,180 3.5% 14 $20,000 - <25,000 179,450 760 0.4% 11,090 3.8% 15 $25,000 - <30,000 176,040 770 0.4% 11,110 3.8% 14 $30,000 - <40,000 309,070 1,360 0.4% 21,310 7.4% 16 $40,000 - <50,000 237,870 1,310 0.6% 25,830 9.0% 20 $50,000 - <70,000 331,220 1,860 0.6% 36,370 12.6% 20 $70,000 - <100,000 313,400 1,940 0.6% 47,650 16.5% 25 $100,000 - <200,000 312,210 2,250 0.7% 61,160 21.2% 27 $200,000 - <500,000 68,110 420 0.6% 23,910 8.3% 57 $500,000 - 1,000,000 11,570 50 0.4% 4,400 1.5% 88 $1,000,000 and over 5,220 10 0.3% 11,560 4.0% 1,156 TOTAL 3,041,210 13,430 0.4% 288,600 100.0% 21
Source: WI Department of Revenue, Individual Income Tax Aggregate Statistics.

36
Cancer Research Donation This donation allows taxpayers to make a donation towards cancer research. The donation either reduces a taxpayer's refund, or adds to tax due. As Table 11B reports, approximately 9,010 filers gave a total of $165,000 for an average of $18. Donors with income below $100,000 gave $17 on average, while donors with income $100,000 or more donated $26 on average.
TABLE 11B CANCER RESEARCH DONATION FOR TAX YEAR 2016
WAGI Class
Tax filers Cancer Research Donation
Count
Count
As % of filers in income class
Amount ($)
%
Average ($)
Less than $0 55,250 50 0.1% 620 0.4% 12 $0 - <5,000 417,080 420 0.1% 4,340 2.6% 10 $5,000 - <10,000 239,840 510 0.2% 6,600 4.0% 13 $10,000 - <15,000 198,690 550 0.3% 6,530 4.0% 12 $15,000 - <20,000 186,190 600 0.3% 8,420 5.1% 14 $20,000 - <25,000 179,450 580 0.3% 8,790 5.3% 15 $25,000 - <30,000 176,040 580 0.3% 10,370 6.3% 18 $30,000 - <40,000 309,070 1,020 0.3% 16,360 9.9% 16 $40,000 - <50,000 237,870 850 0.4% 13,800 8.4% 16 $50,000 - <70,000 331,220 1,130 0.3% 24,260 14.7% 21 $70,000 - <100,000 313,400 1,120 0.4% 22,760 13.8% 20 $100,000 - <200,000 312,210 1,340 0.4% 32,560 19.7% 24 $200,000 - <500,000 68,110 250 0.4% 8,600 5.2% 34 $500,000 - <1,000,000 11,570 20 0.2% 760 0.5% 38 $1,000,000 and over 5,220 <5 0.0% - 0.0% - TOTAL 3,041,210 9,010 0.3% 165,210 100.0% 18
Source: WI Department of Revenue, Individual Income Tax Aggregate Statistics.
37
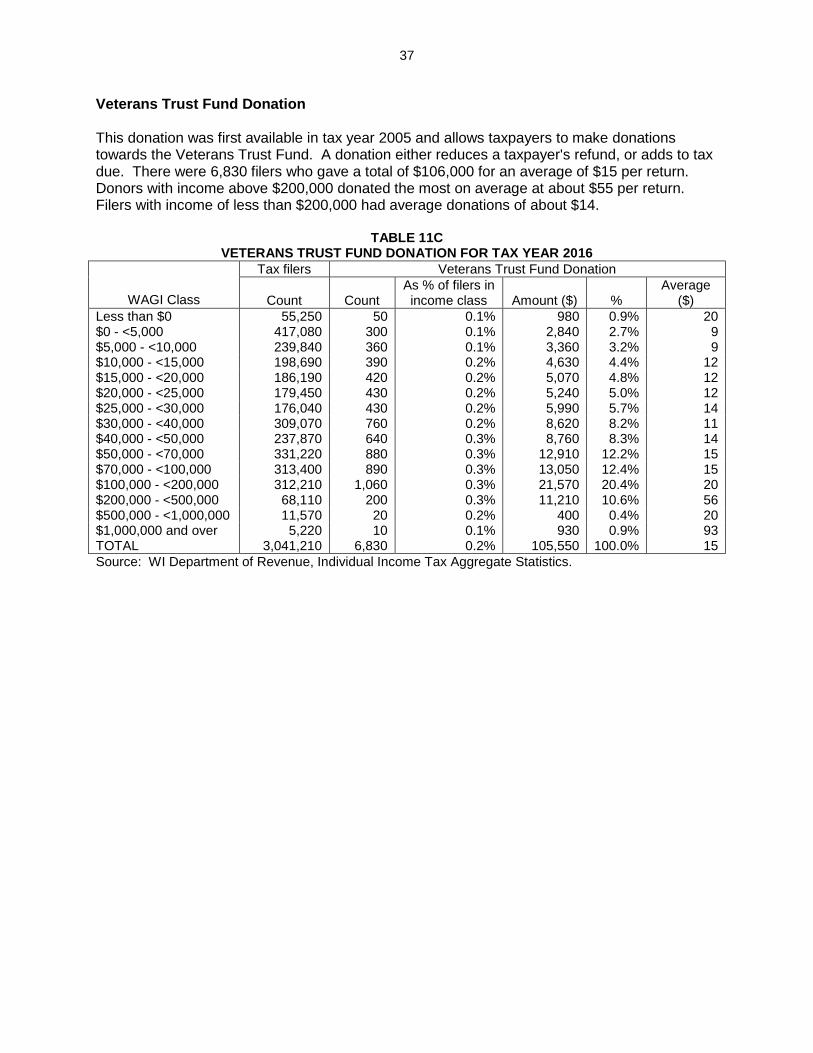
Veterans Trust Fund Donation This donation was first available in tax year 2005 and allows taxpayers to make donations towards the Veterans Trust Fund. A donation either reduces a taxpayer's refund, or adds to tax due. There were 6,830 filers who gave a total of $106,000 for an average of $15 per return. Donors with income above $200,000 donated the most on average at about $55 per return. Filers with income of less than $200,000 had average donations of about $14.
TABLE 11C VETERANS TRUST FUND DONATION FOR TAX YEAR 2016
WAGI Class
Tax filers Veterans Trust Fund Donation
Count
Count
As % of filers in income class
Amount ($)
%
Average ($)
Less than $0 55,250 50 0.1% 980 0.9% 20 $0 - <5,000 417,080 300 0.1% 2,840 2.7% 9 $5,000 - <10,000 239,840 360 0.1% 3,360 3.2% 9 $10,000 - <15,000 198,690 390 0.2% 4,630 4.4% 12 $15,000 - <20,000 186,190 420 0.2% 5,070 4.8% 12 $20,000 - <25,000 179,450 430 0.2% 5,240 5.0% 12 $25,000 - <30,000 176,040 430 0.2% 5,990 5.7% 14 $30,000 - <40,000 309,070 760 0.2% 8,620 8.2% 11 $40,000 - <50,000 237,870 640 0.3% 8,760 8.3% 14 $50,000 - <70,000 331,220 880 0.3% 12,910 12.2% 15 $70,000 - <100,000 313,400 890 0.3% 13,050 12.4% 15 $100,000 - <200,000 312,210 1,060 0.3% 21,570 20.4% 20 $200,000 - <500,000 68,110 200 0.3% 11,210 10.6% 56 $500,000 - <1,000,000 11,570 20 0.2% 400 0.4% 20 $1,000,000 and over 5,220 10 0.1% 930 0.9% 93 TOTAL 3,041,210 6,830 0.2% 105,550 100.0% 15
Source: WI Department of Revenue, Individual Income Tax Aggregate Statistics.
38
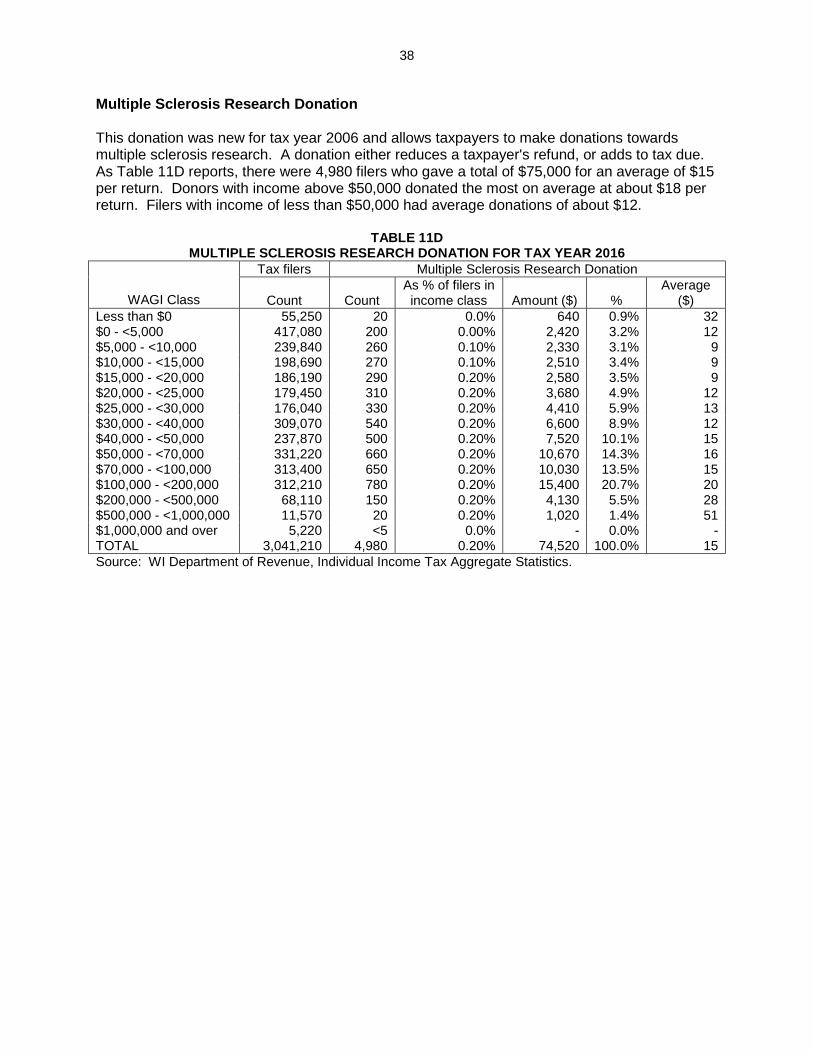
Multiple Sclerosis Research Donation This donation was new for tax year 2006 and allows taxpayers to make donations towards multiple sclerosis research. A donation either reduces a taxpayer's refund, or adds to tax due. As Table 11D reports, there were 4,980 filers who gave a total of $75,000 for an average of $15 per return. Donors with income above $50,000 donated the most on average at about $18 per return. Filers with income of less than $50,000 had average donations of about $12.
TABLE 11D MULTIPLE SCLEROSIS RESEARCH DONATION FOR TAX YEAR 2016
WAGI Class
Tax filers Multiple Sclerosis Research Donation
Count
Count
As % of filers in income class
Amount ($)
%
Average ($)
Less than $0 55,250 20 0.0% 640 0.9% 32 $0 - <5,000 417,080 200 0.00% 2,420 3.2% 12 $5,000 - <10,000 239,840 260 0.10% 2,330 3.1% 9 $10,000 - <15,000 198,690 270 0.10% 2,510 3.4% 9 $15,000 - <20,000 186,190 290 0.20% 2,580 3.5% 9 $20,000 - <25,000 179,450 310 0.20% 3,680 4.9% 12 $25,000 - <30,000 176,040 330 0.20% 4,410 5.9% 13 $30,000 - <40,000 309,070 540 0.20% 6,600 8.9% 12 $40,000 - <50,000 237,870 500 0.20% 7,520 10.1% 15 $50,000 - <70,000 331,220 660 0.20% 10,670 14.3% 16 $70,000 - <100,000 313,400 650 0.20% 10,030 13.5% 15 $100,000 - <200,000 312,210 780 0.20% 15,400 20.7% 20 $200,000 - <500,000 68,110 150 0.20% 4,130 5.5% 28 $500,000 - <1,000,000 11,570 20 0.20% 1,020 1.4% 51 $1,000,000 and over 5,220 <5 0.0% - 0.0% - TOTAL 3,041,210 4,980 0.20% 74,520 100.0% 15
Source: WI Department of Revenue, Individual Income Tax Aggregate Statistics.
39
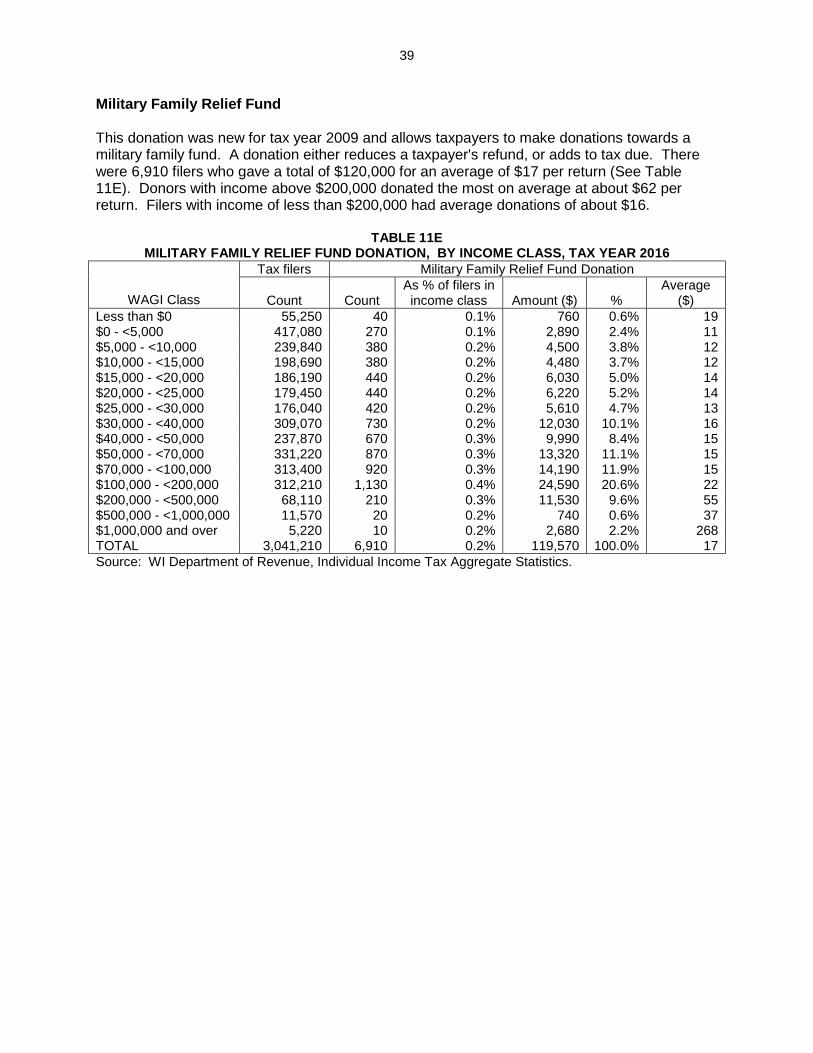
Military Family Relief Fund This donation was new for tax year 2009 and allows taxpayers to make donations towards a military family fund. A donation either reduces a taxpayer's refund, or adds to tax due. There were 6,910 filers who gave a total of $120,000 for an average of $17 per return (See Table 11E). Donors with income above $200,000 donated the most on average at about $62 per return. Filers with income of less than $200,000 had average donations of about $16.
TABLE 11E MILITARY FAMILY RELIEF FUND DONATION, BY INCOME CLASS, TAX YEAR 2016
WAGI Class
Tax filers Military Family Relief Fund Donation
Count
Count
As % of filers in income class
Amount ($)
%
Average ($)
Less than $0 55,250 40 0.1% 760 0.6% 19 $0 - <5,000 417,080 270 0.1% 2,890 2.4% 11 $5,000 - <10,000 239,840 380 0.2% 4,500 3.8% 12 $10,000 - <15,000 198,690 380 0.2% 4,480 3.7% 12 $15,000 - <20,000 186,190 440 0.2% 6,030 5.0% 14 $20,000 - <25,000 179,450 440 0.2% 6,220 5.2% 14 $25,000 - <30,000 176,040 420 0.2% 5,610 4.7% 13 $30,000 - <40,000 309,070 730 0.2% 12,030 10.1% 16 $40,000 - <50,000 237,870 670 0.3% 9,990 8.4% 15 $50,000 - <70,000 331,220 870 0.3% 13,320 11.1% 15 $70,000 - <100,000 313,400 920 0.3% 14,190 11.9% 15 $100,000 - <200,000 312,210 1,130 0.4% 24,590 20.6% 22 $200,000 - <500,000 68,110 210 0.3% 11,530 9.6% 55 $500,000 - <1,000,000 11,570 20 0.2% 740 0.6% 37 $1,000,000 and over 5,220 10 0.2% 2,680 2.2% 268 TOTAL 3,041,210 6,910 0.2% 119,570 100.0% 17
Source: WI Department of Revenue, Individual Income Tax Aggregate Statistics.
40
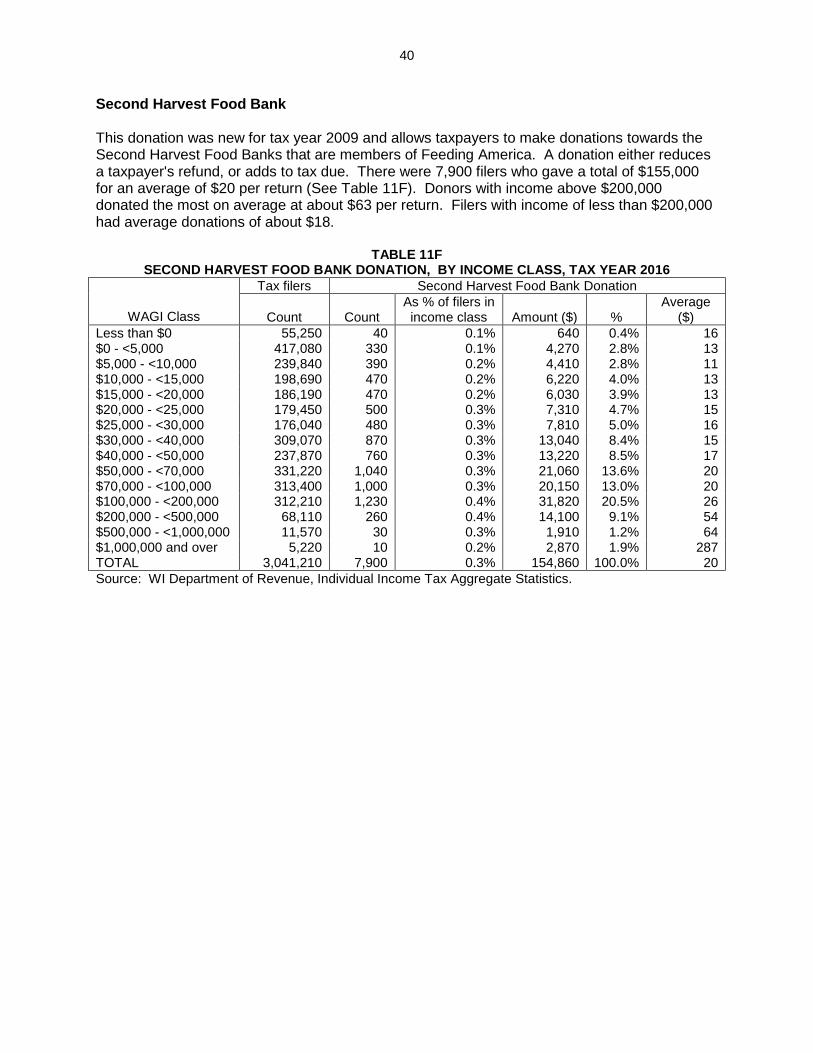
Second Harvest Food Bank This donation was new for tax year 2009 and allows taxpayers to make donations towards the Second Harvest Food Banks that are members of Feeding America. A donation either reduces a taxpayer's refund, or adds to tax due. There were 7,900 filers who gave a total of $155,000 for an average of $20 per return (See Table 11F). Donors with income above $200,000 donated the most on average at about $63 per return. Filers with income of less than $200,000 had average donations of about $18.
TABLE 11F SECOND HARVEST FOOD BANK DONATION, BY INCOME CLASS, TAX YEAR 2016
WAGI Class
Tax filers Second Harvest Food Bank Donation
Count
Count
As % of filers in income class
Amount ($)
%
Average ($)
Less than $0 55,250 40 0.1% 640 0.4% 16 $0 - <5,000 417,080 330 0.1% 4,270 2.8% 13 $5,000 - <10,000 239,840 390 0.2% 4,410 2.8% 11 $10,000 - <15,000 198,690 470 0.2% 6,220 4.0% 13 $15,000 - <20,000 186,190 470 0.2% 6,030 3.9% 13 $20,000 - <25,000 179,450 500 0.3% 7,310 4.7% 15 $25,000 - <30,000 176,040 480 0.3% 7,810 5.0% 16 $30,000 - <40,000 309,070 870 0.3% 13,040 8.4% 15 $40,000 - <50,000 237,870 760 0.3% 13,220 8.5% 17 $50,000 - <70,000 331,220 1,040 0.3% 21,060 13.6% 20 $70,000 - <100,000 313,400 1,000 0.3% 20,150 13.0% 20 $100,000 - <200,000 312,210 1,230 0.4% 31,820 20.5% 26 $200,000 - <500,000 68,110 260 0.4% 14,100 9.1% 54 $500,000 - <1,000,000 11,570 30 0.3% 1,910 1.2% 64 $1,000,000 and over 5,220 10 0.2% 2,870 1.9% 287 TOTAL 3,041,210 7,900 0.3% 154,860 100.0% 20
Source: WI Department of Revenue, Individual Income Tax Aggregate Statistics.

41
Red Cross Disaster Relief This donation was new for tax year 2011 and allows taxpayers to make donations towards the American Red Cross Wisconsin Disaster Relief Fund. A donation either reduces a taxpayer's refund, or adds to tax due. There were 6,400 filers who gave a total of $100,000 for an average of $16 per return (See Table 11G). Donors with income above $200,000 donated the most on average at about $41 per return. Filers with income of less than $200,000 had average donations of about $15.
TABLE 11G RED CROSS DONATION, BY INCOME CLASS, TAX YEAR 2016
WAGI Class
Tax filers Red Cross Donation
Count
Count
As % of filers in income class
Amount ($)
%
Average ($)
Less than $0 55,250 30 0.1% 730 0.7% 24 $0 - <5,000 417,080 250 0.1% 2,670 2.7% 11 $5,000 - <10,000 239,840 350 0.1% 5,090 5.1% 15 $10,000 - <15,000 198,690 370 0.2% 3,580 3.6% 10 $15,000 - <20,000 186,190 390 0.2% 4,210 4.2% 11 $20,000 - <25,000 179,450 390 0.2% 4,260 4.3% 11 $25,000 - <30,000 176,040 390 0.2% 6,170 6.2% 16 $30,000 - <40,000 309,070 720 0.2% 8,740 8.8% 12 $40,000 - <50,000 237,870 600 0.3% 7,900 7.9% 13 $50,000 - <70,000 331,220 880 0.3% 14,000 14.1% 16 $70,000 - <100,000 313,400 800 0.3% 12,540 12.6% 16 $100,000 - <200,000 312,210 1,000 0.3% 20,310 20.4% 20 $200,000 - <500,000 68,110 200 0.3% 6,080 6.1% 30 $500,000 - <1,000,000 11,570 20 0.2% 920 0.9% 46 $1,000,000 and over 5,220 10 0.2% 2,360 2.4% 236 TOTAL 3,041,210 6,400 0.2% 99,550 100.0% 16
Source: WI Department of Revenue, Individual Income Tax Aggregate Statistics.
42
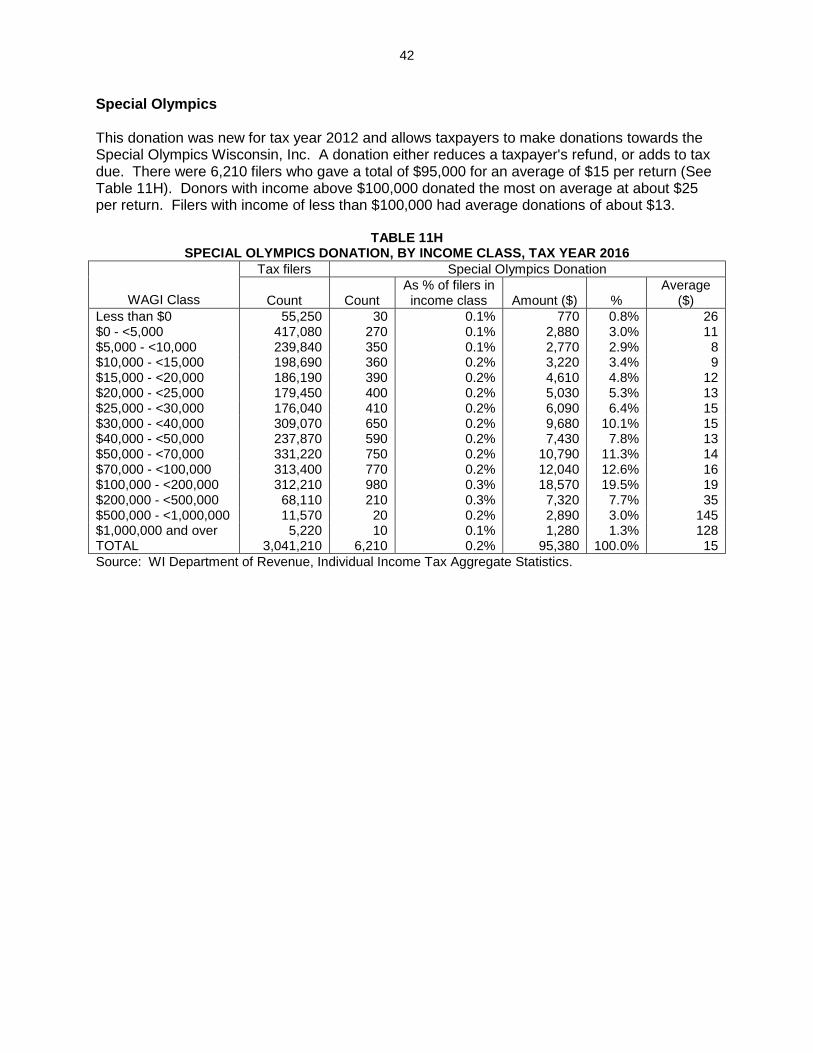
Special Olympics This donation was new for tax year 2012 and allows taxpayers to make donations towards the Special Olympics Wisconsin, Inc. A donation either reduces a taxpayer's refund, or adds to tax due. There were 6,210 filers who gave a total of $95,000 for an average of $15 per return (See Table 11H). Donors with income above $100,000 donated the most on average at about $25 per return. Filers with income of less than $100,000 had average donations of about $13.
TABLE 11H SPECIAL OLYMPICS DONATION, BY INCOME CLASS, TAX YEAR 2016
WAGI Class
Tax filers Special Olympics Donation
Count
Count
As % of filers in income class
Amount ($)
%
Average ($)
Less than $0 55,250 30 0.1% 770 0.8% 26 $0 - <5,000 417,080 270 0.1% 2,880 3.0% 11 $5,000 - <10,000 239,840 350 0.1% 2,770 2.9% 8 $10,000 - <15,000 198,690 360 0.2% 3,220 3.4% 9 $15,000 - <20,000 186,190 390 0.2% 4,610 4.8% 12 $20,000 - <25,000 179,450 400 0.2% 5,030 5.3% 13 $25,000 - <30,000 176,040 410 0.2% 6,090 6.4% 15 $30,000 - <40,000 309,070 650 0.2% 9,680 10.1% 15 $40,000 - <50,000 237,870 590 0.2% 7,430 7.8% 13 $50,000 - <70,000 331,220 750 0.2% 10,790 11.3% 14 $70,000 - <100,000 313,400 770 0.2% 12,040 12.6% 16 $100,000 - <200,000 312,210 980 0.3% 18,570 19.5% 19 $200,000 - <500,000 68,110 210 0.3% 7,320 7.7% 35 $500,000 - <1,000,000 11,570 20 0.2% 2,890 3.0% 145 $1,000,000 and over 5,220 10 0.1% 1,280 1.3% 128 TOTAL 3,041,210 6,210 0.2% 95,380 100.0% 15
Source: WI Department of Revenue, Individual Income Tax Aggregate Statistics.
43
APPENDIX MAJOR PROVISIONS OF 2016 WISCONSIN INDIVIDUAL INCOME TAX LAW Wisconsin Adjusted Gross Income Wisconsin adjusted gross income (WAGI) is the base for the state individual income tax. It follows closely the base for the federal individual income tax, federal adjusted gross income (FAGI), but is modified by additions and subtractions. Additions account for income exempt from federal tax but subject to state tax and subtractions account for income taxed federally but not by Wisconsin and allow expenses permitted by Wisconsin but not by federal law. FAGI is equal to gross income after adjustments. Gross income includes all types of income subject to tax, e.g., wages and salaries, net business and farm income (or loss), interest, dividends, rents, retirement income, alimony received, capital gains, unemployment compensation, and a portion of social security benefits.
Adjustments are subtractions from gross income to arrive at FAGI. Examples of adjustments include contributions to Individual Retirement Accounts and self-employed retirement plans, health insurance premiums paid by the self-employed, one-half of the self-employment tax for Social Security and Medicare, a portion of student loan interest, moving expenses, and alimony paid.
Modifications, both additions and subtractions, are then made to FAGI to determine WAGI. Additions to FAGI include income that is exempt from federal tax but is subject to state tax. Major examples include:
State and municipal bond interest. There is some state and local interest that remains exempt from state taxation (e.g., interest on bonds issued by municipal housing and community development authorities, cultural and sports stadium districts, the Wisconsin Housing and Economic Development Authority, and the governments of Guam, Puerto Rico and the Virgin Islands.)
Capital losses in excess of $500 (federal law allows a $3,000 capital loss deduction but Wisconsin limits the loss to $500).
State business credits. Wisconsin treats the amount computed for several business credits as taxable income to the claimant.
Subtractions to FAGI are for income that is taxable for federal purposes but not for state purposes. Examples for tax year 2016 include:
An exclusion for 30% of capital gains on assets held for more than one year which Wisconsin allows in tax year 2016, but are taxable in full at the federal level.
Interest on U.S. government bonds, which states are prohibited from taxing.
Pensions received by persons who were members of or retired from Milwaukee city and county retirement plans, the state teachers’ retirement plan and the civil service retirement system prior to January 1, 1964.
44
Social Security benefits that are taxable for federal purposes. Up to 85% of social security benefits are subject to federal tax, but Wisconsin does not tax these benefits.
A portion of unemployment compensation, which is fully taxable for federal purposes but only taxed by Wisconsin when income exceeds $18,000 for married couples and $12,000 for most other filers.
Railroad retirement benefits, railroad unemployment insurance, and sickness benefits, which are taxable under federal law but which states are not permitted to tax.
State income tax refunds.
Health insurance premiums not already deducted or exempted from FAGI.
Premiums paid for long-term care insurance.
Tuition payments, up to $6,943 per student, to post-secondary institutions in Wisconsin and to schools in Minnesota covered under Minnesota-Wisconsin tuition reciprocity.
Contributions to and distributions from the Wisconsin EdVest College Savings Program that are included in FAGI. Subtractions are limited to $3,100 per beneficiary.
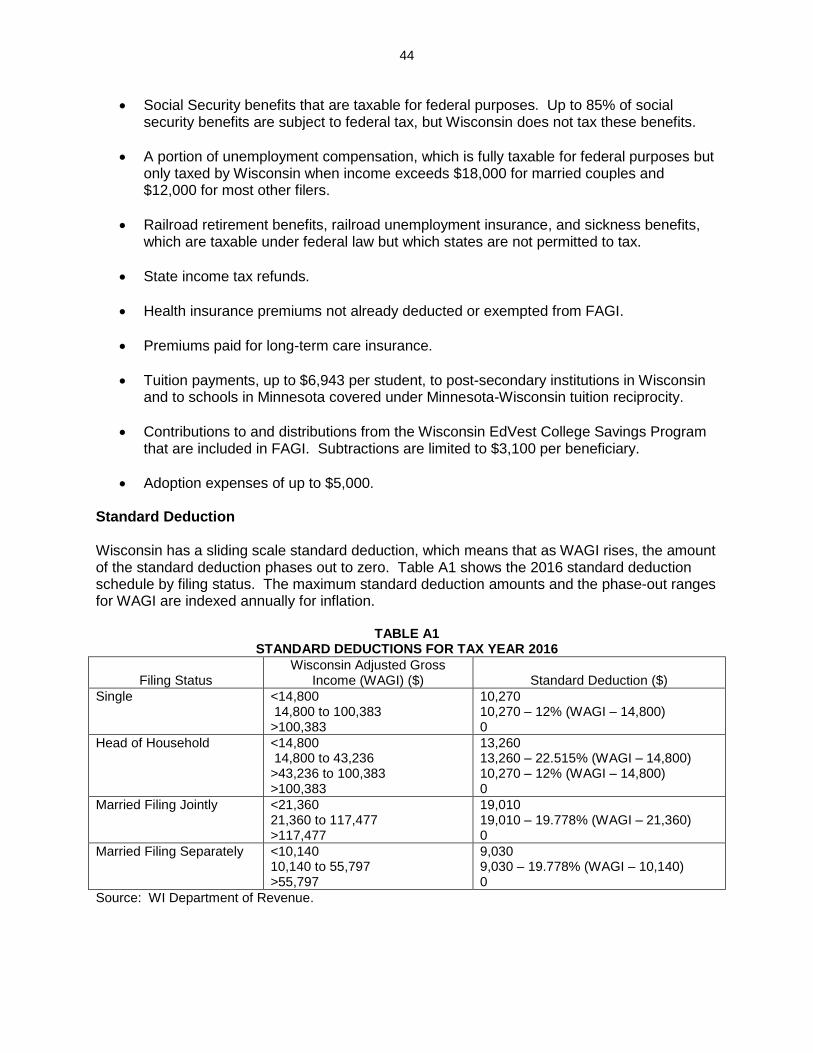
Adoption expenses of up to $5,000. Standard Deduction Wisconsin has a sliding scale standard deduction, which means that as WAGI rises, the amount of the standard deduction phases out to zero. Table A1 shows the 2016 standard deduction schedule by filing status. The maximum standard deduction amounts and the phase-out ranges for WAGI are indexed annually for inflation.
TABLE A1 STANDARD DEDUCTIONS FOR TAX YEAR 2016
Filing Status
Wisconsin Adjusted Gross Income (WAGI) ($)
Standard Deduction ($)
Single <14,800 14,800 to 100,383 >100,383
10,270 10,270 – 12% (WAGI – 14,800) 0
Head of Household <14,800 14,800 to 43,236 >43,236 to 100,383 >100,383
13,260 13,260 – 22.515% (WAGI – 14,800) 10,270 – 12% (WAGI – 14,800) 0
Married Filing Jointly <21,360 21,360 to 117,477 >117,477
19,010 19,010 – 19.778% (WAGI – 21,360) 0
Married Filing Separately <10,140 10,140 to 55,797 >55,797
9,030 9,030 – 19.778% (WAGI – 10,140) 0
Source: WI Department of Revenue.
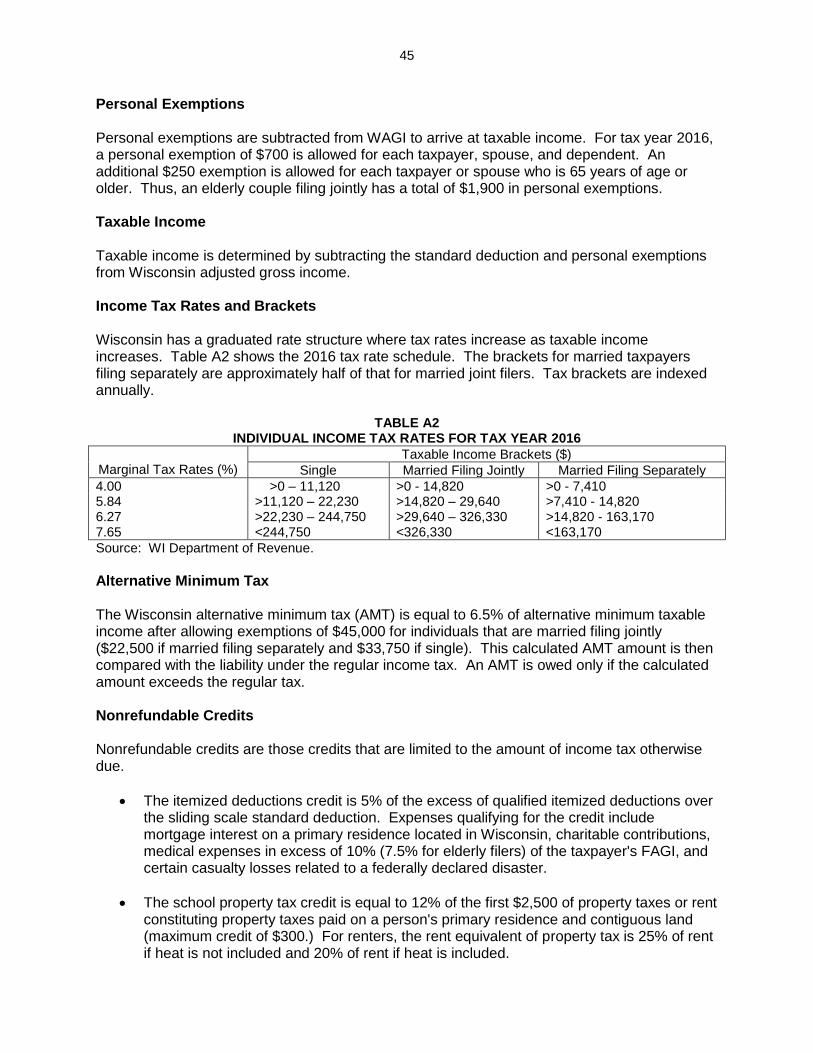
45
Personal Exemptions Personal exemptions are subtracted from WAGI to arrive at taxable income. For tax year 2016, a personal exemption of $700 is allowed for each taxpayer, spouse, and dependent. An additional $250 exemption is allowed for each taxpayer or spouse who is 65 years of age or older. Thus, an elderly couple filing jointly has a total of $1,900 in personal exemptions. Taxable Income Taxable income is determined by subtracting the standard deduction and personal exemptions from Wisconsin adjusted gross income. Income Tax Rates and Brackets Wisconsin has a graduated rate structure where tax rates increase as taxable income increases. Table A2 shows the 2016 tax rate schedule. The brackets for married taxpayers filing separately are approximately half of that for married joint filers. Tax brackets are indexed annually.
TABLE A2 INDIVIDUAL INCOME TAX RATES FOR TAX YEAR 2016
Marginal Tax Rates (%)
Taxable Income Brackets ($)
Single Married Filing Jointly Married Filing Separately
4.00 >0 – 11,120 >0 - 14,820 >0 - 7,410 5.84 >11,120 – 22,230 >14,820 – 29,640 >7,410 - 14,820 6.27 >22,230 – 244,750 >29,640 – 326,330 >14,820 - 163,170 7.65 <244,750 <326,330 <163,170
Source: WI Department of Revenue.
Alternative Minimum Tax The Wisconsin alternative minimum tax (AMT) is equal to 6.5% of alternative minimum taxable income after allowing exemptions of $45,000 for individuals that are married filing jointly ($22,500 if married filing separately and $33,750 if single). This calculated AMT amount is then compared with the liability under the regular income tax. An AMT is owed only if the calculated amount exceeds the regular tax. Nonrefundable Credits Nonrefundable credits are those credits that are limited to the amount of income tax otherwise due.
The itemized deductions credit is 5% of the excess of qualified itemized deductions over the sliding scale standard deduction. Expenses qualifying for the credit include mortgage interest on a primary residence located in Wisconsin, charitable contributions, medical expenses in excess of 10% (7.5% for elderly filers) of the taxpayer's FAGI, and certain casualty losses related to a federally declared disaster.
The school property tax credit is equal to 12% of the first $2,500 of property taxes or rent constituting property taxes paid on a person's primary residence and contiguous land (maximum credit of $300.) For renters, the rent equivalent of property tax is 25% of rent if heat is not included and 20% of rent if heat is included.
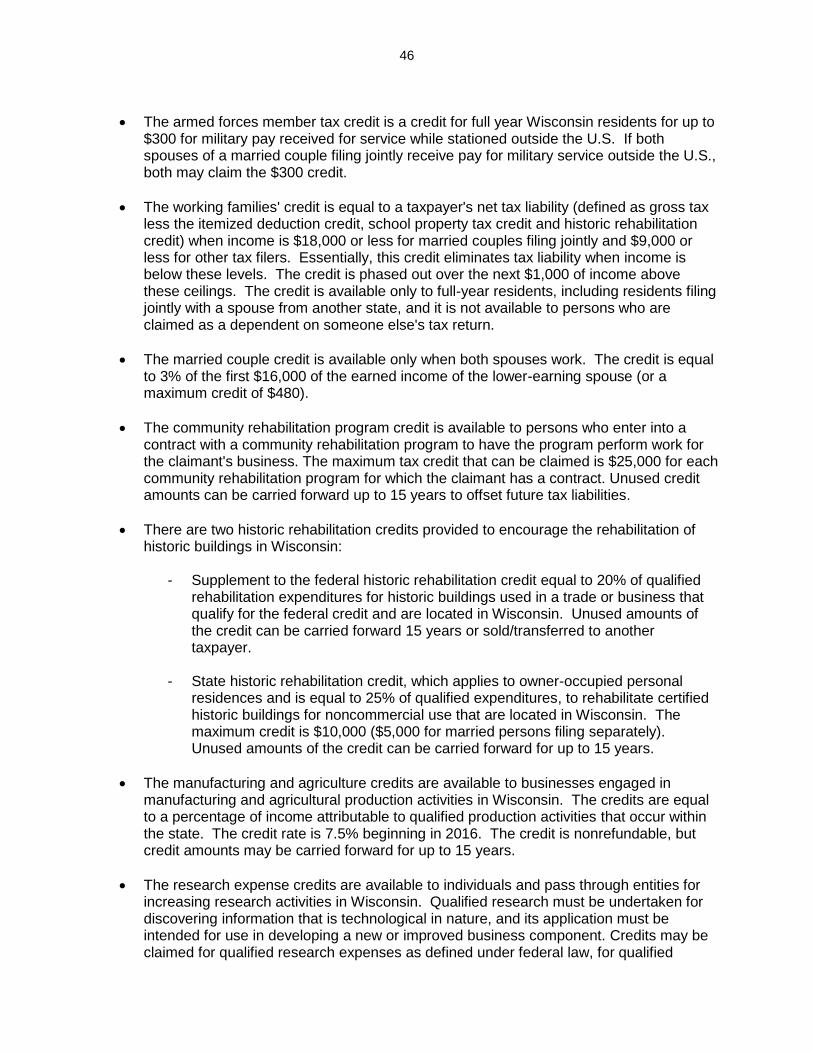
46
The armed forces member tax credit is a credit for full year Wisconsin residents for up to $300 for military pay received for service while stationed outside the U.S. If both spouses of a married couple filing jointly receive pay for military service outside the U.S., both may claim the $300 credit.
The working families' credit is equal to a taxpayer's net tax liability (defined as gross tax less the itemized deduction credit, school property tax credit and historic rehabilitation credit) when income is $18,000 or less for married couples filing jointly and $9,000 or less for other tax filers. Essentially, this credit eliminates tax liability when income is below these levels. The credit is phased out over the next $1,000 of income above these ceilings. The credit is available only to full-year residents, including residents filing jointly with a spouse from another state, and it is not available to persons who are claimed as a dependent on someone else's tax return.
The married couple credit is available only when both spouses work. The credit is equal to 3% of the first $16,000 of the earned income of the lower-earning spouse (or a maximum credit of $480).
The community rehabilitation program credit is available to persons who enter into a contract with a community rehabilitation program to have the program perform work for the claimant's business. The maximum tax credit that can be claimed is $25,000 for each community rehabilitation program for which the claimant has a contract. Unused credit amounts can be carried forward up to 15 years to offset future tax liabilities.
There are two historic rehabilitation credits provided to encourage the rehabilitation of historic buildings in Wisconsin:
- Supplement to the federal historic rehabilitation credit equal to 20% of qualified rehabilitation expenditures for historic buildings used in a trade or business that qualify for the federal credit and are located in Wisconsin. Unused amounts of the credit can be carried forward 15 years or sold/transferred to another taxpayer.
- State historic rehabilitation credit, which applies to owner-occupied personal
residences and is equal to 25% of qualified expenditures, to rehabilitate certified historic buildings for noncommercial use that are located in Wisconsin. The maximum credit is $10,000 ($5,000 for married persons filing separately). Unused amounts of the credit can be carried forward for up to 15 years.
The manufacturing and agriculture credits are available to businesses engaged in manufacturing and agricultural production activities in Wisconsin. The credits are equal to a percentage of income attributable to qualified production activities that occur within the state. The credit rate is 7.5% beginning in 2016. The credit is nonrefundable, but credit amounts may be carried forward for up to 15 years.
The research expense credits are available to individuals and pass through entities for increasing research activities in Wisconsin. Qualified research must be undertaken for discovering information that is technological in nature, and its application must be intended for use in developing a new or improved business component. Credits may be claimed for qualified research expenses as defined under federal law, for qualified
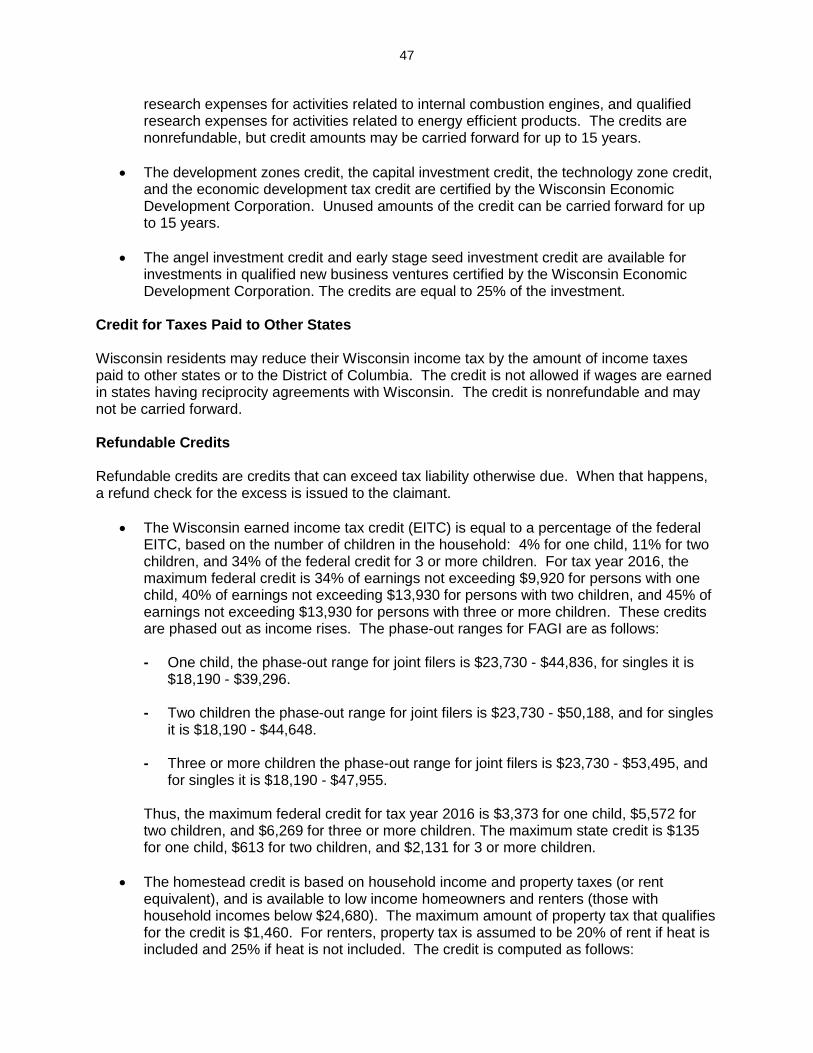
47
research expenses for activities related to internal combustion engines, and qualified research expenses for activities related to energy efficient products. The credits are nonrefundable, but credit amounts may be carried forward for up to 15 years.
The development zones credit, the capital investment credit, the technology zone credit, and the economic development tax credit are certified by the Wisconsin Economic Development Corporation. Unused amounts of the credit can be carried forward for up to 15 years.
The angel investment credit and early stage seed investment credit are available for investments in qualified new business ventures certified by the Wisconsin Economic Development Corporation. The credits are equal to 25% of the investment.
Credit for Taxes Paid to Other States Wisconsin residents may reduce their Wisconsin income tax by the amount of income taxes paid to other states or to the District of Columbia. The credit is not allowed if wages are earned in states having reciprocity agreements with Wisconsin. The credit is nonrefundable and may not be carried forward. Refundable Credits Refundable credits are credits that can exceed tax liability otherwise due. When that happens, a refund check for the excess is issued to the claimant.
The Wisconsin earned income tax credit (EITC) is equal to a percentage of the federal EITC, based on the number of children in the household: 4% for one child, 11% for two children, and 34% of the federal credit for 3 or more children. For tax year 2016, the maximum federal credit is 34% of earnings not exceeding $9,920 for persons with one child, 40% of earnings not exceeding $13,930 for persons with two children, and 45% of earnings not exceeding $13,930 for persons with three or more children. These credits are phased out as income rises. The phase-out ranges for FAGI are as follows:
- One child, the phase-out range for joint filers is $23,730 - $44,836, for singles it is
$18,190 - $39,296. - Two children the phase-out range for joint filers is $23,730 - $50,188, and for singles
it is $18,190 - $44,648. - Three or more children the phase-out range for joint filers is $23,730 - $53,495, and
for singles it is $18,190 - $47,955.
Thus, the maximum federal credit for tax year 2016 is $3,373 for one child, $5,572 for two children, and $6,269 for three or more children. The maximum state credit is $135 for one child, $613 for two children, and $2,131 for 3 or more children.
The homestead credit is based on household income and property taxes (or rent equivalent), and is available to low income homeowners and renters (those with household incomes below $24,680). The maximum amount of property tax that qualifies for the credit is $1,460. For renters, property tax is assumed to be 20% of rent if heat is included and 25% if heat is not included. The credit is computed as follows:
48
- If household income is $8,060 or less, the credit is 80% of property taxes up to
$1,460 (or a maximum credit of $1,168); - If household income is more than $8,060 but not more than $24,680, the credit is
equal to 80% of the amount by which the property tax exceeds 8.785% of household income in excess of $8,060;
- If household income exceeds $24,680, no homestead credit is allowed.
- In computing household income, a claimant may deduct $500 for each dependent
living with the claimant.
The farmland preservation credit is available to owners of farmland covered by a farmland preservation agreement. The credit is a flat payment of $5, $7.50, or $10 per acre of qualifying farmland. To qualify for the credit the farmland must be part of a farm that produces gross profits of at least $6,000 in the year the credit is claimed or $18,000 in total for the years the credit is claimed and the two prior years.
The veterans and surviving spouses property tax credit was first available in tax year
2005. Eligible veterans and surviving spouses may claim this credit in the amount of property taxes paid during the year on the claimant's principal dwelling in Wisconsin. To be eligible for the credit, veterans must be verified by the Wisconsin Department of Veterans Affairs as having served in the U.S. armed forces, having been a Wisconsin resident at the time of entry into service, currently being a Wisconsin resident for the purpose of veterans benefits, and having a service-connected disability rating of 100% or a 100% disability rating based on individual unemployability. An eligible surviving spouse must be an un-remarried widow of an individual who was a Wisconsin resident at the time of entry into service, was a Wisconsin resident at the time of death, and died while on active duty or would be otherwise considered an eligible veteran at the time of death. Beginning in 2014, eligible surviving spouses also included individuals who receive dependency and indemnity compensation, as defined in 38 USC 101(14).
The enterprise zone jobs credit is available to persons doing business in an enterprise zone. The Wisconsin Economic Development Corporation must certify the business as eligible for the credit and determine the amount of credit based on activities in the designated zones, including creating or retaining jobs, making significant capital investments, conducting employee training, and maintaining a supply chain in Wisconsin.
The jobs tax credit must be certified by the Wisconsin Economic Development Corporation, which may award jobs tax credits to businesses that are operating or intending to operate in Wisconsin and pursuant to a contract with the corporation. The credit is based on the amount of wages paid to eligible employees in the taxable year, subject to a maximum amount of 10% of such wages, and the costs incurred by the claimant to undertake training activities in the current year.
The business development credit was created to replace the non-refundable economic development credit and the refundable jobs tax credit. It was first available in tax year 2016. Businesses are required to meet certain employment and investment criteria, as determined by WEDC in order to claim the credit.