Embed Size (px)
Citation preview
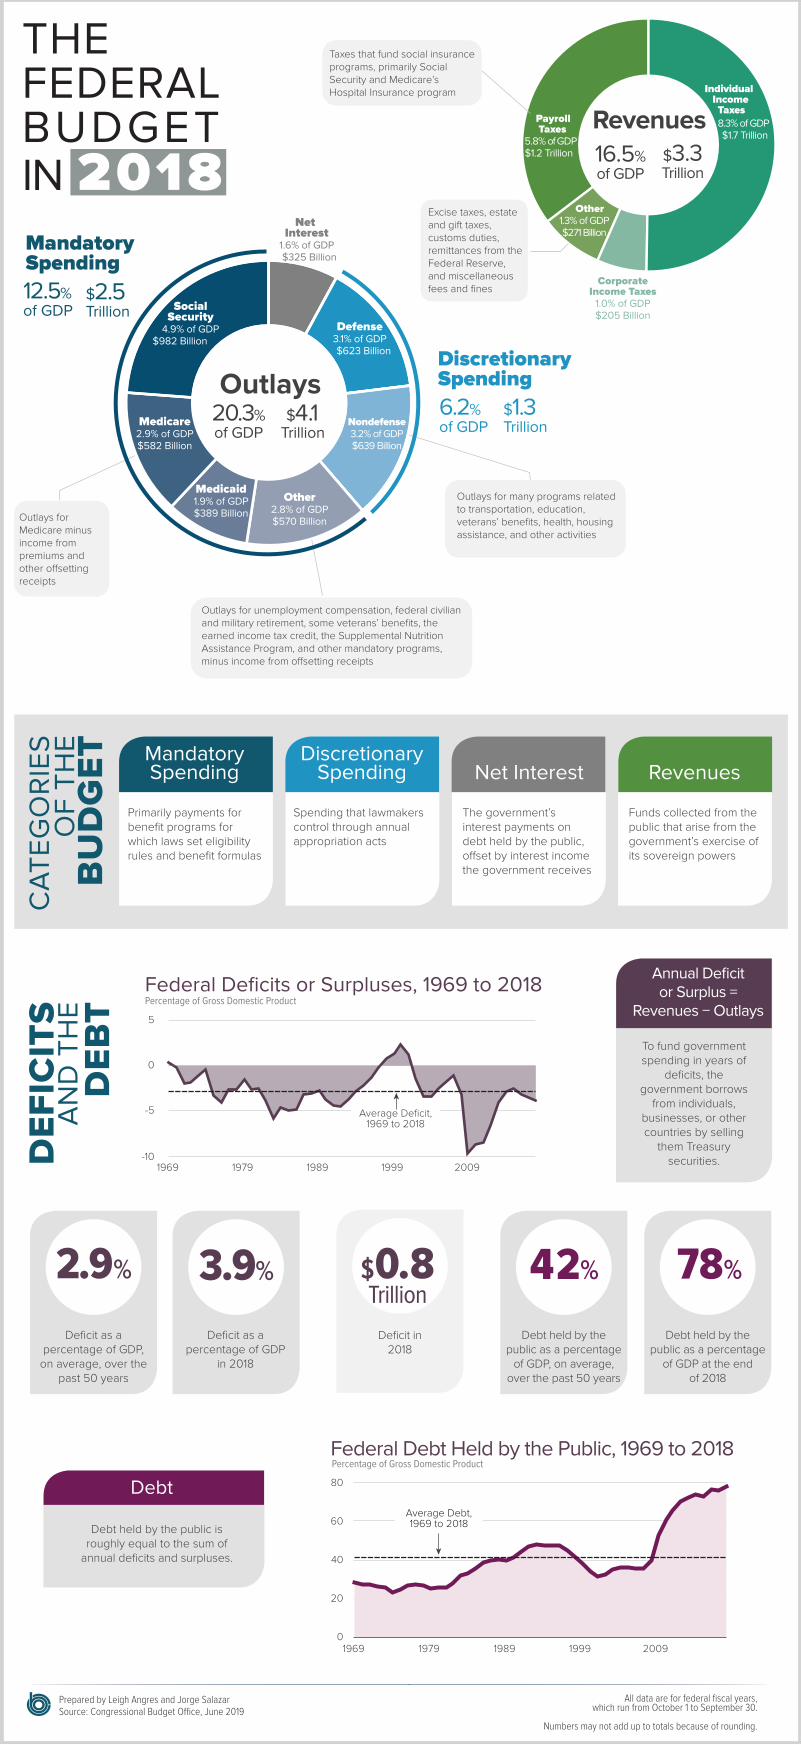
Annual Deficit or Surplus =
Revenues − Outlays
To fund government spending in years of
deficits, the government borrows
from individuals, businesses, or other countries by selling
them Treasury securities.
Federal Deficits or Surpluses, 1969 to 2018Percentage of Gross Domestic Product
Percentage of Gross Domestic Product
Debt
Debt held by the public is roughly equal to the sum of
annual deficits and surpluses.
Federal Debt Held by the Public, 1969 to 2018
Prepared by Leigh Angres and Jorge SalazarSource: Congressional Budget O�ce, June 2019
All data are for federal fiscal years,which run from October 1 to September 30.
Numbers may not add up to totals because of rounding.
$1.3 Trillion
Defense3.1% of GDP
$623 Billion
Nondefense3.2% of GDP$639 Billion
Other2.8% of GDP$570 Billion
Medicaid1.9% of GDP$389 Billion
Net Interest
1.6% of GDP $325 Billion
Outlays
MandatorySpending
Outlays for unemployment compensation, federal civilian and military retirement, some veterans’ benefits, the earned income tax credit, the Supplemental Nutrition Assistance Program, and other mandatory programs, minus income from o�setting receipts
Outlays for Medicare minus income from premiums and other o�setting receipts
DiscretionarySpending
12.5% of GDP
$2.5 Trillion
6.2% of GDP
$4.1Trillion
20.3%of GDP
Outlays for many programs related to transportation, education, veterans’ benefits, health, housing assistance, and other activities
Medicare2.9% of GDP$582 Billion
SocialSecurity
4.9% of GDP$982 Billion
Taxes that fund social insurance programs, primarily Social Security and Medicare’s Hospital Insurance program
Revenues
CorporateIncome Taxes
1.0% of GDP$205 Billion
Payroll Taxes 5.8% of GDP $1.2 Trillion
Individual Income Taxes 8.3% of GDP $1.7 Trillion
Other1.3% of GDP$271 Billion
Excise taxes, estate and gift taxes, customs duties, remittances from the Federal Reserve, and miscellaneous fees and fines
$3.3Trillion
16.5%of GDP
DEF
ICITS
AN
D T
HE
DEB
T
Deficit as a percentage of GDP,
on average, over the past 50 years
2.9%
Deficit as a percentage of GDP
in 2018
3.9%
Debt held by the public as a percentage
of GDP, on average, over the past 50 years
42%
Deficit in 2018
$0.8Trillion
Debt held by the public as a percentage
of GDP at the end of 2018
78%
0
20
40
60
80
1969 1979 1989 1999 2009
-10
-5
0
5
1969 1979 1989 1999 2009
Average Deficit,1969 to 2018
Average Debt,1969 to 2018
CA
TEG
OR
IES
OF
THE
BUDGET RevenuesNet Interest
DiscretionarySpending
Funds collected from the public that arise from the government’s exercise of its sovereign powers
The government’s interest payments on debt held by the public, o�set by interest income the government receives
Spending that lawmakers control through annual appropriation acts
Primarily payments for benefit programs for which laws set eligibility rules and benefit formulas
MandatorySpending
THEFEDERALBUDGETIN 2018


![Mrunal [Budget] Interim Budget 2014 (Part 1of4)_ Revenue Reciepts, Direct Taxes, Indirect Taxes, Gross vs Net Taxes, Shortfalls in Collection » Mrunal](https://img.pdfslide.us/doc/110x75/577cca0f1a28aba711a5424c/mrunal-budget-interim-budget-2014-part-1of4-revenue-reciepts-direct-taxes.jpg)