Embed Size (px)
Citation preview

Summary—Little Missouri at Albert Pike Campground, AR Campground Page 1
Indirect Measurement Summary Little Missouri River at Albert Pike, Arkansas
Ouchita River Basin Miscellaneous Site
Q= 40,100 ft3/s Flood of June 11, 2010
Type of measurement: Slope Area Location of site: A miscellaneous site adjacent and through parts of Area C of the U.S. Forest Service Campground at Albert Pike Recreation Area. Lat N 34˚22’35”, Long W 93˚52’50” This site was selected because it was a straight converging reach. This reach runs almost due east and is downstream of the inflow from Brier Creek and upstream of the unnamed tributary coming in on the left bank where the river takes an abrubt curve to the southwest. A low water bridge crosses the river approximately 700 feet downstream of the the indirect measurement location. A severe constriction occurs 0.7 miles downstream of the indirect measurement site (just downstream of the abrupt bend in the river) as a highly resistant layer of novaculite protrudes into the channel on the left bank (outer bend of the river) and a constructed parking area protrudes on the right bank. Surveys were also conducted in the area of the constriction to check if critical depth computations for flow can be made in this constricted area. 17 of the 20 flood fatalities came from Area D of the campground which was 0.3 river miles upstream of the indirect measurement site. Area C of the campground was under construction at the time of the flood and had no occupants camping the morning of June 11, 2010. The site is Approximately 5.04 miles northwest of Langley, Arkansas, 12.55 miles southwest of Norman, Arkansas, 15 miles west-southwest of Caddo Gap, Arkansas, and 31 miles east of Cove, Arkansas. Arkansas Highway 369 comes from Langley north to Albert Pike Recreation Area. At the entrance to Albert Pike, AR Highway 369 ends and County Road 4 (AKA USFS Road 73) continues in the left bank floodplain of the Little Missouri River, which includes the indirect measurement reach Approximately 700 feet downstream of the downstream most cross section for the indirect, there is a low water bridge for County Road 106 and allows access to the right bank and Areas A and B of the Campground. County Road 220 (from specialty USGS TOPO for Forest Service) splits off to the south and proceeds through Loop B of the campground and follows the right bank downstream into the private Lowery’s Albert Pike RV Park. County Road 106 continues in a southwesterly direction and goes up hill and eventually ends running along Blaylock Creek. Survey of site: Site was selected on Sunday June 13, 2010 by Robert Holmes during reconnaissance of the flood area. High water marks were flagged on the morning of June 14, 2010 by Robert Holmes. A survey commenced in the late afternoon of June 14, 2010 by Paul Rydlund, Larry Buschman, and Robert Holmes. Ferrell Killian joined the survey party on the morning of June 15, 2010. The initial occupation point (OC-1)was a pin driven into the asphalt road upstream of Area D near the area that served as the command center during the search and rescue operations. This location is approximately 0.36 river miles upstream of the indirect measurement site. An arbitrary Northing/Easting of 5000/5000 was assumed with an elevation

Summary
of 100. Twas vacaseveral hUTM Zo
Elevatio
9 High watupstreamthe indirewell as th The Survstation, s
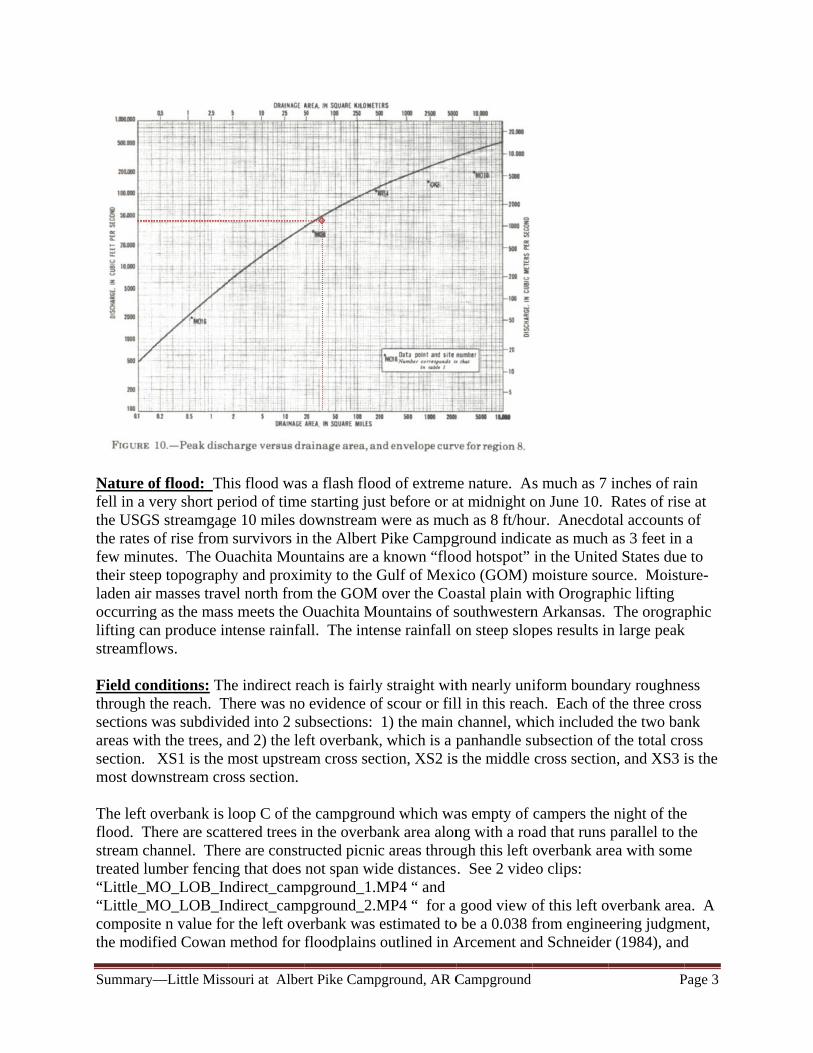
Dischargmiscellan Drainagwas verif Unit Dis(Region the envel
y—Little Miss
The azimuthated by the tohours to estabone 15 coord
on NAVD88
33.28
ter marks wem cross sectioect measuremhe channel g
vey of the inderial numbe
ge and Gageneous site.
e area: 34.1fied by the U
charge: 18) is below, lope.
souri at Albe
h was establiotal station sblish the true
dinates and N
Northing (U
124823
ere surveyedon of the indment site in ogeometry of t
direct measur 111304.
e Height: 4
1 mi2 as deteUSGS Arkan
,180 cfs/mi2
with this flo
rt Pike Camp
shed with a survey, a Trie horizontal
NAVD88 Ele
UTM Feet)
340.14
d along the ledirect measurorder to captthe constrict
urement site
0,100 cfs, ra
ermined by Ansas Water S
. Crippen anood approxim
pground, AR C
compass beamble GPS uand vertical
evation for O
Easting (UTM
1373363
eft floodplairement. Theture additionted area.
was made u
ated at fair. N
Albert Rea oScience Cent
nd Bue (197mately plotte
Campground
aring of magunit was setul position of OC-1 is:
M Feet)
3.85
n from OC-e survey wasnal high wat
using a Nikon
No Gage He
of the USGSter.
77) envelopeed. You will
gnetic north.up to occupy each survey
1 to the locas continued der marks alo
n DTM-450
eight as this
using NHD
e curve for thl note that th
P
After the pthe point fo
y point. The
ation of the downstream ong the river
2-second to
is a
D Plus. This v
his region his flood plo
Page 2
point or e
m of r as
otal
value
ots on
Summary
Nature ofell in a vthe USGthe rates few minutheir steeladen air occurringlifting castreamflo Field conthrough tsections wareas witsection. most dow The left oflood. Thstream chtreated lu“Little_M“Little_Mcompositthe modi
y—Little Miss
of flood: Thvery short peS streamgagof rise from
utes. The Ouep topograph
masses travg as the massan produce inows.
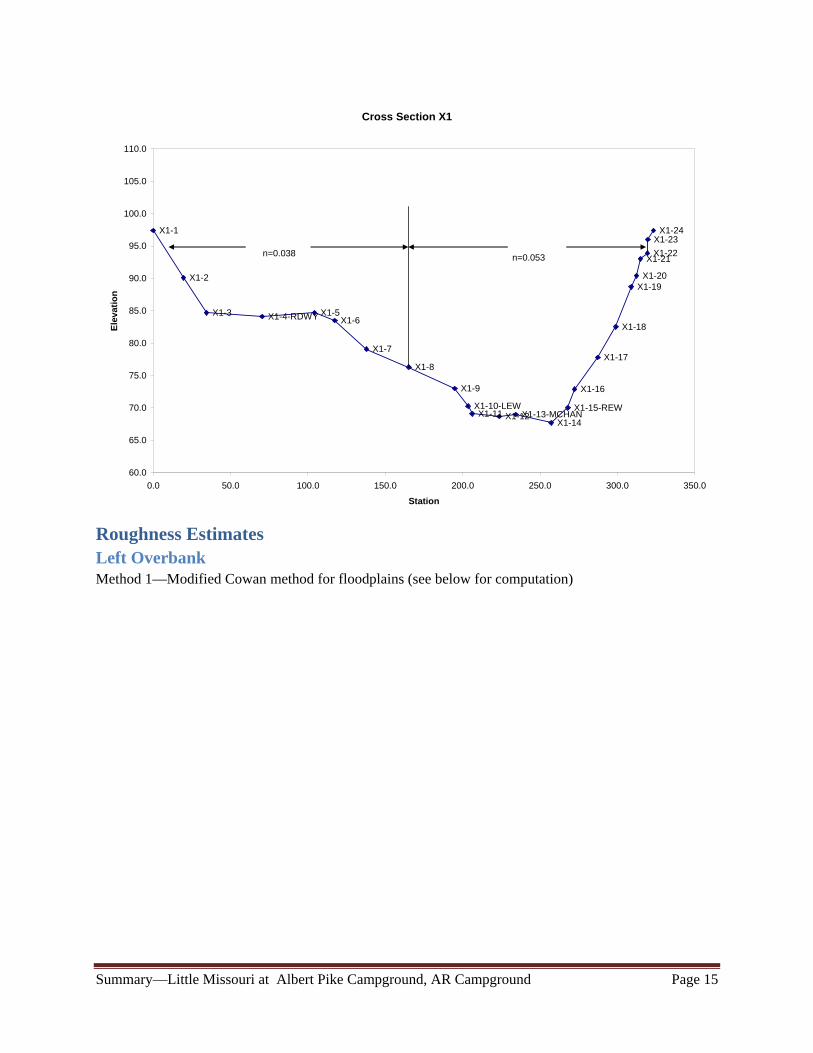
nditions: Ththe reach. Twas subdividth the trees, a XS1 is the m
wnstream cro
overbank is here are scathannel. Theumber fencinMO_LOB_InMO_LOB_Inte n value fofied Cowan
souri at Albe
his flood waseriod of timege 10 miles d
m survivors inuachita Mouhy and proximvel north froms meets the Ontense rainfa
he indirect reThere was noded into 2 suand 2) the lemost upstreaoss section.
loop C of thttered trees ire are constr
ng that does ndirect_campndirect_campor the left ove
method for
rt Pike Camp
s a flash flooe starting jusdownstream n the Albert untains are a mity to the Gm the GOM Ouachita Moall. The inten
each is fairlyo evidence ofubsections: eft overbank,am cross sec
e campgrounin the overbaructed picnicnot span widpground_1.Mpground_2.Merbank was efloodplains
pground, AR C
od of extremst before or awere as mucPike Campgknown “floo
Gulf of Mexiover the Coountains of snse rainfall o
y straight witf scour or fil1) the main , which is a pction, XS2 is
nd which waank area alonc areas throude distancesMP4 “ and MP4 “ for a estimated tooutlined in A
Campground
me nature. Aat midnight och as 8 ft/hoground indicod hotspot” ico (GOM) mastal plain wsouthwesternon steep slop
th nearly unill in this reacchannel, whpanhandle su
s the middle
as empty of ng with a roaugh this left . See 2 vide
good view oo be a 0.038 fArcement an
s much as 7 on June 10. ur. Anecdotate as much in the Unitemoisture sou
with Orograpn Arkansas. pes results in
iform boundch. Each of hich includedubsection ofcross section
campers thead that runs overbank ar
eo clips:
of this left ofrom engine
nd Schneider
P
inches of raRates of risetal accounts as 3 feet in
ed States dueurce. Moistuphic lifting The orograpn large peak
dary roughnethe three crod the two banf the total cron, and XS3 i
e night of theparallel to thea with som
overbank areeering judgmr (1984), and
Page 3
ain e at of a
e to ure-
phic k
ess oss nk oss is the
e he
me
a. A ment, d

Summary
Petry andto place ias estimathe left o
Looking
The mainand downmost upsthe thicknbank sideis very litFor a looA compovalues frohttp://pubmaterial water bri As notedthe presegravel woand is de
y—Little Miss
d Bosmajianit at 0.038 inated from staverbank 100
g from upstre
Lo
n channel hanstream crosstream cross ness ended ae was complttle sign of a
ok at the maiosite n value om channel bs.usgs.gov/size data camidge.
d, gravel waence of graveould indicateposited dow
souri at Albe
n (1975) metnfluenced byagnation pres0 ft downstre
eam diagonhyd
ooking from
as a rock bottss sections, bsection Tree
as one progreletely woodeany channel n channel onof 0.053 wawidth, exam
/wsp/wsp_18me from the
s not as promel would serve smoother n
wnstream bel
rt Pike Camp
thod outlinedy the desire tossure compueam of the in
ally to the Xdrographer h
m XS1 downs
tom with verbut gravel jues and brushessed into th
ed as it the riinstability, sn video, see as assumed bmination of p849/pdf/wsp_gravel bar 7
minent in theve to only inn values. It iow the low w
pground, AR C
d by Arcemeo match the
utations fromndirect reach
XS2. Note loolding rod h
stream throu
ry little gravust upstream h were thick he left overbight overbanscour or fill h“Little_MO
based on engphotos from _1849.pdf),
700 feet belo
e indirect reancrease the rois noted thatwater crossin
Campground
ent and Schnleft overban
m the runup oh.
ocation of hihorizontally.
ugh Left over
vel or other mof the upstreon the immeank which is
nk was essenhaving taken
O_Main_Indigineering judBarnes (196and use of t
ow the reach
ach, but the oughness vat gravel is trang.
neider (1984nk velocities on the bathro
gh water ma
rbank area
mobile mateream xsect. Uediate left bas shown abo
ntially the van place durinirect_campgrdgment, weig67, theoretical eqh and just bel
assumption alue of n andansported th
P
4). The decisnear to 9.0
oom buildin
arks as show
rial in the mUpstream ofank side befoove. The righalley wall. Tng this floodround_1.MPghting of n
quations. Blow the low
was made thd the absencehrough this re
Page 4
sion ft/s g in
wn by
middle f the ore ht
There d. P4 “.
ed
hat e of each

Summary
Lookingb
y—Little Miss
g from left bboulders tha
Looking
souri at Albe
bank upstreamat are visible
g at channel
rt Pike Camp
m to XS1 ware not pres
bottom at X
pground, AR C
here rodmansent in the m
XS3 from left
Campground
n is in middlmain channel
ft bank looki
le of main chin the indire
ing to right b
P
hannel. Noteect reach
bank
Page 5
e the

Summary
F
The highrelativelyon both b Right Ba
Mark NaRH-1 RH-2-F-WRH-3-E RH-4-P RH-5-F RH-6-F RH-7-E RH-8-F Left Ba
Mark Name LH-7-E LH-8-F LH-9-F LH-10-FLH-11-PLH-12-FLH-13-GLH-14-ELH-15-F
y—Little Miss
From XS
From trail on
h water marky few high wbanks. A few
ank High W
ame
WSH
ank High W
Station 185.0 187.2 252.4
F 409.3 P 461.8 F 539.8 G 554.5 E 556.1 F 559.4
souri at Albe
S1 looking do
n right bank v
ks were of gewater marks ww excellent h
Water Marks
Station26404246476478
112
Water Marks
NAVD Elev
rt Pike Camp
ownstream,
valley wall a
enerally fair were found. high water m
s
n NAVD Elevatio
62.6 01.6 25.0 69.0 70.1 44.1 88.0 29.9
s
vations 924.42 925.36 925.15 925.03 924.71 922.69 922.42 922.68 922.71
pground, AR C
note some g
at XS1 looki
to good con Mudlines a
marks were f
ons 924.68 923.56 923.75 924.02 923.32 922.93 922.3
919.78
Campground
gravel on the
ing to leftban
ndition. Becaand/or washlfound on sign
e bed of this
nk and main
ause of highlines were fon boards in t
P
xsect
n channel.
h velocities, ound at locatthe campgro
Page 6
tions ound.

Summary—Little Missouri at Albert Pike Campground, AR Campground Page 7
Computations: SAM 2.1 was used to process the Total Station Survey data and ready it for input into the SAC program (Slope Area Computation). The discharge computed for this measurement was 40,100 cfs. The reach was contracting from X1 to X2 and slightly expanding from X2 to X3. Following are the output diagnostics from SAC. Reach dH,fall length Discharge Spread HF CX RC RX ER (ft) (ft) (cfs) (%) (ft) _____________________ X1 - X2 0.65 105. 38124. 0 0.378 1.000 0.720 0.000 # X2 - X3 0.50 100. 43163. 3 0.518 0.982 0.000 -0.070 # X1 - X3 1.15 205. 40088. 1 0.865 0.993 0.348 -0.036 # Definitions:
Spread: the percent difference between discharge computed with no expansion loss (k=0) and discharge computed with full expansion loss (k=1.0), divided by the discharge computed with full expansion loss
HF: friction head which is the sum of Q*Q*L/(K1*K2) over subreaches L: reach length; K1, upstream section conveyance; K2: downstream section conveyance CX: the computed discharge divided by the discharge computed with no expansion loss (k=0) RC: velocity head change in contracting section divided by friction head RX: velocity head change in expanding section divided by friction head
Sensitivity Analysis:
Sensitivity analysis was conducted on the n values and water surface slope. The n values were varied +/- 10% to see the impact on the final flow result. A +/- 10% variation in n values resulted in -6.5% to +7.7% difference from the accepted flow value of 40,100 ft3/s. The accepted fall value of 1.15 ft was lowered to1.00 ft (-13% change) which resulted in a -4.0 % change in the accepted flow value of 40,100 ft3/s. Evaluation: Use 40,100 cfs and consider it fair reliability. The indirect is downgraded from good to fair based on the low number of high water marks, short reach lengths, and only 3 cross sections. Additional factors supporting the quality of this measurement include the following:
1. The high water marks were flagged and surveyed within 4 days of the flood. A good wash line was evident on the valley walls and a few excellent high water marks were found in the display cases.
2. Although there was slight expansion from X2 to X3, the diagnostics (Spread near 0, CX approaching 1, and small values of RX) indicate that expansion is not an issue. The velocity head change from XS1 to XS3 is about 33% of the friction head in this reach. The lower this ratio the more accurate the measurement per Kirby (1987).
3. There is little evidence that the reach cross section main channel has changed much during the flood. The channel is remarkably stable. The left overbank had minor erosion/deposition of sands, gravels, and fines from the ground being bare from construction. The impact to any cross sectional change is negligible.
4. There is no evidence that this flood was a debris flow based on evidence left behind such as scouring and deposition.
5. An estimate of velocity at the bathroom house 100 feet downstream of XS3 in the left overbank was made from measuring the difference in the water surface elevation on the front of the building and inside the electrical room. The difference was 1.25 ft. Equating that to a stagnation point, the 1.25 would be equal to the velocity head at that point. Computing the

Summary—Little Missouri at Albert Pike Campground, AR Campground Page 8
velocity from ftgv 25.12
2 provided and estimate of v = 9.0 ft/s. As the SAC sensitivity
analysis results were evaluated, some weight was giving to those combination of parameters that allowed for a velocity in the overbank that matched closest to 9.0 ft/s.
6. As a check, it was thought that the constriction 1660 ft downstream of XS1 would induce critical flow depth. As such the survey team collected cross section data at the constriction and an approach section. Using HWMs at the constriction, the mean hydraulic depth (D=A/T) computes as 12.02 with a cross sectional area of 2,874 ft2. From critical flow equation (
gDV , the flow for the measured depth was 56,541 cfs, which way overestimated the flow
given from SAC. However, the extra cross sections were used to run a second independent SAC computation for XS3, XS4, and XS5 (XS5 is the constriction and XS4 is the approach). The SAC computation for these three section, although dealing with some expansion issues, yielded a discharge estimate of 40,600 cfs, which is within 1.2% of the 40,100 estimated for this measurement.
7. Superelevation was noted in the curved reach which is 1500 feet downstream of the indirect reach. The superelevation was used to estimate the mean velocity (Chow, 1959) at 7.22 ft/s. Multiplying this value by the XS4 area estimates the discharge at 38,100 cfs, which is within 5% of the 41,100 cfs estimated for this measurement.
Previous computations: None Remarks: Riggs (1976) method estimates the Q at 51,000 ft3/s, although its use its validity is questionable when water surface elevations far exceed bank-full magnitudes. Response to selected review comments of Rodney Southard. Southard comments as numbered item, Holmes response in italics:
1. GPS equipment was used to establish vertical and horizontal control at the point of origin for the indirect survey. Suggest documenting the coordinates of this point in the indirect report and water surface elevations used in the analyses. It would be beneficial to translate all points to real world coordinates for future reference.
I have noted the UTM Zone 15 NAD83 horizontal location and NAVD88 vertical elevation of OC-1 in the summary. All points were already translated to real world coordinates in the file “Little_MO_Campground_RydlundIndirects_post alignment.xlsx”
2. Thalweg slope is 28.3 ft/mile estimated water surface slope used is 29.6 ft/mile. Also, the main channel is eccentric with respect to the floodplain. There were also large movable obstructions on the left floodplain such as trucks and RV’s that might give misleading HWM’s resulting in the inconsistent marks recovered. The water surface profile on the right bank is more consistent and resulted in a slope of 28.3 ft/mile per high water marks found. Suggest using 28.3 ft/mile or 1.1 ft/mile for the fall for the reach. From the high water mark profile plotted the following water surface elevations would be: X1 = 91.15, X2 = 90.6, and X3 = 90.05.
Determination of the true channel slope is difficult whether it be from a thalwag field survey, picking points from DRG, or cutting a profile in ARCGIS from the DEM. The difference between the water surface slope (fall) in the original computation (29.6 ft/mile) is well within the error in estimating the local channel slope. As such, I have chosen to stay with the original channel slope of 29.6 ft/mile.

Summary—Little Missouri at Albert Pike Campground, AR Campground Page 9
3. Subarea break between the left overbank and main channel is at 165.3 stationing for cross section 1 (X1). Geometry data for this cross section and comparison to X2 and X3 the subarea break would be more representative at station 137.9. Perhaps a subarea break even at station 156.5 would be suitable depending on slope area output results.
Subarea break point was located to coincide with a boundary roughness change. Mark Smith re-computed the indirect with the same suggested subdivision of X1, with the result that it only changed the discharge by less than -0.8%. No changes to the subarea break point was made.
4. Stagnation point computations at the bathroom below X3 to estimate the velocity of the floodwater on the left overbank may be suitable if equilibrium was reached at the peak stage. Were there any constrictions to flow for floodwater to enter the bathroom? Considering the rapid change in stage in this reach was the equilibrium reached for the very peak stage? Did the HWM elevation at the bathroom compare well (+/- 0.1 ft) to other HWM’s in the vicinity?
According to eyewitnesses, the peak stage lasted a pretty long time. As such, I believe it long enough to reach equilibrium. As to whether, the marks inside the power room agreed with other marks in the vicinity, we did not survey the marks inside the restroom, nor the runup mark on the front of the building. Instead, we used a hand level to transfer the marks from the electrical room to the concrete masonry block on the outside of the building in order to get an elevation difference between the runup and the value inside.
5. There is a streamgage downstream of the indirect site on the Little Missouri River (07360200). What was the peak flow at the streamgage? May want to compare peak values/unit runoff for consistency.
I have been comparing all the indirects for unit discharge to evaluate consistency, including the Little Missouri River near Langley, Arkansas (07360200). Final discharge for the Langley gage has not been agreed too as of this writing.
6. In one of the pictures taken in the field, a U.S. Forest Service sign designated locations as areas “A” or “B” etc., but the indirect write-up references loops? Are they representing the same locations? If so may want to be consistent with U.S. Forest Service terminology.
Forest Service has been very inconsistent with use of terminology. Referring to the individual campgrounds as “Loops” in most of their correspondence with me, but indeed the reference sign map refers to “Area”. I have revised the language to “Area” in the summary.
Response to selected review comments of Jaysson Funkhouser. Funkhouser comments as numbered item, Holmes response in italics:
1. Overall Manning’s values are slightly “atypical” to the values that have been used with other indirects in Arkansas. Specifically:
2. Left overbank for XS1-3 of 0.038 seems low. Especially with the obstacles (vehicles, etc.) that the water flowed around. There was only 10 – 12’ of water flowing over the floodplain (fairly shallow considering the depth of the channel);
Given the low tree density and the “swept clean” look of the ground, I consider an n value of 0.038 to be reasonable. In addition, 10 to 12 feet of flow would not be considered shallow when comparing it to many of the n value verification studies in the literature. As a last refining check, I used the runup on the bathhouse as a check of the velocities in the overbank. The runup indicated velocities in the 9 ft/s range. As noted in the SAC output, use of the overbank composite n = 0.038 yielded overbank velocities in the 9 ft/s range.
3. The Manning’s values seem high for the main channel. There were many boulders present and the channel meanders, but there was 25’ of water flowing through the channel.
The main channel n value is a composite n value that includes the impact of the vegetation on both banks. The n value for the main channel was evaluated through a variety of means as noted in the summary and computations. The influence of the vegetation on both banks played a large role in

Summary—Little Missouri at Albert Pike Campground, AR Campground Page 10
increasing the roughness value. The overall main channel width was 148 feet, of which 75 feet (50%) was trees and dense vegetation. I feel that 0.056 is a reasonable value for the n value.
4. The floodplain is around 300’ wide and the cross sections for the indirect were about 100’ apart. “Reach too short” error was generated from SAC. Because of this situation and the numerous obstacles the water flowed around and the steep slope, consider rating this indirect down from “good” to “fair to poor”.
A “reach too short” is more of a warning than an error. It is automatically given to any reach that is less than 75 times the mean depth per page 4 of TWRI Book 3 Chapter A2. As will be noted, 75 times mean depth is one of three possible criteria to meet. As noted in the TWRI, “one or more of the three criteria should be met when possible”. It is clear in this reading that all three requirements are not necessary to be met, and as such are not be the sole basis to downgrade the measurement. However, the measurement was downgraded to “fair” from “good” based on small number of available high water marks, only three cross sections, and short reach lengths.
References: Arcement, Jr., G. J. and Schneider, V.R., 1989, Guide for selecting Manning’s roughness coefficients for natural channels and flood plains, U.S. Geological Survey Water Supply Paper 2339, Barnes, Jr. H. H., 1967, Roughness characteristics of natural channels, U.S. Geological Survey Water Supply Paper 1849, 213 p Kirby, W.R., 1987, Linear error analysis of slope-area discharge determinations, Journal of Hydrology, Volume 96, pp125-138 Riggs, H.C., 1976, A simplified slope-area method for estimating flood discharges in natural channels, U.S. Geological Survey Journal of Research, Volume 4, Number 3, pp 285-290 Computed By: Robert R. Holmes, Jr. PhD, P.E., D.WRE National Flood Specialist Date: July 14, 2010 Reviewed By: Rodney E. Southard MO WSC Surface Water Specialist Date: August 10, 2010 Check By: Jaysson Funkhouser, P.E. Supervisory Hydrologist Date: August 31, 2010 Reviewed By: Mark Smith Regional Surface Water Specialist Date: September 3, 2010 Approval: Mark E. Smith Surface Water Specialist, Central Water Science Field Team Date: January 21, 2011

Summary—Little Missouri at Albert Pike Campground, AR Campground Page 11

Summary—Little Missouri at Albert Pike Campground, AR Campground Page 12
Appendices Little Missouri River at Albert Pike, Arkansas
Miscellaneous Site Flood of June 11, 2010
Graphs from SAM
Plan View (Little Missouri at Albert Pike CAmpground/9991)
RH-8-F
RH-7-ERH-6-F
RH-5-FRH-4-PRH-3-ERH-2-F-WSH
RH-1
LH-15-FLH-14-ELH-13-G
LH-12-FLH-11-P
LH-10-F
LH-9-FLH-8-FLH-7-E
HUB-7
HUB-6
HUB-5
4260
4460
4660
4860
5060
5260
5460
6470 6670 6870 7070 7270 7470 7670
Easting
No
rth
ing
RB HWMs
LB HWMs
HUBs
Ref Line
X3
X2
X1

Summary—Little Missouri at Albert Pike Campground, AR Campground Page 13
High Water Marks Profile (Little Missouri at Albert Pike CAmpground/9991)
RH-1
RH-2-F-WSHRH-3-ERH-4-P
RH-5-FRH-6-F
RH-7-E
RH-8-F
LH-9-FLH-8-F
LH-7-ELH-10-F
LH-11-P
LH-12-FLH-15-FLH-14-ELH-13-G
81.0
83.0
85.0
87.0
89.0
91.0
93.0
95.0
97.0
0 200 400 600 800 1000 1200
Distance
Ele
vati
on
RB HWMs
LB HWMs
X3
X2
X1
Debris line on left valley wall(not as trustworthy HWM)
Estimated Flow Profile
WS Elev.=91.15
WS Elev.=90.5
WS Elev.=90
100%
Cross Section X3
X3-26
X3-25X3-24X3-23
X3-22
X3-21
X3-20
X3-19X3-18X3-17X3-16X3-15X3-14X3-13X3-12
X3-11X3-10X3-9-LEW
X3-8
X3-7
X3-6
X3-5X3-4-ROADX3-3
X3-2
X3-1
60.0
65.0
70.0
75.0
80.0
85.0
90.0
95.0
100.0
0.0 50.0 100.0 150.0 200.0 250.0 300.0 350.0
Station
Ele
vati
on
n=0.038 n=0.053

Summary—Little Missouri at Albert Pike Campground, AR Campground Page 14
Cross Section X2
X2-28
X2-27X2-26
X2-25
X2-24
X2-23X2-22
X2-21X2-20X2-19X2-18X2-17X2-16
X2-15
X2-14-LEWX2-13
X2-12
X2-11
X2-10X2-9
X2-8X2-7-TOE
X2-6-RETWALLX2-5X2-4
X2-3
X2-2
X2-1
60.0
65.0
70.0
75.0
80.0
85.0
90.0
95.0
100.0
105.0
110.0
0.0 50.0 100.0 150.0 200.0 250.0 300.0 350.0
Station
Ele
vati
on
n=0.038 n=0.053
Summary—Little Missouri at Albert Pike Campground, AR Campground Page 15
Roughness Estimates Left Overbank Method 1—Modified Cowan method for floodplains (see below for computation)
Cross Section X1
X1-24X1-23
X1-22X1-21
X1-20X1-19
X1-18
X1-17
X1-16
X1-15-REW
X1-14X1-13-MCHANX1-12X1-11
X1-10-LEW
X1-9
X1-8
X1-7
X1-6X1-5X1-4-RDWYX1-3
X1-2
X1-1
60.0
65.0
70.0
75.0
80.0
85.0
90.0
95.0
100.0
105.0
110.0
0.0 50.0 100.0 150.0 200.0 250.0 300.0 350.0
Station
Ele
vati
on
n=0.038 n=0.053

Summary
Method 2
computati
Decision wabove two
y—Little Miss
---Petry and B
ion)
was made to o quantitative
souri at Albe
Bosmajian (1
use 0.038 fore estimates, pi
rt Pike Camp
975) 0nn
r the left overbictures from A
pground, AR C
*
21
gAL
AC
bank based onArcement and
Campground
2
0
49.1R
n
Ai
n reviewing td Schneider,
34
R (see below
the sensitivityand the fact t
Pa
w for
y analysis, thethat a velocity
age 16
e y in
Summary
the left ov
stagnation
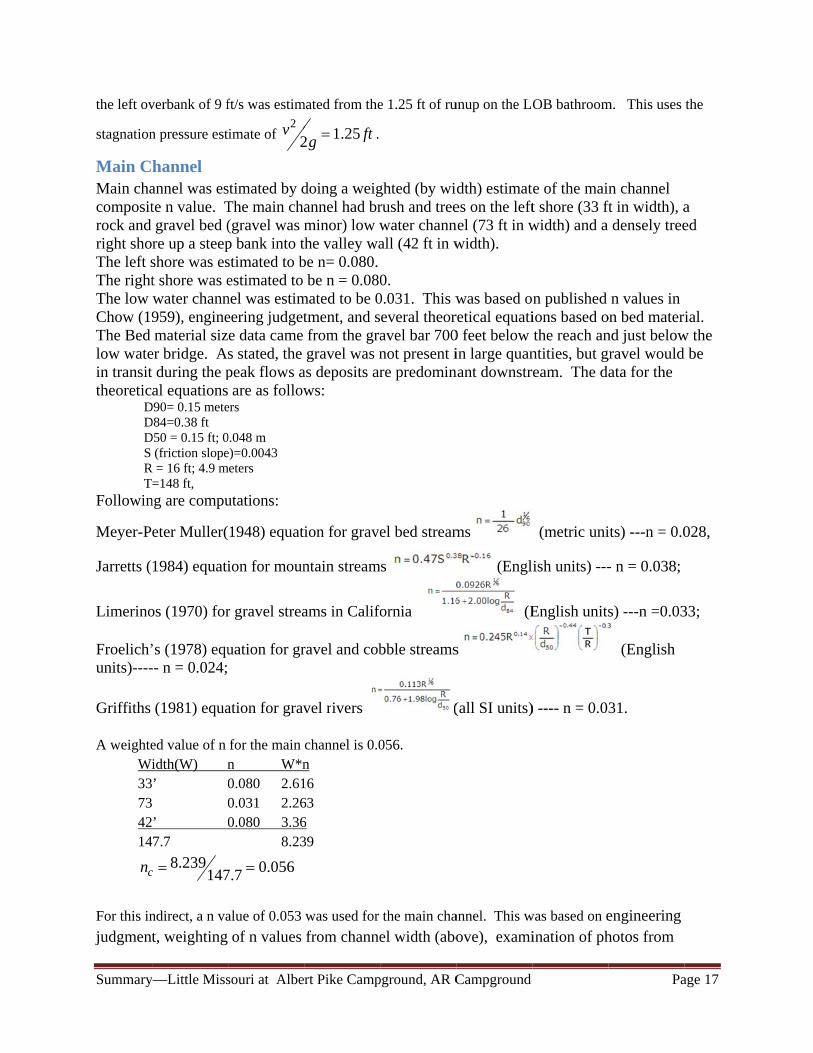
Main CMain chacompositrock and right shoThe left sThe rightThe low Chow (19The Bed low watein transittheoretic
DDDS RT
Followin
Meyer-P
Jarretts (
Limerino
Froelich’units)----
Griffiths A weighte
Wi33734214
cn
For this in
judgment
y—Little Miss
verbank of 9 f
n pressure est
hannel annel was este n value. Tgravel bed (re up a steepshore was est shore was ewater chann959), enginematerial siz
er bridge. A during the pal equations
D90= 0.15 meteD84=0.38 ft D50 = 0.15 ft; 0
(friction slopeR = 16 ft; 4.9 m
=148 ft, ng are compu
eter Muller(
1984) equati
os (1970) for
’s (1978) equ-- n = 0.024;
(1981) equa
ed value of n idth(W) n’ 0 0’ 07.7
147239.8c
ndirect, a n va
t, weighting
souri at Albe
ft/s was estim
imate of v 22
stimated by dThe main cha(gravel was mp bank into tstimated to bestimated to nel was estimeering judgete data came s stated, the peak flows a are as follow
ers
0.048 m e)=0.0043
meters
utations:
1948) equat
ion for moun
r gravel strea
uation for gr
ation for grav
for the main n W*n0.080 2.610.031 2.260.080 3.36
8.23
056.07.7
alue of 0.053
of n values
rt Pike Camp
mated from the
ftg 25.12 .
doing a weigannel had brminor) low wthe valley wabe n= 0.080.
be n = 0.080mated to be 0tment, and sfrom the gragravel was n
as deposits arws:
ion for grave
ntain stream
ams in Califo
ravel and cob
vel rivers
channel is 0.0n 16 63 6 39
was used for
from channe
pground, AR C
e 1.25 ft of ru
ghted (by wirush and treewater channall (42 ft in w
0. 0.031. This weveral theoravel bar 700not present ire predomin
el bed stream
ms
fornia
bble streams
(
056.
the main cha
el width (abo
Campground
unup on the L
dth) estimates on the leftnel (73 ft in wwidth).
was based oretical equati0 feet below in large quan
nant downstr
ms
(Engl
(E
s
(all SI units)
annel. This w
ove), exami
OB bathroom
te of the maint shore (33 ftwidth) and a
n published ions based othe reach an
ntities, but gream. The da
(metric uni
ish units) ---
English units
) ---- n = 0.0
was based on eination of ph
Pa
m. This uses
n channel ft in width), a
densely tree
n values in on bed maternd just belowgravel wouldata for the
its) ---n = 0.0
- n = 0.038;
s) ---n =0.03
(English
31.
engineering hotos from
age 17
the
a ed
ial. w the d be
028,
33;
Summary—Little Missouri at Albert Pike Campground, AR Campground Page 18
Barnes (1967, http://pubs.usgs.gov/wsp/wsp_1849/pdf/wsp_1849.pdf), and review of the sensitivity analysis data.
Summary—Little Missouri at Albert Pike Campground, AR Campground Page 19
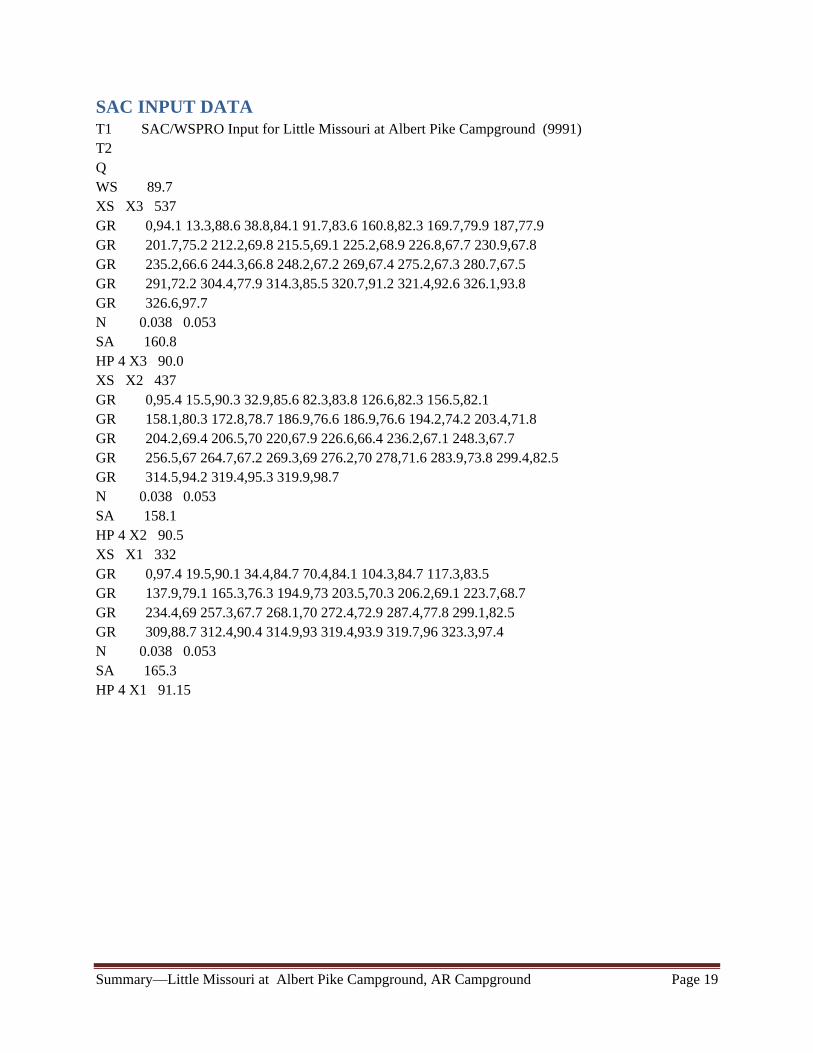
SAC INPUT DATA T1 SAC/WSPRO Input for Little Missouri at Albert Pike Campground (9991) T2 Q WS 89.7 XS X3 537 GR 0,94.1 13.3,88.6 38.8,84.1 91.7,83.6 160.8,82.3 169.7,79.9 187,77.9 GR 201.7,75.2 212.2,69.8 215.5,69.1 225.2,68.9 226.8,67.7 230.9,67.8 GR 235.2,66.6 244.3,66.8 248.2,67.2 269,67.4 275.2,67.3 280.7,67.5 GR 291,72.2 304.4,77.9 314.3,85.5 320.7,91.2 321.4,92.6 326.1,93.8 GR 326.6,97.7 N 0.038 0.053 SA 160.8 HP 4 X3 90.0 XS X2 437 GR 0,95.4 15.5,90.3 32.9,85.6 82.3,83.8 126.6,82.3 156.5,82.1 GR 158.1,80.3 172.8,78.7 186.9,76.6 186.9,76.6 194.2,74.2 203.4,71.8 GR 204.2,69.4 206.5,70 220,67.9 226.6,66.4 236.2,67.1 248.3,67.7 GR 256.5,67 264.7,67.2 269.3,69 276.2,70 278,71.6 283.9,73.8 299.4,82.5 GR 314.5,94.2 319.4,95.3 319.9,98.7 N 0.038 0.053 SA 158.1 HP 4 X2 90.5 XS X1 332 GR 0,97.4 19.5,90.1 34.4,84.7 70.4,84.1 104.3,84.7 117.3,83.5 GR 137.9,79.1 165.3,76.3 194.9,73 203.5,70.3 206.2,69.1 223.7,68.7 GR 234.4,69 257.3,67.7 268.1,70 272.4,72.9 287.4,77.8 299.1,82.5 GR 309,88.7 312.4,90.4 314.9,93 319.4,93.9 319.7,96 323.3,97.4 N 0.038 0.053 SA 165.3 HP 4 X1 91.15

Summary—Little Missouri at Albert Pike Campground, AR Campground Page 20
SAC OUTPUT DISCHARGE COMPUTATIONS Reach dH,fall length Discharge Spread HF CX RC RX ER (ft) (ft) (cfs) (%) (ft) X1 - X2 0.65 105. 38124. 0 0.378 1.000 0.720 0.000 # X2 - X3 0.50 100. 43163. 3 0.518 0.982 0.000 -0.070 # X1 - X3 1.15 205. 40088. 1 0.865 0.993 0.348 -0.036 # Definitions: Spread, the percent difference between discharge computed with no expansion loss (k=0) and discharge computed with full expansion loss (k=1.0), divided by the discharge computed with full expansion loss HF, friction head- HF = sum of Q*Q*L/(K1*K2) over subreaches; Q, discharge; L, reach length; K1, upstream section conveyance; K2, downstream section conveyance CX, the computed discharge divided by the discharge computed with no expansion loss (k=0) RC, velocity head change in contracting section divided by friction head RX, velocity head change in expanding section divided by friction head ER, warnings, *-fall <' 0.5ft, @-conveyance ratio exceeded, #-reach too short error, 1-negative or 0 fall ******, terms that can not be computed because' of strong expansion in reach CROSS SECTION PROPERTIES -------------------------------------------------------------------------------- I.D. X3 Velocity head 2.02ft Discharge 40088.cfs Ref.distance 537.ft Q/K 0.0045 Alpha 1.048 Sub Water Top Wetted Hydraulic Conveyance area surface n Area width perimeter radius x 0.001 Vel. F no. el.(ft) (sq.ft) (ft) (ft) (ft) (cfs) % (fps) 1 90.00 0.038 907.9 150.9 151.6 5.99 117.422 20. 8.7 0.62 2 90.00 0.053 2688.2 158.6 167.7 16.03 480.499 80. 12.0 0.51 Total 90.00 --- 3596. 309. 319. 11.26 597.921 100. 11.1 0.58 -------------------------------------------------------------------------------- I.D. X2 Velocity head 2.05ft Discharge 40088.cfs Ref.distance 437.ft Q/K 0.0044 Alpha 1.041 Sub Water Top Wetted Hydraulic Conveyance area surface n Area width perimeter radius x 0.001 Vel. F no. el.(ft) (sq.ft) (ft) (ft) (ft) (cfs) % (fps) 1 90.50 0.038 924.0 143.2 144.7 6.38 124.693 21. 9.0 0.62 2 90.50 0.053 2633.3 151.6 161.2 16.34 476.612 79. 12.1 0.51 Total 90.50 --- 3557. 295. 306. 11.63 601.305 100. 11.3 0.57 -------------------------------------------------------------------------------- I.D. X1 Velocity head 1.75ft Discharge 40088.cfs Ref.distance 332.ft Q/K 0.0036 Alpha 1.018

Summary—Little Missouri at Albert Pike Campground, AR Campground Page 21
Sub Water Top Wetted Hydraulic Conveyance area surface n Area width perimeter radius x 0.001 Vel. F no. el.(ft) (sq.ft) (ft) (ft) (ft) (cfs) % (fps) 1 91.15 0.038 1192.3 148.6 150.4 7.93 185.849 28. 9.3 0.58 2 91.15 0.053 2616.0 147.8 154.0 16.98 485.917 72. 11.1 0.46 Total 91.15 --- 3808. 296. 304. 12.51 671.765 100. 10.5 0.52 -------------------------------------------------------------------------------- Definitions: n, Manning's coefficient of roughness Q/K = discharge/conveyance F, Froude number F = Ki*Q/(K*A sqrt(g*(Ai/TWi)); Q, discharge; A, total cross- section area; g, acceleration of gravity; Ai, sub-section area; TWi, sub- section top width