Embed Size (px)
Citation preview
Indirect Effects of NitrogenAmendments on Organic Substrate
Quality Increase Enzymatic ActivityDriving Decomposition in a Mesic
Grassland
Lisa K. Tiemann1* and Sharon A. Billings2
1Ecology and Evolutionary Biology, University of Kansas, 2101 Constant Ave, Higuchi Hall, Lawrence, Kansas 66047, USA;2University of Kansas and Kansas Biological Survey, 2101 Constant Ave, Higuchi Hall, Lawrence, Kansas 66047, USA
ABSTRACT
The fate of soil organic carbon (SOC) is determined,
in part, by complex interactions between the
quality of plant litter inputs, nutrient availability,
and the microbial communities that control
decomposition rates. This study explores these
interactions in a mesic grassland where C and
nitrogen (N) availability and plant litter quality
have been manipulated using both fertilization and
haying for 7 years. We measured a suite of soil
parameters including inorganic N, extractable
organic C and N (EOC and EON), soil moisture,
extracellular enzyme activity (EEA), and the iso-
topic composition of C and N in the microbial
biomass and substrate sources. We use these data to
determine how the activity of microbial decompos-
ers was influenced by varying levels of substrate C
and N quality and quantity and to explore potential
mechanisms explaining the fate of enhanced plant
biomass inputs with fertilization. Oxidative EEA
targeting relatively recalcitrant C pools was not
affected by fertilization. EEA linked to the break-
down of relatively labile C rich substrates exhibited
no relationship with inorganic N availability but
was significantly greater with fertilization and
associated increases in substrate quality. These
increases in EEA were not related to an increase in
microbial biomass C. The ratio of hydrolytic C:N
acquisition enzymes and d13C and d15N values of
microbial biomass relative to bulk soil C and N, or
EOC and EON suggest that microbial communities
in fertilized plots were relatively C limited, a fea-
ture likely driving enhanced microbial efforts to
acquire C from labile sources. These data suggest
that in mesic grasslands, enhancements in biomass
inputs and quality with fertilization can prompt an
increase in EEA within the mineral soil profile with
no significant increases in microbial biomass. Our
work helps elucidate the microbially mediated
fate of enhanced biomass inputs that are greater
in magnitude than the associated increases in
mineral soil organic matter.
Key words: grassland; soil organic carbon; extra-
cellular enzyme; microbial biomass d13C and d15N;
microbial substrate quality; decomposition; Organic
matter quality.
Received 29 July 2010; accepted 22 November 2010;
published online 22 December 2010
Author Contributions: This project was undertaken as part of a PhD
dissertation by L. K. Tiemann, who performed all aspects of data collec-
tion and analysis. Both authors contributed to study design, conceptu-
alization, and writing.
*Corresponding author; e-mail: [email protected]
Ecosystems (2011) 14: 234–247DOI: 10.1007/s10021-010-9406-6
� 2010 Springer Science+Business Media, LLC
234
INTRODUCTION
The link between rising atmospheric CO2 concen-
trations and global climate change makes it
increasingly important that we determine the fate
of organic carbon (C) in terrestrial ecosystems. Soils
contain the largest near-surface reservoir of ter-
restrial C, and the factors controlling the release
and storage of this C are tightly linked with nitro-
gen (N) availability (Conant and others 2005; Neff
and others 2002; Asner and others 1997). For
example, N additions influence microbially medi-
ated processes such as decomposition that govern
the fate of C inputs to soil profiles (Knorr and
others 2005; Waldrop and others 2004; Hobbie
2000). Nitrogen availability may influence decom-
position rates through the direct influence of
inorganic N availability on microbial function, or
indirectly through changes in the quality of organic
substrates (Hobbie 2005).
Microbial resource availability can influence
organic matter in multiple ways. For example,
experiments that explore land management prac-
tices in North American grasslands, like fertilization
and haying, have shown that the resulting altera-
tions in nutrient and substrate availability can have
a significant influence on mineral SOC pool sizes
and dynamics. Such studies are important, because
grasslands contain approximately 12% of Earth’s
SOC pool (Schlesinger 1997). Nitrogen addition in
grasslands can increase SOC concentrations (Malhi
and others 1997; Conant and others 2001; Billings
and others 2006), but the stability of this additional
SOC and the extent to which it is incorporated into
long-lived soil organic matter (SOM) pools varies
greatly. In one study of a mesic grassland system
undergoing N additions for 5 years, SOC concen-
trations increased significantly, but this additional
SOC resided primarily in the most labile SOM
fraction (Billings and others 2006). Another study
of the same duration reported increased organic
matter content in stabilized fractions with N addi-
tion, but only when coupled with plant litter with
high lignin content (Dijkstra et al. 2004). Resource
removal from grassland soils can also influence soil
C and N cycles; in mesic grassland systems,
aboveground biomass removal through haying can
decrease both SOC and soil N content (Franzlueb-
bers and Stuedemann 2005).
Grassland studies exploring the effects of N
addition on SOM decomposition by measuring soil
extracellular enzyme activity (EEA) report con-
trasting results. One study of N addition in a semi-
arid grassland revealed a correlation between
inorganic N availability and increases in multiple
EEAs associated with C acquisition (Stursova and
others 2006), whereas a study of three different
grasslands, widely variable in edaphic properties,
concluded with the observation that EEA in grass-
land soils may be ‘‘insensitive to N amendment’’
(Zeglin and Stursova 2007). It thus remains unclear
how the importance of inorganic N availability
relative to organic substrate quality and, important
for grasslands experiencing haying, quantity drives
microbial C versus N limitation and rates of SOC
decomposition.
We explored drivers of SOC cycling in a rela-
tively mesic grassland in eastern Kansas, USA that
has experienced manipulations of N and C avail-
ability through fertilization and haying over mul-
tiple years (Billings and others 2006; Billings and
Gaydess 2008; Tiemann and Billings 2008; Foster
and others 2009). At this site, fertilization has
resulted in significant increases in labile SOC
stocks, though the magnitude of these increases is
less than the increases in plant biomass inputs
(litterfall and root) with fertilization (Billings and
others 2006). We use this site to explore this
discrepancy by studying how SOM decomposition
rates relate to changes in both the quantity and
quality of C and N substrates available to soil
microbial communities. Understanding drivers of
SOC dynamics, and ultimately SOC retention or
release as CO2, is particularly critical in mesic
grasslands, given their relatively high concentra-
tions of SOC compared to more xeric systems
(McCulley and others 2005). To determine how
heterotrophic soil microbial activity at this site
may change with nitrogen addition or plant bio-
mass removal via haying, we measured EEA
associated with the decomposition of labile and
recalcitrant pools of SOM multiple times during a
growing season. We also measured isotopic com-
position (d13C and d15N) of the litter, the bulk soil,
extractable organic C and N (EOC and EON), and
the microbial biomass at the end of the growing
season as a means of further assessing microbial
substrate use. We measured these indices of
microbial activity in conjunction with microbial
biomass C and N, inorganic N and EOC. We use
these data to assess patterns of microbial resource
use with long-term alterations in C and N sub-
strate form and availability.
MATERIALS AND METHODS
Study Site
Our study site is located at the University of Kansas
Field Station in northeastern Kansas, USA (KUFS;
Indirect Effects of Nitrogen Amendments 235
39�03¢ N, 95�12¢ W). Average annual rainfall is
971 mm and the average annual temperature is
13.5�C (High Plains Regional Climate Center,
http://hprcc1.unl.edu/cgi-bin/cli_perl_lib/cliMAIN.
pl?ks4559). During the course of this study, the site
received 549 mm rainfall, whereas average air
temperature was 19.6 and average soil temperature
was 19.8�C. The experimental grassland plots were
managed as a hayfield until 1984. In 2000, 32
experimental plots (10 9 10 m2) were established
(Billings and others 2006; Tiemann and Billings
2008; Foster and others 2009). There are 8 plots of
each of 4 treatments, fertilized (F), fertilized and
hayed (FH), hayed (H), and untreated early suc-
cession grassland (E). A ‘‘N–P–K’’ fertilizer mix
(N:P:K; 29:3:4) commonly used in the region was
applied to the F and FH plots in early April of each
year from 2000 to 2006 and on April 17, 2007, at a
rate of approximately 15 g inorganic N m-2 with a
d15N of -0.2 ± 0.1& (Billings and others 2006).
Haying was performed from 2000 to 2006 in July or
early August, but not at all in 2007 due to unusu-
ally hot and dry conditions. Haying removed all
plant biomass from just above ground level; total
aboveground biomass removed from the hayed
plots annually was approximately 550 kg km-2
(Foster and others 2009). The dominant grassland
plant species include the perennial grasses Bromus
inermis, Poa pratensis, and Festuca arundinacea, and
native grasses Andropogon virginicus and Andropogon
gerardi (Foster and Dickson 2004). Soils are fine,
smectitic, mesic Argiudolls formed from glacial
deposits of loess over till, and are naturally fertile
with high water holding capacity (NRCS, USDA,
http://websoilsurvey.nrcs.usda.gov/). Fertilization
over the first 6 years at this site resulted in signif-
icantly higher bulk SOC and organic N concentra-
tions in the top 15 cm of the soil profile and higher
plant biomass (litterfall and root) inputs compared
to control plots with no significant effects of haying
observed (Billings and others 2006).
Measurements Over the Growing Season
At five time points, approximately 6 weeks apart
during the 2007 growing season (April 4, May 16,
July 2, August 14, and September 24, 2007), we
collected six soil cores (5 cm deep, 2 cm diameter)
from each of the 32 plots. Soils were placed in a
cooler and returned to the University of Kansas
where they were stored at 4�C until processed.
Roots larger than 1 mm were removed and the soils
from each plot homogenized. Approximately 5 g of
soil from each plot were weighed and dried at 60�Cfor more than 48 h to determine gravimetric soil
moisture. We froze a 10 g sub-sample of soil from
each plot at -65�C for determination of EEA,
inorganic N, DOC, and microbial biomass C and N
(Lee and others 2007).
Inorganic N
We extracted inorganic N from 2.5 g frozen soil
from each plot with 12.5 ml 0.5 M K2SO4. Con-
centration of NH4+–N in these extracts was deter-
mined colorimetrically using a diffusion block
(Doyle and others 2004) and NO3-–N concentra-
tions were determined using cadmium reduction
on a Lachat Quik-Chem 8000 FIA (Lachat Instru-
ments, Milwaukee, WI).
Soil and Litter C and N Analyses
Soils for C and N and isotopic analyses were col-
lected on October 17, 2007 and processed in the
same manner as presented above, except that all
visible roots were picked and then 5 g samples
were dried and ground to a fine powder. Litter was
collected on September 26 and 29, 2007 as part of a
total standing biomass collection. In each plot total
aboveground biomass was removed in two 2 m2
strips using clippers and then sorted into litter and
living components. Samples of litter from each of
the two strips per plot were homogenized into one
sample per plot, then ground on a Wiley mill fitted
with a 1 mm mesh screen. Litter cellulose and lig-
nin concentrations were determined by acid
detergent digestion in an Ankom fiber analyzer and
sulfuric acid digestion respectively per manufac-
turer instructions (ANKOM Technology, Macedon,
New York, USA). Soil samples and litter were
analyzed for [C], [N], d13C, and d15N on a Ther-
moFinnigan MAT 253 Continuous Flow System
interfaced with a Costech 4010 elemental analyzer
EA at the University of Kansas Keck Paleoenvi-
ronmental and Environmental Stable Isotope Lab-
oratory (KPESIL). Precision for this instrument is
better than ±0.42& for d15N, and better than
±0.22& for d13C.
Microbial Biomass and Soil EOC andEON
We determined microbial biomass C and N (MBC
and MBN) using fumigation-extraction (Brookes
and others 1985; Doyle and others 2004). We
exposed 2.5 g of soil from each plot to chloroform
for 24 h. After venting, these soils were extracted
with 12.5 ml of 0.5 M K2SO4 and filtered through
20–25 lm pore size filter paper (Whatman #4) to
capture all EOC and EON that is readily available
236 L. K. Tiemann and S. A. Billings
for breakdown by EEA. Fumigated and un-fumi-
gated extracts were subjected to persulfate diges-
tion (Doyle and others 2004). We used a NaOH
concentration of 0.5 M to increase the final digest
pH to ensure retention of dissolved inorganic C in
solution until analysis. The concentration of dis-
solved inorganic C in the digested extracts was
determined using a diffusion block (Doyle and
others 2004) on a Lachat auto-analyzer. Nitrate
concentrations in the extracts were determined via
cadmium reduction. Microbial biomass C and N
were calculated as EOC or total dissolved N in
fumigated soils minus EOC or total dissolved N in
un-fumigated soils, divided by an efficiency factor
of 0.45 (Jenkinson and others 2004). Glycine and
nicotinamide standards were included in each
analysis to check for digestion efficiency and
potential losses of dissolved inorganic C as CO2
from the digested extracts. We used measurements
in the un-fumigated extracts to determine soil EOC
and to calculate soil EON as total dissolved N minus
inorganic N. We corrected soil EOC and EON for
digestion efficiency when necessary using the
above standards.
Extracellular Enzyme Assays
We analyzed the activity of eight enzymes,
b-1,4-glucosidase (BG), a-1-4-glucosidase (AG),
cellobiohydrolase (CBH), b-1-4-N-acetylglucosa-
minidase (NAG), b-1-4-xylosidase (BXYL), leucine
amino peptidase (LAP), phenol oxidase and per-
oxidase. These enzymes are representative of a
wide range of substrate utilization and were
assayed for each of the five sampling dates.
Throughout this study, we consider polymeric
substrates such as cellulose, hemicellulose, starch,
chitin, and peptides as relatively labile, and lignin
and humic substrates relatively recalcitrant due to
their amorphous arrangement, aromatic ring
structures (Sinsabaugh and others 2002; Fog 1988).
The activities of BG, AG, CBH, NAG, BXYL, PHOS,
and LAP were determined using corresponding
substrates fluorescently labeled with methylum-
belliferone (MUB) or methyl coumarin (MC) as per
Saiya-Cork and others (2002). Soils were homog-
enized with 50 mM NaAcetate buffer at pH 5.5,
which is the average pH for the four treatments.
After incubating for approximately 18 h, we added
10 ll 0.5 M NaOH to each well and then mea-
sured fluorescent values on a SpectraMax Gemini
XS Fluorescence Platereader (Molecular Devices,
Menlo Park, California, USA) with 365 nm excita-
tion and 460 nm emission filters.
Determination of peroxidase and phenol oxidase
activity was performed using 3,4-dihydroxy-L-phen-
ylalanine (L-DOPA) as the substrate in 96-well mi-
croplates (Saiya-Cork and others 2002). We added
25 mM L-DOPA to two of three columns used per soil
sample, and the third column received buffer. Col-
umnsof buffer-only andbuffer plus L-DOPA wereused
as a negative control. To measure peroxidase activity
we also added 10 ll of a 0.3% hydrogen peroxide
solution to each well. Plates were read on a Spectra-
Max 340PC 384 Absorbance Platereader (Molecular
Devices, Menlo Park, California, USA) at 460 nm.
Microbial Biomass and DissolvedOrganic d13C and d15N Analyses
To obtain the d13C and d15N values of MBC, MBN,
EOC and DON, fumigated and un-fumigated
extracts from September 24, 2007 were dried at
60�C and then ground to a fine powder using a
mortar and pestle (Dijkstra and others 2006). Dried
extracts were then weighed out into silver capsules
for analysis at KPESIL as described for soils and
litter above. Using microbial biomass C and N and
EOC and TDN measurements obtained through
colorimetric analyses as described above, we cal-
culated MBd13C and MBd15N following Dijkstra
and others (2008) as:
MBd13C ¼�EOd13Cfum � EOCfum
� EOd13Cunfum � EOCunfum
�
�EOCfum � EOCunfumð Þ and
MBd15N ¼�TDd15Nfum � TDNfum
� TDd15Nunfum � TDNunfum
�
�TDNfum � TDNunfumð Þ:
Fertilizer application has significantly increased
the abundance of C3 relative to C4 species (Foster
and others 2009) and has lowered the d15N of plant
available N, so that the isotopic composition of lit-
terfall in fertilized plots exhibits significantly lower
d13C and d15N values than in unfertilized plots
(Tiemann and Billings 2008). Therefore, MB d13C
and d15N are presented relative to EOC and
bulk soil d13C, or EON and bulk soil d15N, using:
D13C-MBEOC = d13CMB - d13CEOC D13C-MBsoil =
d13CMB - d13Csoil and analogous calculations for
MB d15N.
Statistical Analyses
To determine the effects of treatment, date, and
their interaction on EEA, microbial biomass C and
N, inorganic N, EOC, and EON, we performed
Indirect Effects of Nitrogen Amendments 237
repeated measures ANOVA using PROC MIXED in
SAS (SAS v8.2, SAS Institute, Cary, North Carolina,
USA). Covariance structure was modeled using the
spatial powers law. We generated least-squares
means tables for all pairwise comparisons with
Tukey-Kramer adjusted P values to minimize
the experimentwise error rate. Using SAS’s
PROC GLM, we performed two-way ANOVA to
determine the effects of fertilization, haying and
their interaction on D13C-MBEOC, D13C-MBsoil,
D15N-MBEON, D15N-MBsoil, soil C, soil N, soil C:N
ratio, cellulose, lignin, lignin:N ratio, litter C, litter
N, litter C:N ratios, and the d13C and d15N of bulk
soil. We again used LS means tables for pairwise
comparisons with Tukey-Kramer adjusted P values.
Correlation analyses were performed in PROC
CORR and normality tests and calculation of mea-
sures of skewness and kurtosis were performed in
PROC CAPABILITY. Results of correlation analyses
are presented as Pearson correlation coefficients.
Activities of BG, AG, CBH, and BXYL did not vary
by date so we averaged these measures across the
growing season for correlation analyses with D13C-
MB and D15N-MB or measures of litter quality, soil
C:N, litter C:N, and litter lignin:N ratios as mea-
sured at the end of the growing season (n = 32).
To separate the fertilization-induced effects of
increased inorganic N availability versus increased
litter quality and quantity on BG, AG, CBH, and
BXYL, we performed repeated measures ANCOVA
in SAS PROC MIXED with inorganic N as covariate.
Each model initially contained interaction terms
between the covariate and fixed effects. When
these interactions were non-significant we assumed
homogeneity of the regression line slopes and
re-ran the analyses without these interactions in
the model. Data were transformed when necessary
to achieve a normal distribution. Differences were
considered significant at a = 0.05 unless otherwise
noted, and all errors presented are one standard
error of the mean.
RESULTS
Measures of Substrate Quantityand Quality
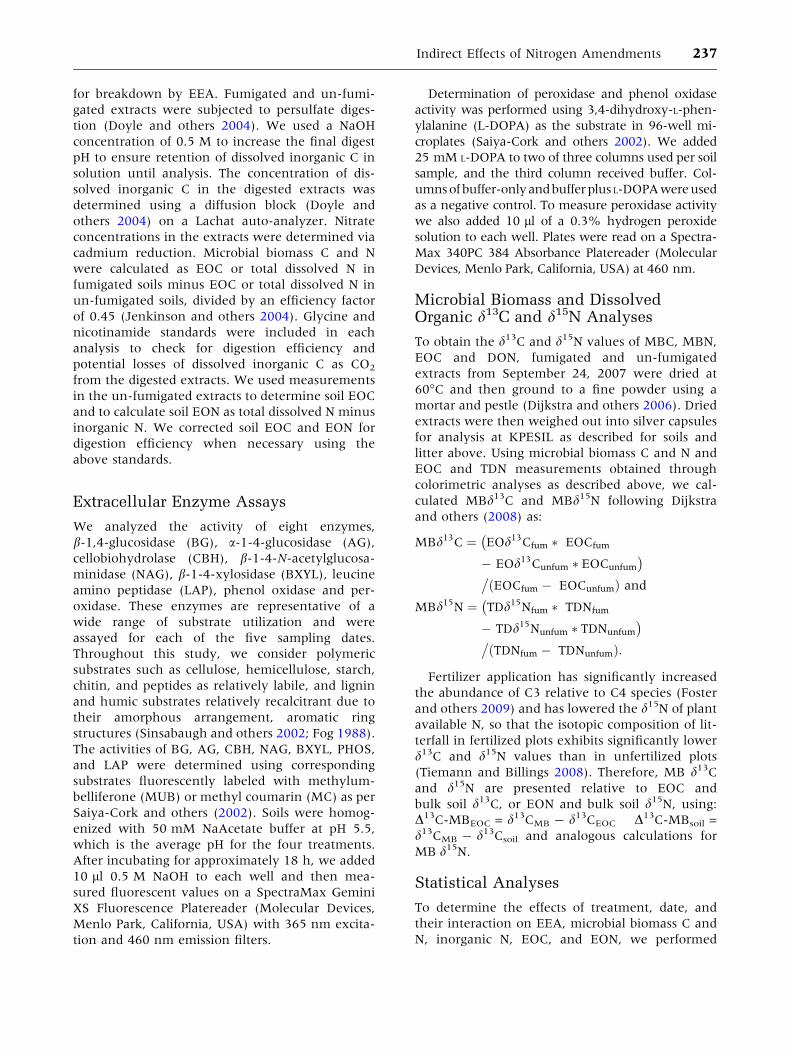
Measures of inorganic N were significantly influ-
enced by a treatment * date interaction. Inorganic
N availability in the fertilized plots ranged from 7.8
to 56.0 mg-1 N kg-1 soil, was highest in the fer-
tilized plots when first measured following fertilizer
application, and declined throughout the 2007
growing season (Figure 1A). In unfertilized plots, N
availability ranged from 6.2 to 31.9 mg N kg-1 soil.
Within the treatment * date interaction, inorganic
N was not significantly different between treat-
ments prior to spring fertilizer application. On the
first sampling date post-fertilization and on August
14 and September 24, 2007, fertilized plots had
significantly higher inorganic N than unfertilized
plots (Figure 1A). There were significant treatment
and date effects on soil EOC (Figure 1B). Fertilized
plots had significantly more EOC across the grow-
ing season than unfertilized plots (0.18 ± 0.01 vs.
0.14 ± 0.01 g C kg-1 soil, Figure 1B).
Bulk soil total C was higher in fertilized than
unfertilized plots (Table 1), and bulk soil N was also
higher in fertilized plots compared to unfertilized
plots (Table 1). Soil C:N ratios were significantly
higher in the unfertilized compared to fertilized
plots but were also affected by a significant fertil-
ization * haying interaction such that H plots had
higher soil C:N than E plots, though this effect was
small (Table 1; E—11.00 ± 0.10; H—11.38 ±
0.08). The bulk soil d13C reflects differences in plant
community composition driven by fertilization at
this site (Foster and others 2009). Soil d13C was
significantly lower in the fertilized compared to
unfertilized plots (-23.8 ± 0.1 vs. -22.8 ± 0.3&)
whereas the d15N of the bulk soil was not signifi-
cantly affected by treatment.
Plant litter quality was significantly altered with
fertilization but has not been significantly influ-
enced by haying. Litter C and N concentration was
significantly greater in the fertilized compared to
unfertilized plots; litter C:N was significantly
greater in the unfertilized plots than the fertilized
plots, as were litter lignin:N ratios (Table 1).
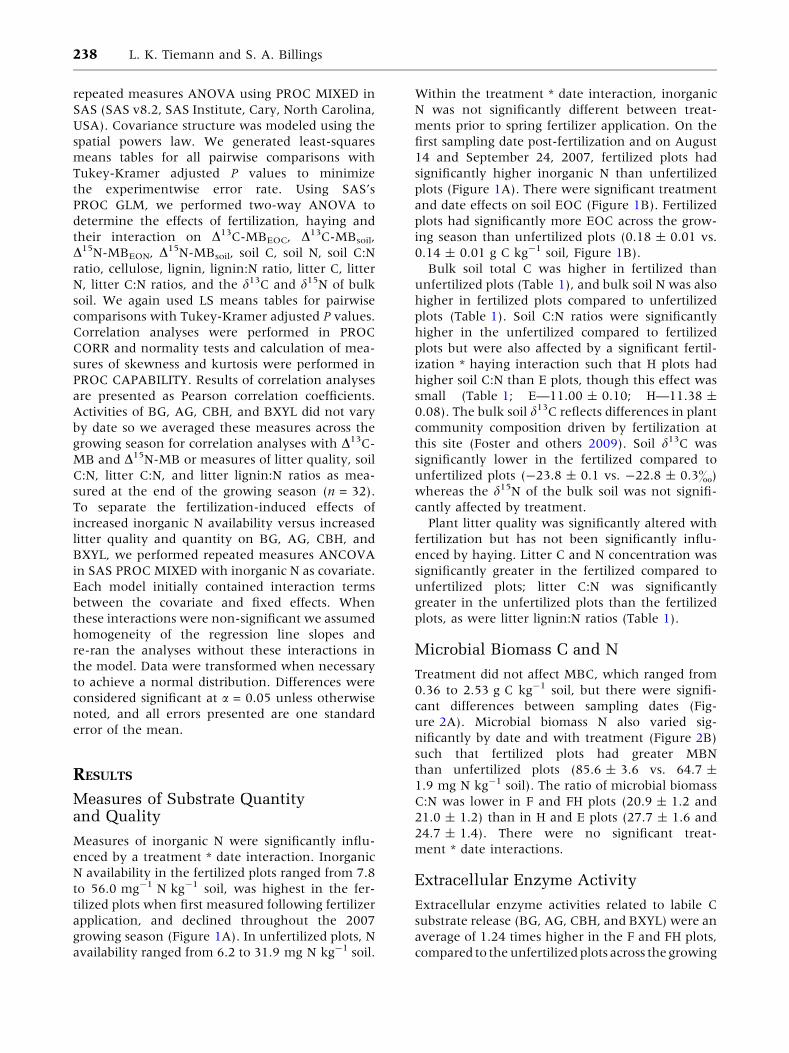
Microbial Biomass C and N
Treatment did not affect MBC, which ranged from
0.36 to 2.53 g C kg-1 soil, but there were signifi-
cant differences between sampling dates (Fig-
ure 2A). Microbial biomass N also varied sig-
nificantly by date and with treatment (Figure 2B)
such that fertilized plots had greater MBN
than unfertilized plots (85.6 ± 3.6 vs. 64.7 ±
1.9 mg N kg-1 soil). The ratio of microbial biomass
C:N was lower in F and FH plots (20.9 ± 1.2 and
21.0 ± 1.2) than in H and E plots (27.7 ± 1.6 and
24.7 ± 1.4). There were no significant treat-
ment * date interactions.
Extracellular Enzyme Activity
Extracellular enzyme activities related to labile C
substrate release (BG, AG, CBH, and BXYL) were an
average of 1.24 times higher in the F and FH plots,
compared to the unfertilized plots across the growing
238 L. K. Tiemann and S. A. Billings
season (P < 0.0001; Figure 3A–D), with no signifi-
cant differences between sampling dates. When
inorganic N availability was included as a covariate,
these same enzyme activities were still signifi-
cantly greater in fertilized compared to unfertilized
plots (BG, P < 0.0001; AG, P < 0.0001; CBH,
A
B
Figure 1. Inorganic N
(A) and extractable
organic carbon (EOC)
(B) measurements for
fertilized (F), fertilized
and hayed (FH), hayed
(H), and early succession
grassland (E) plots over
the 2007 growing season.
Inorganic N was
significantly greater in F
and FH plots on May 16,
July 2, August 14, and
September 24, 2007. EOC
was significantly greater
in F and FH compared to
H and C plots across the
entire growing season.
Error bars represent one
standard error of the
mean (n = 8).
Table 1. Soil and Litter C and N Concentrations and Isotope Values by Experimental Fertilization or HayingTreatments
Fertilized
(F and FH)
Un-fertilized
(H and E)
Hayed
(FH and H)
Non-hayed
(F and E)
Bulk soil C (g kg-1) 21.2 ± 0.05a 19.8 ± 0.04b 20.7 ± 0.4 20.2 ± 0.6
Bulk soil N (g kg-1) 2.0 ± 0.004a 1.8 ± 0.003b 1.9 ± 0.04 1.8 ± 0.04
Soil C:N 10.8 ± 0.07b 11.2 ± 0.08a 11.0 ± 0.1 10.0 ± 0.07
Bulk soil d13C (&) -23.8 ± 0.1b -22.3 ± 0.3a -22.8 ± 0.3 -23.2 ± 0.2
Bulk soil d15N (&) 3.2 ± 0.1 3.2 ± 0.1 3.1 ± 0.1 3.3 ± 0.1
d13C-DOC (&)* -24.8 ± 0.06b -23.2 ± 0.2a -23.7 ± 0.3a -24.3 ± 0.2b
d15N-TDN (&) 1.5 ± 0.2 1.8 ± 0.3 1.8 ± 0.3 1.5 ± 0.1
d13C-MBC (&)* -24.5 ± 0.08b -21.7 ± 0.3a -22.7 ± 0.5a -23.5 ± 0.3b
d15N-MBN (&)* 5.0 ± 1.6a� 1.8 ± 0.3b� 2.3 ± 0.4 4.6 ± 1.6
Litter C (g kg-1) 416.4 ± 3.1a 396.9 ± 3.4b 404.0 ± 3.8 409.3 ± 4.2
Litter N (g kg-1) 16.3 ± 0.6a 8.1 ± 0.4b 11.4 ± 1.0b 13.0 ± 1.2a
Litter C:N (g kg-1) 26.0 ± 0.9b 50.5 ± 2.3a 40.2 ± 3.7 36.3 ± 3.5
Litter Lignin:N 7.6 ± 0.3b 14.1 ± 0.5a 11.2 ± 1.0 10.5 ± 0.8
Litter d13C (&) -28.0 ± 0.1b -20.2 ± 0.9a -24.2 ± 1.1 -24.0 ± 1.2
Litter d15N (&) -1.6 ± 0.1a -3.8 ± 0.2b -2.5 ± 0.3 -2.9 ± 0.3
*Significant interaction between fertilization and haying.�P = 0.06.Lower case letters indicate significant differences between treatments.
Indirect Effects of Nitrogen Amendments 239
P < 0.0001; BXYL, P = 0.05). These activities aver-
aged across the growing season were significantly
correlated with measures of substrate quality, litter
C:N and lignin:N ratios (n = 32; Table 2). There was
an autocorrelation between inorganic N and these
EEAs so we analyzed these data by treatment and
found no significant correlations between inorganic
N and BG, AG, CBH, or BXYL for any treatment. We
calculated a ratio of C:N acquisition EEA by sum-
ming BG, AG, CBH, and BXYL activities and dividing
by the sum of LAP and NAG activity; fertilized plots
exhibited a higher ratio of C:N acquisition across all
sampling dates (2.52 ± 0.05 vs. 2.30 ± 0.04).
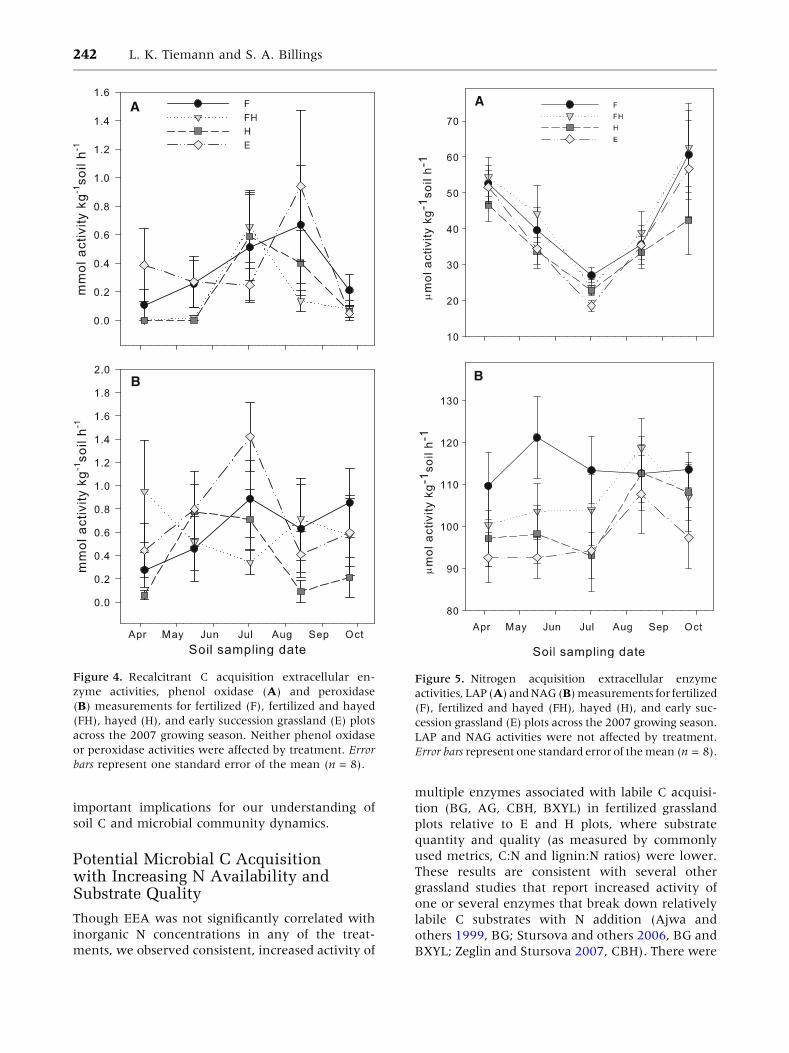
Oxidative enzyme activity, important for the
breakdown of relatively recalcitrant substrates, was
not affected by treatment but varied significantly
with date (Figure 4A, B). Phenol oxidase activity
across the growing season and across treatments was
weakly correlated with EOC (r = 0.18, P = 0.02) but
not with any other of our measures of substrate
quantity or quality, and we found no significant
correlations between peroxidase activities and
measures of substrate quantity or quality.
Activities of N acquisition enzymes, LAP and
NAG, were not significantly different between treat-
ments, but varied with sampling date (Figure 5A, B).
LAP activity was negatively correlated with EOC
(r = -0.28, P = 0.0004) whereas NAG exhibited a
weak positive correlation with inorganic N (r =
0.15, P = 0.06). LAP activity averaged across the
growing season was negatively correlated with
multiple measures of substrate quality, including
litter lignin:N (r = -0.53, P = 0.002) and soil C:N
(r = -0.44, P = 0.01), and weakly correlated with
litter C:N (r = -0.32, P = 0.07). There were no sig-
nificant correlations between NAG and measures of
substrate quality.
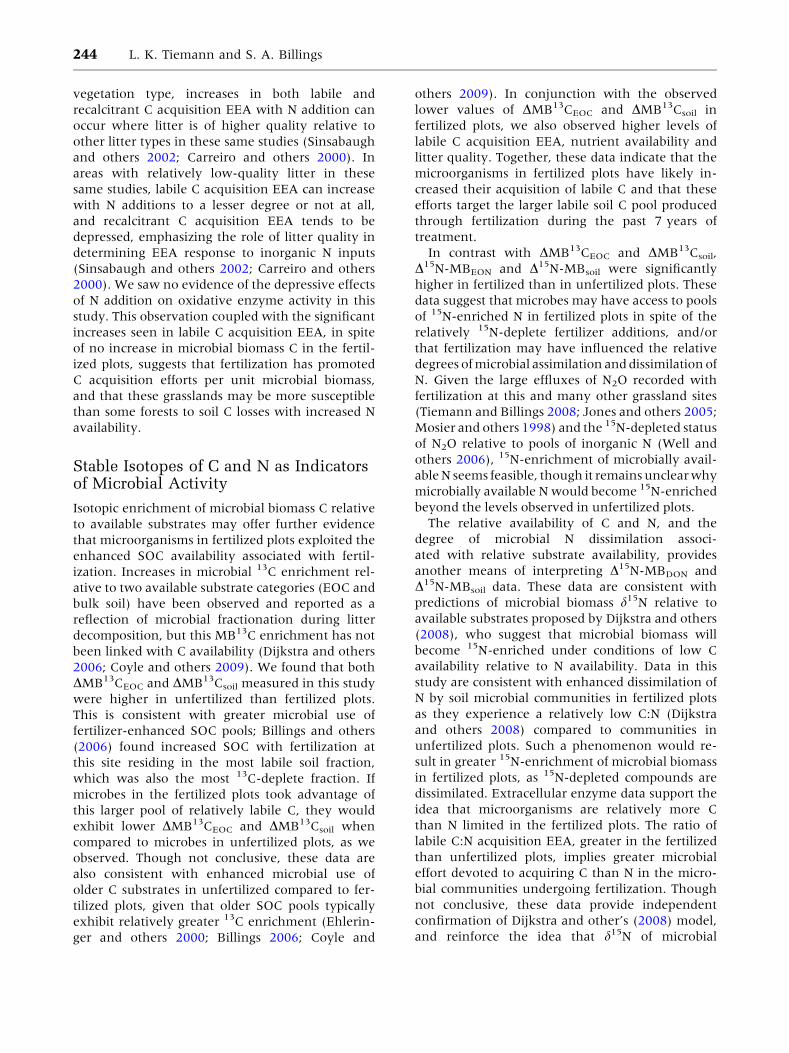
DMB13C and DMB15N
There were significant effects of fertilization on the
magnitude of the difference between d13C and
d15N of multiple substrates and microbial biomass
(Figure 6). D13C-MBEOC and D13C-MBsoil were
lower in fertilized (0.3 ± 0.1 and -0.7 ± 0.1&)
compared to unfertilized (1.5 ± 0.2 and 0.6 ±
0.2&) plots. Both D13C-MBEOC and D13C-MBsoil
were significantly and negatively correlated with
inorganic N, EOC, BG, AG, CBH, and LAP and
positively correlated with litter lignin:N ratios
(Table 3). D15N-MBEON and the D15N-MBsoil
exhibited patterns that generally contrasted
A
B
Figure 2. Microbial
biomass C (A) and
microbial biomass N
(B) for fertilized (F),
fertilized and hayed (FH),
hayed (H), and early
succession grassland (E)
plots across the 2007
growing season. Microbial
biomass C was not
affected by treatment.
Microbial biomass N was
significantly higher in F
and FH compared to H
and E plots across the
growing season. Error bars
represent one standard
error of the mean (n = 8).
240 L. K. Tiemann and S. A. Billings
with those of D13C-MBEOC and D13C-MBsoil.
D15N-MBEON and the D15N-MBsoil were significantly
higher in fertilized (1.7 ± 0.6 and 0.0 ± 0.5&)
compared to unfertilized plots (0.1 ± 0.5 and
-1.3 ± 0.2&), and were positively correlated with
inorganic N, EOC, BG, AG, CBH, and NAG and
negatively correlated with litter lignin:N ratios
(Table 3). There were no significant correlations
between measures of microbial biomass 13C or 15N
enrichment and oxidative EEA.
DISCUSSION
This study helps elucidate the microbially mediated
fate of enhanced plant biomass inputs with fertil-
ization in these mineral soil profiles. The data
suggest that the more indirect effects of N addi-
tion—increases in substrate quality—were more
closely associated with EEA than increases in
inorganic N availability. Though we observed
general trends of depressed EEA with haying in the
fertilized plots (F vs. FH; Figure 3), differences in
enzyme activities between hayed and non-hayed
plots were not significant. In addition, the isotopic
composition of both microbial biomass C and N
relative to the isotopic composition of EOC and
EON and bulk soil C and N was significantly
influenced by fertilization. We observed that the
level of microbial biomass 13C and 15N enrichment
relative to available substrates was significantly
related to the rates of labile C acquisition enzyme
activity. As discussed below, these results have
A B
C D
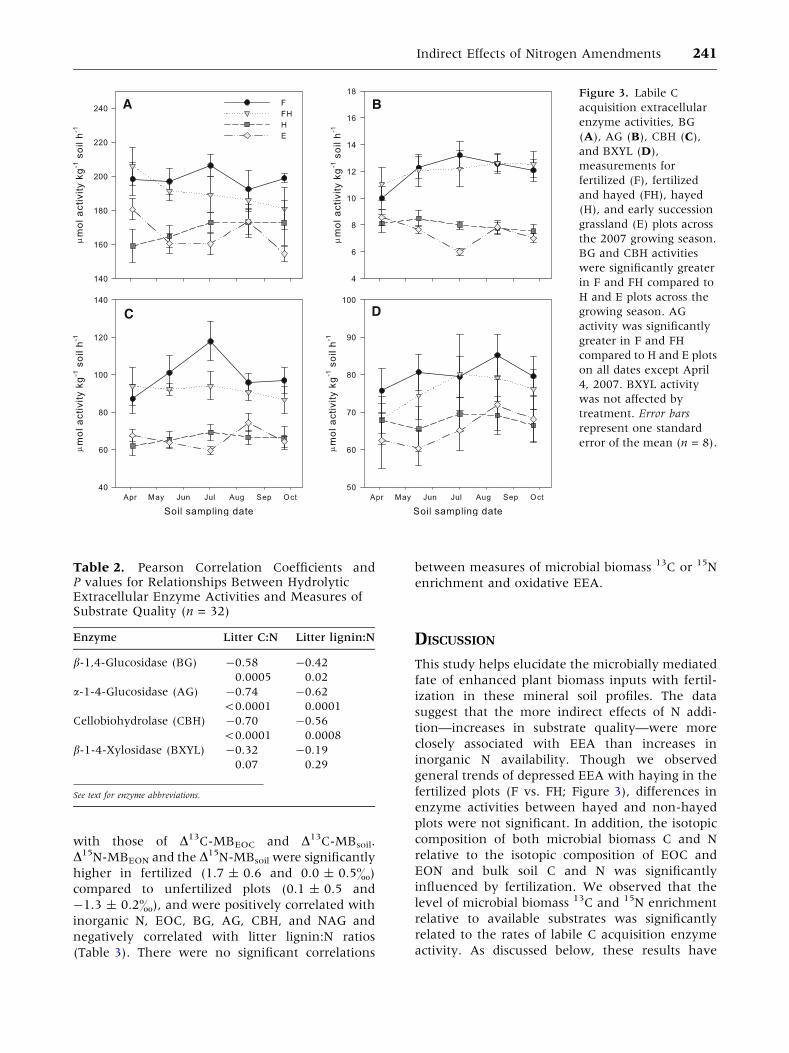
Figure 3. Labile C
acquisition extracellular
enzyme activities, BG
(A), AG (B), CBH (C),
and BXYL (D),
measurements for
fertilized (F), fertilized
and hayed (FH), hayed
(H), and early succession
grassland (E) plots across
the 2007 growing season.
BG and CBH activities
were significantly greater
in F and FH compared to
H and E plots across the
growing season. AG
activity was significantly
greater in F and FH
compared to H and E plots
on all dates except April
4, 2007. BXYL activity
was not affected by
treatment. Error bars
represent one standard
error of the mean (n = 8).
Table 2. Pearson Correlation Coefficients andP values for Relationships Between HydrolyticExtracellular Enzyme Activities and Measures ofSubstrate Quality (n = 32)
Enzyme Litter C:N Litter lignin:N
b-1,4-Glucosidase (BG) -0.58 -0.42
0.0005 0.02
a-1-4-Glucosidase (AG) -0.74 -0.62
<0.0001 0.0001
Cellobiohydrolase (CBH) -0.70 -0.56
<0.0001 0.0008
b-1-4-Xylosidase (BXYL) -0.32 -0.19
0.07 0.29
See text for enzyme abbreviations.
Indirect Effects of Nitrogen Amendments 241
important implications for our understanding of
soil C and microbial community dynamics.
Potential Microbial C Acquisitionwith Increasing N Availability andSubstrate Quality
Though EEA was not significantly correlated with
inorganic N concentrations in any of the treat-
ments, we observed consistent, increased activity of
multiple enzymes associated with labile C acquisi-
tion (BG, AG, CBH, BXYL) in fertilized grassland
plots relative to E and H plots, where substrate
quantity and quality (as measured by commonly
used metrics, C:N and lignin:N ratios) were lower.
These results are consistent with several other
grassland studies that report increased activity of
one or several enzymes that break down relatively
labile C substrates with N addition (Ajwa and
others 1999, BG; Stursova and others 2006, BG and
BXYL; Zeglin and Stursova 2007, CBH). There were
A
B
Figure 4. Recalcitrant C acquisition extracellular en-
zyme activities, phenol oxidase (A) and peroxidase
(B) measurements for fertilized (F), fertilized and hayed
(FH), hayed (H), and early succession grassland (E) plots
across the 2007 growing season. Neither phenol oxidase
or peroxidase activities were affected by treatment. Error
bars represent one standard error of the mean (n = 8).
A
B
Figure 5. Nitrogen acquisition extracellular enzyme
activities, LAP (A) and NAG (B) measurements for fertilized
(F), fertilized and hayed (FH), hayed (H), and early suc-
cession grassland (E) plots across the 2007 growing season.
LAP and NAG activities were not affected by treatment.
Error bars represent one standard error of the mean (n = 8).
242 L. K. Tiemann and S. A. Billings
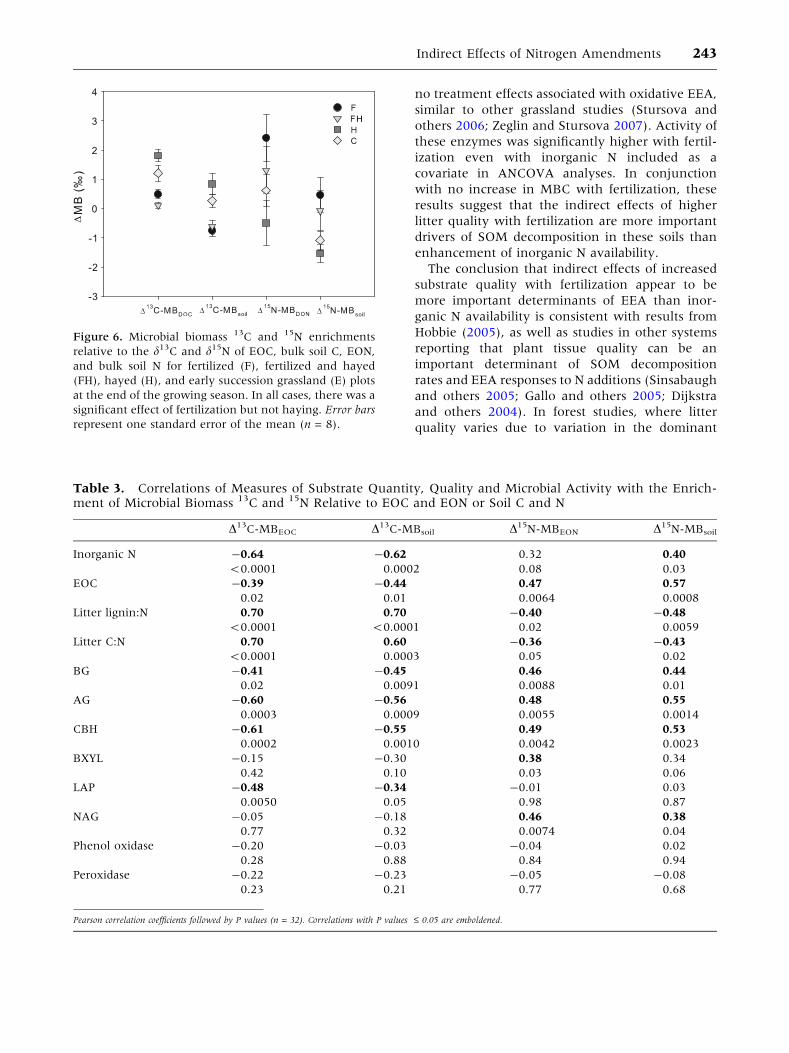
no treatment effects associated with oxidative EEA,
similar to other grassland studies (Stursova and
others 2006; Zeglin and Stursova 2007). Activity of
these enzymes was significantly higher with fertil-
ization even with inorganic N included as a
covariate in ANCOVA analyses. In conjunction
with no increase in MBC with fertilization, these
results suggest that the indirect effects of higher
litter quality with fertilization are more important
drivers of SOM decomposition in these soils than
enhancement of inorganic N availability.
The conclusion that indirect effects of increased
substrate quality with fertilization appear to be
more important determinants of EEA than inor-
ganic N availability is consistent with results from
Hobbie (2005), as well as studies in other systems
reporting that plant tissue quality can be an
important determinant of SOM decomposition
rates and EEA responses to N additions (Sinsabaugh
and others 2005; Gallo and others 2005; Dijkstra
and others 2004). In forest studies, where litter
quality varies due to variation in the dominant
Figure 6. Microbial biomass 13C and 15N enrichments
relative to the d13C and d15N of EOC, bulk soil C, EON,
and bulk soil N for fertilized (F), fertilized and hayed
(FH), hayed (H), and early succession grassland (E) plots
at the end of the growing season. In all cases, there was a
significant effect of fertilization but not haying. Error bars
represent one standard error of the mean (n = 8).
Table 3. Correlations of Measures of Substrate Quantity, Quality and Microbial Activity with the Enrich-ment of Microbial Biomass 13C and 15N Relative to EOC and EON or Soil C and N
D13C-MBEOC D13C-MBsoil D15N-MBEON D15N-MBsoil
Inorganic N -0.64 -0.62 0.32 0.40
<0.0001 0.0002 0.08 0.03
EOC -0.39 -0.44 0.47 0.57
0.02 0.01 0.0064 0.0008
Litter lignin:N 0.70 0.70 -0.40 -0.48
<0.0001 <0.0001 0.02 0.0059
Litter C:N 0.70 0.60 -0.36 -0.43
<0.0001 0.0003 0.05 0.02
BG -0.41 -0.45 0.46 0.44
0.02 0.0091 0.0088 0.01
AG -0.60 -0.56 0.48 0.55
0.0003 0.0009 0.0055 0.0014
CBH -0.61 -0.55 0.49 0.53
0.0002 0.0010 0.0042 0.0023
BXYL -0.15 -0.30 0.38 0.34
0.42 0.10 0.03 0.06
LAP -0.48 -0.34 -0.01 0.03
0.0050 0.05 0.98 0.87
NAG -0.05 -0.18 0.46 0.38
0.77 0.32 0.0074 0.04
Phenol oxidase -0.20 -0.03 -0.04 0.02
0.28 0.88 0.84 0.94
Peroxidase -0.22 -0.23 -0.05 -0.08
0.23 0.21 0.77 0.68
Pearson correlation coefficients followed by P values (n = 32). Correlations with P values £ 0.05 are emboldened.
Indirect Effects of Nitrogen Amendments 243
vegetation type, increases in both labile and
recalcitrant C acquisition EEA with N addition can
occur where litter is of higher quality relative to
other litter types in these same studies (Sinsabaugh
and others 2002; Carreiro and others 2000). In
areas with relatively low-quality litter in these
same studies, labile C acquisition EEA can increase
with N additions to a lesser degree or not at all,
and recalcitrant C acquisition EEA tends to be
depressed, emphasizing the role of litter quality in
determining EEA response to inorganic N inputs
(Sinsabaugh and others 2002; Carreiro and others
2000). We saw no evidence of the depressive effects
of N addition on oxidative enzyme activity in this
study. This observation coupled with the significant
increases seen in labile C acquisition EEA, in spite
of no increase in microbial biomass C in the fertil-
ized plots, suggests that fertilization has promoted
C acquisition efforts per unit microbial biomass,
and that these grasslands may be more susceptible
than some forests to soil C losses with increased N
availability.
Stable Isotopes of C and N as Indicatorsof Microbial Activity
Isotopic enrichment of microbial biomass C relative
to available substrates may offer further evidence
that microorganisms in fertilized plots exploited the
enhanced SOC availability associated with fertil-
ization. Increases in microbial 13C enrichment rel-
ative to two available substrate categories (EOC and
bulk soil) have been observed and reported as a
reflection of microbial fractionation during litter
decomposition, but this MB13C enrichment has not
been linked with C availability (Dijkstra and others
2006; Coyle and others 2009). We found that both
DMB13CEOC and DMB13Csoil measured in this study
were higher in unfertilized than fertilized plots.
This is consistent with greater microbial use of
fertilizer-enhanced SOC pools; Billings and others
(2006) found increased SOC with fertilization at
this site residing in the most labile soil fraction,
which was also the most 13C-deplete fraction. If
microbes in the fertilized plots took advantage of
this larger pool of relatively labile C, they would
exhibit lower DMB13CEOC and DMB13Csoil when
compared to microbes in unfertilized plots, as we
observed. Though not conclusive, these data are
also consistent with enhanced microbial use of
older C substrates in unfertilized compared to fer-
tilized plots, given that older SOC pools typically
exhibit relatively greater 13C enrichment (Ehlerin-
ger and others 2000; Billings 2006; Coyle and
others 2009). In conjunction with the observed
lower values of DMB13CEOC and DMB13Csoil in
fertilized plots, we also observed higher levels of
labile C acquisition EEA, nutrient availability and
litter quality. Together, these data indicate that the
microorganisms in fertilized plots have likely in-
creased their acquisition of labile C and that these
efforts target the larger labile soil C pool produced
through fertilization during the past 7 years of
treatment.
In contrast with DMB13CEOC and DMB13Csoil,
D15N-MBEON and D15N-MBsoil were significantly
higher in fertilized than in unfertilized plots. These
data suggest that microbes may have access to pools
of 15N-enriched N in fertilized plots in spite of the
relatively 15N-deplete fertilizer additions, and/or
that fertilization may have influenced the relative
degrees of microbial assimilation and dissimilation of
N. Given the large effluxes of N2O recorded with
fertilization at this and many other grassland sites
(Tiemann and Billings 2008; Jones and others 2005;
Mosier and others 1998) and the 15N-depleted status
of N2O relative to pools of inorganic N (Well and
others 2006), 15N-enrichment of microbially avail-
able N seems feasible, though it remains unclear why
microbially available N would become 15N-enriched
beyond the levels observed in unfertilized plots.
The relative availability of C and N, and the
degree of microbial N dissimilation associ-
ated with relative substrate availability, provides
another means of interpreting D15N-MBDON and
D15N-MBsoil data. These data are consistent with
predictions of microbial biomass d15N relative to
available substrates proposed by Dijkstra and others
(2008), who suggest that microbial biomass will
become 15N-enriched under conditions of low C
availability relative to N availability. Data in this
study are consistent with enhanced dissimilation of
N by soil microbial communities in fertilized plots
as they experience a relatively low C:N (Dijkstra
and others 2008) compared to communities in
unfertilized plots. Such a phenomenon would re-
sult in greater 15N-enrichment of microbial biomass
in fertilized plots, as 15N-depleted compounds are
dissimilated. Extracellular enzyme data support the
idea that microorganisms are relatively more C
than N limited in the fertilized plots. The ratio of
labile C:N acquisition EEA, greater in the fertilized
than unfertilized plots, implies greater microbial
effort devoted to acquiring C than N in the micro-
bial communities undergoing fertilization. Though
not conclusive, these data provide independent
confirmation of Dijkstra and other’s (2008) model,
and reinforce the idea that d15N of microbial
244 L. K. Tiemann and S. A. Billings
biomass may serve as a valuable indicator of rela-
tive C versus N limitation of soil microbial com-
munities.
Microbial Community Dynamicsand the Fate of SOC
Substrate quantity or quality had little measurable
effect on microbial biomass C. Instead, MBC varied
by sampling date, suggesting that the size of the
microbial community across a growing season is
more closely related to environmental factors than
substrate availability or quality. Previous grassland
studies with long-term N addition treatments have
also reported temporal variability in microbial bio-
mass C, but these same studies find contrasting
effects of fertilization (Garcia and Rice 1994; Lovell
and others 1995; Bardgett and others 1999). Garcia
and Rice (1994), working in a mesic tallgrass prairie
similar to our study site, found no significant dif-
ferences in microbial biomass C between fertilized
and unfertilized soils over 2.5 years of measure-
ments, whereas Lovell and others (1995) and
Bardgett and others (1999), working in a New
Zealand grassland, found decreased microbial bio-
mass C in fertilized relative to unfertilized soils over
a year of measurements. Other studies reporting
increases in EEA associated with N addition have
also observed no change in microbial biomass with
fertilization (Sinsabaugh and others 2004; Zeglin
and Stursova 2007), similar to this study. Our data,
in conjunction with these studies, suggest that N
addition may release microorganisms from N limi-
tation for enzyme production, but may not neces-
sarily lead to evident increases in growth yields.
If soil microorganisms invest more energy in
producing enzymes that aid in the acquisition of C,
why might that additional C not be found in the
microbial biomass, as our data indicate? Carbon
use efficiency of soil microorganisms may have
decreased due to the enhanced C availability asso-
ciated with fertilization, a result reminiscent of
plant studies that find lower nutrient use efficiency
with increased nutrient availability (Vitousek 1982;
Bridgham and others 1995). However, given the
added N availability this seems counterintuitive.
Fertilization also could induce shifts in microbial
community structure towards less efficient organ-
isms. A shift in microbial community structure,
favoring organisms with high growth rates, low
growth yields, and constitutive production of
enzymes with increases in SOC availability (Fierer
and others 2007) could explain increases in EEA
without concurrent increases in microbial biomass
C. An alternative explanation is that our measure
of microbial biomass C may be unable to capture
possible increases in microbial productivity in fer-
tilized plots due to concurrent increases in micro-
bial grazing (Frey and others 2001). Though
challenging to detect using the methods employed
here, enhanced EEA with no increase in MBC is
consistent with increased flows of organic matter
through the microbial loop within the soil profile,
which likely would induce increases in rates of
microbial productivity unless C use efficiency has
been altered.
Previous work at this site reports more than a
doubling of organic matter inputs with fertilization
(Billings and others 2006; Foster and others 2009).
In contrast, mineral SOC with fertilization has 1.1
times the SOC of unfertilized plots (Table 1). We
did not quantify EEA in litter layers in these plots,
but fertilized plots’ hydrolytic C EEA rates of 1.24
times those in unfertilized soils help to explain the
fate of enhanced OM inputs at this site. We cannot
directly link measurements of EEA in laboratory
assays to C flows at the ecosystem scale, but
examination of the relative changes in mineral soil
EEA compared to alterations in OM inputs to soil
profiles can provide a greater understanding of the
fate of SOC enhancements in mesic grasslands, and
these ecosystems’ subsequent potential to retain
SOC.
Conclusions
Predicting how various forms of N influence
organic matter decomposition has been a perplex-
ing question, with conflicting answers, in ecosys-
tem science for decades (Fog 1988; Hobbie 2005).
In this mesic grassland, we observed positive rela-
tionships between increasing substrate quality and
labile C acquisition EEA, but no relationship
between substrate quality and recalcitrant C or N
acquisition EEA. EEA did not vary with inorganic N
availability for any enzyme assessed. These results
reinforce that organic matter quality—even after it
has become mineral-associated organic matter—is a
critical determinant of microbial processes govern-
ing decomposition, and highlight the indirect
effects of N additions on different groups of extra-
cellular enzymes. At this site, increases in OM in-
puts to the soil profile with fertilization exceed
increases in mineral SOC. The EEA data reported
here help depict why this is so, and raise questions
about the future of soil organic C stocks in this and
other mesic grassland regions. Are the observed
increases in EEA indicative of net C losses from
these systems over longer time frames? To date,
there is no clear link between measures of soil
Indirect Effects of Nitrogen Amendments 245
respiration and microbial biomass and measures of
increasing EEA with N addition (Sinsabaugh and
others 2005; Waldrop and others 2004) that are
comparable in breadth and depth to our knowledge
of the links between plant productivity and N
availability (Chapin and others 2002). To predict
how alterations in EEA with varied quality of
mineral SOM will influence C cycling on an eco-
system level, we need a better mechanistic under-
standing of the linkages between microbial
community composition and function, and how to
relate these measures to large-scale fluxes.
ACKNOWLEDGMENTS
Many thanks to R. Rastok, A. Reed, R. Russell,
C. Murphy, B. Johanning, G. Pittman, S. Hinman
and Dr. Bryan Foster. We also thank two anonymous
reviewers for comments that greatly improved
the manuscript. Support was provided by NSF
EPS-0553722, a contract with Kansas Technology
Enterprise Corporation, KU’s General Research
Fund allocation, and the U.S. Department of
Energy’s National Institute of Climate Change
Research (NICCR). This represents University of
Kansas Field Station publication number 905.
REFERENCES
Ajwa HA, Dell CJ, Rice CW. 1999. Changes in enzyme activities
and microbial biomass of tallgrass prairie soil as related to
burning and nitrogen fertilization. Soil Biol Biochem
31:769–77.
Asner GP, Seastedt TR, Townsend AR. 1997. The decoupling of
terrestrial carbon and nitrogen cycles. Bioscience 47:226–34.
Bardgett RD, Lovell RD, Hobbs PJ, Jarvis SC. 1999. Seasonal
changes in soil microbial communities along a fertility gradi-
ent of temperate grasslands. Soil Biol Biochem 31:1021–30.
Billings SA. 2006. Soil organic matter dynamics and land use
change at a grassland/forest ecotone. Soil Biol Biochem
38:2934–43.
Billings SA, Brewer CM, Foster BL. 2006. Incorporation of plant
residues into soil organic matter fractions with grassland
management practices in the North American Midwest. Eco-
systems 9:805–15.
Billings SA, Gaydess EA. 2008. Soil nitrogen and carbon
dynamics in a fragmented landscape experiencing forest suc-
cession. Landscape Ecol 23:581–93.
Brookes PC, Landman A, Pruden G, Jenkinson DS. 1985.
Chloroform fumigation and the release of soil nitrogen: a
rapid direct extraction method to measure microbial biomass
nitrogen in soil. Soil Biol Biochem 17:837–42.
Bridgham SD, Pastor J, McClaugherty CA, Richardson CJ. 1995.
Nutrient-use efficiency: a litterfall index, a model, and a test
along a nutrient-availability gradient in North Carolina peat-
lands. Am Nat 145:1–21.
Carreiro MM, Sinsabaugh RL, Repert DA, Parkhurst DF. 2000.
Microbial enzyme shifts explain litter decay responses to
simulated nitrogen deposition. Ecology 81:2359–65.
Chapin FS, Matson PA, Mooney HA. 2002. Principles of terres-
trial ecosystem ecology. New York (NY): Springer. p 436.
Conant RT, Paustian K, Elliott ET. 2001. Grassland management
and conversion into grassland: effects on soil carbon. Ecol
Appl 11:343–55.
Conant RT, Paustian K, Del Grosso SJ, Parton WJ. 2005. Nitro-
gen pools and fluxes in grassland soils sequestering carbon.
Nutr Cycl Agroecosyst 71:239–48.
Coyle JS, Dijkstra P, Doucett RR, Schwartz E, Hart SC, Hungate
BA. 2009. Relationships between C and N availability, sub-
strate age, and natural abundance 13C and 15N signatures of
soil microbial biomass in a semiarid climate. Soil Biol Biochem
41:1605–11.
Dijkstra FA, Hobbie SE, Knops JMH, Reich PB. 2004. Nitrogen
deposition and plant species interact to influence soil carbon
stabilization. Ecol Lett 7:1192–8.
Dijkstra FA, Ishizu A, Doucett R, Hart SC, Schwartz E, Menyailo
OV, Hungate BA. 2006. 13C and 15N natural abundance of the
soil microbial biomass. Soil Biol Biochem 38:3257–66.
Dijkstra FA, LaViolette CM, Coyle JS, Doucett RR, Schwartz E,
Hart SC, Hungate BA. 2008. 15N enrichment as an integrator
of the effects of C and N on microbial metabolism and eco-
system function. Ecol Lett 11:389–97.
Doyle A, Weintraub MN, Schimel JP. 2004. Persulfate digest and
simultaneous colorimetric analysis of carbon and nitrogen in
soil extracts. Soil Sci Soc Am 68:669–76.
Ehleringer JR, Buchmann N, Flanagan LB. 2000. Carbon isotope
ratios in belowground carbon cycle processes. Ecol Appl
10:412–22.
Fierer N, Bradford MA, Jackson RB. 2007. Towards an ecological
classification of soil bacteria. Ecology 88:1354–64.
Fog K. 1988. The effect of added nitrogen on the rate of
decomposition of organic matter. Biol Rev 63:433–62.
Foster BL, Dickson TL. 2004. Grassland diversity and produc-
tivity: the interplay of resource availability and propagule
pools. Ecology 85:1541–7.
Foster BL, Kindscher K, Houseman GR, Murphy CA. 2009.
Effects of hay management and native species sowing on
grassland community structure, biomass and restoration. Ecol
Appl 19:1884–96.
Franzluebbers AJ, Stuedemann JA. 2005. Bermudagrass man-
agement in the southern piedmont USA: VII. Soil-profile
organic carbon and total nitrogen. Soil Sci Soc Am 69:1455–62.
Frey SD, Gupta VVSR, Elliot ET, Paustian K. 2001. Protozoan
grazing affects estimates of carbon utilization efficiency of the
soil microbial community. Soil Biol Biochem 33:1759–68.
Gallo ME, Lauber CL, Cabaniss SE, Waldrop MP, Sinsabaugh
RL, Zak DR. 2005. Soil organic matter and litter chemistry
response to experimental N deposition in northern temper-
ate deciduous forest ecosystems. Glob Change Biol 11:
1514–21.
Garcia FO, Rice CW. 1994. Microbial biomass dynamics in tall-
grass prairie. Soil Sci Soc Am J 58:816–23.
Hobbie SE. 2000. Interactions between litter lignin and soil
nitrogen availability during leaf litter decomposition in a
Hawaiian montane forest. Ecosystems 3:484–94.
Hobbie SE. 2005. Contrasting effects of substrate and fertilizer
nitrogen on the early stages of litter decomposition. Ecosys-
tems 8:644–56.
High Plains Regional Climate Center (HPRCC). Historical Cli-
mate Data Summaries. http://hprcc1.unl.edu/cgi-bin/cli_-
perl_lib/cliMAIN.pl?ks4559. Accessed [11/17/2007].
246 L. K. Tiemann and S. A. Billings
Jenkinson DS, Brookes PC, Powlson DS. 2004. Measuring soil
microbial biomass. Soil Biol Biochem 36:5–7.
Jones SK, Rees RM, Skiba UM, Ball BC. 2005. Greenhouse gas
emissions from managed grassland. Global Planet Change
47:201–11.
Knorr M, Frey SD, Curtis PS. 2005. Nitrogen additions and litter
decomposition: a meta-analysis. Ecology 86:3252–7.
Lee BL, Lorenz N, Dick LK, Dick RP. 2007. Cold storage and
pretreatment incubation effects on soil microbial properties.
Soil Sci Soc Am 71:1299–305.
Lovell RD, Jarvis SC, Bardgett RD. 1995. Soil microbial biomass
and activity in long-term grassland—effects of management
changes. Soil Biol Biochem 27:969–75.
Malhi SS, Nyborg M, Harapiak JT, Heier K, Flore NA. 1997.
Increasing organic C and N under bromegrass with long-term
N fertilization. Nutr Cycl Agroecosyst 49:255–60.
McCulley RM, Burke IC, Nelson JA, Lauenroth WK, Knapp AK,
Kelly EF. 2005. Regional patterns in carbon cycling across the
Great Plains of North America. Ecosystems 8:106–21.
Mosier AR, Parton WJ, Phongpan S. 1998. Long-term large N
and immediate small N addition effects on trace gas fluxes in
the Colorado shortgrass steppe. Biol Fertil Soils 28:44–50.
Natural Resources Conservation Service (NRCS), United States
Department of Agriculture. Web Soil Survey. http://websoil-
survey.nrcs.usda.gov/. Accessed [10/23/2007].
Neff JC, Townsend AR, Gleixnerk G, Lehman SJ, Turnbull J,
Bowman WD. 2002. Variable effects of nitrogen additions on
the stability and turnover of soil carbon. Nature 419:915–17.
Saiya-Cork KR, Sinsabaugh RL, Zak DR. 2002. The effects of long
term nitrogen deposition on extracellular enzyme activity in
an Acer saccharum forest soil. Soil Biol Biochem 34:1309–15.
Schlesinger WH. 1997. Biogeochemistry: an analysis of global
change. San Diego (CA): Academic Press. p 588.
Sinsabaugh RL, Carreiro MM, Repert DA. 2002. Allocation of
extracellular enzymatic activity in relation to litter composi-
tion, N deposition, and mass loss. Biogeochemistry 60:1–24.
Sinsabaugh RL, Zak DR, Gallo M, Lauber C, Amonette R. 2004.
Nitrogen deposition and dissolved organic carbon production
in northern temperate forests. Soil Biol Biochem 36:1509–15.
Sinsabaugh RL, Gallo ME, Lauber C, Waldrop MA, Zak DR.
2005. Extracellular enzyme activities and soil organic matter
dynamics for northern hardwood forests receiving simulated
nitrogen deposition. Biogeochemistry 75:201–15.
Stursova M, Crenshaw CL, Sinsabaugh RL. 2006. Microbial
response to long-term N deposition in a semiarid grassland.
Microb Ecol 51:90–8.
Tiemann LK, Billings SA. 2008. Carbon controls on nitrous oxide
production with changes in substrate availability in a North
American grassland. Soil Sci 173:332–41.
Vitousek P. 1982. Nutrient cycling and nutrient use efficiency.
Am Nat 119:553–72.
Waldrop MP, Zak DR, Sinsabaugh RL, Gallo M, Lauber C. 2004.
Nitrogen deposition modifies soil carbon storage through
changes in microbial enzymatic activity. Ecol Appl 14:1172–7.
Well R, Kurganova I, de Gerenyu VL, Flessa H. 2006. Isotopomer
signatures of soil-emitted N2O under different moisture con-
ditions–A microcosm study with arable loess soil. Soil Biol
Biochem 38:2923–33.
Zeglin LH, Stursova M. 2007. Microbial responses to nitrogen
addition in three contrasting grassland ecosystems. Oecologia
154:349–59.
Indirect Effects of Nitrogen Amendments 247