Embed Size (px)
Citation preview
R
Indira Management Review
July 2012
Indira Group of InstitutesIndira School of Business Studies
Indira Institute of ManagementTathawade, Near Wakad Junction, New Pune-Mumbai Road,
Pune- 411 033 (INDIA)Email : [email protected] Website : www.indiraedu.com
ISSN - 0974 - 3928Vol. VI. Issue 2
Bi -annual Research and Academic Journal
Research/AcademicPapers
Karnataka Human Development
Cross Section Study of Working CapitalDemand in Auto Industry
Solow Model and India's Progress post Liberalisation
Trade Unions in Leather industryin Kolkata
Posers Knowledge Management and EHRM
Book Review Talent Management: Strategies for Success
Volatility in Pharma Stocks
Indira Group of InstitutesTathawade, Near Wakad Junction, New Pune-Mumbai Road,
Pune- 411 033 (INDIA)Telefax : 020 2293 4742 / 6673 9864
Website : www.indiraedu.com
R
Indira School of Business Studies (ISBS)Indira Institute of Management (IIMP)
Owned and Published by
EDITORIAL BOARD
Patron : Dr. Tarita ShankarChairperson,Shree Chanakya Education Society
Advisors : Prof. Chetan WakalkarGroup Director,Indira Group of Institutes
Prof. Bijoy S GuhaSenior Advisor and Head, Improvement Initiatives, Indira School of Business Studies
Dr. Renu BhargavaDirector,Indira School of Business Studies
Editor : Prof. P G VijairaghavanEditor, PublicationsIndira Group of Institutes
Indira Management Review
July 2012
R
CONTENTS
All opinions expressed in the articles are those of the authors. The editor and the Publishers bear no responsibility for the same
ISSN - 0974 - 3928 Vol. VI. Issue 2
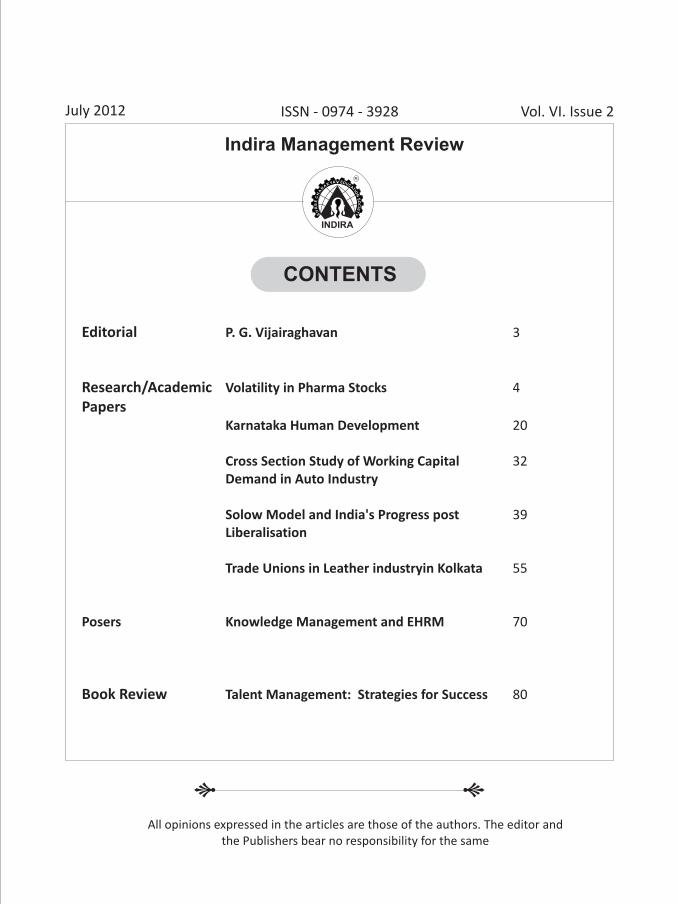
Editorial P. G. Vijairaghavan 3
Research/Academic Volatility in Pharma Stocks 4
PapersKarnataka Human Development 20
Cross Section Study of Working Capital 32Demand in Auto Industry
Solow Model and India's Progress post 39 Liberalisation
Trade Unions in Leather industryin Kolkata 55
Posers Knowledge Management and EHRM 70
Book Review Talent Management: Strategies for Success 80
R
02 Indira Management Review - July 2012
Shree Chanakya Education Society (SCES), Pune, was established in 1994, with the explicit vision to provide sustainable impetus to the corporate and entrepreneurial abilities in the youth.
The realization that a robust framework of education is indispensable for the growth of global leaders, the visionary, Ms. Tarita Wakalkar Mehendale, Chairperson, Indira Group, integrated her pursuit of excellence and articulated educational institutions, known as Indira Group of Institutes (IGI), which imbibe human excellence and demonstrate strong social values, with a single minded pursuit of developing the youth to become business leaders.
Unrelenting initiatives by the management team at Indira led to adding of multi-disciplines such as Management, Information Technology, Pharmacy, Commerce, Science, Engineering and Mass Communication to the group. And growth has been as deep as it has been wide. With 12 institutions, IGI now offers education right from Kindergarten to Doctorate level studies .
IGI believes in the economic independence of individuals. In this endeavor we aim to inspire our post graduate students to create a niche for themselves in the Indian Economic order first, and then compete globally. We owe our gratitude to the Indian Industry for consistently collaborating with us in this endeavor. Renowned industrialists have visited us and tremendously enhanced the morale of our students by sharing their vast knowledge and experience about entrepreneurial opportunities and foster a spirit of entrepreneurship amongst students.
Having traversed the journey of thirteen years we have ourselves made certain significant achievements which we are aware, are but the building blocks for achieving further heights.
?Indira is ranked amongst the top 2 B-schools in Pune, by the prestigious AIMA - IMJ.\
?The same journal gave us a top 30, all India ranking on the parameters of Industryinterface.
?Our students have shown good academic results at the level of university ranking.
?The achievements of our students have enabled them to attract some of the best corporate recruiters.
? Indira Group of Institutes and our goodwill has enabled us to establish campus agreement with Microsoft for using different software.
? Our goodwill with Microsoft was further accentuated with Microsoft conducting workshops at Indira, for train the trainer modules.
?Business India has also ranked us amongst the top 3 in Pune for last 2 yrs.
?Our Institutes have received accreditation from various certifying bodies.
?Indira Institute of Management was the first management institute in Maharashtra to receive the accreditation from the NBA, New Delhi.
?We also have our audiovisual centers supported by Harvard Business School, Stanford, Pyramid Media and Tom Peters Company and we have a vast collection of titles.
R
Indira Management Review
As public administration tries to become
more professional in delivering value in the
social sector to the citizens, it is appropriate
that periodic studies be undertaken to assess
the efficacy of such efforts, if only to identify
the areas in which the services have been able
to do justice to the expectations of the
common man and areas in which they have
lagged behind. One such study undertaken by
Drs. Gopalakrishnan and Rao, tries to analyse
the quality of public spending in Karnataka
State between 1999 and 2005 and to
determine the state of Human Development
in the State It certainly shows pointers
towards what could be done to better the
performance of the State in inching towards
achieving public expectations.
The pace of expansion of the Indian economy
post the 1991 liberalization exercise has
been a subject of considerable interest to
students of development economics. Dr
Bhattarai and Dr. Kulkarni examine this
phenomenon with special reference to the
role played by International Trade in fast
tracking India's development in the post-
1991 era and conclude that imports and
exports were a prime player in putting India
on the world map, based on empirical data
and the Solow model featuring our
international trade. Jatin Gambhir and Harjit
Singh have contended that pharma industry's
performance on the Stock Exchange may not
have an exact correlation with the market
sentiment.
Knowledge Management has come to be
associated with greater productivity and
sharing of information and knowledge assets
is recognized as prime requirement to
enhance performance at the workplace. Dr
Chandra Mohan and his colleagues try to
expose the value of KM in Human Resource
Management in a corporate environment.
This issue also features an academic paper on
participation of the leather industry workers
in Kolkata in Trade Unions. The working class
directly involved in the Leather industry
exceeds 2.5 million and indirectly it can
support upto 6 mn employees. The authors
trace the labour movement in this sector
which can give direction to the Trade Union
movement of the country. Also included is an
exercise to examine the desirability of
carrying working capital not just on the basis
of sales, but the need to examine holding costs
of such working capital balances. Shiva K
Srinivasan reviews Larry Israelite's anthology
of essays on Talent Management which
selected six Companies in disparate sectors, to
examine the strategies they adopted to
manage the available talent pool and the
results obtained therefrom and arrives at the
conclusion that customizing TM solutions is
Editorial P. G. Vijairaghavan
Indira Management Review - 03July 2012
Empirical Analysis of Volatility in Indian Pharma Stocks
AbstractLong term investors in equity markets continuously seek to invest in the undervalued stocks which have the potential of growth over the period of time. Due to the recent fall in stock prices pharma stocks have become attractive investment opportunities for investors. This study deals in identifying whether the pharma stocks have actually been better performers than the sensex stocks or whether the pharma stocks are riskier than sensex pre recession. The risk and returns were compared based on different parameters.
This study reveals that pharma stocks outperformed the sensex in terms of monthly returns while the total risk associated with pharma stocks is lesser than the sensex s to c k s a s we l l . T h e re t u r n s f ro m Pharmaceutical stocks are independent of market conditions while in case of sensex stocks significantly depend upon the market conditions. In case of sensex stocks, the perception of investor about expected return from stock in these sectors at the given level of risk are highly correlated, that is investors' expectation of returns from these stocks is higher for the higher level of risk. Also d e p e n d e n c e e x p e c t e d r e t u r n o f Pharmaceutical stocks on changes in market
returns is very less as compared to sensex stocks. Key Words: Pharma Stocks, Volatility, Sensex, Defensive, Bombay Stock Exchange.
1. INTRODUCTION
Pharma is a very narrow sector and there is not much money in terms of asset under management in these funds. Hence, an upward movement in a few select stocks can turn these funds into best-performing fund
.
Defensive stocks are essentially those which are less volatile; do not get affected too much by short-term mood shifts, and thus fall less than the market in the event of a downturn Hindustan Unilever, Colgate Palmolive, Nestle India, GlaxoSmithKline Pharma and Lupin have actually managed positive returns or remained flat in 2008 and have been among the top performers in the recent fall. These stocks were underperformers in the 2007 rally. However, the theory that exposure to defensive sectors helps your portfolio has played out, with the overall performance of these sectors being better than the market.
during difficult market and economic times. We often hear market experts advise that investors should seek out "defensive stocks” '[1]
It
04 Indira Management Review - July 2012
(*Faculty, School of Business, Galgotias University, India E-Mail: [email protected]
( **Faculty, School of Business, Galgotias University, India E-Mail: [email protected])
Dr. Harjit Singh,* Jitin Gambhir,**
may be fair to add pharmaceuticals stocks to the defensive category because society will invest in medical advancement regardless of the economic environment (Hansen 2003).
This can be seen
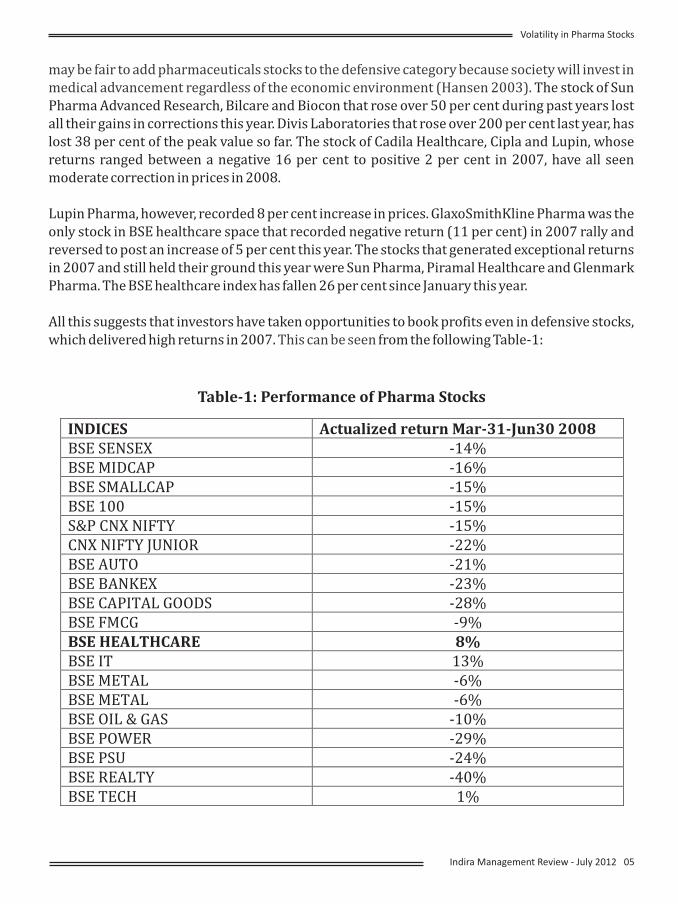
The stock of Sun Pharma Advanced Research, Bilcare and Biocon that rose over 50 per cent during past years lost all their gains in corrections this year. Divis Laboratories that rose over 200 per cent last year, has lost 38 per cent of the peak value so far. The stock of Cadila Healthcare, Cipla and Lupin, whose returns ranged between a negative 16 per cent to positive 2 per cent in 2007, have all seen moderate correction in prices in 2008.
Lupin Pharma, however, recorded 8 per cent increase in prices. GlaxoSmithKline Pharma was the only stock in BSE healthcare space that recorded negative return (11 per cent) in 2007 rally and reversed to post an increase of 5 per cent this year. The stocks that generated exceptional returns in 2007 and still held their ground this year were Sun Pharma, Piramal Healthcare and Glenmark Pharma. The BSE healthcare index has fallen 26 per cent since January this year.
All this suggests that investors have taken opportunities to book profits even in defensive stocks, which delivered high returns in 2007. from the following Table-1:
Indira Management Review - 05July 2012
Volatility in Pharma Stocks
Table-1: Performance of Pharma Stocks
INDICES Actualized return Mar-31-Jun30 2008 BSE SENSEX -14% BSE MIDCAP -16% BSE SMALLCAP -15% BSE 100 -15% S&P CNX NIFTY -15% CNX NIFTY JUNIOR -22% BSE AUTO -21% BSE BANKEX -23% BSE CAPITAL GOODS -28% BSE FMCG -9% BSE HEALTHCARE 8% BSE IT 13% BSE METAL -6% BSE METAL -6% BSE OIL & GAS -10% BSE POWER -29% BSE PSU -24% BSE REALTY -40% BSE TECH 1%
06 Indira Management Review - July 2012
This study investigates the value creating
opportunities offered by pharmaceutical
stocks. In the present paper we tried to
d e t e r m i n e t h e p e r f o r m a n c e o f
pharmaceutical stocks with respect sensex
stocks in Indian market to determine if
pharmaceutical stocks in India have been
value creators for investors. This research
will help the investors to choose the
pharmaceutical stocks in their portfolios
depending on their risk perception and
required returns for that type of risk. This
study will also help to determine if really
investing in pharmaceutical stocks create
value.
This study analyses the share price returns
involved in the investment. It involves the
analysis of securities from point of view of
their price, returns and risks. The analysis of
risk and return related to securities will help
in understanding the behavior of security
prices, market and decision making for
investment.
The empirical study reveals that pharma
stocks outperformed the sensex in terms of
monthly returns while the total risk
associated with pharma stocks is lesser than
the sensex stocks as well. The returns from
Pharmaceutical stocks are independent of
market conditions while in case of sensex
stocks significantly depend upon the market
conditions. In case of sensex stocks, the
perception of investor about expected return
from stock in these sectors at the given level
of risk are highly correlated, that is investors
expectation of returns from these stocks is
higher for the higher level of risk. Also
d e p e n d e n c e e x p e c t e d r e t u r n o f
Pharmaceutical stocks on changes in market
returns is very less as compared to sensex
stocks.
Financial analysts play a key role in
distinguishing which news are relevant for the
valuation of a particular asset, and the changes
in their recommendations are signals of new
information in the market. Recent finance
literature highlights the role of technological
change in increasing firm specific and
aggregate stock price volatility (Campbell et
al. 2001, Shiller 2000, Pastor and Veronesi
2006). Gonzalez and Gimeno (2008) studied
the impact of buy or sell recommendations on
r e t u r n s a n d a l s o vo l a t i l i t y o f t h e
pharmaceutical companies listed in the New
York Stock Exchange The pharma sector now
commands attention as one of the key building
blocks of the Indian outsourcing story.
Mazzucato and Tancioni (2002) investigated
more closely the relationship between stock
price volatility and innovation using firm level
patent citation data focus the analysis on firms
in the pharmaceutical and biotechnology
industries between 1974 and 1999. Results
suggest that there is a positive and significant
relationship between idiosyncratic risk, R&D
intensity and the various patent related
measures.
The whole idea of an investment is to secure
your future (Grabowaki 1990). In this case, it is
imperative to make a wise decision before one
pump his hard earned money into any type of
investment. This holds true whether his
resources are limited or not. Investors are
aware of the fact that the last couple of years
have been lackluster in terms of the economy
and investing (Jovanovic 1994). At a time like
this, one needs to think, not twice, but ten
times before investing. Nevertheless, a few
Volatility in Pharma Stocks
Indira Management Review - 07July 2012
industries like the pharmaceutical industry,
has managed to survive the economic
meltdown (Knight 1921 & Manderbrot
1963)). This obviously makes them a safe
option to put your money. Pharmaceuticals
companies have survived the crisis
predominantly because of it being a need-
based industry (Berndth 2002).
Medicines are essential to the survival of
every being. This need does not change,
irrespective of the fact where people live.
With millions of dollars spent on ongoing
r e s e a r c h a n d d e v e l o p m e n t , t h e
pharmaceutical industry is poised to reach
new heights in terms of profits, thereby
making it a safe investment. Past evidence
indicates that several of those who invested
in the industry have now gone on to make
considerable profits, with many millionaires
included in the list (Clark 1973).
2.1 OBJECTIVES OF THE STUDY
1. To evaluate the defensive nature of
healthcare sector vis-à-vis the industry
benchmark.
2. To analysis the performance of
pharmaceuticals stocks vis a vis the whole
market
3. To highlight the defensive nature of
healthcare stocks on basis of their alpha,
beta, standard deviation.
4. To create an ideal portfolio with the
feature of healthcare stocks.
2.2 Rationale of the Study
A great volatility prevailing in the capital
market has led the investors especially the
moderate and conservative risk averse
investors to invest in stocks that are less
volatile in nature and provide a steady return
with a limited amount of risk involved. These
kind of stocks which give a reasonable return
and has less risk involved in them are called
defence stocks and are considered safe for
investment by the investors. It is a belief
among the investors and capital market guru's
that healthcare sector is safe for investment
and it being a utility sector is less prone to risk
and can provide a steady return (Deny 2005).
Whether healthcare sector is a safer bet for the
investment is a matter of consideration.
In order to understand this, there was a need
to undertake an empirical study that will
enable us to actually believe that investment in
healthcare is safe or not and how much can it
prove itself to be better than the market
movement for the moderate and conservative
risk investors.
3. METHODOLOGY
This is an empirical study which assesses
volatility in Indian Pharma Stock market. To
analyze the performance of pharmaceuticals
stocks vis-a-vis the whole market, the
required data for study was collected from the
PROWESS software provided by Centre for
Monitoring Indian Economy (CMIE) database.
The stocks in BSE SENSEX and BSE Healthcare
index were also taken from PROWESS (CMIE
database). The data was taken on monthly
basis. The study period entails data from April
2004 to December 2010. The stock prices have
been taken as such that involves the period of
gradual increase in the stock market, debacle
of the stock market and eventually the rising
back of the stock market. The overall collected
data comprises BSE healthcare index
(21stocks) with BSE sensex (30 stocks). The
Volatility in Pharma Stocks
08 Indira Management Review - July 2012
hypothesis is tested through z-test and t-test.
The popular software SPSS 13.0 was used for
the whole analysis along with Microsoft excel.
As per the requirements of the study, the data
was also collected from the website of
Mumbai Stock Exchange.
4. FORMULATION OF HYPOTHESIS
The following hypotheses have been
framed to test the entire study.
(1)
H0: Healthcare stocks give good return in
volatile markets.
H1: Healthcare stocks underperforms in
volatile markets
(2)
H0: There is no significant difference in
return from Healthcare Index and sensex.
H1: There is difference in return from
Healthcare Index and sensex.
(3)
H0: There is no significance difference
between the risk of Healthcare Index and
sensex.
H1: There is significance difference between
the risk of Healthcare and sensex.
The sample has been taken for a monthly data
of a period April 2004 – December 2010, 79
numbers of observations. The reason for
considering the monthly data is to eliminate
the element of daily noise in the share prices
and do a fair study of the movement the share
prices. The data is secondary in nature
collected from the reliable source of Bombay
Stock Exchange. The data obtained is in the
form of Time Series data depicting the prices
of stocks and Index and various time
periods.
This research study measures the difference
in risk and return among Healthcare and BSE
SENSEX 30 stocks over the period of April
2004 and December 2010. BSE SENSEX has
been taken as a benchmark portfolio. The data
is collected from the BSE website. The
monthly returns for different companies (in
percentage) are determined as:
R = i
()100
0
01 *-
P
PP
Where: R is monthly return of a company,i
P is closing price of company for the 1
month,P is opening price of company for 0
the month.
Tools used for analysis·Descriptive statistics
o Mean
o standard deviation
·Alpha·Beta ·Correlation·Regression·Paired student t test to find the
difference of the return and then to test the hypothesis.
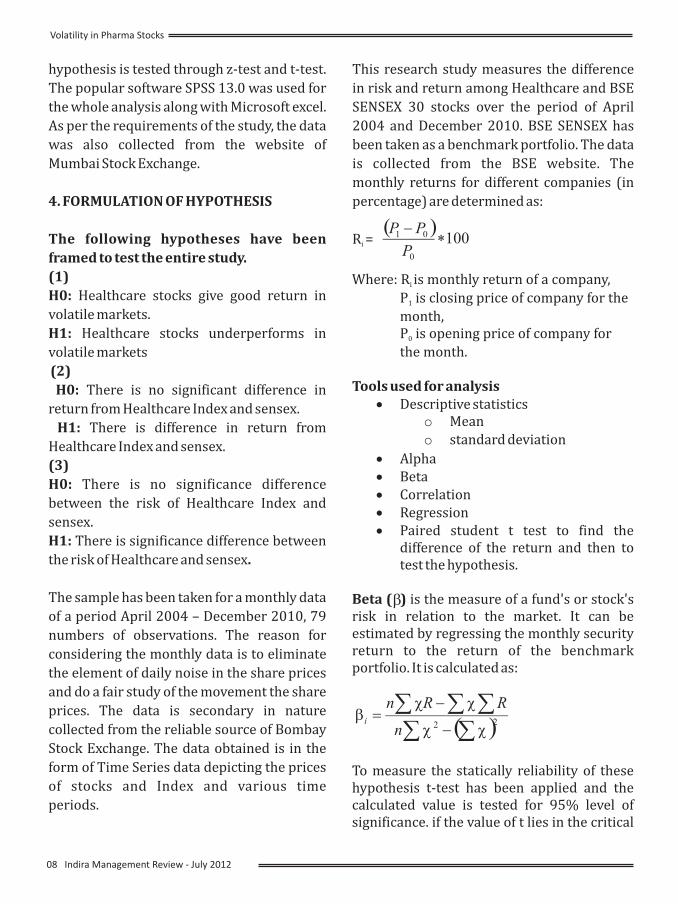
Beta ( ) is the measure of a fund's or stock's risk in relation to the market. It can be estimated by regressing the monthly security return to the return of the benchmark portfolio. It is calculated as:
To measure the statically reliability of these hypothesis t-test has been applied and the calculated value is tested for 95% level of significance. if the value of t lies in the critical
b
()ååååå-
-=
22 cc
ccb
n
RRni
Volatility in Pharma Stocks
Indira Management Review - 09July 2012
region (-t to + t ) we reject the null 0.025 0.025
hypothesis and accept that the statically significant while in other case the null hypothesis can be accepted and it can be admitted that estimates are statistically not significant.
Alpha ( ) is a constant intercept indicating a minimum level of return that is expected from security, if market remains flat (neither going up nor coming down). A positive alpha is the extra return awarded to the investor for taking a risk, instead of accepting the market return. ALPHA is calculated in this way:
Where: is mean return of security,
is mean return of benchmark portfolio.
To measure the statically reliability of these hypothesis t-test has been applied and the calculated value is tested for 95% level of
significance. if the value of t lies in the critical region (-t to + t ) we reject the null 0.025 0.025
hypothesis and accept that the statically significant while in other case the null hypothesis can be accepted and it can be admitted that estimates are statistically not
2R is a statistical measure that represents the percentage of a fund or security's movements that can be explained by movements in a benchmark index. It explains the risk adjusted returns of security.
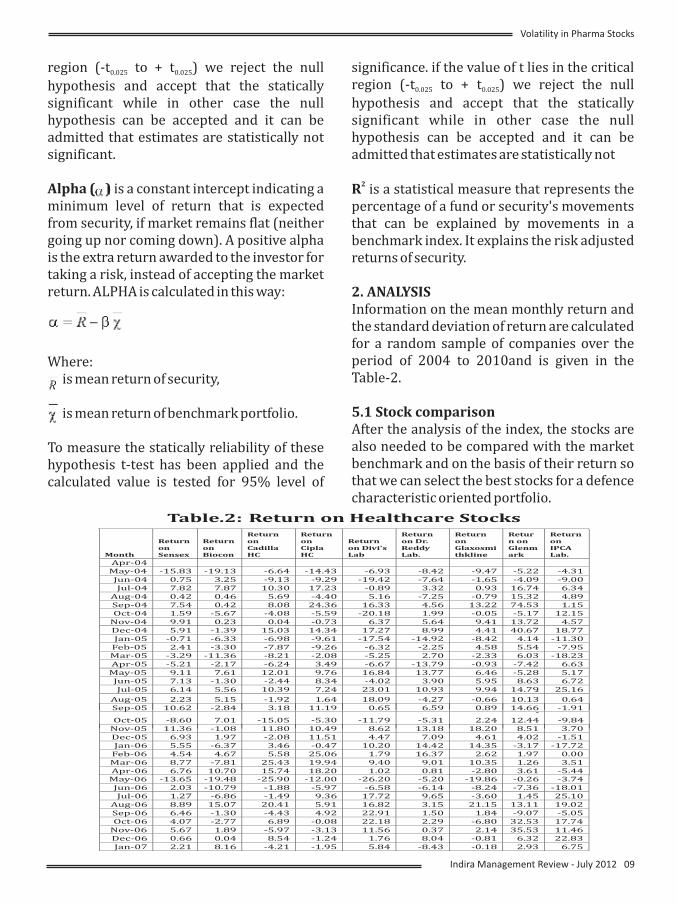
2. ANALYSISInformation on the mean monthly return and the standard deviation of return are calculated for a random sample of companies over the period of 2004 to 2010and is given in the Table-2.
5.1 Stock comparison After the analysis of the index, the stocks are also needed to be compared with the market benchmark and on the basis of their return so that we can select the best stocks for a defence characteristic oriented portfolio.
Volatility in Pharma Stocks
Month
Returnno
Sensex
Returnno
Biocon
Returnon
adillaC
CH
Returnon
iplaCHC
Returnn Divi'sab
oL
Returnon Dr.
eddyab
RL .
Returnon
laxosmikl
Gth ine
Return on
lenmGark
Returnon
CAa
IPL b.
Apr-04May-04 -15.83 -19.13 -6.64 -14.43 -6.93 -8.42 -9.47 -5.22 -4.31Jun-04 0.75 3.25 -9.13 -9.29 -19.42 -7.64 -1.65 -4.09 -9.00Jul-04 7.82 7.87 10.30 17.23 -0.89 3.32 0.93 16.74 6.34
Aug-04 0.42 0.46 5.69 -4.40 5.16 -7.25 -0.79 15.32 4.89Sep-04 7.54 0.42 8.08 24.36 16.33 4.56 13.22 74.53 1.15Oct-04 1.59 -5.67 -4.08 -5.59 -20.18 1.99 -0.05 -5.17 12.15
Nov-04 9.91 0.23 0.04 -0.73 6.37 5.64 9.41 13.72 4.57Dec-04 5.91 -1.39 15.03 14.34 17.27 8.99 4.41 40.67 18.77Jan-05 -0.71 -6.33 -6.98 -9.61 -17.54 -14.92 -8.42 4.14 -11.30Feb-05 2.41 -3.30 -7.87 -9.26 -6.32 -2.25 4.58 5.54 -7.95Mar-05 -3.29 -11.36 -8.21 -2.08 -5.25 2.70 -2.33 6.03 -18.23Apr-05 -5.21 -2.17 -6.24 3.49 -6.67 -13.79 -0.93 -7.42 6.63May-05 9.11 7.61 12.01 9.76 16.84 13.77 6.46 -5.28 5.17Jun-05 7.13 -1.30 -2.44 8.34 -4.02 3.90 5.95 8.63 6.72Jul-05 6.14 5.56 10.39 7.24 23.01 10.93 9.94 14.79 25.16
Aug-05 2.23 5.15 -1.92 1.64 18.09 -4.27 -0.66-
10.13 0.64Sep-05 10.62 -2.84 3.18 11.19 0.65 6.59 0.89 14.66 -1.91
Oct-05 -8.60 7.01 -15.05 -5.30 -11.79 -5.31 2.24-
12.44 -9.84Nov-05 11.36 -1.08 11.80 10.49 8.62 13.18 18.20 8.51 3.70Dec-05 6.93 1.97 -2.08 11.51 4.47 7.09 4.61 4.02 -1.51Jan-06 5.55 -6.37 3.46 -0.47 10.20 14.42 14.35 -3.17 -17.72Feb-06 4.54 4.67 5.58 25.06 1.79 16.37 2.62 1.97 0.00Mar-06 8.77 -7.81 25.43 19.94 9.40 9.01 10.35 1.26 3.51Apr-06 6.76 10.70 15.74 18.20 1.02 0.81 -2.80 3.61 -5.44May-06 -13.65 -19.48 -25.90 -12.00 -26.20 -5.20 -19.86 -0.26 -3.74Jun-06 2.03 -10.79 -1.88 -5.97 -6.58 -6.14 -8.24 -7.36 -18.01Jul-06 1.27 -6.86 -1.49 9.36 17.72 9.65 -3.60 1.45 25.10
Aug-06 8.89 15.07 20.41 5.91 16.82 3.15 21.15 13.11 19.02Sep-06 6.46 -1.30 -4.43 4.92 22.91 1.50 1.84 -9.07 -5.05Oct-06 4.07 -2.77 6.89 -0.08 22.18 2.29 -6.80 32.53 17.74
Nov-06 5.67 1.89 -5.97 -3.13 11.56 0.37 2.14 35.53 11.46Dec-06 0.66 0.04 8.54 -1.24 1.76 8.04 -0.81 6.32 22.83Jan-07 2.21 8.16 -4.21 -1.95 5.84 -8.43 -0.18 2.93 6.75
Table.2: Return on ealthcar StocksH e
10 Indira Management Review - July 2012
Volatility in Pharma Stocks
Aug-05 11.00 20.76 5.52 4.82 11.62 1.85Sep-05 -1.54 7.67 5.36 7.08 -6.48 6.24Oct-05 -8.19 -10.03 -24.89 -15.43 -28.58 -9.61
Nov-05 9.21 13.49 12.39 17.92 9.78 10.17Dec-05 1.24 15.61 10.34 -2.84 -5.92 2.97
Return on Healthcare Stocks
Feb-07 -8.18 13.82 -4.93 -5.09 -10.20 -8.83 -0.31 13.23 -2.04Mar-07 1.04 6.03 4.83 1.03 5.98 7.43 -3.61 13.91 -2.84Apr-07 6.12 -1.33 -3.80 -10.54 18.56 -2.46 4.45 9.01 10.17May-07 4.84 -3.28 4.04 3.23 36.13 -8.48 9.26 5.69 -5.15Jun-07 0.73 -4.72 12.06 -4.23 17.36 1.00 -0.52 -6.24 16.14Jul-07 6.15 6.82 -6.62 -8.52 14.86 -3.41 -8.98 4.30 -4.04
Aug-07 -1.49 -3.53 -12.96 -12.24 -12.35 1.14 1.33 0.27 -2.26
Sep-07 12.88 4.07 1.67 8.99 3.65 1.28 -4.92-
38.87 -4.11Oct-07 14.73 9.99 1.88 -2.00 41.58 -4.32 -2.76 16.23 -2.69
Nov-07 -2.39 9.74 -9.33 2.63 -6.12 1.80 -12.35 -6.82 -6.41Dec-07 4.77 1.40 9.56 15.89 15.56 16.33 8.66 30.19 13.05
Jan-08 -13.00 -34.34 -21.42 -11.36 -24.38 -28.17 -20.61-
17.62 -7.02Feb-08 -0.40 17.31 5.46 9.98 -2.08 10.31 35.67 -0.78 -0.78Mar-08 -11.00 -3.51 -2.36 6.03 -8.31 1.42 -5.77 1.09 -2.67Apr-08 10.50 13.85 13.35 -3.05 18.12 5.33 4.28 36.21 3.71May-08 -5.04 -5.44 2.37 -0.47 -1.16 14.80 4.48 -1.71 -5.15Jun-08 -17.99 -14.90 0.63 -0.45 -9.96 -6.16 -2.49 -2.79 -6.18Jul-08 6.64 -3.48 5.08 3.60 5.65 -15.11 -0.95 1.25 -2.22
Aug-08 1.45 3.03 3.09 9.83 8.20 1.77 6.84 -2.37 5.77
Sep-08 -11.70 -9.26 -3.73 -4.85 -12.47 -12.14 0.41-
22.05 -3.62Oct-08 -23.89 -46.01 -16.78 -22.36 -17.83 -15.86 -9.30 14.65 -31.51
Nov-08 -7.10 -5.93 -12.58 13.02 10.70 -0.02 8.97 14.83 -12.57Dec-08 6.10 28.93 18.62 -6.81 10.33 9.72 -1.66 -8.97 9.30
Jan-09 -2.31 -12.91 -6.80 2.73 -34.04 -3.96 1.64-
53.50 -5.35Feb-09 -5.65 0.00 2.00 -0.47 -1.77 -13.27 2.93 5.25 -4.89Mar-09 9.19 42.36 6.96 14.99 9.89 24.88 -9.33 9.32 -0.32Apr-09 17.46 -1.80 12.86 9.53 -10.52 11.40 7.89 13.94 22.22May-09 28.26 27.91 8.37 -7.37 35.24 18.46 -0.91 26.31 35.98Jun-09 -0.90 20.66 13.82 13.61 -3.27 20.62 2.66 -4.18 -4.71Jul-09 8.12 -0.34 22.32 8.84 -3.91 5.10 14.01 14.80 17.95
Aug-09 -0.02 9.12 -1.80 -1.52 -1.57 -2.80 5.27-
13.07 12.94Sep-09 9.32 8.69 13.99 3.04 7.38 24.34 8.62 9.37 15.22Oct-09 -7.18 -4.71 8.99 2.86 -6.21 2.13 1.38 -5.62 13.33
Nov-09 6.48 5.45 5.77 11.26 13.96 11.92 5.86 3.21 3.88Dec-09 3.18 6.23 8.46 4.83 11.58 1.27 -3.63 18.87 11.28Jan-10 -6.34 -2.55 9.89 -5.45 -9.76 -1.62 -5.58
-11.95 7.31
Feb-10 0.44 -2.36 6.88 -0.63 2.20 1.55 12.85 3.90 -2.66Mar-10 6.68 8.16 8.32 6.91 8.92 11.74 3.63 5.82 23.30Apr-10 0.18 6.12 2.64 1.62 -0.80 -1.14 7.15 1.35 -2.39May-10 -3.50 -2.30 8.07 -6.89 10.57 11.16 10.55 0.56 4.16Jun-10 4.46 10.38 7.84 5.89 3.67 3.50 4.03 -0.06 6.47Jul-10 0.95 -4.93 -3.66 -3.30 -2.95 -6.86 -7.99 -0.61 -4.14
Aug-10 0.58 9.57 -4.82 -7.12 -0.89 0.73 -7.67 5.99 1.64Sep-10 11.67 5.78 8.76 6.03 -6.74 5.71 18.72 4.48 9.23Oct-10 -0.18 14.85 6.69 9.51 -0.12 15.11 0.65 13.84 4.62
Nov-10 -2.55 -5.16 9.74 -2.43 -10.56 7.68 -4.07 3.81 -2.91Dec-10 5.06 7.99 1.32 7.62 4.35 -6.88 9.79 2.82 9.31
Month
Returnon
upint
LL d.
Returnn OPTOirc
oC uits
ReturnonOrchidChem.
ndhar
aP ma
Return oniramalealt
Ph hcare
Returnnanb
oR axy
Return onunharma
SP
Apr-04May-04 -13.27 -21.08 -9.41 -13.39 -6.98 2.76Jun-04 -9.35 32.28 -7.61 4.13 -7.98 -5.09Jul-04 -2.27 18.09 -1.57 2.15 3.49 -3.21
Aug-04 8.33 -0.49 24.30 -0.94 1.79 9.01Sep-04 8.69 65.15 4.03 18.95 13.84 10.51Oct-04 -14.99 68.65 -10.19 8.48 0.72 3.40
Nov-04 2.05 12.43 18.39 16.28 2.34 12.23Dec-04 8.17 -0.85 18.39 35.63 11.30 11.90Jan-05 -12.39 1.88 14.61 -17.03 -13.30 -10.56Feb-05 -7.34 14.19 -3.97 -3.73 -6.00 -3.56Mar-05 -0.61 -12.87 -6.19 -12.97 -1.56 -1.43Apr-05 1.74 -1.24 -6.47 -2.25 -9.07 6.14May-05 10.28 14.95 12.41 14.09 20.61 5.01Jun-05 12.01 6.13 0.95 3.03 -3.94 9.83Jul-05 -0.56 40.62 7.79 -1.27 -11.01 6.53
Indira Management Review - 11July 2012
Jan-06 10.11 13.78 9.43 -12.52 10.14 1.99Feb-06 10.84 -7.15 21.88 -0.96 7.59 11.60Mar-06 8.84 3.51 15.65 9.44 0.51 11.59Apr-06 15.53 88.86 -7.58 -8.24 9.49 -0.31May-06 -12.39 -5.92 -34.23 -19.78 -12.93 -6.75Jun-06 -13.18 -28.37 -18.06 -0.16 -13.38 -1.82Jul-06 0.34 8.25 -3.89 5.11 4.90 3.38
Aug-06 11.83 4.73 13.73 12.71 8.81 10.80Sep-06 -8.14 10.34 2.94 4.69 8.12 2.68Oct-06 11.12 26.04 -0.31 -4.86 -9.13 -2.66
Nov-06 3.19 16.25 0.14 4.28 -6.86 12.09Dec-06 15.72 -13.05 -5.86 12.75 5.25 -3.54Jan-07 -1.87 7.16 28.94 -3.45 4.27 4.98Feb-07 0.48 -5.19 -10.01 -11.67 -17.38 -9.75Mar-07 0.36 2.46 15.17 8.74 4.44 13.63Apr-07 16.38 12.62 -1.34 4.86 5.32 -2.57May-07 0.89 1.43 0.74 -2.17 4.40 7.92Jun-07 3.01 13.08 -3.82 18.95 -8.45 -7.78Jul-07 -12.12 24.07 -10.15 -10.11 9.85 -8.96
Aug-07 -8.87 -4.74 -9.65 0.20 0.36 0.06Sep-07 -0.09 24.01 11.07 4.15 11.01 3.70Oct-07 0.09 14.66 1.04 6.67 -1.69 9.19
Nov-07 -10.42 4.12 12.87 1.70 -9.34 4.58Dec-07 20.58 13.46 10.92 17.11 10.02 10.84Jan-08 -9.96 -11.23 -15.97 -15.05 -17.55 -6.84Feb-08 -2.63 -8.37 4.98 -9.67 26.92 7.68Mar-08 -11.11 -19.89 -35.93 10.60 -1.57 0.45Apr-08 14.66 8.45 48.47 14.45 9.41 17.69May-08 25.54 -6.40 0.46 3.86 10.12 -3.19Jun-08 -6.20 -13.11 -6.48 -16.54 -1.06 -0.74Jul-08 10.58 2.94 11.64 6.45 -4.58 1.26
Aug-08 -1.02 5.88 -2.01 5.73 3.89 4.66Sep-08 -1.37 -24.23 -13.63 -2.30 -52.22 -0.53Oct-08 -8.06 -37.46 -51.99 -31.99 -31.60 -23.50
Nov-08 -11.57 -15.00 -17.92 -6.42 23.22 -3.80Dec-08 5.55 18.01 9.79 13.33 20.88 -1.41Jan-09 -7.76 -1.68 -21.47 -10.69 -14.54 0.80Feb-09 14.10 -4.91 -9.62 -2.35 -24.99 -5.50Mar-09 5.99 20.95 18.15 -6.63 2.35 9.65
Volatility in Pharma Stocks
Apr-09 4.04 9.28 24.37 19.67 0.21 14.64May-09 16.29 52.50 32.93 11.44 68.00 -5.14Jun-09 -2.01 -3.22 -24.58 20.34 -12.11 -9.82Jul-09 15.76 6.98 0.73 0.37 14.30 7.42
Aug-09 7.32 8.94 23.68 5.59 16.96 1.54Sep-09 11.99 6.26 51.40 15.81 23.03 17.59Oct-09 7.86 -0.97 -15.40 0.04 -3.11 -1.26
Nov-09 12.09 3.06 25.54 3.44 16.63 5.45Dec-09 8.43 10.47 -4.49 -5.95 13.61 3.44Jan-10 -4.69 -5.62 -13.66 -1.97 -12.43 -2.50Feb-10 5.43 -1.14 0.79 8.88 3.07 4.86Mar-10 8.47 2.46 -3.68 6.64 1.68 16.14Apr-10 5.12 3.48 2.33 26.05 -6.70 -12.45May-10 8.97 -2.03 -11.40 -3.67 -2.99 6.01Jun-10 5.65 9.07 18.63 -6.83 7.15 7.42Jul-10 -4.45 14.24 12.36 0.76 -2.45 -0.75
Aug-10 -5.24 2.17 0.43 3.01 9.11 -0.60Sep-10 9.13 6.13 25.08 0.37 13.65 14.71Oct-10 12.78 -3.84 22.36 -4.46 4.06 4.38
Nov-10 16.35 -1.33 3.18 -7.65 -1.43 6.48Dec-10 -5.77 -4.66 2.81 6.35 4.76 8.00
12 Indira Management Review - July 2012
Volatility in Pharma Stocks
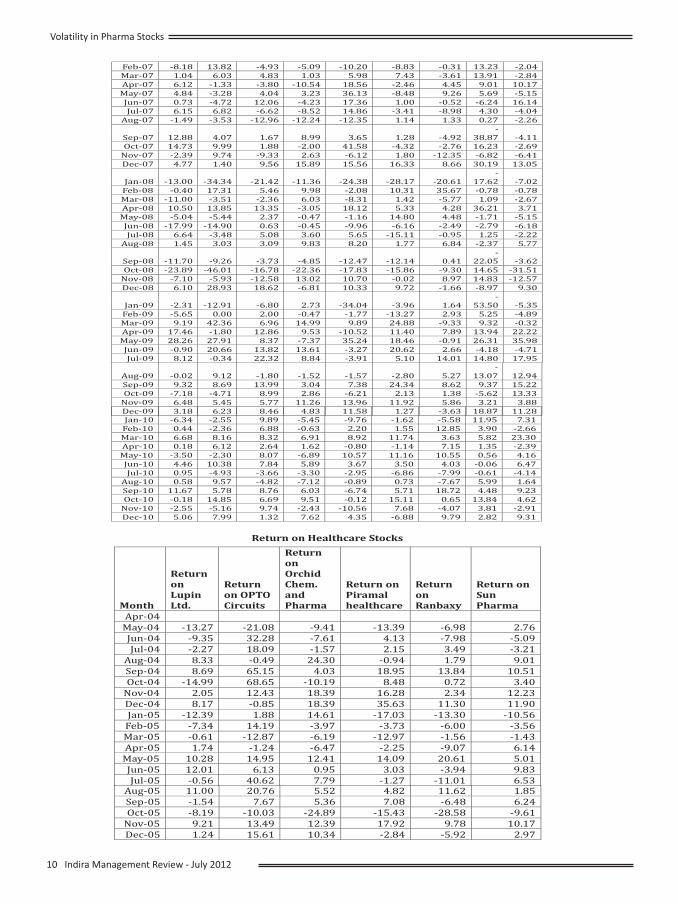
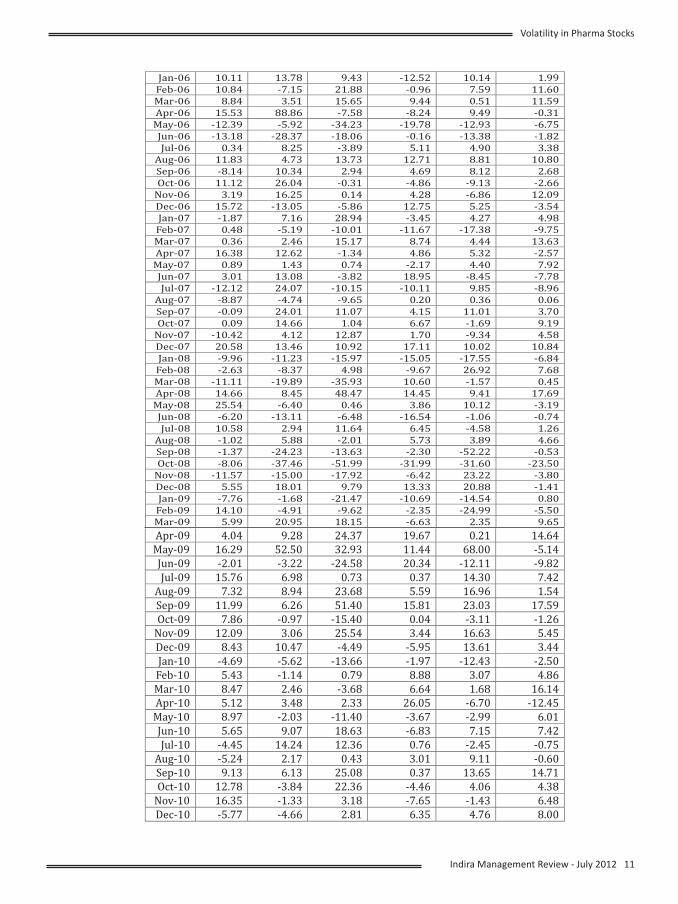
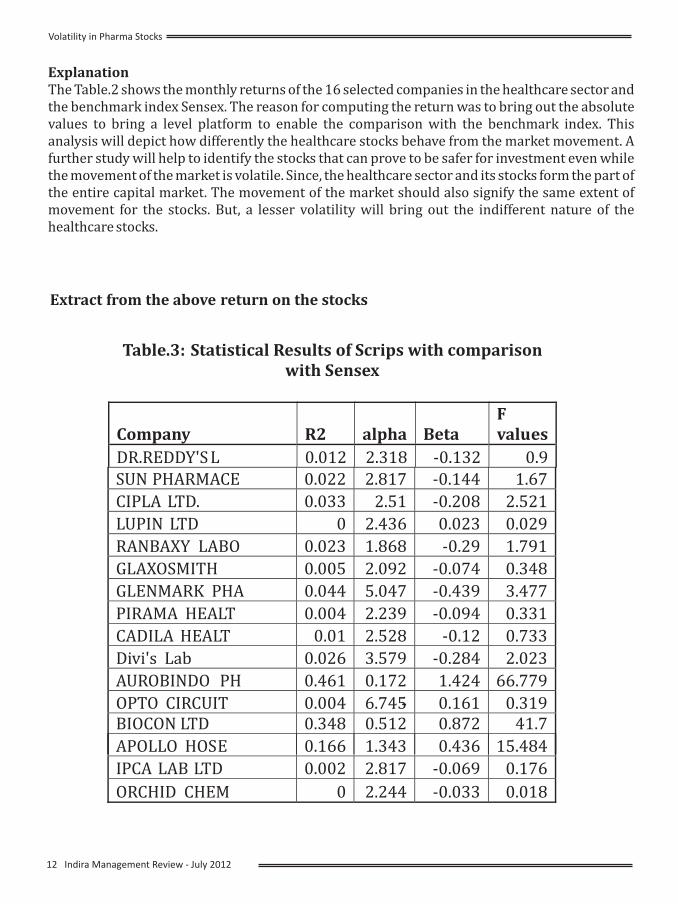
ExplanationThe Table.2 shows the monthly returns of the 16 selected companies in the healthcare sector and the benchmark index Sensex. The reason for computing the return was to bring out the absolute values to bring a level platform to enable the comparison with the benchmark index. This analysis will depict how differently the healthcare stocks behave from the market movement. A further study will help to identify the stocks that can prove to be safer for investment even while the movement of the market is volatile. Since, the healthcare sector and its stocks form the part of the entire capital market. The movement of the market should also signify the same extent of movement for the stocks. But, a lesser volatility will bring out the indifferent nature of the healthcare stocks.
Extract from the above return on the stocks
Table.3: Statistical Results of Scrips with comparisonwith Sensex
Company R2 alpha BetaFvalues
DR.REDDY'S L 0.012 2.318 -0.132 0.9
SUN PHARMACE 0.022 2.817 -0.144 1.67
CIPLA LTD. 0.033 2.51 -0.208 2.521
LUPIN LTD 0 2.436 0.023 0.029
RANBAXY LABO 0.023 1.868 -0.29 1.791
GLAXOSMITH 0.005 2.092 -0.074 0.348
GLENMARK PHA 0.044 5.047 -0.439 3.477
PIRAMA HEALT 0.004 2.239 -0.094 0.331
CADILA HEALT 0.01 2.528 -0.12 0.733
Divi's Lab 0.026 3.579 -0.284 2.023
AUROBINDO PH 0.461 0.172 1.424 66.779
OPTO CIRCUIT 0.004 6.745 0.161 0.319BIOCON LTD 0.348
-0.512 0.872 41.7
APOLLO HOSE 0.166 1.343 0.436 15.484
IPCA LAB LTD 0.002 2.817 -0.069 0.176
ORCHID CHEM 0 2.244 -0.033 0.018
Indira Management Review - 13July 2012
Volatility in Pharma Stocks
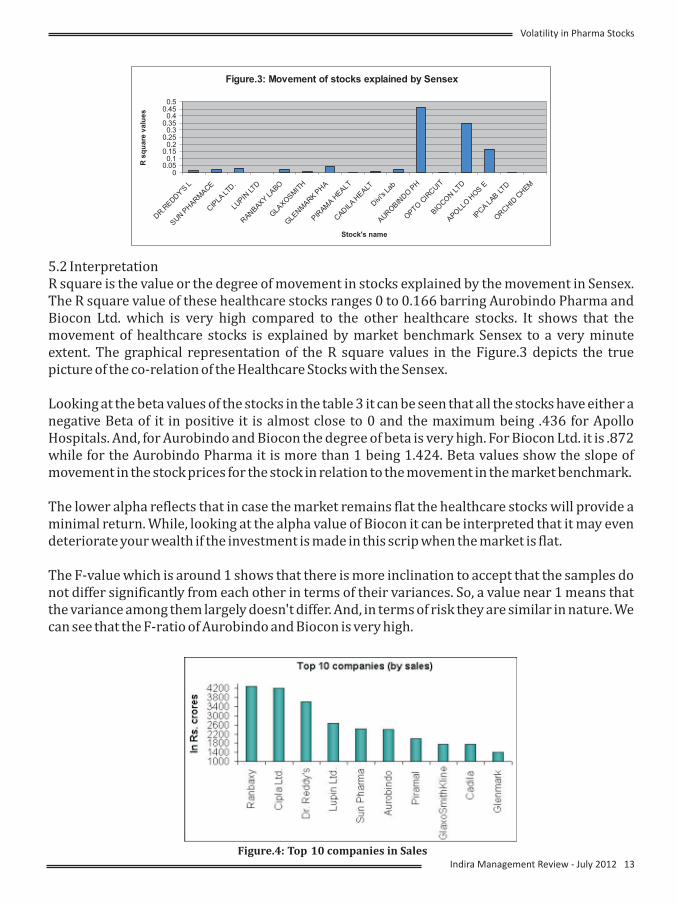
Figure.3: Movement of stocks explained by Sensex
00.05
0.10.15
0.20.25
0.30.35
0.40.45
0.5
DR.R
EDDY'S
L
SUN P
HAR
MACE
CIP
LA L
TD.
LUPIN
LTD
RAN
BAXY
LABO
GLA
XOSM
ITH
GLE
NM
ARK PHA
PIRAM
A
HEALT
CAD
ILA H
EALT
Divi
's La
b
AUROBIN
DO P
H
OPTO
CIR
CUIT
BIOCO
N L
TD
APOLL
O H
OS E
IPCA L
AB LTD
ORCHID
CHEM
Stock's name
R s
qu
are
va
lue
s
5.2 InterpretationR square is the value or the degree of movement in stocks explained by the movement in Sensex. The R square value of these healthcare stocks ranges 0 to 0.166 barring Aurobindo Pharma and Biocon Ltd. which is very high compared to the other healthcare stocks. It shows that the movement of healthcare stocks is explained by market benchmark Sensex to a very minute extent. The graphical representation of the R square values in the Figure.3 depicts the true picture of the co-relation of the Healthcare Stocks with the Sensex.
Looking at the beta values of the stocks in the table 3 it can be seen that all the stocks have either a negative Beta of it in positive it is almost close to 0 and the maximum being .436 for Apollo Hospitals. And, for Aurobindo and Biocon the degree of beta is very high. For Biocon Ltd. it is .872 while for the Aurobindo Pharma it is more than 1 being 1.424. Beta values show the slope of movement in the stock prices for the stock in relation to the movement in the market benchmark.
The lower alpha reflects that in case the market remains flat the healthcare stocks will provide a minimal return. While, looking at the alpha value of Biocon it can be interpreted that it may even deteriorate your wealth if the investment is made in this scrip when the market is flat.
The F-value which is around 1 shows that there is more inclination to accept that the samples do not differ significantly from each other in terms of their variances. So, a value near 1 means that the variance among them largely doesn't differ. And, in terms of risk they are similar in nature. We can see that the F-ratio of Aurobindo and Biocon is very high.
Figure.4: Top 10 companies in Sales
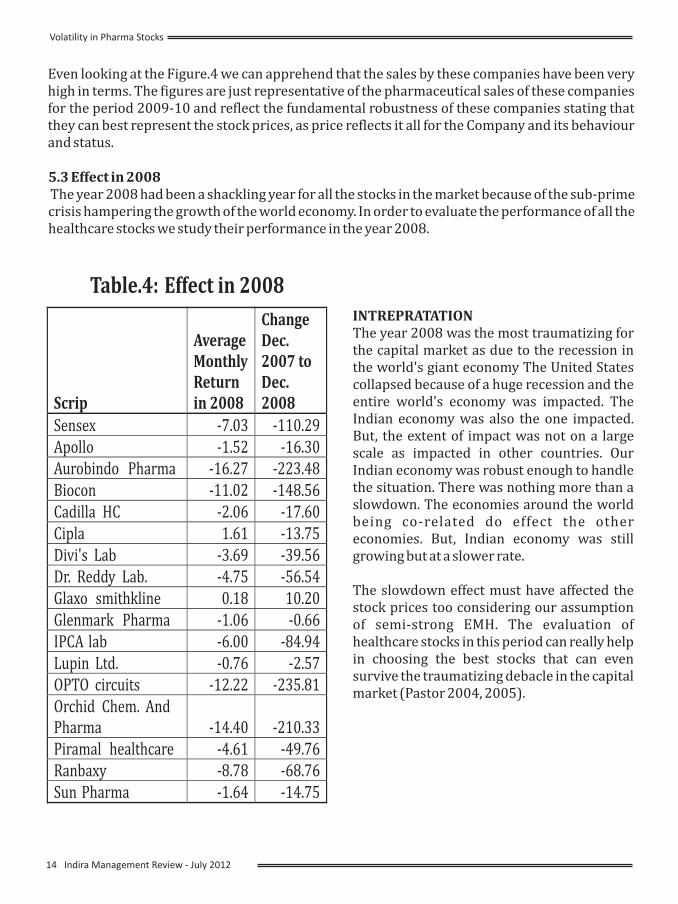
5.3 Effect in 2008 The year 2008 had been a shackling year for all the stocks in the market because of the sub-prime crisis hampering the growth of the world economy. In order to evaluate the performance of all the healthcare stocks we study their performance in the year 2008.
Table.4: Effect in 2008
Scrip
AverageMonthlyRetin 2
urn008
ChangeDec.2007 toD20
ec.08
Sensex -7.03 -110.29Apollo -1.52 -16.30Aurobindo Pharma -16.27 -223.48Biocon -11.02 -148.56Cadilla HC -2.06 -17.60Cipla 1.61 -13.75Divi's Lab -3.69 -39.56Dr. Reddy Lab. -4.75 -56.54Glaxo smithkline 0.18 10.20Glenmark Pharma -1.06 -0.66IPCA lab -6.00 -84.94Lupin Ltd. -0.76 -2.57OPTO circuits -12.22 -235.81Orchid Chem. AndPharma -14.40 -210.33Piramal healthcare -4.61 -49.76Ranbaxy -8.78 -68.76Sun Pharma -1.64 -14.75
INTREPRATATIONThe year 2008 was the most traumatizing for the capital market as due to the recession in the world's giant economy The United States collapsed because of a huge recession and the entire world's economy was impacted. The Indian economy was also the one impacted. But, the extent of impact was not on a large scale as impacted in other countries. Our Indian economy was robust enough to handle the situation. There was nothing more than a slowdown. The economies around the world being co-related do effect the other economies. But, Indian economy was still growing but at a slower rate.
The slowdown effect must have affected the stock prices too considering our assumption of semi-strong EMH. The evaluation of healthcare stocks in this period can really help in choosing the best stocks that can even survive the traumatizing debacle in the capital market (Pastor 2004, 2005).
Even looking at the Figure.4 we can apprehend that the sales by these companies have been very high in terms. The figures are just representative of the pharmaceutical sales of these companies for the period 2009-10 and reflect the fundamental robustness of these companies stating that they can best represent the stock prices, as price reflects it all for the Company and its behaviour and status.
14 Indira Management Review - July 2012
Volatility in Pharma Stocks
The reason for considering the year 2008 for examination is to ascertain the market movement and the impact in the stock market influenced by the global downturn.
The average return in the year 2008 for sensex was a negative 7.03% and stocks like OPTO Circuits, Orchid Chemicals and Pharma, Aurobindo Pharma, Ranbaxy and Biocon are negative too impacted by the economic downturn and the extent of negative return is even higher than the market benchmark.
However, there are certain healthcare stocks that have played true to the nature of defense stocks as their classification. Apollo Hospitals gave a negative return of 1.52%, Glenmark Pharma gave a negative return of 1.06% and Lupin Ltd. gave a negative return of just 0.76 %. While looking at other stocks like Cipla Ltd. and Glaxo-smithkline have been on a positive note. Though the return is not very significantly high these stocks have been able to enable themselves on the positive side despite the world economy facing a debacle in the same year.
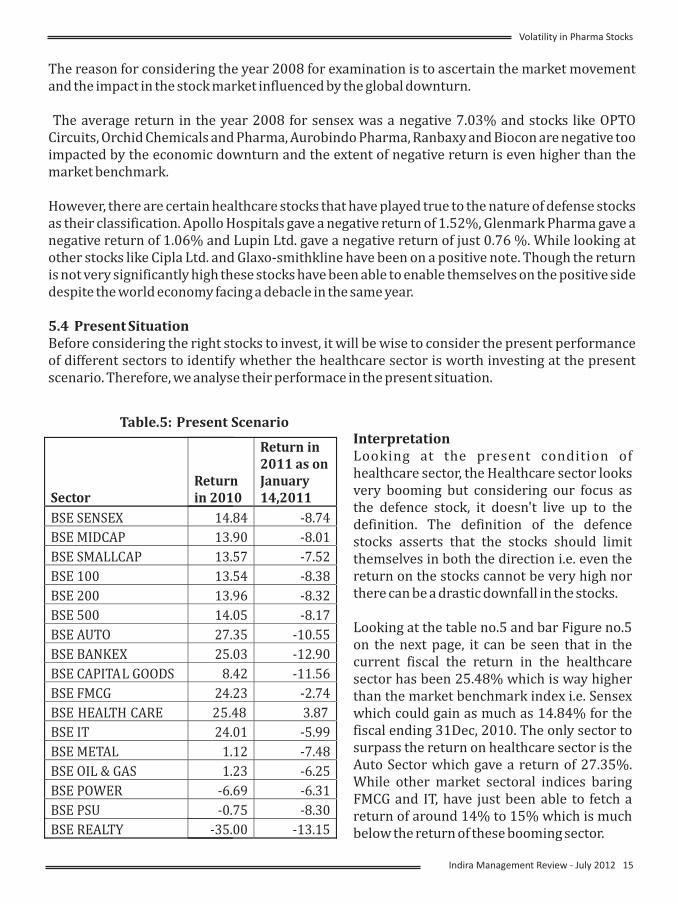
5.4 Present Situation Before considering the right stocks to invest, it will be wise to consider the present performance of different sectors to identify whether the healthcare sector is worth investing at the present scenario. Therefore, we analyse their performace in the present situation.
Table.5: Present cenarioS
SectorRetin 2
urn010
Return in2011 as onJanuar14,201
y1
BSE SENSEX 14.84 -8.74
BSE MIDCAP 13.90 -8.01
BSE SMALLCAP 13.57 -7.52
BSE 100 13.54 -8.38
BSE 200 13.96 -8.32
BSE 500 14.05 -8.17
BSE AUTO 27.35 -10.55
BSE BANKEX 25.03 -12.90
BSE CAPITAL GOODS 8.42 -11.56
BSE FMCG 24.23 -2.74
BSE HEALTH CARE 25.48 3.87
BSE IT 24.01 -5.99
BSE METAL 1.12 -7.48
BSE OIL & GAS 1.23 -6.25
BSE POWER -6.69 -6.31
BSE PSU -0.75 -8.30
BSE REALTY -35.00 -13.15
InterpretationLooking at the present condition of healthcare sector, the Healthcare sector looks very booming but considering our focus as the defence stock, it doesn't live up to the definition. The definition of the defence stocks asserts that the stocks should limit themselves in both the direction i.e. even the return on the stocks cannot be very high nor there can be a drastic downfall in the stocks.
Looking at the table no.5 and bar Figure no.5 on the next page, it can be seen that in the current fiscal the return in the healthcare sector has been 25.48% which is way higher than the market benchmark index i.e. Sensex which could gain as much as 14.84% for the fiscal ending 31Dec, 2010. The only sector to surpass the return on healthcare sector is the Auto Sector which gave a return of 27.35%. While other market sectoral indices baring FMCG and IT, have just been able to fetch a return of around 14% to 15% which is much below the return of these booming sector.
Indira Management Review - 15July 2012
Volatility in Pharma Stocks
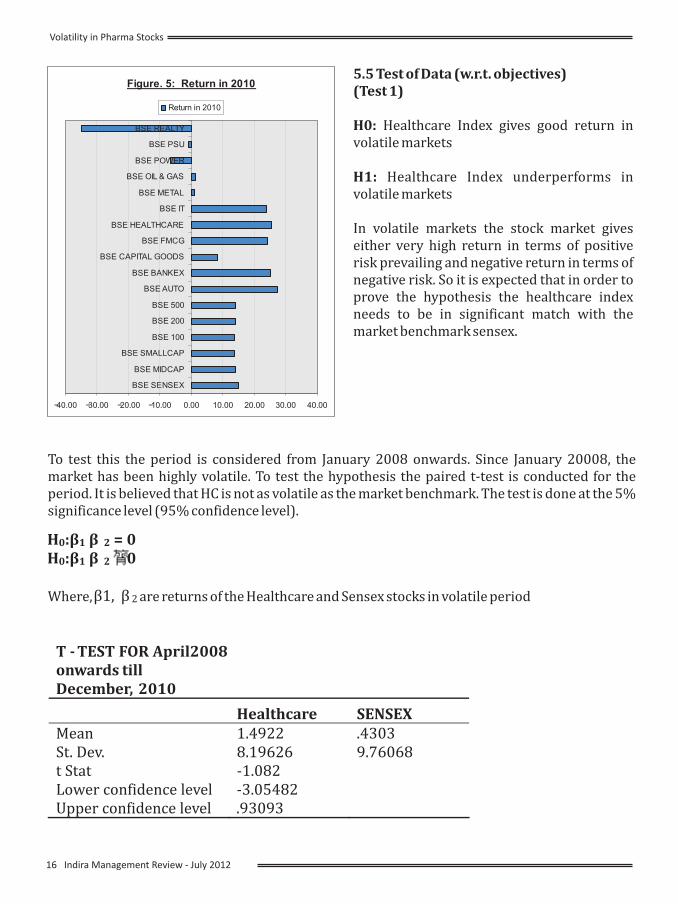
Figure. 5: Return in 2010
-40.00 -30.00 -20.00 -10.00 0.00 10.00 20.00 30.00 40.00
BSE SENSEX
BSE MIDCAP
BSE SMALLCAP
BSE 100
BSE 200
BSE 500
BSE AUTO
BSE BANKEX
BSE CAPITAL GOODS
BSE FMCG
BSE HEALTHCARE
BSE IT
BSE METAL
BSE OIL & GAS
BSE POWER
BSE PSU
BSE REALTY
Return in 2010
5.5 Test of Data (w.r.t. objectives)(Test 1)
H0: Healthcare Index gives good return in volatile markets
H1: Healthcare Index underperforms in volatile markets
In volatile markets the stock market gives either very high return in terms of positive risk prevailing and negative return in terms of negative risk. So it is expected that in order to prove the hypothesis the healthcare index needs to be in significant match with the market benchmark sensex.
16 Indira Management Review - July 2012
Volatility in Pharma Stocks
To test this the period is considered from January 2008 onwards. Since January 20008, the market has been highly volatile. To test the hypothesis the paired t-test is conducted for the period. It is believed that HC is not as volatile as the market benchmark. The test is done at the 5% significance level (95% confidence level).
Where, are returns of the Healthcare and Sensex stocks in volatile period
H0:â1 â 2 = 0H0:â1 â 2≠0
T - TEST FOR April2008nwards tillecember, 2010
oD
Healthcare SENSEXMean 1.4922 .4303St. Dev. 8.19626
2
9.76068t StatLower confidence level
-1.082-3.0548
Upper confidence level .93093
â1, â 2
H0: x and sensex.(Test 2)
There is no significant difference in return from Healthcare IndeH1: There is difference in return from Healthcare Index and sensex.
H0:â1 â 2 = 0H0:â1 â 2≠0Where, â1, â2 are returns of the Healthcare and Sensex stocks.
From the above test it can be said that there is no evidence to reject the null hypothesis. As the confidence interval is -3.05482 to .93093 and the value for t-statistics is -1.082. Since, the Healthcare Index has no significant difference with Sensex during the period of volatility in the stock market. Therefore, we can affirm that the Healthcare Sector gives good return in the volatile markets.
T - TEST FOR004 Dec.2010April2
Healthcare SENSEXMean 1.5276 1.9269St. Dev. 7.44057 8.15621t StatLower confidence level
.658-.80761
Upper confidence level 1.60611
Indira Management Review - 17July 2012
Volatility in Pharma Stocks
Since, the t-value of the test lies between the confidence interval (-.80761,1.60611) it can be said that the return in Healthcare Sector on the basis of Healthcare Index is not significantly different from the return in Sensex.
From the above test, it can be said that there is no evidence to reject the null hypothesis.
5.6 Findings
It has been found that the Healthcare Sector is changing its behaviour. Previously, it was a thumb rule to consider the investment in healthcare sector to be the safest one. But, considering the student t-test on the healthcare index and market benchmark during the volatile period of the market and also during the entire period of study it has been found that there is no much significant difference between the behaviour of healthcare sector in reference to the market benchmark i.e. Sensex.
Even, while comparing both the indices it was found that the standard deviation in the return of Sensex is 8.16% while the standard deviation of Healthcare Index is just 7.44%. There is no major difference between both of them. And, both are prone to almost similar level of risk. So, considering the healthcare sector to be safer for investment without proper analysis will be very imprudent behaviour on the part of the investor (Knight 1921).
In the fallout of stocks in the year 2008, it was noticed that Sensex fell by 110.29% while stocks like Aurobindo, Biocon, OPTO circuits and Orchid Pharma fell by 223.48%, 1 4 8 . 5 6 % , 2 3 5 . 8 1 % a n d 2 1 0 . 3 3 % respectively indicating that they were negatively impacted even more than the market benchmark.Considering the stocks it has been found that except Biocon and Aurobindo the other stocks are comparatively safer as compared to them. So, an investor on the basis of his risk potential can decide on the stocks.
And, considering the volatile period even it was found that healthcare is the hot sector for the purpose of investment and comparing it with other sectoral indices it has been found it is one of the most high return giving sector of around 25% in the 2010 fiscal year and when looked at the sudden down surge of market in the first 15 days of the January month in the year 2011 it was found that the healthcare sector just dipped around 3.5% which is much below the other sectors (Harris 2002).
So, it can be asserted that the healthcare sector is changing its nature and it will be wise on the part of the investor to evaluate the scrip before investing. A wise decision can help to gain windfall returns while a wrong decision will vanish the entire invested money.
CONCLUSION
The Pharmaceutical stocks have offered the prospects of high returns as compared to SENSEX stocks. Thus by investing in Pharmaceutical group companies investors can get a good bargain which lead to higher value creation for investors over a period of time (Shiller 1981 and Schwert 1989).
18 Indira Management Review - July 2012
Volatility in Pharma Stocks
Stable returns from Pharmaceutical stocks are accompanied by lesser level of total risk (Gort & Klepper 1982). The returns from Pharmaceutical stocks are independent of market conditions while in case of sensex stocks significantly depend upon the market conditions. In case of sensex stocks, the perception of investor about expected return from stock in these sectors at the given level of risk are highly correlated, that is investors expectation of returns from these stocks is higher for the higher level of risk. Also d e p e n d e n c e e x p e c t e d r e t u r n o f Pharmaceutical stocks on changes in market returns is very less as compared to sensex stocks (Klepper 1996).
Pharmaceutical stocks give higher return to investors over a long period of time but also have lower volatility level (Ederington 1993). In case of different economic and market conditions the investors expectations of return from Pharmaceutical stocks does not change, while the expectation of return for the sensex firms depend upon the market return (Womack 1986).
So it will be advisable for an investor to have a proper mix of defensive stocks like pharmaceuticals, FMCG and other highly growth shares in his portfolio depending on his risk appetite, return desired and the time horizon.
REFERENCES
1. Berndt, E., 2002. Pharmaceuticals in U.S. Health Care: Determinants of Quantity and Price. Journal of Economic Perspectives 16, 45–66.2. Campbell, J.Y., Lettau, M., Malkiel, B.G., and Yexiao, X. (2001). “Have Individual Stocks Become More Volatile? An Empirical Exploration of Idiosyncratic Risk,” Journal of Finance, 56: 1-43.3. Castanias, R. P., 1979. Macro information and the variability of stock market prices. Journal of Finance 34, 439–450.
Indira Management Review - 19July 2012
Volatility in Pharma Stocks
4. Clark, P. K., 1973. A subordinated stochastic process model with finite variance for speculative prices. Econometrical 41, 135–156.5. Deng, Y. (2005). “The Value of Knowledge Spillovers,” Paper presented at the CEF annual conference, Washington DC, June 24, 2005.6. DiMasi, J. A., Hansen, R. W., Grabowski, H. G., 2003. The price of innovation: new estimates of drug development costs. Journal of Health Economics, 151–185.7. Ederington, L. H., Lee, J. H., 1993. How markets process information: New releases and volatility. The Journal of Finance 48 (4), 1161–1191.8. Engle, R. F., 1984. Handbook of Econometrics. Vol. II. Elsevier Science Publishers9. Filson, D. (2001). “The Nature and Effects of Technological Change over the Industry Life Cycle,” Review of Economic Dynamics, 4(2): 460-94.10. Gonzalez, C. I., Gimeno, R., Mayo 2006. Evaluación de las metodología para medir el valor en riesgo. Estabilidad Financiera (Banco de España) 11, 45–59.11. Gort, M. and Klepper, S. (1982). “Time Paths in the Diffusion of Product Innovations,” Economic Journal, 92: 630-653.12. Grabowski, H., Vernon, J., 1990. A new look at the returns and risks to pharmaceutical R & D. Management Science 36, 804–821.13. Griliches, Z., Hall. B., and Pakes, A. (1991). R&D, Patents and Market Value Revisited: Is There ad Second (Technological Opportunity) Factor?,” Economics, Innovation and New Technology, Vol. 1: 1983-201.14. Hall, B., A. Jaffe, and M. Trajtenberg (2005). “Market value and patent citations,” Rand15. Hansen, B. E., 1992. The Likelihood Ratio Test Under Nonstandard Conditions: Testing the Markov Switching Model of GNP. Journal of Applied Econometrics 7, S61–S82.16. Harris, G. (2002). “Why drug makers are failing in quest for new blockbusters,” Wall Street Journal, March 18, 2002, Journal of Economics, Vol. 36(5)17. Jovanovic, B., and MacDonald, G.M. (1994). “The Life Cycle of a Competitive Industry,” Journal of Political Economy, 102 (2): 322-347.18. Klepper, S. (1996). “Exit, Entry, Growth, and Innovation over the Product Life-Cycle,” American Economic Review, 86(3): 562-583.19. Knight, F.H. (1921). Risk, Uncertainty and Profit, Boston: Houghton Mifflin.20. Mandelbrot, B., 1963. The variation of certain speculative prices. Journal of Business 36 (4), 394–419.21. Mazzucato, M. (2003). “Risk, Variety and Volatility: Innovation, Growth and Stock Prices in Old and New
End Notes
1. "defense stock", which refers to stock in companies which manufacture things like ammunition, weapons, and fighter jets.
efensive stocks is synonymous to non-cyclical stocks, or companies whose business performance and sales are not highly correlated with the larger economic cycle. These companies are seen as good investments when the economy sours.
The term must not be confused with
A 'defensive stock' in capital market is one whose price remains stable under difficult economic conditions. D
Industries,” Journal of Evolutionary Economics, Vol. 13 (5), 2003: pp. 491-512.22. Mazzucato, M. and Tancioni, M. (2005). “Idiosyncratic Risk and Innovation,” Open University Discussion Paper 2005-50.23. Pastor, L. and Veronesi, P. (2004). “Was There a Nasdaq Bubble in the Late 1990's,” Journal of Financial Economics, 81 (1): 61-100.24. Pastor, L. and Veronesi, P. (2005). “Technological Revolutions and Stock Prices,” National Bureau of Economic Research w11876.25. Pearce, D. K., Roley, V. V., 1985. Stock prices and economic news. The Journal of Business 58 (1), 49–67.26. Philipson, T. J., 2002. The regulation of medical innovation and pharmaceutical markets. Journal of Law and Economics 45, 583–585.27. Schwert, G.W. (1989). “Why Does Stock Market Volatility Change Over Time? Journal of Finance, 54: 1115-1153.28. Shiller, R.J. (1981). “Do Stock Prices Move Too Much to be Justified by Subsequent Changes in Dividends,” American Economic Review, 71: 421-435.29. Trajtenberg, M. (1990). “A Penny for Your Quotes: Patent Citations and the Value of Innovations,” Rand Journal of Economics, 21 (1): 172-187.30. Turner, C. M., Startz, R., Nelson, C. R., 1989. A Markov model of heteroskedasticity, risk, and learning in the stock market. Journal of Financial Economics 25, 3–22.31. Womack, K. L., 1996. Do brokerage analysts' recommendations have investment value? The Journal of Finance 51 (1), 137–167.
Public Expenditure on Human Development: An Empirical Study of Karnataka State
Dr. Gopalakrishna B.V*Dr. Jayaprakash Rao**
(*Associate Professor, AJ Institute of Management, Mangalore** Director, AJ Institute of Management, Mangalore)
Introduction
Human development is broadly defined as a
process of enlarging people's choices, as well
as raising the level of wellbeing. Theoretically,
these choices can be infinite and vary over
time and space. From among these, the choice
to lead a long and healthy life, the choice to
acquire knowledge and be educated and to
have access to resources needed for a decent
level of living are identified as three most
critical and socially valuable requirements. A
range of social outcomes can reflect these
choices in the wellbeing of people, most
important being the life expectancy, literacy
and Per Capita Income. Life expectancy and
educational attainments are valued ends in
themselves and Per Capita Income is to
incorporate other aspects of well being not
captured by indicators on the social
attainments on education, health and
longevity of people.
Furthermore, growth of per capita income
has been considered as a measure of
improving human development. However,
empirical literature revealed that per capita
income cannot be a sole determinant of
achieving human development. Public
expenditure is an important component of
any strategy to achieve higher levels of
human development. Its nature and extent is
determined by the size and composition of
public expenditure, particularly the
expenditure on social sector. The proportion
of a state's public expenditure allocated to
social sectors indicates the importance of the
social sector in the state or the state's
commitment to these sectors . This
commitment is very important, especially
during times when the state governments are
spending an increasing proportion of their
income on debt servicing.
This paper examines the trends and pattern of
public expenditure on human development in
Karnataka and also attempts to explain these
trends in view of overall changes in the fiscal
situation of the State. The paper further
examines in detail, the composition of public
expenditure in social sectors that are
important for human development.
Objectives of the Study
1.To examine the status of human
development index of Karnataka in
comparison to other neighboring states.
2. To examine the trends and pattern of public
expenditure on human development in
Karnataka State
3. To conduct a detail study of composition of
public expenditure in social sectors.
Methodology and Data Sources
The information for the study has been
collected mainly from secondary sources. The
study is descriptive and analytical in nature.
Data was collected from various published
s o u rc e s s u c h a s K a r n a t a ka H u m a n
Development Report 1999 and 2005, Finance
Accounts of Karnataka, UNDP, Human
Development Reports, various issues of
Economic Survey and National Human
20 Indira Management Review - July 2012
Development Report 2001. The data are also
analyzed with the help of simple statistical
tools such as percentage method.
Status of Human Development in
Karnataka
Human development in Karnataka State was
guided by the Millennium Development Goals
(UNDP, HDR 2001). The progress of human
development of Karnataka state was quite
good, since the last two decades of human
development experiences in terms of literacy
rate, life expectancy at birth, infant mortality
rate and other human development
indicators in comparison to all India average.
For example, the improvement in the literacy
rate in the state during 1991-2001 was 66.64
per cent as against an increase of 56.64 per
cent during 1981-91.
Similarly, life expectancy has also improved
marginally during 1991-92 to 2001-02 from
62.1 to 67.0 years The Infant Mortality Rate
was declined from 82 per 1000 population in
1991-92 to 55 in 2002-03. However, it is 50 in
2005-06, which is h igher than i ts
neighbouring states of Kerala (14) and Tamil
Nadu (37) but lower than Andhra Pradesh
(57) and all-India rate (58) per 1000
population. The Mortality Rate in Karnataka
for the year 2001-03 was 228 per lakh births
which are highest among the southern states
of Kerala (110) Tamil Nadu (134) and Andhra
Pradesh 195.
Karnataka State has medium human
development rank which has increased from
0.541 to 0.650 between 1991 to 2001, with
Seventh rank among Fifteen states in India,
which are well above the national average of
0.423 and 0.621 respectively, during same
period. The human development of Karnataka
state is more or less equal to Egypt and
considerably higher than South Asian
countries such as Pakistan, Nepal, Bhutan and
Bangladesh in 2001. At the international level,
State has 120th rank while the Country has
127th rank (UNDP, HDR 2003). The human
development indicators such as Per Capita
NSDP, life expectancy at birth, literacy rate and
infant mortality rate are also improved over
the period of time. The State's Per Capita Gross
Sl.
No. Name of the States
Per Capita
NSDP
(Rs.)
Life
Expectancy at
Birth (LEB)
Literacy
Rate
2001
Infant
Mortality
Rate R)(IMHDI
1. Andhra Pradesh 10,590 63.9 61.11 59 0.609
2. Karnataka 10,709 65.8 66.64 520.65
0
3. Maharashtra 14,892 68.3 77.27 42 0.706
4. Kerala 10,832 73.4 90.92 11 0.746
5. Tamil Nadu 12,717 68.4 73.47 43 0.687
India 10,774 64.8 65.49 57.40.62
7
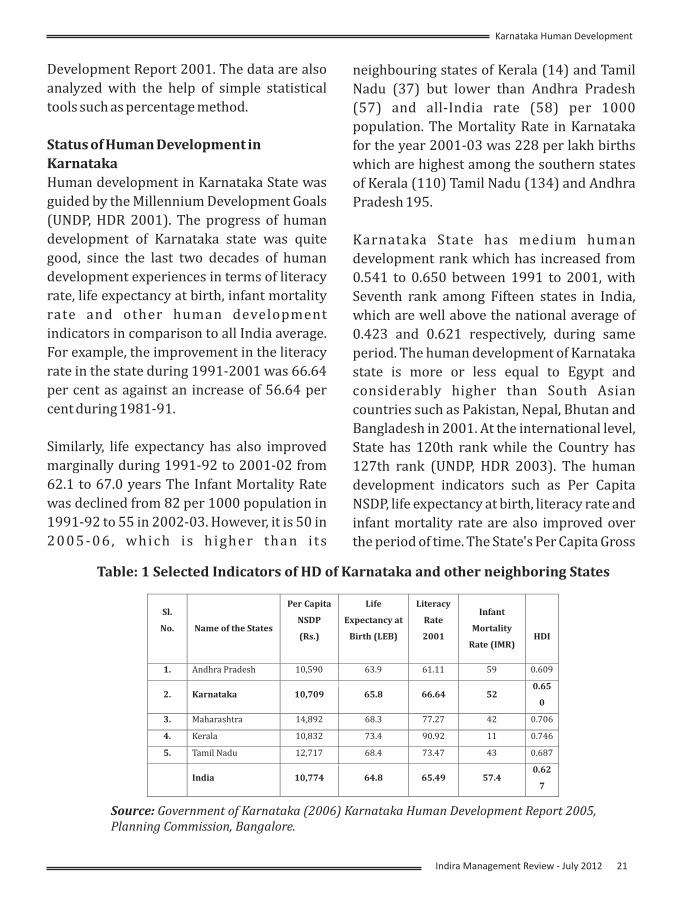
Table: 1 Selected Indicators of HD of Karnataka and other neighboring States
Source: Government of Karnataka (2006) Karnataka Human Development Report 2005, Planning Commission, Bangalore.
Indira Management Review - 21July 2012
Karnataka Human Development
The Table 1 presents selected indicators of
human development of Karnataka with other
neighboring states. It also infers relative human
development position of Karnataka State with
other neighbouring states such as Maharashtra,
Tamil Nadu, Kerala and Andhra Pradesh.
Karnataka has accounted for per capita NSDP of
Rs. 10,709, life expectancy at birth 65.8 years,
infant mortality rate has 52 per 1000 birth, and
literacy rate was 66.64 percent and HDI value of
0.650. While most of the neighboring states
except Andhra Pradesh were above Karnataka's
relative position in all respects.
According to National Human Development
Report (NHDR) published by the Planning
Commission, Karnataka state has improved HDI
values from 0.346, 0.412 and 0.478 during
1981, 1991 and 2001 respectively among the
fifteen major states of India and it ranked at
sixth in 1981 and seventh position in 1991 and
2001. (Planning Commission, GOK 2001). The
data on each of the indicators such as life
expectancy, literacy and income suggests,
however, Karnataka is placed above the all India
level but it still lags behind the neighbouring
states. Kerala is well ahead of Karnataka and
toped among other states followed by Tamil
Nadu and Maharashtra, in literacy and life
expectancy at birth, while Maharashtra is ahead
in LEB and income.
The GDI values of Karnataka State have
improved from 0.525 to 0.637 during 1991 to
2001 which was above the national average
with the value of 0.621 in 2001. Karnataka is the
sixth among fifteen major states in gender
development. At the international level,
Karnataka's rank in terms of the GDI was 99, as
against 103 among the 177 countries. When
compared with other neighbouring states
except Andhra Pradesh with 0.621, the State
like Kerala, Tamil Nadu and Maharashtra were
above the state average with value of 0.746,
0.706 and 0.687 respectively. Therefore,
Karnataka State has a long way to reach the high
human development states.
Role and Pattern of Public Expenditure on
Human Development
Public expenditure is likely to influence the
status of human development in several ways.
In the areas of health, nutrition, education,
public distribution system, social welfare and
other social services, public expenditure can
directly contribute to human development, if
appropriate public policies and programmes
are designed and adequate funds allocated.
Indirectly, public expenditure, influences the
pace and course of economic growth that
determines to a considerable extent, the
sustainability of development on the one hand
and funds available for spending on social
sectors on the other. (Streeten, 1979, Isenman
1980, Sen 1981, Bhalla & Glewwe 1986,
Kanbur 1991, Anand and Ravallion 1993,
Chakraborthy 2007).
The extent of public expenditure on human
development has been measured in UNDP's
Human Development Report 1991 and
studies have used four ratios to indicate the
priority assigned by states to expenditure on
human development. These Four ratio are:
1. The Public Expenditure Ratio (PER) -
Percentage of national income that goes into
public expenditure. For the states in India, it is
the percentage of NSDP that goes into public
expenditure.
22 Indira Management Review - July 2012
Karnataka Human Development
2. The Social Allocation Ratio (SAR) –
Percentage of the total expenditure
earmarked for social service sectors, such as
health, education, social security, water
supply and sanitation, is strongly and
positively correlated with progress in human
development. However, the social allocation
ratios do not guarantee a good human
development performance, but it makes an
i m p o r t a n t c o n t r i b u t i o n t o h u m a n
development.
3. The Social Priority Ratio (SPR) - Percentage
of national income devoted to human priority
concerns, such as elementary education,
public health, maternal and child health and
nutrition and rural water supply and
sanitation.
4. The Human Expenditure Ratio (HER) –
Percentage of the state income devoted to
human priority concerns. Hence by
definition, human expenditure ratio is the
product of the other three ratios. It is a
powerful operational tool that allows policy
makers who want to restructure their
budgets based on the existing imbalances and
available options.
Based on the experiences of a number of
countries that were associated with better
human development outcomes, UNDP, HDR
1991 suggested certain expenditure norms to
ensure human development. As for the
suggestions, HER of 5 percent is essential, if a
country has to do well on the human
development front. This may be achieved in
an efficient manner by keeping the PER
moderate (around Twenty-five percent),
allocating much of this to social sector (more
than Forty percent), and focusing on social
priority areas (giving them more than Fifty
percent). HER is a powerful operational tool
and it allows the policy makers to restructure
their budget, address any existing imbalances
and avail of the most appropriate options.
States with HER over Five percent are
supposed to indicate a good political
commitment from the Government to human
priority or social priority concerns. Those
states for which HER lies between three to five
percent have moderate human priority
concerns. The HER below 2 percent suggests
that lack of political commitment for human
priorities. In the post reforms periods, these
ratios do not show any radical improvement.
The Social Sector comprises expenditure on
broad budgetary heads called Social Services
and Rural Development Social Services
include subheads such as, (i) Education,
Sports, Art and Culture (ii) Medical and Public
Health (iii) Family Welfare (iv) Water Supply
and sanitation (v) Housing (vi) Urban
Development (vii) Welfare of Scheduled
Castes, Scheduled Tribes and other Backward
Castes (viii) Labour and Labour Welfare (ix)
Social Security and Welfare (x) Nutrition (xi)
Relief on Account of Natural Calamities (xii)
other Social Services. Further, within the
social sector, social priority areas are defined
which comprise elementary education, health
and family welfare (excluding medical
education, training and research), nutrition,
Indira Management Review - 23July 2012
Karnataka Human Development
Years
Public Expenditure
Ratio (PER)
Social Allocation
Ratio (SAR)
Social Priority Ratio
(SPR)
Human Expenditure
Ratio (HER)
1990-91 17.78 41.22 55.45 4.06
1991-92 17.61 40.20 53.72 3.80
1992-93 19.18 36.77 52.54 3.71
1993-94 18.45 39.50 54.03 3.94
1994-95 17.70 39.19 53.83 3.73
1995-96 17.79 37.62 51.94 3.48
1996-97 17.75 36.90 51.02 3.34
1997-98 16.73 38.40 51.99 3.34
1998-99 16.33 39.49 52.55 3.39
1999-2000 18.09 37.75 54.86 3.75
2000-01 18.22 37.89 52.84 3.65
2001-02 20.06 34.91 52.29 3.67
2002-03 18.83 34.36 50.69 3.28
water supply, sanitation and rural development. These sectors are particularly important for
human development.
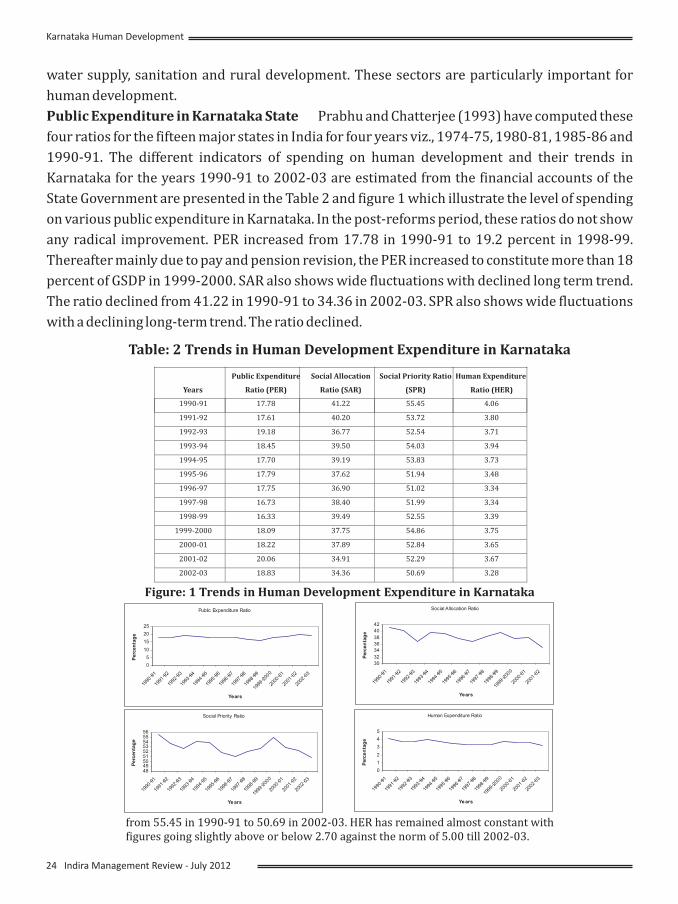
Public Expenditure in Karnataka State Prabhu and Chatterjee (1993) have computed these
four ratios for the fifteen major states in India for four years viz., 1974-75, 1980-81, 1985-86 and
1990-91. The different indicators of spending on human development and their trends in
Karnataka for the years 1990-91 to 2002-03 are estimated from the financial accounts of the
State Government are presented in the Table 2 and figure 1 which illustrate the level of spending
on various public expenditure in Karnataka. In the post-reforms period, these ratios do not show
any radical improvement. PER increased from 17.78 in 1990-91 to 19.2 percent in 1998-99.
Thereafter mainly due to pay and pension revision, the PER increased to constitute more than 18
percent of GSDP in 1999-2000. SAR also shows wide fluctuations with declined long term trend.
The ratio declined from 41.22 in 1990-91 to 34.36 in 2002-03. SPR also shows wide fluctuations
with a declining long-term trend. The ratio declined.
Table: 2 Trends in Human Development Expenditure in Karnataka
Public Expenditure Ratio
0
5
10
15
20
25
1990
-91
1991
-92
1992
-93
1993
-94
1994
-95
1995
-96
1996
-97
1997
-98
1998
-99
1999
-200
0
2000
-01
2001
-02
2002
-03
Years
Perc
en
tag
e
Social Allocation Ratio
30
32
34
36
38
40
42
1990
-91
1991
-92
1992
-93
1993
-94
1994
-95
1995
-96
1996
-97
1997
-98
1998
-99
1999
-200
0
2000
-01
2001
-02
Years
Perc
en
tag
e
Social Priority Ratio
484950515253545556
1990
-91
1991
-92
1992
-93
1993
-94
1994
-95
1995
-96
1996
-97
1997
-98
1998
-99
1999
-200
0
2000
-01
2001
-02
2002
-03
ars
Perc
en
tag
e
Ye
Human Expenditure Ratio
0
1
2
3
4
5
1990
-91
1991
-92
1992
-93
1993
-94
1994
-95
1995
-96
1996
-97
1997
-98
1998
-99
1999
-200
0
2000
-01
2001
-02
2002
-03
ars
Perc
en
tag
e
Ye
Figure: 1 Trends in Human Development Expenditure in Karnataka
from 55.45 in 1990-91 to 50.69 in 2002-03. HER has remained almost constant withfigures going slightly above or below 2.70 against the norm of 5.00 till 2002-03.
24 Indira Management Review - July 2012
Karnataka Human Development
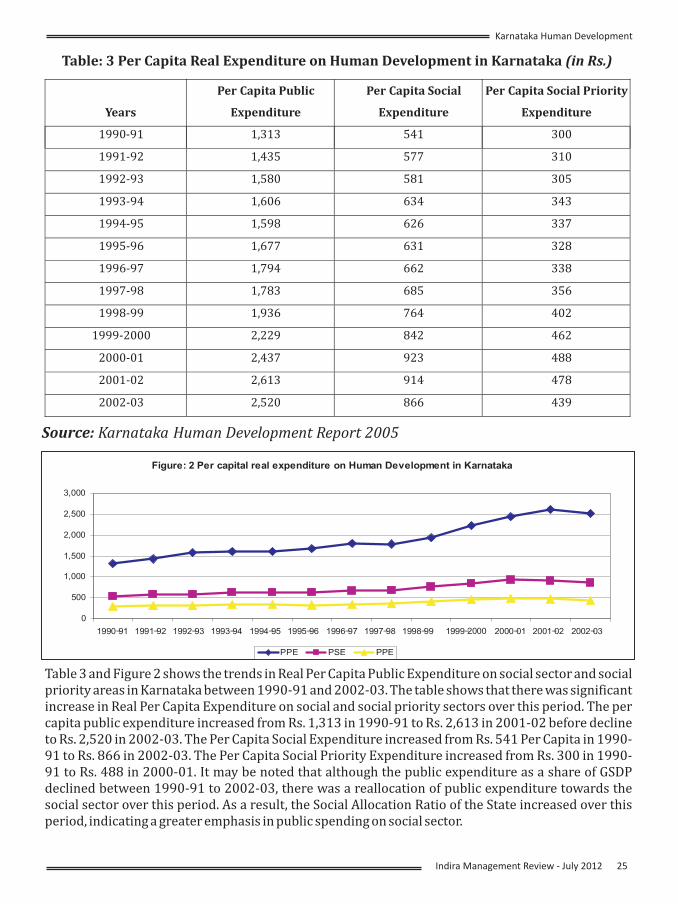
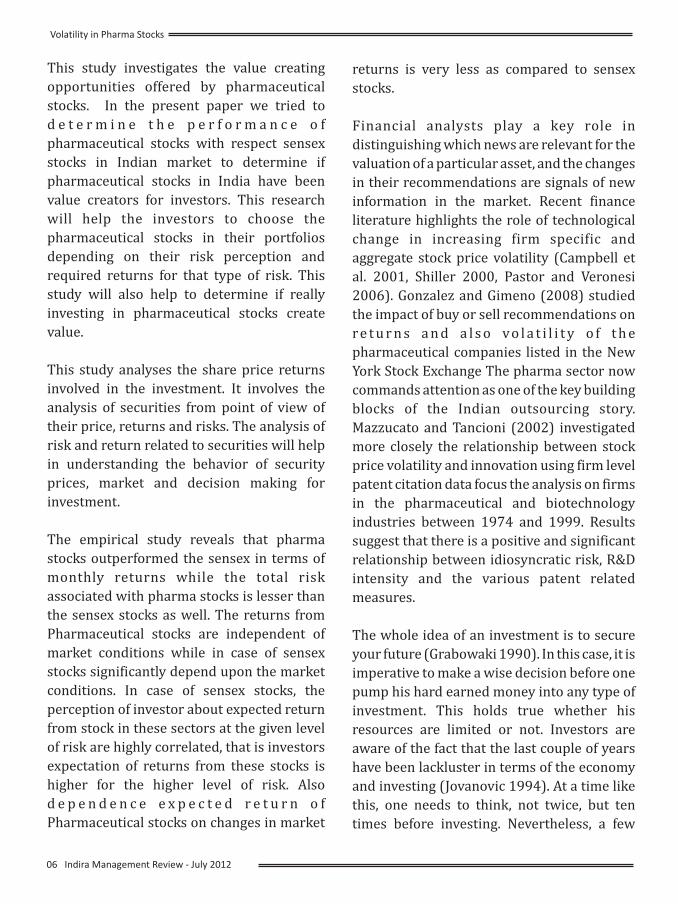
Table: 3 Per Capita Real Expenditure on Human Development in Karnataka (in Rs.)
Years
Per Capita Public
Expenditure
Per Capita Social
Expenditure
Per Capita Social Priority
Expenditure
1990-91 1,313 541 300
1991-92 1,435 577 310
1992-93 1,580 581 305
1993-94 1,606 634 343
1994-95 1,598 626 337
1995-96 1,677 631 328
1996-97 1,794 662 338
1997-98 1,783 685 356
1998-99 1,936 764 402
1999-2000 2,229 842 462
2000-01 2,437 923 488
2001-02 2,613 914 478
2002-03 2,520 866 439
Source: Karnataka Human Development Report 2005
Figure: 2 Per capital real expenditure on Human Development in Karnataka
0
500
1,000
1,500
2,000
2,500
3,000
1990-91 1991-92 1992-93 1993-94 1994-95 1995-96 1996-97 1997-98 1998-99 1999-2000 2000-01 2001-02 2002-03
PPE PSE PPE
Table 3 and Figure 2 shows the trends in Real Per Capita Public Expenditure on social sector and social priority areas in Karnataka between 1990-91 and 2002-03. The table shows that there was significant increase in Real Per Capita Expenditure on social and social priority sectors over this period. The per capita public expenditure increased from Rs. 1,313 in 1990-91 to Rs. 2,613 in 2001-02 before decline to Rs. 2,520 in 2002-03. The Per Capita Social Expenditure increased from Rs. 541 Per Capita in 1990-91 to Rs. 866 in 2002-03. The Per Capita Social Priority Expenditure increased from Rs. 300 in 1990-91 to Rs. 488 in 2000-01. It may be noted that although the public expenditure as a share of GSDP declined between 1990-91 to 2002-03, there was a reallocation of public expenditure towards the social sector over this period. As a result, the Social Allocation Ratio of the State increased over this period, indicating a greater emphasis in public spending on social sector.
Indira Management Review - 25July 2012
Karnataka Human Development
States Public
Expenditure Ratio
Social Allocation
Ratio
Social Priority Ratio Human Expenditure
Ratio
Andhra Pradesh 18.86 36.43 54.14 3.72
Bihar 24.47 35.47 69.12 6.00
Gujarat 17.69 39.80 35.46 2.50
Haryana 17.17 29.55 49.38 3.51
Karnataka 20.06 34.96 52.29 3.67
Kerala 16.18 39.33 50.88 3.24
Madhya Pradesh 17.66 39.49 55.76 3.89
Maharashtra 15.43 36.46 54.42 3.06
Orissa 25.45 34.96 55.59 4.94
Punjab 19.63 23.25 38.27 1.75
Rajasthan 19.95 42.73 61.58 5.25
Tamil Nadu 15.85 38.19 52.14 3.16
Uttar Pradesh 18.97 31.97 65.09 3.95
West Bengal 16.83 35.72 44.24 2.66
Table: 4 Human Development Expenditure in Major States in India during 2002-03
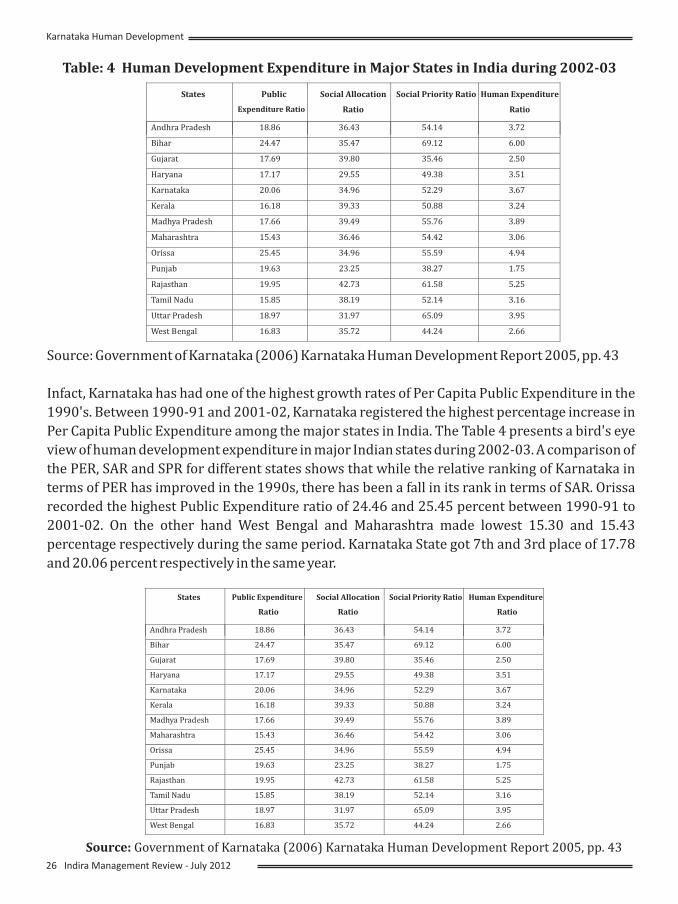
Source: Government of Karnataka (2006) Karnataka Human Development Report 2005, pp. 43
Infact, Karnataka has had one of the highest growth rates of Per Capita Public Expenditure in the
1990's. Between 1990-91 and 2001-02, Karnataka registered the highest percentage increase in
Per Capita Public Expenditure among the major states in India. The Table 4 presents a bird's eye
view of human development expenditure in major Indian states during 2002-03. A comparison of
the PER, SAR and SPR for different states shows that while the relative ranking of Karnataka in
terms of PER has improved in the 1990s, there has been a fall in its rank in terms of SAR. Orissa
recorded the highest Public Expenditure ratio of 24.46 and 25.45 percent between 1990-91 to
2001-02. On the other hand West Bengal and Maharashtra made lowest 15.30 and 15.43
percentage respectively during the same period. Karnataka State got 7th and 3rd place of 17.78
and 20.06 percent respectively in the same year.
States Public Expenditure
Ratio
Social Allocation
Ratio
Social Priority Ratio Human Expenditure
Ratio
Andhra Pradesh 18.86 36.43 54.14 3.72
Bihar 24.47 35.47 69.12 6.00
Gujarat 17.69 39.80 35.46 2.50
Haryana 17.17 29.55 49.38 3.51
Karnataka 20.06 34.96 52.29 3.67
Kerala 16.18 39.33 50.88 3.24
Madhya Pradesh 17.66 39.49 55.76 3.89
Maharashtra 15.43 36.46 54.42 3.06
Orissa 25.45 34.96 55.59 4.94
Punjab 19.63 23.25 38.27 1.75
Rajasthan 19.95 42.73 61.58 5.25
Tamil Nadu 15.85 38.19 52.14 3.16
Uttar Pradesh 18.97 31.97 65.09 3.95
West Bengal 16.83 35.72 44.24 2.66
Source: Government of Karnataka (2006) Karnataka Human Development Report 2005, pp. 43
26 Indira Management Review - July 2012
Karnataka Human Development
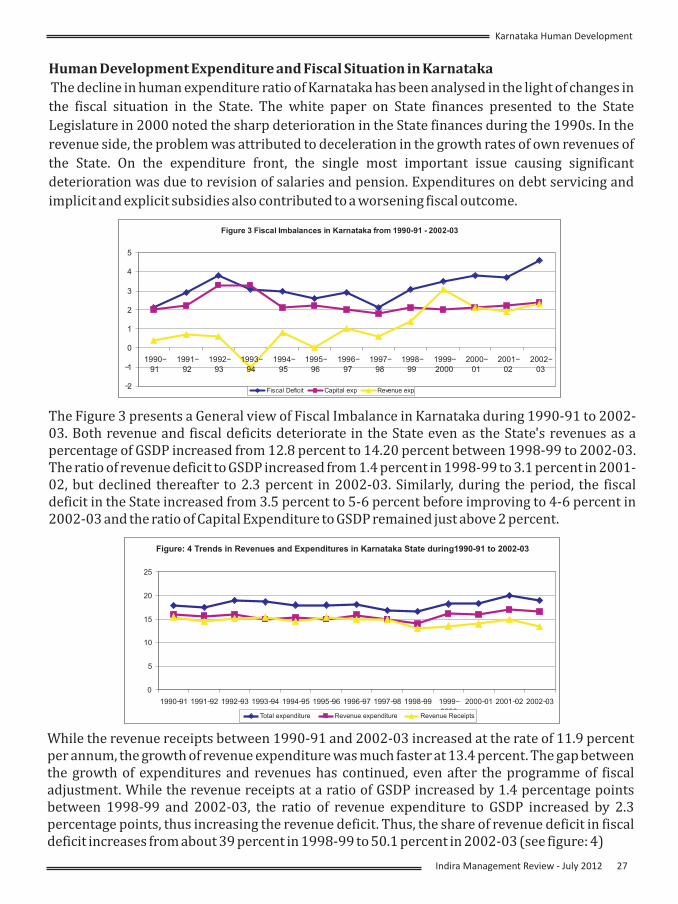
Figure 3 Fiscal Imbalances in Karnataka from 1990-91 - 2002-03
-2
-1
0
1
2
3
4
5
1990-91
1991-92
1992-93
1993-94
1994-95
1995-96
1996-97
1997-98
1998-99
1999-2000
2000-01
2001-02
2002-03
Fiscal Deficit Capital exp Revenue exp
The Figure 3 presents a General view of Fiscal Imbalance in Karnataka during 1990-91 to 2002-03. Both revenue and fiscal deficits deteriorate in the State even as the State's revenues as a percentage of GSDP increased from 12.8 percent to 14.20 percent between 1998-99 to 2002-03. The ratio of revenue deficit to GSDP increased from 1.4 percent in 1998-99 to 3.1 percent in 2001-02, but declined thereafter to 2.3 percent in 2002-03. Similarly, during the period, the fiscal deficit in the State increased from 3.5 percent to 5-6 percent before improving to 4-6 percent in 2002-03 and the ratio of Capital Expenditure to GSDP remained just above 2 percent.
Figure: 4 Trends in Revenues and Expenditures in Karnataka State during1990-91 to 2002-03
0
5
10
15
20
25
1990-91
1991-92
1992-93
1993-94
1994-95 1995-96 1996-97 1997-98 1998-99 1999-
2000
2000-01
2001-02 2002-03
Total expenditure Revenue expenditure Revenue Receipts
While the revenue receipts between 1990-91 and 2002-03 increased at the rate of 11.9 percent per annum, the growth of revenue expenditure was much faster at 13.4 percent. The gap between the growth of expenditures and revenues has continued, even after the programme of fiscal adjustment. While the revenue receipts at a ratio of GSDP increased by 1.4 percentage points between 1998-99 and 2002-03, the ratio of revenue expenditure to GSDP increased by 2.3 percentage points, thus increasing the revenue deficit. Thus, the share of revenue deficit in fiscal deficit increases from about 39 percent in 1998-99 to 50.1 percent in 2002-03 (see figure: 4)
Human Development Expenditure and Fiscal Situation in Karnataka
The decline in human expenditure ratio of Karnataka has been analysed in the light of changes in
the fiscal situation in the State. The white paper on State finances presented to the State
Legislature in 2000 noted the sharp deterioration in the State finances during the 1990s. In the
revenue side, the problem was attributed to deceleration in the growth rates of own revenues of
the State. On the expenditure front, the single most important issue causing significant
deterioration was due to revision of salaries and pension. Expenditures on debt servicing and
implicit and explicit subsidies also contributed to a worsening fiscal outcome.
Indira Management Review - 27July 2012
Karnataka Human Development
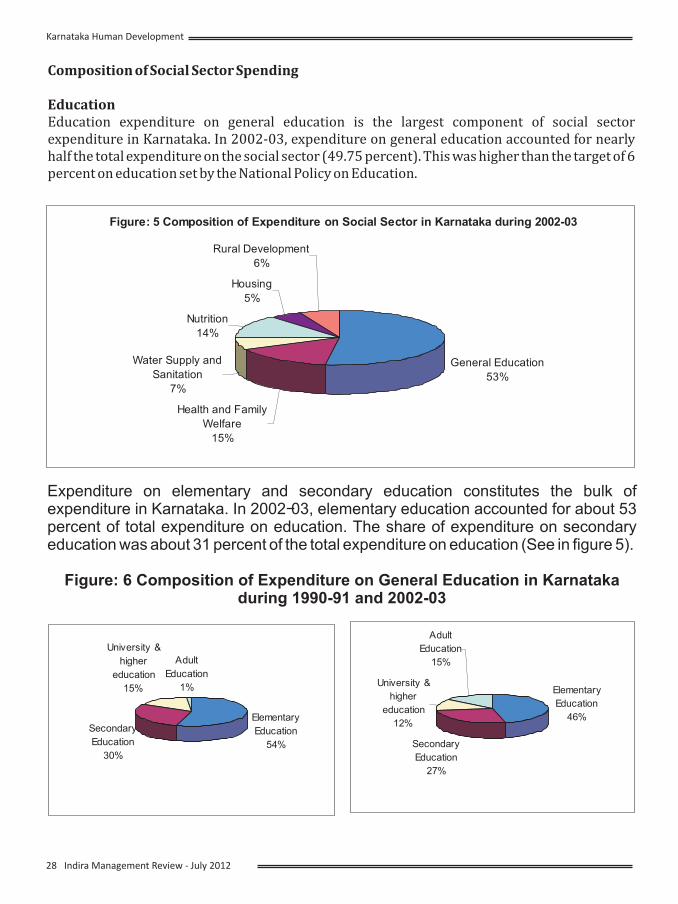
Composition of Social Sector Spending
EducationEducation expenditure on general education is the largest component of social sector expenditure in Karnataka. In 2002-03, expenditure on general education accounted for nearly half the total expenditure on the social sector (49.75 percent). This was higher than the target of 6 percent on education set by the National Policy on Education.
Figure: 5 Composition of Expenditure on Social Sector in Karnataka during 2002-03
General Education
53%
Health and Family
Welfare
15%
Water Supply and
Sanitation
7%
Nutrition
14%
Housing
5%
Rural Development
6%
Elementary
Education
54%
Secondary
Education
30%
University &
higher
education
15%
Adult
Education
1% Elementary
Education
46%
Secondary
Education
27%
University &
higher
education
12%
Adult
Education
15%
Expenditure on elementary and secondary education constitutes the bulk of expenditure in Karnataka. In 2002-03, elementary education accounted for about 53 percent of total expenditure on education. The share of expenditure on secondary education was about 31 percent of the total expenditure on education (See in figure 5).
Figure: 6 Composition of Expenditure on General Education in Karnataka during 1990-91 and 2002-03
28 Indira Management Review - July 2012
Karnataka Human Development
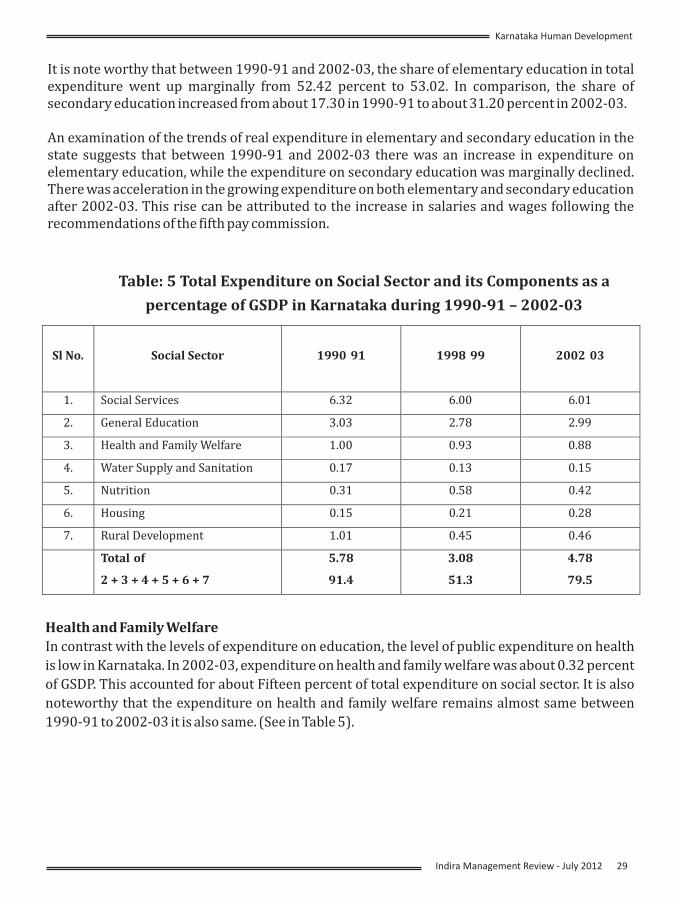
It is note worthy that between 1990-91 and 2002-03, the share of elementary education in total expenditure went up marginally from 52.42 percent to 53.02. In comparison, the share of secondary education increased from about 17.30 in 1990-91 to about 31.20 percent in 2002-03.
An examination of the trends of real expenditure in elementary and secondary education in the state suggests that between 1990-91 and 2002-03 there was an increase in expenditure on elementary education, while the expenditure on secondary education was marginally declined. There was acceleration in the growing expenditure on both elementary and secondary education after 2002-03. This rise can be attributed to the increase in salaries and wages following the recommendations of the fifth pay commission.
Table: 5 Total Expenditure on Social Sector and its Components as a
percentage of GSDP in Karnataka during 1990-91 – 2002-03
Sl No. Social Sector 1990 91 1998 99 2002 03
1. Social Services 6.32 6.00 6.01
2. General Education 3.03 2.78 2.99
3. Health and Family Welfare 1.00 0.93 0.88
4. Water Supply and Sanitation 0.17 0.13 0.15
5. Nutrition 0.31 0.58 0.42
6. Housing 0.15 0.21 0.28
7. Rural Development 1.01 0.45 0.46
Total of
2 + 3 + 4 + 5 + 6 + 7
5.78
91.4
3.08
51.3
4.78
79.5
Health and Family Welfare
In contrast with the levels of expenditure on education, the level of public expenditure on health
is low in Karnataka. In 2002-03, expenditure on health and family welfare was about 0.32 percent
of GSDP. This accounted for about Fifteen percent of total expenditure on social sector. It is also
noteworthy that the expenditure on health and family welfare remains almost same between
1990-91 to 2002-03 it is also same. (See in Table 5).
Indira Management Review - 29July 2012
Karnataka Human Development
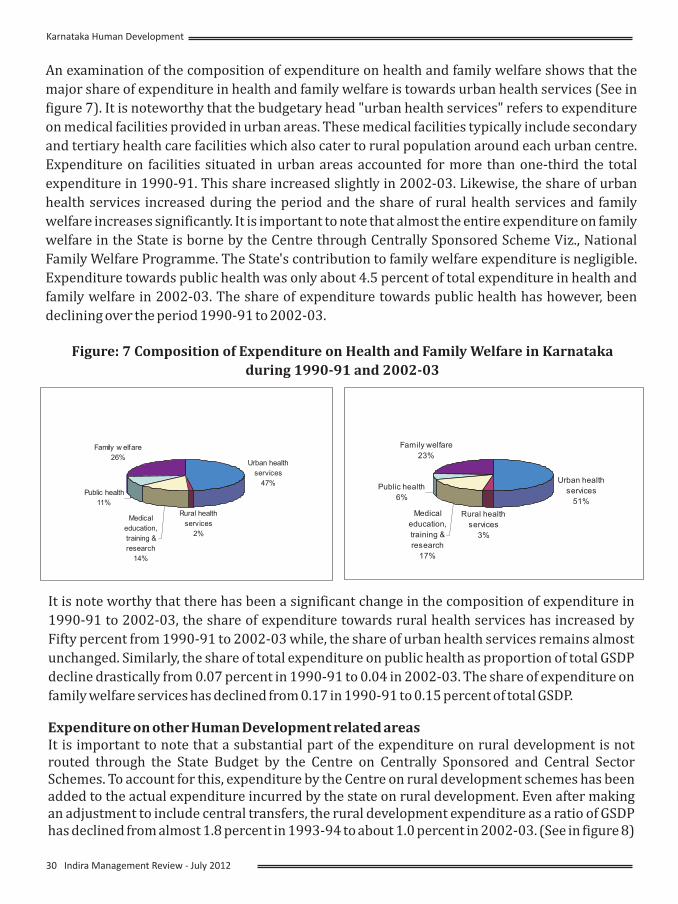
An examination of the composition of expenditure on health and family welfare shows that the
major share of expenditure in health and family welfare is towards urban health services (See in
figure 7). It is noteworthy that the budgetary head "urban health services" refers to expenditure
on medical facilities provided in urban areas. These medical facilities typically include secondary
and tertiary health care facilities which also cater to rural population around each urban centre.
Expenditure on facilities situated in urban areas accounted for more than one-third the total
expenditure in 1990-91. This share increased slightly in 2002-03. Likewise, the share of urban
health services increased during the period and the share of rural health services and family
welfare increases significantly. It is important to note that almost the entire expenditure on family
welfare in the State is borne by the Centre through Centrally Sponsored Scheme Viz., National
Family Welfare Programme. The State's contribution to family welfare expenditure is negligible.
Expenditure towards public health was only about 4.5 percent of total expenditure in health and
family welfare in 2002-03. The share of expenditure towards public health has however, been
declining over the period 1990-91 to 2002-03.
Urban health
services
47%
Rural health
services
2%
Medical
education,
training &
research
14%
Public health
11%
Family w elfare
26%
Urban health
services
51%
Rural health
services
3%
Medical
education,
training &
research
17%
Public health
6%
Family welfare
23%
It is note worthy that there has been a significant change in the composition of expenditure in
1990-91 to 2002-03, the share of expenditure towards rural health services has increased by
Fifty percent from 1990-91 to 2002-03 while, the share of urban health services remains almost
unchanged. Similarly, the share of total expenditure on public health as proportion of total GSDP
decline drastically from 0.07 percent in 1990-91 to 0.04 in 2002-03. The share of expenditure on
family welfare services has declined from 0.17 in 1990-91 to 0.15 percent of total GSDP.
Figure: 7 Composition of Expenditure on Health and Family Welfare in Karnataka
during 1990-91 and 2002-03
Expenditure on other Human Development related areasIt is important to note that a substantial part of the expenditure on rural development is not routed through the State Budget by the Centre on Centrally Sponsored and Central Sector Schemes. To account for this, expenditure by the Centre on rural development schemes has been added to the actual expenditure incurred by the state on rural development. Even after making an adjustment to include central transfers, the rural development expenditure as a ratio of GSDP has declined from almost 1.8 percent in 1993-94 to about 1.0 percent in 2002-03. (See in figure 8)
30 Indira Management Review - July 2012
Karnataka Human Development
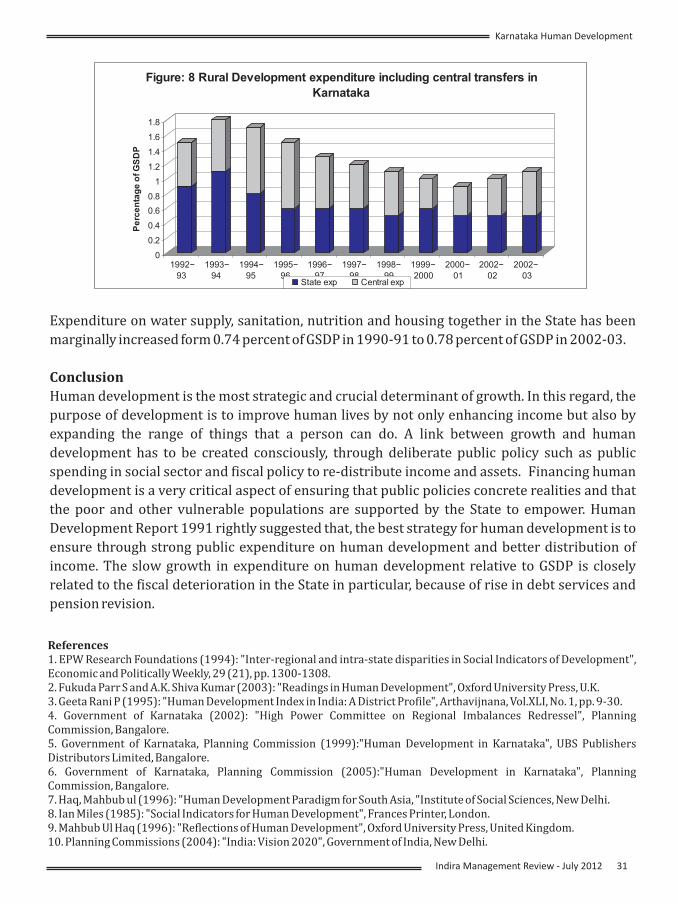
0
0.2
0.4
0.6
0.8
1
1.2
1.4
1.6
1.8
Pe
rce
nta
ge
of G
SD
P
1992-
93 94 95 96 97 98 99 2000 01 02 03
1993- 1994- 1995- 1996- 1997- 1998- 1999- 2000- 2002- 2002-
igure: 8 Rural Development expenditure including central transfers in
Karnataka
F
State exp Central exp
Expenditure on water supply, sanitation, nutrition and housing together in the State has been
marginally increased form 0.74 percent of GSDP in 1990-91 to 0.78 percent of GSDP in 2002-03.
Conclusion
Human development is the most strategic and crucial determinant of growth. In this regard, the
purpose of development is to improve human lives by not only enhancing income but also by
expanding the range of things that a person can do. A link between growth and human
development has to be created consciously, through deliberate public policy such as public
spending in social sector and fiscal policy to re-distribute income and assets. Financing human
development is a very critical aspect of ensuring that public policies concrete realities and that
the poor and other vulnerable populations are supported by the State to empower. Human
Development Report 1991 rightly suggested that, the best strategy for human development is to
ensure through strong public expenditure on human development and better distribution of
income. The slow growth in expenditure on human development relative to GSDP is closely
related to the fiscal deterioration in the State in particular, because of rise in debt services and
pension revision.
References1. EPW Research Foundations (1994): "Inter-regional and intra-state disparities in Social Indicators of Development", Economic and Politically Weekly, 29 (21), pp. 1300-1308. 2. Fukuda Parr S and A.K. Shiva Kumar (2003): "Readings in Human Development", Oxford University Press, U.K.3. Geeta Rani P (1995): "Human Development Index in India: A District Profile", Arthavijnana, Vol.XLI, No. 1, pp. 9-30.4. Government of Karnataka (2002): "High Power Committee on Regional Imbalances Redressel", Planning Commission, Bangalore.5. Government of Karnataka, Planning Commission (1999):"Human Development in Karnataka", UBS Publishers Distributors Limited, Bangalore. 6. Government of Karnataka, Planning Commission (2005):"Human Development in Karnataka", Planning Commission, Bangalore. 7. Haq, Mahbub ul (1996): "Human Development Paradigm for South Asia, "Institute of Social Sciences, New Delhi. 8. Ian Miles (1985): "Social Indicators for Human Development", Frances Printer, London. 9. Mahbub Ul Haq (1996): "Reflections of Human Development", Oxford University Press, United Kingdom.10. Planning Commissions (2004): "India: Vision 2020", Government of India, New Delhi.
Indira Management Review - 31July 2012
Karnataka Human Development
A Cross Section Study Of Demand For Working Capital In The Automobile Industry
Dr. A. Vijayakumar*
(*Associate Professor in Commerce, Erode Arts and Science College Erode-638009. Tamilnadue.mail: [email protected])
ABSTRACT
The aim of the study is to determine
empirically whether transactions of working
capital balances including cash and
inventories vary proportionately or less than
proportionately to changes in the volume of
sales. The study also describes the effect of
capital costs on working capital holdings of
the selected companies in the Indian
automobile industry. The results of the study
showed that Indian automobile industry and
its three sectors need to hold working capital
balances depends not only on sales but on
holding costs also.
KEYWORDS : Indian Automobile Industry,
Demand for Working Capital, Receivables,
Inventory and Cash Management.
INTRODUCTION
Fixed capital and working capital are the
dominant contributors to the total capital of a
d e ve l o p i n g c o u n t r y. F i xe d c a p i t a l
investments generate production capacity
whereas working capital makes the
utilisation of that capacity possible.
Especially in small firms, working capital
management may be the factor that decides
success or failure; in larger firms, efficient
w o r k i n g c a p i t a l m a n a g e m e n t c a n
significantly affect the firms' risk, return and
share price. A firm can exist and survive
without fixed capital, but cannot survive
without working capital. Management of
working capital has acquired a great
significance and sound position for the twin
objects of profitability and liquidity. In a
period of rising capital costs and scarce funds,
the working capital is one of the most
important areas requiring management
review. It consumes a great deal of time to
increase profitability as well as to maintain
proper liquidity at minimum risk. Viewed in
this perspective, the study devoted to working
capital management may be very rewarding
one.
Review of Literature
Interest in the study of the demand for
working by Indian Automobile Industry has
been stimulated by the empirical works on the
demand for cash and inventories. A review of
the empirical works on the demand for cash
showed that the Post - Keynesian revival of
interest in the demand function for cash has
followed two distinct paths. Frazer, Nadiri and
Coates observed economics of scale thereby
supporting Baumol and Tobin, while Meltzer,
Whalen, De Allessi and Vogel and Maddala
observed diseconomies of scale thereby
supporting Friedman as far as the transactions
demand for cash is concerned. Similarly, there
are no unanimous findings as regards the
effect of capital costs on the demand for cash.
Among others, Selden De Allessi, Nadiri and
Coates showed the statistically significant
effect of capital costs on the demand for cash.
Like studies on the demand for cash the earlier
studies on the demand for inventories also did
32 Indira Management Review - July 2012
not present unanimous findings. Albert et al,
Liu Kuznets, Lieberman, Irvine and Akhtar
observed significant effects of capital costs on
the demand for inventories, while Terleckyj,
Robinson, McGouldrick, Lovell, Joyee,
Burrows and Maccini and Rossana did not
observe the same. Similarly, some reported
economies of scale with respect to holding
inventories, while others did not report the
same. Controversy also exists with respect to
coefficients of adjustment. Among others,
Lovell and Grossman noticed the slow speed
of adjustment between actual inventories and
target inventories, while Goodwin, Burrows,
and Maccini and Rossana did not find the
same.
STATEMENT OF THE PROBLEM
It has therefore become difficult to support
one view or another in the context of Indian
Automobile Industry. However, investigation
in this study is not limited to the study of the
demand for cash and inventories only. It has
been extended to test whether models similar
to those explaining the demand for cash and
inventories also explain the demand for
receivables, and gross and net working
capital. The purpose of this study is that to
determine empirically whether transactions
working capital balances including cash and
inventories vary proportionately or less than
in proportion to changes in the volume of
sales. It also describes the effect of capital
costs on working capital holdings of the
enterprises. Further, the study also takes in to
account a Partial Adjustment Model of
working capital behavior. The partial
adjustment or flexible accelerator models
that explain the speed with which the actual
level of working capital balance is adjusted to
the desired level.
METHODOLOGY
Econometric Model
In this study, econometric models are used to
describe the demand for working capital and
its various components by Indian automobile
companies. The decisions about the aggregate
amount of working capital and its various
components to be held may be regard as
subject to wealth constraint and opportunity
cost of working capital . As a f irst
approximation to the theory, the functions
may be written as
Where
y = Real Cash1
y = Real Inventories 2
y = Real Receivables3
y = Real Gross working capital4
y = Real Net working capital 5
S = Real Sales in terms of S – 1t
C = Opportunity cost of working
capital measured by short – term interest rates
of Indian commercial banks.
In an empirical investigation, it takes the form.
y1 = f (s, i) (i)y2 = f (s, i) (ii)y3 = f (s, i) (iii)y4 = f (s, i) (iv)y5 = f (s, i) (v)
where u is assumed to be independently and normally distributed. Taking the natural logarithm
uY KS i e ......................(vi)b b* 1 21=
..(vii)Ln Y K b Ln S b Ln i u ..........2 21* = + + +
Indira Management Review - 33 July 2012
Cross Section Study of Working Capital Demand in Auto Industry
Where b1 and b2 are elasticity's of y* with respect to the explanatory variables of the model. The above models assume reasonable a priori hypothesis of
∂ ∂y / s > 0 and y / i>∂ ∂2 0<
Partial - Adjustment model In estimating the above equations, the study also takes in to account a partial adjustment or flexible accelerator model of working capital behaviour. This model hypothesizes that each enterprise has a desired target level of working capital and that of each enterprise, finding its actual working capital not equal to its optimum, attempts only a partial adjustment towards the optimum level within any one period. The models indicate the speed with which firms adjust their actual working capital balances to the desired working capital balances.
The simplest assumption to make about the adjustment process on working capital balances is that
Substituting expression (viii) for desired level of working capital balances into equation (vii) gives
.........(viii)e ..........y
ut
y t 1
t
t 1
t
??????=
--
yö
* ?y ?
Where ö- rate of adjustment or adjustment
0 < ö< 1
ix)e .................u
y y t 1
t 2
t 1
t
??????=
--
Taking logs of this equation gives
..(
ö1 iKS
b b2? ?y
y U ..............(x)Ln i öLnLn S öböbLny öLnbLny
(or)t 1 t0 1 t 2 2 +t 1 -+ --- = +t
( )Ln y U ..............(X)öLny C C Ln S C Ln i 1 tt 10 1 t 2 2 +t = + - + - -
coefficient
where C1 and C2 are the short - term elasticity's of working capital or its components with respect to sales and their opportunity cost, respectively. The long run elasticity's with respect to sales and cost are b1 and b2
Since C and1 2 b2 öC = 1 ö= b
b1 =ö
C1
and b2 =ö
ö- the rate of adjustme ffici nt
C2
nt coe e
The long - run elasticity's of cash with respect to sales and the opportunity cost of cash should be approximately equal to 0.5 and - 0.5, respectively if the Baumol model is correct.
SAMPLE DESIGNKeeping in view the scope of the study, it is decided to include all the companies under automobile industry working before or from the year 1996-97 to 2008-09. There are 26 companies operating in the Indian automobile industry. But, owing to several constraints such as non-availability of financial statements or non-working of a company in a particular year etc., it is compelled to restrict the number of sample companies to 20. The companies under automobile industry are classified into three sectors namely; Commercial vehicles, Passenger Cars and Multiutility vehicles and Two and Three wheelers. For the purpose of the study all the three sectors have been selected. It accounts for 73.23 per cent of the total companies available in the Indian automobile industry. The selected 20 companies include 5 under commercial vehicles, 6 under Passenger cars and Multiutility vehicles and 9 under two and three wheeler sectors. It is inferred that sample company represents 98.74 percentage of market share in commercial vehicles, 89.76 percentage of market share in Passenger Cars and Multiutility vehicles and 99.81 percentage
34 Indira Management Review - July 2012
Cross Section Study of Working Capital Demand in Auto Industry
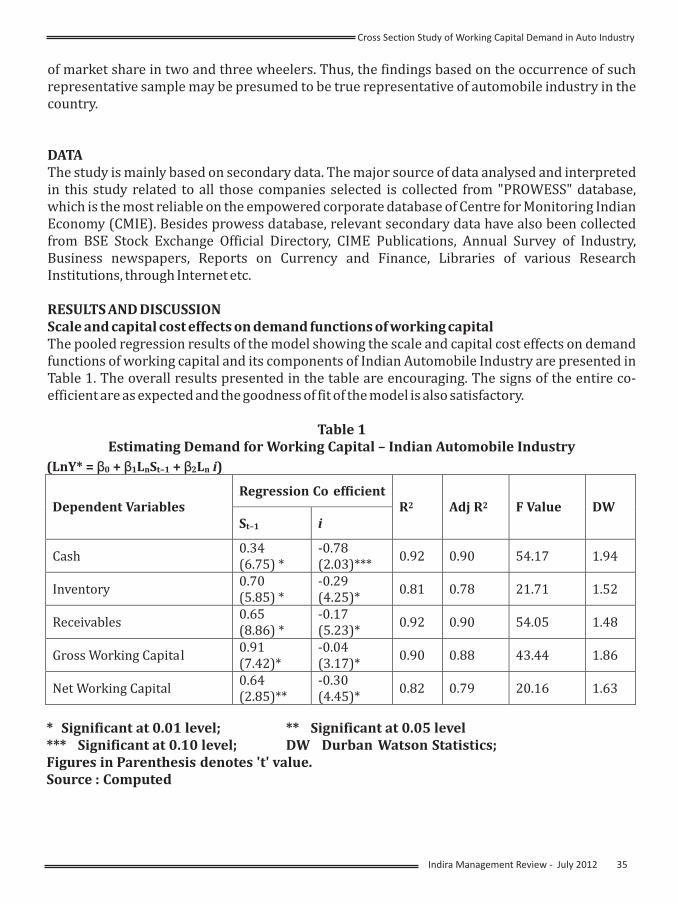
of market share in two and three wheelers. Thus, the findings based on the occurrence of such representative sample may be presumed to be true representative of automobile industry in the country.
DATAThe study is mainly based on secondary data. The major source of data analysed and interpreted in this study related to all those companies selected is collected from "PROWESS" database, which is the most reliable on the empowered corporate database of Centre for Monitoring Indian Economy (CMIE). Besides prowess database, relevant secondary data have also been collected from BSE Stock Exchange Official Directory, CIME Publications, Annual Survey of Industry, Business newspapers, Reports on Currency and Finance, Libraries of various Research Institutions, through Internet etc.
RESULTS AND DISCUSSIONScale and capital cost effects on demand functions of working capital The pooled regression results of the model showing the scale and capital cost effects on demand functions of working capital and its components of Indian Automobile Industry are presented in Table 1. The overall results presented in the table are encouraging. The signs of the entire co-efficient are as expected and the goodness of fit of the model is also satisfactory.
Table 1Estimating Demand for Working Capital – Indian Automobile Industry
(LnY* = â0 + â1LnSt–1 + â2Ln i)
Regression Co efficientDependent Variables
St–1 iR2 Adj R2 F Value DW
Cash0.34(6.75) *
-0.78(2.03)***
0.92 0.90 54.17 1.94
Inventory0.70(5.85) *
-0.29(4.25)*
0.81 0.78 21.71 1.52
Receivables0.65(8.86) *
-0.17(5.23)*
0.92 0.90 54.05 1.48
Gross Working Capital0.91(7.42)*
-0.04(3.17)*
0.90 0.88 43.44 1.86
Net Working Capital0.64(2.85)**
-0.30(4.45)*
0.82 0.79 20.16 1.63
* Significant at 0.01 level; ** Significant at 0.05 level*** Significant at 0.10 level; DW Durban Watson Statistics;Figures in Parenthesis denotes 't' value.Source : Computed
Indira Management Review - 35 July 2012
Cross Section Study of Working Capital Demand in Auto Industry
It is evident from the Table 1 that the co-efficient of sales are highly significant and indicated that higher sales increases working capital and its components. The sales elasticity varies from 0.34 for cash to 0.91 for gross working capital. Thus, the sales elasticity is smallest for cash, followed by net working capital, receivables, inventory and gross working capital. This elasticity's are consistently less than unity in all cases, suggesting economies of scale. This finding seems to support the theoretical propositions of Baumol, Tobin, Frazer, Nadiri and Coates and contradict the propositions of Friedman, Meltzer, Whalen, De Allessi and Vogel and Maddala, as far as the demand for cash by the Indian Automobile Industry is concerned. Similarly, the results, seem to support the findings of Akhtar and Irvine, among others, and contradict unitary or more than unitary sales elasticity noticed in some of the equations of Liberman showing the demand for inventories is concerned.
Table 1 also showed that fluctuations in cash and inventory levels depend in a statistically significant manner on fluctuations in their financial carrying costs. This finding is consistent with the results of Seldom, De Allessi, Nadiri, and Coates and contradicts Friedman's so far as the effect of capital costs on cash holding is concerned. Similarly, the finding supports the conclusion of Albert et al., Liu, Kuznets, Lieberman, Irvine and Akhtar and contradicts the results of Terlekyj, Robinson, Lovell, Jon Joyce and Maccini and Rossana as far as the effect of interest cost on inventory demand is concerned.
The estimated elasticity's of the target levels of working capital and its components with respect to capital costs measure indicate that the target level of cash is much more sensitive to capital cost fluctuations as compared to the target level of inventory, receivables and gross and net
working capital. Among, these, the target level of gross working capital is least sensitive to fluctuations in capital costs. It all be seen from the interest rate elasticity of 0.78 for cash, 0.30 for net working capital, 0.29 for inventory, 0.17 for receivables and 0.04 for gross working capital.
Holding the sales constant, Table 1 indicates that a one percentage point increase interest rate leads on an average to about 0.78 per cent decline in the cash balances. Similarly, this kind of decline is noticed to be about 0.29 per cent for inventory, 0.17 per cent for receivables, 0.04 per cent for gross working capital and 0.30 per cent for net working capital balances when there is a one percentage point increase in interest rate. In the same way, holding the interest rate constant, a one percentage point increase in sales leads on an average to about 0.34 per cent increase in cash balances. This kind of increase is noticed to be about 0.70 per cent for inventory, 0.65 per cent for receivables, 0.91 per cent for gross working capital and 0.64 per cent for net working capital. The increase in target cash, receivables, inventories and gross and net working capital as a whole due to the increase in the capital cost may mean higher production and higher employment.
The estimated regression results of Partial Adjustment Model of Indian Automobile Industry are presented in Table 2. The regression results indicated that co-efficient of are significant in all the cases. The coefficient of the lagged dependent variable has been observed to be 0.27 for cash, 0.46 for inventory, 0.51 for receivables, 0.34 for gross working capital and 0.28 for net working capital. Since the coefficient of lag is equal to 1 minus the adjustment coefficients , the adjustment coefficient is equal to 0.73 for cash, 0.54 for inventory, 0.49 for receivables,
36 Indira Management Review - July 2012
Cross Section Study of Working Capital Demand in Auto Industry
0.66 for gross working capital and 0.72 for net working capital. It seems that 73 per cent of the adjustment of actual to desired real cash balances is completed within one year. Similarly, the adjustment speed of actual to desired balances is 54 per cent for inventory, 49 per cent for receivables, 66 per cent for gross working capital and 72 per cent for net working capital. The speed of adjustment is however highest for cash followed by net working capital, gross working capital, Inventory and receivables.
Table 2Partial Adjustment Model – Indian Automobile Industry
(LnY* = â0 + â1LnSt–1 + â2Ln i + (1 – ö)Ln Yt–1 + u)
Regression Co efficientDependent Variables
St–1 i Yt1
R2 Adj R2 F Value DW
Cash0.36(4.77)*
-0.59(3.16)*
0.27(6.81)*
0.94 0.92 44.89 1.52
Inventory0.34(2.89)**
-0.43(3.61)*
0.46(4.86)*
0.82 0.76 13.60 1.96
Receivables0.61(4.46)*
-0.11(2.80)**
0.51(6.04)*
0.91 0.88 30.82 1.64
Gross Working Capital0.58(3.82)*
-0.09(4.16)*
0.34(3.86)*
0.90 0.87 27.50 1.89
Net Working Capital0.23(2.84)*
-0.37(4.07)*
0.28(4.26)*
0.81 0.79 12.96 1.19
* Significant at 0.01 level; ** Significant at 0.05 level*** Significant at 0.10 level;DW Durban Watson Statistics;Figures in Parenthesis denotes 't' value.
Source : Computed.In the partial adjustment models, the estimated coefficients of the independent variables are equal to the elasticity's of these variables times the adjustment coefficient. These long-run elasticizes are 0.49 for sales and 0.81 for short-term interest rates with respect to cash; 0.63 and 0.80 with respect to inventory; 1.24 and 0.22 with respect to receivables; 0.88 and 0.13 with respect to gross working capital; and 0.32 and 0.51 with respect to net working capital.
ConclusionThe pooled regression results of this analysis contradict unitary or more than unitary sales elasticity hypothesis of Friedman, Meltzer, Whalen, De Allessi and Vogel and Maddala with respect to demand for cash by all the three sectors and the whole Indian automobile industry. The presence of economies of scale in cash holdings is consistent with the conclusion of Baumol, Tobin, Frazer, Nadiri and Coates. The demand for inventory equations showed economies of scale in inventory thereby supporting the findings of Akhtar and Irvine and contradicts the findings of Lieberman. The presence of economies of scale has also been observed for receivables, gross working capital and net working capital. The regression results also show that the levels of working capital and its components of Indian automobile industry desires to hold depend not only on sales but on holding costs also. The capital cost coefficients are all statistically significant with the theoretically correct signs. This finding is consistent with the findings of Selden, De Allessi, Nadiri, and Coates and contradicts Friedman's so far the effect of capital costs on cash holdings is concerned. Further, the results supports the conclusion of Albert et al., Liu, Kuznets, Lieberman, Irvine and Akhtar and contradicts the results of Robinson, Lovell and Maccini and Rossana as far as the effect of capital cost on inventory demand is concerned. Besides, the effect of capital costs has also been observed in the case of receivables, and gross and net working capital. The adjustment speed of actual to desired balances has been observed as highest for cash followed by networking capital, gross working capital, inventory and receivables in the Indian Automobile Industry during the study period.
Indira Management Review - 37 July 2012
Cross Section Study of Working Capital Demand in Auto Industry
References
1. Richard M. Goodwin (1948). "Secular and Cyclical
Aspects of the Multiplier and Accelerator", in Income,
Employment and Public Policy : Essays in honour of
Alvin H. Hansen, New York : Norton and Company.
2. Baumol, W. (1952). "The Transactions Demand for
Cash: An Inventory Theoretic Approach", The Quarterly
Journal of Economics, pp.545-566.
3. Tobin, J. (1956). "The Interest Elasticity of
Transactions Demand for Cash", The Review of
Economics and Statistics, pp.241 - 247.
4. Friedman, M. (1959). "The Demand for Money; Some
Theoretical and Empirical Results", The Journal of
Political Economy, pp.327 - 351.
5.Newton Y. Robinson (1959). "The Acceleration
Principle : Departmental Store Inventories, 1920 -
1956", The American Economic Review, pp. 348 - 358.
6. Richard, T. Selden (1961). "The Postwar Rise in the
Velocity of Money : A Sectoral Analysis", The Journal of
Finance, pp.483 - 545.
7. Nestor E. Terleckyj (1961). "Measures of Inventory
Conditions", in Inventory Fluctuations and Economic
Stablisations, Part II, (Washington : Joint Economic
Committee, 87th Congress, First Session)
8. Mc Gouldrick, P.P. (1961). "The Impact of Credit Cost
and Availability on Inventory Management" in
Inventory Fluctuations and Economic Stabilisation,
Part II (Washington : Joint Economic Committee, 87th
Congress).
9. Michael Lovell (1961). "Manufacturers, Inventories,
Sales Expectations and the Acceleration Principle",
Econometrica, pp. 293 - 314.
10. Allan H. Meltzer (1963). "The Demand for Money : A
Cross - Section Study of Business Firms", The Quarterly
Journal of Economics, p.410.
11. Ablert Ando et al., (1963). "Lags in Fiscal and
Monetary Policy" in Stabilisation Policies : Commission
on Money and Credit, (Englewood Cliffs).
12. Liu, T.C. (1963). "An Exploratory Quarterly Model of
Effective Demand in the Post-War US Economy", The
Econometrica, pp. 301 - 308.
13. William J. Frazer, Jr. (1964). "Financial Structure of
Manufacturing Corporations and the Demand for
Money : Some empirical findings", The Journal of
Political Economy, pp.176 - 183.
14. Paul W. Kuznets (1964). "Financial determinants of
Manufacturing Inventory Behaviour : A Quarterly
Study Based on United States Estimates, 1947 - 1961",
Yale Economic Essays, pp. 331 - 369.
15. Lovell, M.C. (1964). "Determinants of Inventory
Behaviour", in Models of Income Behaviour, Edward F.
Denison and Lawrence R. Klein, eds., New York.
16. Maddala G.S., and Robert C. Vogel (1965). "The
Demand for Money : A Cross-Section Study of Business
Firms : Comments", The Quarterly Journal of Economics,
pp.153 - 159.
17. Edward L. Whalen (1965). "A Cross - Section Study of
Business Demand for Cash", The Journal of Finance, pp.
423 - 443.
18. Louis De Allessi (1966). "The Demand for Money : A
Cross-Section Study of British Business Firms",
Economica, pp. 288 - 302.
19. Nadiri M.I. (1969). "The Determinants of Real Cash
Balances in the US Total Manufacturing Sector", The
Quarterly Journal of Economics, pp.173 - 196.
20. Paul Burrows (1971). "Explanatory and Forecasting
Models of Inventory Investment in Britain", The Applied
Economics, pp. 275 - 289.
21. Jon M. Joyee, "Cost of Capital and Inventory
Investment : Further Evidence", The Southern Economic
Journal, pp. 323-329.
22. Steven D. Grossman (1973) "A Test of Speed of
Adjustment in Manufacturing Inventory Management",
The Quarterly Review of Economics and Business, pp. 21-
32.
23. Robert Coates, C. (1976). "The Demand for Money by
Firms", New York : Marcel Dekker, Inc.,
24. Charles Lieberman (1980). "Inventory Demand and
Cost of Capital Effects", The Review of Economics and
Statistics, pp. 348 - 356.
25. F.Owen Irvine, Jr., (1981). "Retail Inventory
Investment and the Cost of Capital", The American
Economic Review, p. 633.
26. Louis J. Maccini and Robert J. Rossana (1981)
"Investment in Finished Goods Inventories : An Analysis
of Adjustment Speeds", The American Economic Review
Papers and Proceedings, pp. 17 - 22.
27. Akhtar, M.A., (1983). "Effects of Interest Rates and
Inflation on Aggregate Inventory Investment in the
United States", The American Economic Review, pp. 319
- 328.
28. Vijayakumar, A., (1999). "Estimating Demand
Functions of Working Capital - Partial Adjustment
Model", The Management Accountant, pp. 172 - 174.
38 Indira Management Review - July 2012
Cross Section Study of Working Capital Demand in Auto Industry
**Distinguished Professor of Economics and Editor, Indian Journal of Economics and Business, Metropolitan State University of Denver, Denver, CO
E-mail: [email protected]
A Case Study: Impact of International Liberalization on the Indian Economy
*Korbel School of International Studies,University of Denver,
(First draft of this paper was presented in Eastern Economic Association meetings in Boston in March 2012.)
Abstract
This paper, using the Solow growth model
looks at the impact of liberalization on India's
economic growth. Additionally, using
empirical data, it analyzes the patterns,
processes, and characteristics of India's
economic growth. The Solow model explains
the long run economic growth via the change
in the Solow residuals. This paper defines the
Solow residual as International trade. This
paper will show that International trade and
fewer regulations on exports and imports
have ignited high economic growth in India.
After the late 1980s, India saw an immense
increase in international trade. Led by low
tariff rates, India saw a hike in exports and
imports and more importantly, foreign
investments. With the backing of facts and
figures, this paper will show that India has
actually benefited in terms of economic
growth from international trade. With
liberalization, India has not only had success
in the macro level, but it has also impacted
people in terms of per capita income in the
micro level. This paper is broken down into 4
sections. The first section gives an
introduction to India and its relevance to the
Solow model. The second section explores
the theoretical framework of the Solow
model. The third section uses the empirical
data to examine the impact of liberalization
on India (pre and post reformation). Finally,
the fourth section is the analysis and
conclusion section which compares India to
other South Asian counties and gives policy
recommendation.
Key Terms: International Trade, Foreign
Direct Investment, Exports, Imports.
A Case Study: Impact of International
Liberalization on the Indian Economy
Introduction:
India is the largest country in the Sub-
Continent bounded by the Indian Ocean in the
south, the Arabian Sea on the northwest and
the Bay of Bengal in the southeast. It also
borders with Pakistan to the west, Nepal,
Bhutan and the Republic of China to the
northeast and Bangladesh and Burma to the
east. A country mainly known for its rich
culture, India is also known for its highly
diverse and rich geography, different
languages and religion. Hinduism is practiced
by the majority of the people (80.5 percent),
with Muslim (13.4 percent) being the largest
minority (CIA, 2011) . Despite being
considered an underdeveloped country after
gaining independence from Great Britain in
1947, India has transformed its economy to
become the 5th largest economy in the world
with a gross national product (GDP) of 1.31
trillion USD in 2011(CIA, 2011). Thanks to
economic liberalization, including industrial
*Mr. Shreesh Bhattarai, **Prof. Kishore G. Kulkarni,
Indira Management Review - 39July 2012
deregulation, privatization of state-owned
enterprises and reduced controls on foreign
trade and investment, India has accelerated
its economic growth tremendously over the
last two decades.
Historically, India was predominantly an
agricultural society. In other words, the
agricultural sector had been the core of the
Indian economy for several decades,
accounting for 57 percent of the GDP in 1950-
1951and 49 percent from 1964-1965
(Panagariya, 2008, p. 12). However, after the
1970's, India started to see a steady decline in
the share of agriculture in the GDP, falling
from 57 percent in 1950-1951 to 21 percent
in 2004-2005(Panagariya, 2008, p. 12). The
decline in the agriculture sector was
absorbed by the industrial and the service
sector. Contrasted to other emerging
countries, where economies transitioned
from the agricultural to the industrial sector,
India experienced bulk of its growth in GDP
through the service sector. Between 1950-
2005, the share of the industry sector in India
grew only from 15 percent to 27 percent
(Panagariya, 2008, p. 13). On the other hand,
the share of services grew from 28 percent to
52 percent in the same period (Panagariya,
2008, p. 13). The reason for this unorthodox
transition is attributed to continuing
restrictions implanted on labor-intensive
products. Until the 1990's, reservation of the
vast majority of the labor-intensive products
for small-scale enterprises kept large firms
from entering their production despite
removal of licensing. Also, labor market
inflexibilities, including the lack of rights to
hire and fire employees, played a major
disincentive for big firms to enter the local
market. Service sector on the other hand was
free of these regulations, which allowed the
firms to operate more freely and grow quickly.
Moreover, the lack of regulations in the service
sector played a vital role in the economic
growth of India.
This paper aims to evaluate the policies and
trends in the liberalization process in India. In
order to accomplish this research, the basic
economic theories that address this issue
must be understood. The most important
economic theory that applies to the
liberalization transformation is the Solow
Growth Model. This model builds on the
production function, which describes how any
amounts of capital and labor can be combined
to generate total output. The Solow model
adds the theory of capital accumulation to the
production function. According to the model,
increase in investment rate or total factor
productivity can increase a country's steady-
state position and therefore can increase short
term growth. However, to enjoy long term
growth, a country needs to focus on the Solow
residuals. Solow residuals are exogenous
factors that help in raising the overall output of
the economy. This paper argues that
international trade and openness of the
economy (Solow residuals) have accelerated
India's overall output leading to a faster
e c o n o m i c g ro w t h . I n o rd e r fo r a n
underdeveloped country to prosper, it needs
to liberalize its economy to generate higher
output. This paper will test the impact of
liberalization in India's economy before 1990
and compare it to post 1990. Also, this paper
will try to analyze the patterns, processes, and
characteristics of liberaralization and its
importance toward transforming one's
economy. Additionally, it will try to examine
the impact of economic liberalization in the
40 Indira Management Review - July 2012
Impact of International Liberalization on the Indian Economy
development process of India. Finally, it will
compare India to other South Asian countries
and give policy recommendation.
An Examination of the Solow Model
The general characteristics of less developed
countries (LDC) include low income,
inadequate infrastructure, a poor health care
system, a poor educational system as well as
unstable economic and political systems. It
has been a global challenge, especially for
developed countries, to try to tackle these
complex issues. Since World War II, it has
been a big interest in the economics field to
determine the best economic policies that
can provide higher standards of living in less
developed countries (Hendricks & K.
Kulkarni, 2008, p. 6). Over the years, various
economists and scholars have proposed
different theories as vital to achieving
economic development. American economic
historian Walt W. Rostow proposed The
Stages of Economic Growth. According to
Rostow, for any economy to grow, it must go
through sequential stages. However, he was
not explicit as to how economic growth
would occur. This model was followed by the
Harrod-Domar Growth Model, which
concluded that economic development is a
direct result of increase in savings rate.
However, in order to increase the savings
rate, the model proposed increasing savings
by external borrowing from international
lending institutions such as the Asian
Development Bank, the World Bank and the
International Monetary Fund. The biggest
problem of this approach was that it could
cause repayment problems later, which has
been the case in many developing countries
(Todaro & Smith, 2009, p. 115).
In the mid 1950s, Nobel Prize winner Robert
Solow described a mechanism that drives
e c o n o m i c d e v e l o p m e n t . S i n c e i t s
establishment, the model has been extended
in a number of important directions and is now
probably the most widely used in the field of
macroeconomics. The model is based on the
ideology of neoclassical economics .
Neoclassical economists argue that economic
development is possible when markets are
allowed to work efficiently and private
enterprises are supported by the domestic
government. This is achieved by liberalization
of the economy with fewer taxes, lower
administration controls and free international
trade. They also argue that too much
government control has led to no economic
growth, citing corruption, bureaucracy and
administration delays as impediments to
growth.
The Solow model is an extended version of the
production function. It is comprised of one
more element known as the theory of capital
accumulation. Instead of the capital stock
being given at some exogenous level, agents in
the economy can accumulate tools, machines,
computers, and buildings over time (Jones,
2011, p. 99). This accumulation of capital is
converted from an exogenous variable into an
endogenous variable in the Solow model.
According to the model, the accumulation of
capital is the main engine that drives economic
growth. Solow expands this theory by saying
that investing in more capital becomes the
difference between a rich and a poor country. A
country that uses its resources to invest in
capital accumulation prospers compared to a
country that does not.
Impact of International Liberalization on the Indian Economy
Indira Management Review - 41July 2012
The model is best understood by looking at a
hypothetical example. Let us assume that an
economy is comprised of a large family that
owns a farm. The family produces various
vegetables. Each year, the family starts by
planting some seeds in the spring, tending the
crop over the summer, and then harvesting
near the start of the autumn. Let us assume
that the first year the family uses cattle to
plow the land before planting the seeds. They
end up with X amount of vegetables. Out of
the amount they produce, let us assume that
they consume half and save the other half to
sell in the market. By selling one half of the
vegetables, the family generates some
income. They use that income to purchase a
tractor (capital) to help plow the lands. This
increases the efficiency of the production
process and results in higher yields of
vegetables the next year. Therefore, as the
years pass, the size of the harvest grows
larger and larger, as does the quantity of
vegetables that the family can sell to make
profit. This shows the accumulation of capital
overtime, which is the core of the Solow
model. This can also be interpreted
mathematically using the production
function and adding the capital accumulation
to it. The production model can be
mathematically described as follows:
where Y is the total output produced by the firm, K and are the capital and labor used in the production of the output. We assume that this production function is a Cobb-Douglas and exhibits constant returns to scale in K and L . In other words, if capital increases by 1 unit, holding everything else constant, Y will increase by 1 unit. In the example economy above, the output can be
L
used for two purposes- consumption and investment. Mathematically, Ct+ lt = Yt Ct is the amount of output that is consumed by the family, while It is the amount invested for the future. This function is called a resource constraint, which describes a fundamental constraint on how the economy can use its resources. Also, it is assumed that the farm is a closed economy, meaning that there are no imports or exports in the equation.
The portion of the vegetables invested for the future (It) determines the accumulation of capital and can be shown by the capital accumulation equation-
Kt+1=Kt+lt - dKt ………………………………(2)
Equation 2 says that the capital stock next year, Kt+1, is equal to the sum of three terms- Kt,It,dKt,Kt is this year's starting capital. It is the amount of investment undertaken using this year's production and dK t subtracts depreciation from the capital. The capital is assumed to depreciate every year by the amount of d . In the above example, is thought of as the fraction of vegetables that cannot be produced due to the tractor's malfunction. According to the capital accumulation equation, the amount of vegetables in storage next spring will be equal to the amount in storage this year, plus the new additions from this year's harvest, minus the amount that is lost due to the tractor's malfunction (depreciation).
The capital accumulation equation can also be expressed in a different form. Let DKt+1=Kt+1 - Kt represent the change in the capital stock between today, t, and next year, t+1. Then, D Kt+1 = 1t - dKt . The change in the capital stock is equal to new investment I minus the amount of capital that depreciates in production. It can be seen that today's capital stock is the result of investments
..............…..(1)Y t = F(K L ) = AK Lt t t t1/3 2/3
42 Indira Management Review - July 2012
Impact of International Liberalization on the Indian Economy
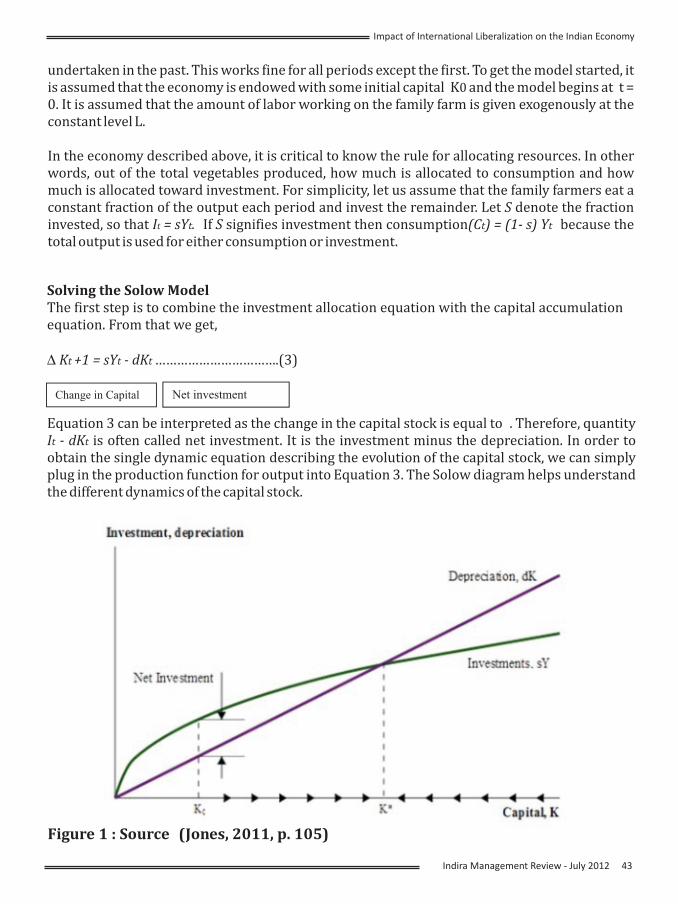
undertaken in the past. This works fine for all periods except the first. To get the model started, it is assumed that the economy is endowed with some initial capital K0 and the model begins at t = 0. It is assumed that the amount of labor working on the family farm is given exogenously at the constant level L.
In the economy described above, it is critical to know the rule for allocating resources. In other words, out of the total vegetables produced, how much is allocated to consumption and how much is allocated toward investment. For simplicity, let us assume that the family farmers eat a constant fraction of the output each period and invest the remainder. Let S denote the fraction invested, so that It = sYt. If S signifies investment then consumption(Ct) = (1- s) Yt because the total output is used for either consumption or investment.
Solving the Solow ModelThe first step is to combine the investment allocation equation with the capital accumulation equation. From that we get, D Kt +1 = sYt - dKt …………………………….(3)
Change in Capital Net investment
Equation 3 can be interpreted as the change in the capital stock is equal to . Therefore, quantity It - dKt is often called net investment. It is the investment minus the depreciation. In order to obtain the single dynamic equation describing the evolution of the capital stock, we can simply plug in the production function for output into Equation 3. The Solow diagram helps understand the different dynamics of the capital stock.
Figure 1 : Source (Jon 201 . 105)es, 1, p
Impact of International Liberalization on the Indian Economy
Indira Management Review - 43July 2012
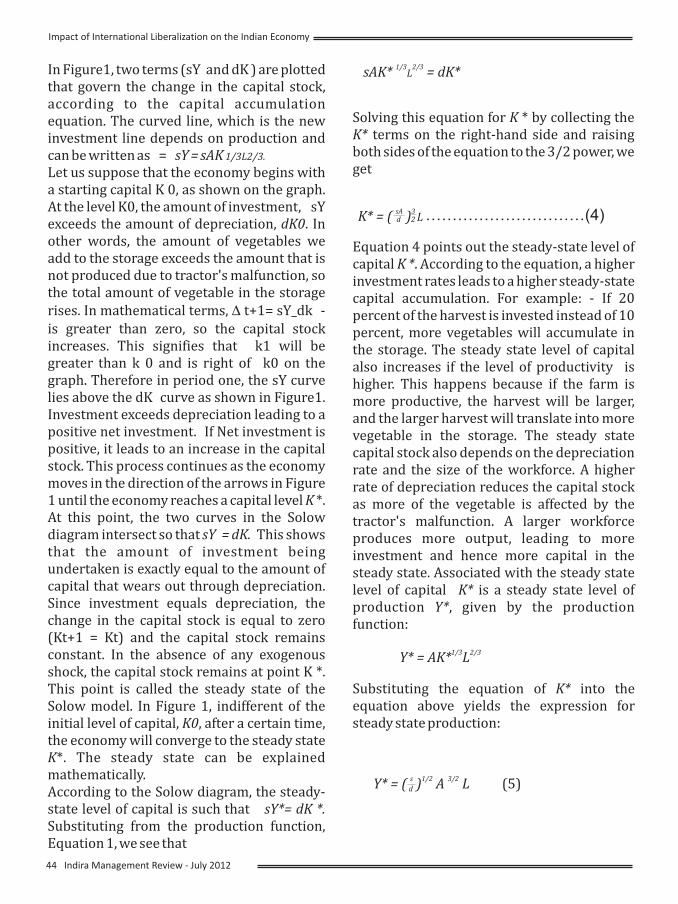
In Figure1, two terms (sY and dK ) are plotted that govern the change in the capital stock, according to the capital accumulation equation. The curved line, which is the new investment line depends on production and can be written as = sY = sAK 1/3L2/3.
Let us suppose that the economy begins with a starting capital K 0, as shown on the graph. At the level K0, the amount of investment, sY exceeds the amount of depreciation, dK0. In other words, the amount of vegetables we add to the storage exceeds the amount that is not produced due to tractor's malfunction, so the total amount of vegetable in the storage rises. In mathematical terms, D t+1= sY_dk - is greater than zero, so the capital stock increases. This signifies that k1 will be greater than k 0 and is right of k0 on the graph. Therefore in period one, the sY curve lies above the dK curve as shown in Figure1. Investment exceeds depreciation leading to a positive net investment. If Net investment is positive, it leads to an increase in the capital stock. This process continues as the economy moves in the direction of the arrows in Figure 1 until the economy reaches a capital level K *. At this point, the two curves in the Solow diagram intersect so that sY = dK. This shows that the amount of investment being undertaken is exactly equal to the amount of capital that wears out through depreciation. Since investment equals depreciation, the change in the capital stock is equal to zero (Kt+1 = Kt) and the capital stock remains constant. In the absence of any exogenous shock, the capital stock remains at point K *. This point is called the steady state of the Solow model. In Figure 1, indifferent of the initial level of capital, K0, after a certain time, the economy will converge to the steady state K*. The steady state can be explained mathematically. According to the Solow diagram, the steady-state level of capital is such that sY*= dK *. Substituting from the production function, Equation 1, we see that
Solving this equation for K * by collecting the K* terms on the right-hand side and raising both sides of the equation to the 3/2 power, we get
Equation 4 points out the steady-state level of capital K *. According to the equation, a higher investment rates leads to a higher steady-state capital accumulation. For example: - If 20 percent of the harvest is invested instead of 10 percent, more vegetables will accumulate in the storage. The steady state level of capital also increases if the level of productivity is higher. This happens because if the farm is more productive, the harvest will be larger, and the larger harvest will translate into more vegetable in the storage. The steady state capital stock also depends on the depreciation rate and the size of the workforce. A higher rate of depreciation reduces the capital stock as more of the vegetable is affected by the tractor's malfunction. A larger workforce produces more output, leading to more investment and hence more capital in the steady state. Associated with the steady state level of capital K* is a steady state level of production Y*, given by the production function:
Substituting the equation of K* into the equation above yields the expression for steady state production:
1/3 2/3sAK* L = dK*
…………………………(4)sA 3 K* = ( ) Ld 2
1/3 2/3Y* = AK* L
s 1/2 3/2Y* = ( ) A L (5)d
44 Indira Management Review - July 2012
Impact of International Liberalization on the Indian Economy
In equation 5, a higher investment (s) and a higher productivity (A) lead to a higher steady state level of production, but faster depreciation (d) lowers it. The constant returns to scale of the function above shows that doubling labor leads to a doubling of steady state production . Finally, by dividing both sides of equation 5 by labor, we get solution for output per person (y) in the steady state.
……………………………………….. (6)
A is the Solow residual, which consist of exogenous factors such as human capital, international trade, less trade restrictions, technology change, etc.
Economic growth in the Solow ModelThe most important implication of the steady-state is that there is no long-run growth in the Solow model. In the long run, the economy is stagnant at a constant level of production Y* and a constant level of capital K*. As we see from Figure 1, the Solow model will lead to economic growth for a while, but eventually growth stops as the capital stock and production converge to constant levels (Jones, 2011, p. 112). Therefore, it can be said that the capital accumulation cannot be counted to serve long term growth. The investment on factories, machines, computers, and other tools does lead to higher output in the short run. However, in the long run the diminishing returns to capital accumulation cause a decline in the return from these investments. Eventually, new investment of capital and depreciation offset each other, and the economy settles down to a constant level of output per person.
Therefore, a country cannot enjoy long term growth through capital accumulation, but it can through the Solow residuals. Solow residuals are exogenous factors that will help an economy to grow at a faster rate. Figure 2 explains this phenomenon.
In Figure 2, K* is the steady state is at Investment sY. Raising the capital (K ) will lead to higher investment sY but only for a short period of time due to the diminishing return on the extra capital. The Solow residual causes an increase in output. Output increases from its initial steady-state level Y* to the new steady state Y**. This example shows that the increase in Solow residual causes the economy to grow over time.
Figure 2: Source (Jones, 2011, p. 115)
Y* 3 s 1/2 Y* = ( ) = A ( ) L* d
Impact of International Liberalization on the Indian Economy
Indira Management Review - 45July 2012
In the long run- both steady-state capital and
steady-state production are higher. Since we
are assuming labor as constant, the level of
o u t p u t p e r p e r s o n a l s o i n c re a s e s
permanently.
This paper defines International trade as the
Solow residual. The reason for India's high
economic growth over the last two decades
has been a direct result of International trade.
Due to International trade and fewer
regulations on trade and foreign investment,
another Solow residual, India has increased
its output massively.
Pre-Reform -Protectionism Dominance
India gained its independence from Great
Britain in 1947. After being ruled by the
British for more than a century, a sense of
nationalism had taken over the country.
Foreigners were seen in a negative way and
India was looking forward to being isolated
from the rest of the world. In what was
famously known as the Swadeshi movement,
there was a strong belief that India could
produce everything at home and become self-
dependent (Kishore Kulkarni, 2010, p. 368).
Jawaharlal Nehru, the prime minister of India
(1947-1964) led this nationalist movement.
Nehru envisioned India to become a
socialistic society with a particular emphasis
on development of heavy industries such as
railways, airplanes, and guns. In a speech
delivered at the Federation of Indian
Chamber of Commerce and Industry in 1953,
he emphasized the importance of developing
heavy industries internally. He said if India
did not develop heavy industries internally, it
would have to import them from abroad. For
Nehru, importing from abroad was to be the
slaves of foreign countries (Panagariya, 2008,
p. 25).
Nehru also emphasized that economic
independence was critical to maintaining
political independence at home. The main
objective was to promote a production
s t r u c t u r e t h r o u g h p l a n n i n g a n d
industrialization, which would eliminate the
needs for imports, and free the country from
the threat of closure of the world markets.
This nationalistic vision had overshadowed
the benefits of foreign direct investment.
Multinational corporations were seen as
exploitative entities that operated only for
their economic benefit. They were also seen
as companies that benefited from cheap labor
but did not invest back their profits in the
developing country. Therefore, foreign
investment in India during this period was
negligible. Higher tariffs were implemented
to discourage foreign imports as India pushed
for isolation.
46 Indira Management Review - July 2012
Impact of International Liberalization on the Indian Economy
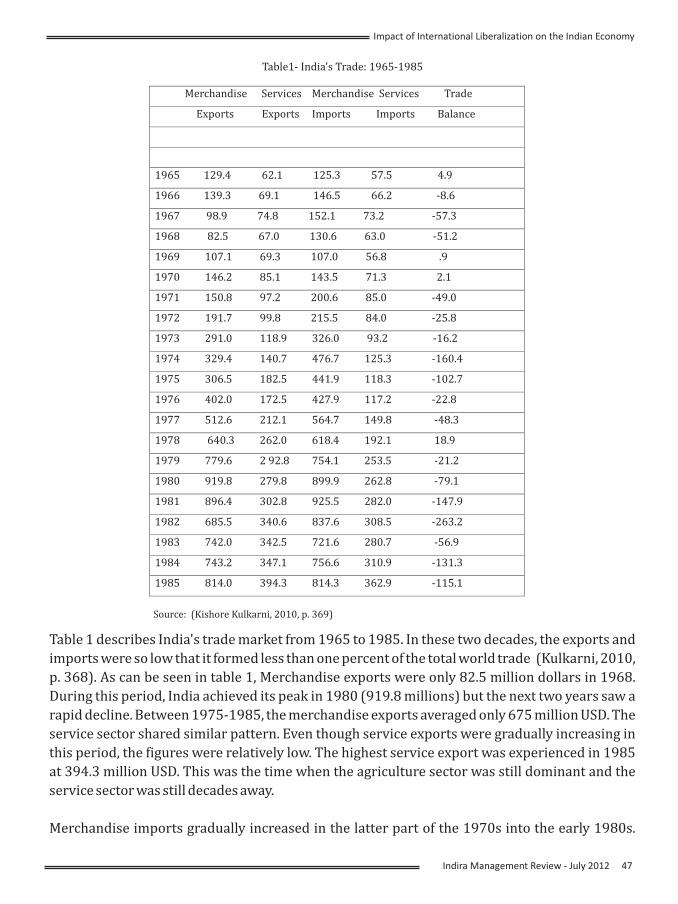
Table1- India's Trade: 1965-1985
erchandi Services Merchandise Services TradeM se
Exports Exports Imports Imports Balance
1965 129.4 62.1 125.3 57.5 4.9
1966 139.3 69.1 146.5 66.2 -8.6
1967 98.9 74.8 152.1 73.2 -57.3
1968 82.5 67.0 130.6 63.0 -51.2
1969 107.1 69.3 107.0 56.8 .9
1970 146.2 85.1 143.5 71.3 2.1
1971 150.8 97.2 200.6 85.0 -49.0
1972 191.7 99.8 215.5 84.0 -25.8
1973 291.0 118.9 326.0 93.2 -16.2
1974 329.4 140.7 476.7 125.3 -160.4
1975 306.5 182.5 441.9 118.3 -102.7
1976 402.0 172.5 427.9 117.2 -22.8
1977 512.6 212.1 564.7 149.8 -48.3
1978 640.3 262.0 618.4 192.1 18.9
1979 779.6 2 92.8 754.1 253.5 -21.2
1980 919.8 279.8 899.9 262.8 -79.1
1981 896.4 302.8 925.5 282.0 -147.9
1982 685.5 340.6 837.6 308.5 -263.2
1983 742.0 342.5 721.6 280.7 -56.9
1984 743.2 347.1 756.6 310.9 -131.3
1985 814.0 394.3 814.3 362.9 -115.1
Source: (Kishore Kulkarni, 2010, p. 369)
Table 1 describes India's trade market from 1965 to 1985. In these two decades, the exports and
imports were so low that it formed less than one percent of the total world trade (Kulkarni, 2010,
p. 368). As can be seen in table 1, Merchandise exports were only 82.5 million dollars in 1968.
During this period, India achieved its peak in 1980 (919.8 millions) but the next two years saw a
rapid decline. Between 1975-1985, the merchandise exports averaged only 675 million USD. The
service sector shared similar pattern. Even though service exports were gradually increasing in
this period, the figures were relatively low. The highest service export was experienced in 1985
at 394.3 million USD. This was the time when the agriculture sector was still dominant and the
service sector was still decades away.
Merchandise imports gradually increased in the latter part of the 1970s into the early 1980s.
Impact of International Liberalization on the Indian Economy
Indira Management Review - 47July 2012
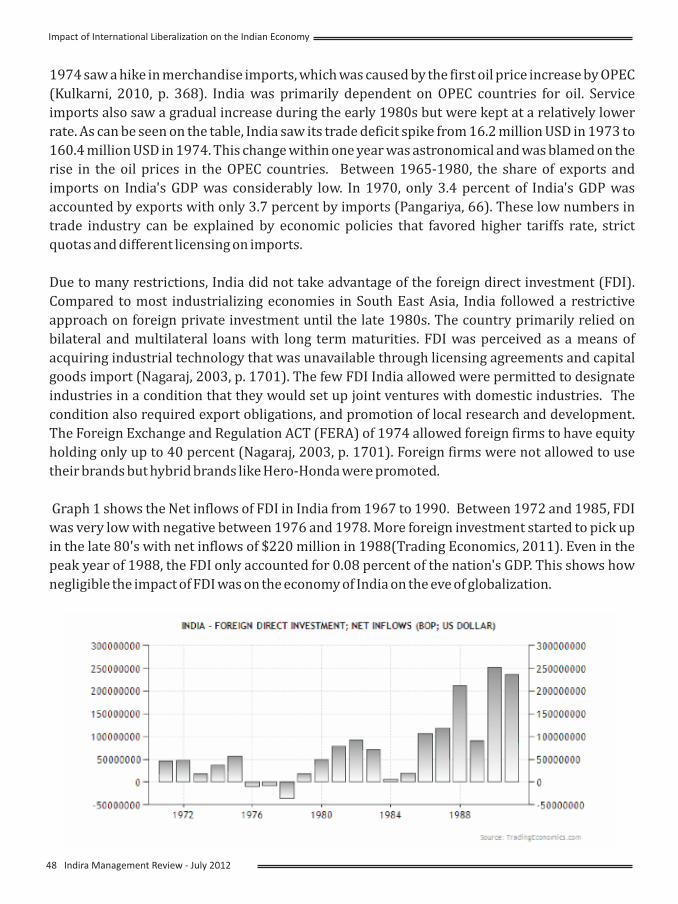
1974 saw a hike in merchandise imports, which was caused by the first oil price increase by OPEC
(Kulkarni, 2010, p. 368). India was primarily dependent on OPEC countries for oil. Service
imports also saw a gradual increase during the early 1980s but were kept at a relatively lower
rate. As can be seen on the table, India saw its trade deficit spike from 16.2 million USD in 1973 to
160.4 million USD in 1974. This change within one year was astronomical and was blamed on the
rise in the oil prices in the OPEC countries. Between 1965-1980, the share of exports and
imports on India's GDP was considerably low. In 1970, only 3.4 percent of India's GDP was
accounted by exports with only 3.7 percent by imports (Pangariya, 66). These low numbers in
trade industry can be explained by economic policies that favored higher tariffs rate, strict
quotas and different licensing on imports.
Due to many restrictions, India did not take advantage of the foreign direct investment (FDI).
Compared to most industrializing economies in South East Asia, India followed a restrictive
approach on foreign private investment until the late 1980s. The country primarily relied on
bilateral and multilateral loans with long term maturities. FDI was perceived as a means of
acquiring industrial technology that was unavailable through licensing agreements and capital
goods import (Nagaraj, 2003, p. 1701). The few FDI India allowed were permitted to designate
industries in a condition that they would set up joint ventures with domestic industries. The
condition also required export obligations, and promotion of local research and development.
The Foreign Exchange and Regulation ACT (FERA) of 1974 allowed foreign firms to have equity
holding only up to 40 percent (Nagaraj, 2003, p. 1701). Foreign firms were not allowed to use
their brands but hybrid brands like Hero-Honda were promoted.
Graph 1 shows the Net inflows of FDI in India from 1967 to 1990. Between 1972 and 1985, FDI
was very low with negative between 1976 and 1978. More foreign investment started to pick up
in the late 80's with net inflows of $220 million in 1988(Trading Economics, 2011). Even in the
peak year of 1988, the FDI only accounted for 0.08 percent of the nation's GDP. This shows how
negligible the impact of FDI was on the economy of India on the eve of globalization.
48 Indira Management Review - July 2012
Impact of International Liberalization on the Indian Economy
India finally started seeing some change in
the 1980s. While the agriculture sector still
accounted for the majority of the GDP,
industrial and service sectors started to
boom rapidly. The economy started to
prosper slowly but more steadily than the
earlier decades. The importance of
liberalization of the economy was realized by
the government of Rajiv Gandhi which led to
reduction in tariff rates in the early 1980s
and more progress was made in the sector of
international trade in the late 1980s.
Trade Reforms in India
The decade of 1980 saw a few signs of policy
changes when Rajiv Gandhi was the prime
minister of India. Unlike his predecessors,
Gandhi came to power with aspirations to
change India's economic approach. He
implemented programs of economic
liberalization and introduced reforms in the
first two years in office. However, India had a
long way to go because of earlier
macroeconomic setbacks. The fiscal deficit of
Centre and State governments had reached
an astonishing 10 percent of GDP (Aggarwal,
2003, p. 47). The current account balance
hovered around 3.3 percent of GDP, with
inflation of 9.9 percent (Aggarwal, 2003, p.
47). Also, India had started having balance of
payments problems .Therefore, despite
experiencing rapid economic growth which
averaged 5 percent annually in the 1980s,
India could not sustain its growth due to the
balance of payment deficits. These deficits
resulted from heavy external borrowing
from the World Bank and the International
Monetary Fund (IMF). The government of
I n d i a wa s g o i n g t h ro u gh a m a j o r
macroeconomic crisis and was close to
default. Therefore, something drastic had to
be done to bring the Indian economy back to
normal.
With Narashinha Rao at the helm (1991-1996), India witnessed its first significant shock of liberalization in 1991. The first step toward liberalization was done via the devaluation of the Indian currency (Rupee). Rupee was devalued by 21 percent in 1991 in order to reduce the current account deficit (Joshi et al., 1997, p. 11). Other policy changes included a major reduction in tariff rates and quotas. FDI was encouraged by elimination of heavy licensing. Also, India needed short term stabilization of its balance of trade. This was done through reduction in expenditure and contractionary fiscal and monetary policies. Due to the internal demand as well as the IMF dictated condition, India had to deregulate and liberalize all markets and exercise laissez-faire economic policies (Menezes, 1999, p. 2). These reforms not only helped India get out of the biggest economic crisis in its history, but lay the foundation to become one of the dominant economic powers in the world today.
Post Reform-The impact of liberal reformsThe post reform India saw a tremendous economic growth that ended the balance of payment crisis. The quick recovery was attributed to major liberalization policies on the domestic as well as the international fronts. During the 1988-91 fiscal years, India's GDP at factor costs grew at rates of 10.5, 6.7, and 5.6 percent, respectively (Panagariya, 2008, p. 100). Inflation rate of 13.6 percent in 1991 was reduced to 1.3 percent in 2001-2002 (Kishore Kulkarni, 2010, p. 372). This was a tremendous achievement considering the macro instability the country went through just a few years back. The economic growth is also attributed to lower tariff rates and increase in import and export quotas. Prime
Impact of International Liberalization on the Indian Economy
Indira Management Review - 49July 2012
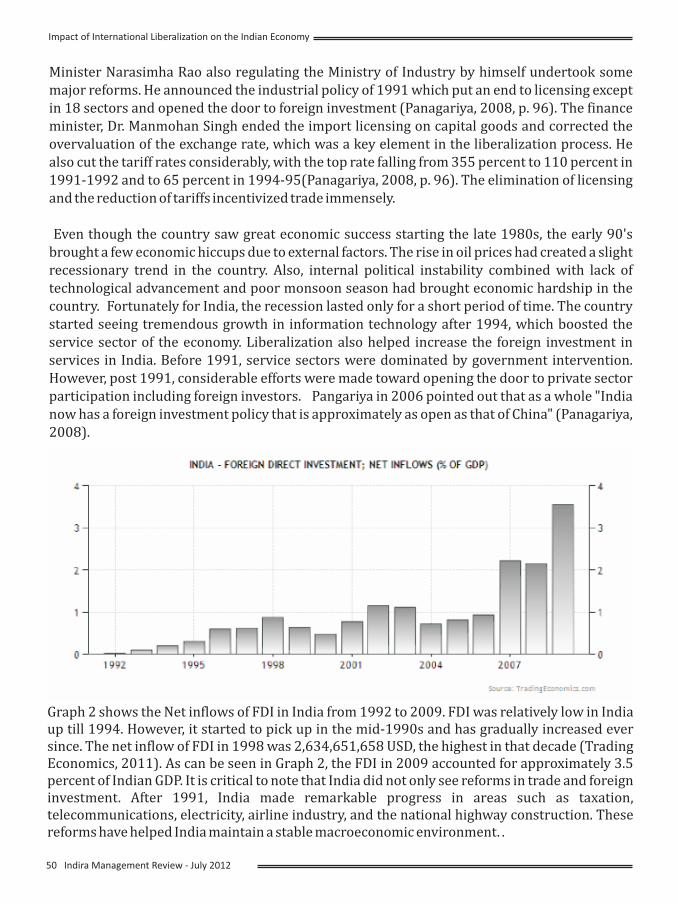
Minister Narasimha Rao also regulating the Ministry of Industry by himself undertook some major reforms. He announced the industrial policy of 1991 which put an end to licensing except in 18 sectors and opened the door to foreign investment (Panagariya, 2008, p. 96). The finance minister, Dr. Manmohan Singh ended the import licensing on capital goods and corrected the overvaluation of the exchange rate, which was a key element in the liberalization process. He also cut the tariff rates considerably, with the top rate falling from 355 percent to 110 percent in 1991-1992 and to 65 percent in 1994-95(Panagariya, 2008, p. 96). The elimination of licensing and the reduction of tariffs incentivized trade immensely.
Even though the country saw great economic success starting the late 1980s, the early 90's brought a few economic hiccups due to external factors. The rise in oil prices had created a slight recessionary trend in the country. Also, internal political instability combined with lack of technological advancement and poor monsoon season had brought economic hardship in the country. Fortunately for India, the recession lasted only for a short period of time. The country started seeing tremendous growth in information technology after 1994, which boosted the service sector of the economy. Liberalization also helped increase the foreign investment in services in India. Before 1991, service sectors were dominated by government intervention. However, post 1991, considerable efforts were made toward opening the door to private sector participation including foreign investors. Pangariya in 2006 pointed out that as a whole "India now has a foreign investment policy that is approximately as open as that of China" (Panagariya, 2008).
Graph 2 shows the Net inflows of FDI in India from 1992 to 2009. FDI was relatively low in India up till 1994. However, it started to pick up in the mid-1990s and has gradually increased ever since. The net inflow of FDI in 1998 was 2,634,651,658 USD, the highest in that decade (Trading Economics, 2011). As can be seen in Graph 2, the FDI in 2009 accounted for approximately 3.5 percent of Indian GDP. It is critical to note that India did not only see reforms in trade and foreign investment. After 1991, India made remarkable progress in areas such as taxation, telecommunications, electricity, airline industry, and the national highway construction. These reforms have helped India maintain a stable macroeconomic environment. .
50 Indira Management Review - July 2012
Impact of International Liberalization on the Indian Economy
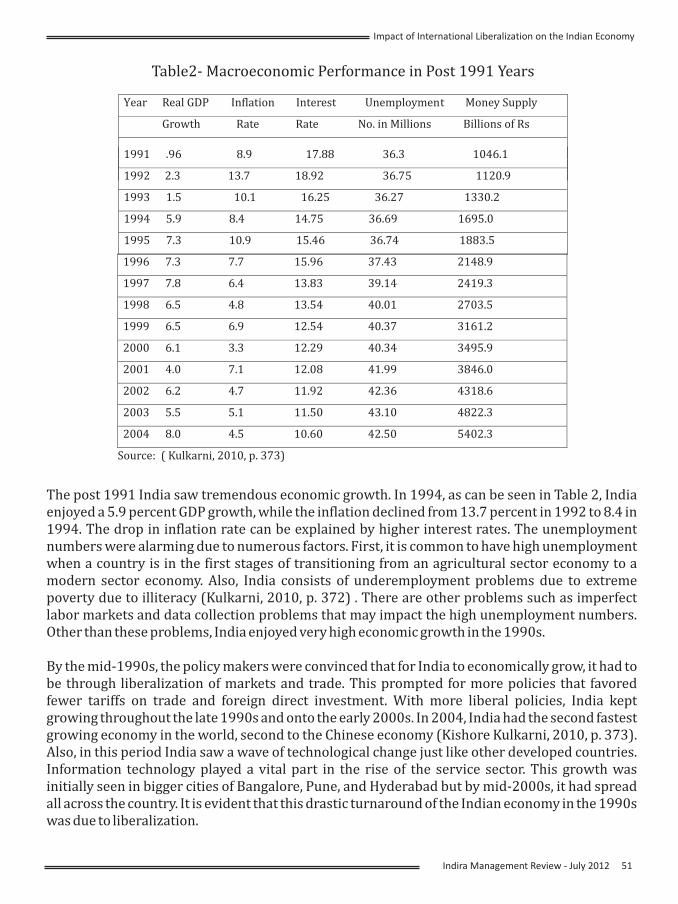
earY Real GDP Inflation Interest Unemployment Money Supply
Growth Rate Rate No. in Millions Billions of Rs
1991 .96 8.9 17.8 36.3 1046.18
1992 2.3 13.7 18.92 36.75 1120.9
1993 1.5 10.1 16.25 36.27 1330.2
1994 5.9 8.4 14.75 36.69 1695.0
1995 7.3 10.9 15.46 36.74 1883.5
1996 7.3 7.7 15.96 37.43 2148.9
1997 7.8 6.4 13.83 39.14 2419.3
1998 6.5 4.8 13.54 40.01 2703.5
1999 6.5 6.9 12.54 40.37 3161.2
2000 6.1 3.3 12.29 40.34 3495.9
2001 4.0 7.1 12.08 41.99 3846.0
2002 6.2 4.7 11.92 42.36 4318.6
2003 5.5 5.1 11.50 43.10 4822.3
2004 8.0 4.5 10.60 42.50 5402.3
Source: ( Kulkarni, 2010, p. 373)
Table2- Macroeconomic Performance in Post 1991 Years
The post 1991 India saw tremendous economic growth. In 1994, as can be seen in Table 2, India enjoyed a 5.9 percent GDP growth, while the inflation declined from 13.7 percent in 1992 to 8.4 in 1994. The drop in inflation rate can be explained by higher interest rates. The unemployment numbers were alarming due to numerous factors. First, it is common to have high unemployment when a country is in the first stages of transitioning from an agricultural sector economy to a modern sector economy. Also, India consists of underemployment problems due to extreme poverty due to illiteracy (Kulkarni, 2010, p. 372) . There are other problems such as imperfect labor markets and data collection problems that may impact the high unemployment numbers. Other than these problems, India enjoyed very high economic growth in the 1990s.
By the mid-1990s, the policy makers were convinced that for India to economically grow, it had to be through liberalization of markets and trade. This prompted for more policies that favored fewer tariffs on trade and foreign direct investment. With more liberal policies, India kept growing throughout the late 1990s and onto the early 2000s. In 2004, India had the second fastest growing economy in the world, second to the Chinese economy (Kishore Kulkarni, 2010, p. 373). Also, in this period India saw a wave of technological change just like other developed countries. Information technology played a vital part in the rise of the service sector. This growth was initially seen in bigger cities of Bangalore, Pune, and Hyderabad but by mid-2000s, it had spread all across the country. It is evident that this drastic turnaround of the Indian economy in the 1990s was due to liberalization.
Impact of International Liberalization on the Indian Economy
Indira Management Review - 51July 2012
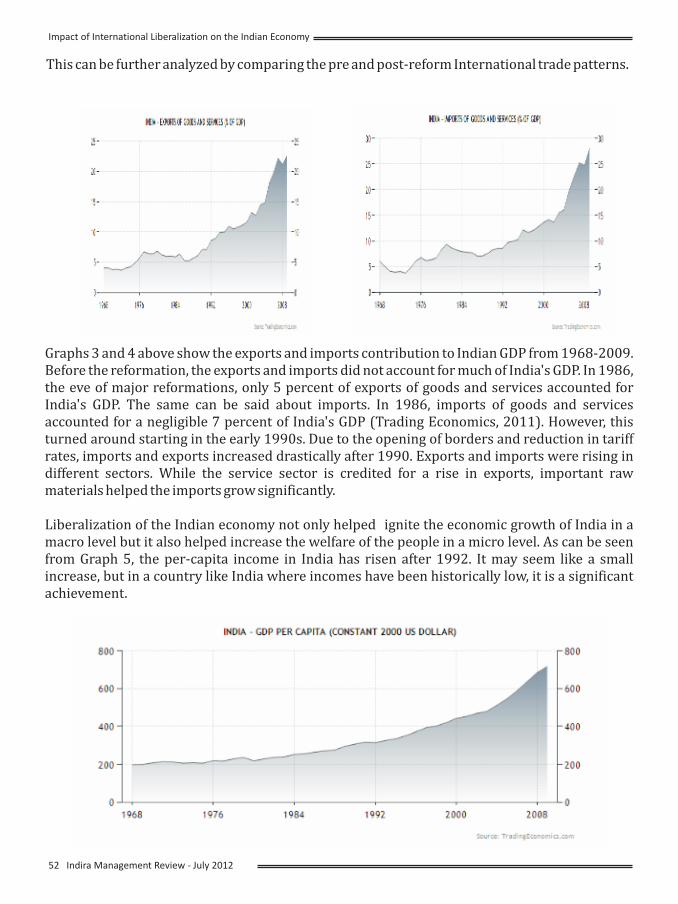
This can be further analyzed by comparing the pre and post-reform International trade patterns.
Graphs 3 and 4 above show the exports and imports contribution to Indian GDP from 1968-2009. Before the reformation, the exports and imports did not account for much of India's GDP. In 1986, the eve of major reformations, only 5 percent of exports of goods and services accounted for India's GDP. The same can be said about imports. In 1986, imports of goods and services accounted for a negligible 7 percent of India's GDP (Trading Economics, 2011). However, this turned around starting in the early 1990s. Due to the opening of borders and reduction in tariff rates, imports and exports increased drastically after 1990. Exports and imports were rising in different sectors. While the service sector is credited for a rise in exports, important raw materials helped the imports grow significantly.
Liberalization of the Indian economy not only helped ignite the economic growth of India in a macro level but it also helped increase the welfare of the people in a micro level. As can be seen from Graph 5, the per-capita income in India has risen after 1992. It may seem like a small increase, but in a country like India where incomes have been historically low, it is a significant achievement.
52 Indira Management Review - July 2012
Impact of International Liberalization on the Indian Economy
Opponents of liberalization have complained about low wage rates among unskilled workers. Although, it is a valid argument, it is critical to note that liberalization has provided jobs to people that would not have had otherwise. Critics also point out how liberalization has destroyed the local culture and has dominated India with western values. These are all good arguments, but it is to be noted that for a country to have economic success, it has to make some hard sacrifices. As Dr. Bhagwati points out in "In Defense of Globalization," that trade liberalization has more benefits than costs and therefore needs to be supported to the fullest extent. The post-reform success clearly shows the importance of trade liberalization in India.
Analysis and ConclusionMore so than other developing countries, India has experienced the fastest economic growth. Despite being considered a poor country after its independence in 1947, India has bounced back to become one of the most powerful emerging economies in the entire world. How has India been able to achieve this incredible goal? What are the lessons that other South Asian countries can take from India's success? Various policies were implemented after 1991 that were key to India's economic success. First, India followed the Solow growth model theory on its way to success. According to the Solow model, long term growth is a direct result of the Solow residuals. This paper argues that international trade and openness of the economy increased the overall level of output leading to a faster economic growth. The initial hypothesis proved to be correct as International trade was the difference between a poor India and an emerging India.
Between 1950s -1980's, protectionism swept the shores of India. Politicians favored policies that restricted movement of goods and services from other countries. India was destined to become independent of the world markets. However, India could not sustain this phenomenon forever. It realized that restriction of trade had a negative effect on the economic growth of India. Also, policy makers realized that in order for India to prosper like other South East Asian countries like Singapore, Taiwan and South Korea, it had to open its borders. This notion proved to be true as India's growth rate between 1988-2006 was 6 percent annually compared with 4.8 percent annually during 1981-1988, right before reformation (Pangariya, 108). The economy grew even faster during the period from 2003-2004 to 2005-2007, when India's GDP at factor cost grew at an impressive rate of 8.6 percent annually (Panagariya, 2008, p. 108). Opening the economy to the world market has been the reason for India's impressive success. This openness increased the rate of investment at home, which in turn led to a high economic growth just like Solow had predicted.
There are multiple lessons that other South Asian countries can learn from the case of India. One of the keys to economic success depends on the country's political structure. In other words, the more interest there is politically to economically advance, the higher the chances of achieving that particular goal. In the case of other South Asian countries, that has been the main problem. Political incentives have overlooked the potential economic growth. These countries need to realize that India, by changing its political ideologies helped itself to grow tremendously. Other countries also need to learn that India had to sacrifice deep cultural beliefs that
Impact of International Liberalization on the Indian Economy
Indira Management Review - 53July 2012
prevented effective policies to be put into effect before the 1980s. These sacrifices may be hard to make but in the end, the benefits of liberalization outweigh these sacrifices as has been seen in the case of India.
Overall, the experience of liberalization in India has been better compared to other developing countries. For India, the future is very bright if it continues to follow the same path since the late 1980s. India needs to carry the liberalization forward. India has the possibility to achieve long-term growth just like the East Asian tigers in the 1960s and 1970s, if policies are passed that favor more integration with the world markets. India already has a booming informational technology sector that has played a vital role in its economic growth. Now, India needs to focus on opening its borders even more to encourage further foreign investment. This will provide further investment opportunities internally and help the country to achieve an unprecedented economic success.
Bibliography and ReferencesAggarwal, M. R. (2003). Macro-Economic Adjustment, Stabilisation and Sustainable Growth in India: Looking Back and to the Future. INDIAN JOURNAL OF ECONOMICS, 84, 45-68.
CIA. (2011, April 25). CIA - The World Factbook. Retrieved April 29, 2011, from https://www.cia.gov/library/publications/the-world-factbook/geos/in.html
Hendricks, M., & Kulkarni, K. (2008). Structural Transformation: Economic Growth in India. SCMS Journal of Indian Management, 5, 5-17.
Jones, C. I. (2011). Macroeconomics (Second Edition.). W. W. Norton & Company.
Joshi, V., Little, I. M. D., Gang, F., Perkins, D. H., Sabin, L., Lewin, K. M., Deolalikar, A., et al. (1997). Asian Development. Asian Development Review, 15(2).
Kulkarni, Kishore. (2010). International economic development?: theories, models & case studies of countries leading the change. New Delhi: Matrix Publishers.
Menezes, F. A. (1999). Implications of financial liberalization in India. Swords and Ploughshares: A Journal of International Affairs, 1-12.
Nagaraj, R. (2003). Foreign direct investment in India in the 1990s: trends and issues. Economic and Political Weekly, 1701-1712.
Panagariya, A. (2008). India: The Emerging Giant. Oxford University Press, USA.
Todaro, M. P., & Smith, S. C. (2009). Economic Development (10th ed.). Pearson Addison Wesley.
Trading Economics. (2011). Indicators for INDIA. Retrieved April 29, 2011, from http://www.tradingeconomics.com/india/indicators
54 Indira Management Review - July 2012
Impact of International Liberalization on the Indian Economy
Trade Unionism in Leather Units in Kolkata: An exploratory observation on the selected leather units
(*Assistant Professor, Department of Management Studies, Lal Bahadur Shastri Institute of Management & Technology , Bareilly
** Assistant Professor , Department of Management studies, Narula Institute of Technology,Kolkata***Assistant Professor , Department of Management studies
Lal Bahadur Shastri Institute of Management & Technology )
Indranil Bose*Jayanta Banerjee**
Somnath Paul***
Abstract
The study of trade unionism became a crucial matter in the industrial relations as the r e l a t i o n s h i p b e t w e e n l a b o u r a n d management is greatly influenced by them. Even , after liberalization , contrary to the prediction of many observers , the significance of the trade unions have not been reduced . The role of the trade unions have been modified rather and have become a key decider of fate of large number of workers specially in the labour intensive industries across the globe. Leather industry is one of the highest employment generating industry in India and as per the estimate the sector can generate about 6 million direct and indirect employment by the end of 2015 , if the 10% growth trend continues . Currently about 2.5 million people are earning their livelihood from this sector a c r o s s I n d i a i n d i f f e r e n t m a j o r concentrations like. Though there are thousands of small and medium units are functioning as the unorganized units , yet some large and very large organizations have also come into fray over the years . Trade unionism is a common practice in many of these organizations and the nature of trade union formation experiences a greater variation from small , medium to large organizations. In the small and medium leather organizations trade unions are functioning under the industrial union banner , whereas in large organizations
unions are mostly organization specific. The paper attempts to study the extent of workers participation in union activities according to different variables like age, length of service , education , origin etc.
Key words : workers participation , union activities , trade union activities and different variables, sample organizations , organized leather industry , selected organizations .
Introduction : Soft as skin, not soft as silk... that's how it is in the Indian leather story that tells a tale of a $6 billion industry employing about 2.5 million people crafting shoes, saddles and bags for the world and hoping to triple its exports by 2015 , if the current growth rate of 10% continues .The sector can also accommodate about 6 million work force directly or indirectly . Helping the success story are the low costs, widely available raw material and world class quality that make India one of the world's fastest growing leather hubs. With about 10 percent of the world's raw material, India's leather exports make up around two percent of world trade and rose by 12 percent during 2008-2011 to about $2 billion. The leather and leather products industry is one of India's oldest manufacturing industries that catered to the international market right from the middle of the nineteenth century, the demand for its products being both domestic as well as international right from the beginning. About 46 per cent of the production in the sector is
Indira Management Review - 55July 2012
exported and it ranks eighth in the list of India's top export earning industries and contributes roughly Rs. 10,000 crores per annum, i.e., about 4 per cent to export earnings. The sector accounts for 2.5 per cent of the global leather-related trade of Rs. 387,200 crores. An estimated 15 per cent of total purchase of leading global brands in footwear, garments, leather goods & accessories, in Europe, and 10 percent of global supply is outsourced from India . Therefore, the dynamics of the industry has been shaped to a large extent by export orientation from colonial times. The sector is dominated by small-scale firms although there also exist a significant number of medium and large sized firms in all segments of the industry. The industry is concentrated in several leather clusters in four or five distinct locations in the country, with each cluster containing a wide variety of enterprise forms and organizational structure. To be more specific, the major production centers of leather and leather products are located at Chennai, Ambur, Ranipet, Vaniyambadi, Trichy, Dindigul in Tamil Nadu, Kolkata in West Bengal, Kanpur and Agra in U.P., Calendar in Punjab, Delhi, Hyderabad in Andhra Pradesh, Bangalore in Karnataka and Mumbai in Maharashtra. Tamil Nadu is the biggest leather exporter (40%) of the country and its share in India's output on leather products is 70%.
The labour scenario in Indian leather industry :The Leather Industry is Labour intensive and is concentrated in the small and cottage industry sectors. While leather shoes and uppers are concentrated in large scale units, the sandals and chappals are produced in the household and cottage sector. The leather industry employs about 2.5 million people . The industry is also one with strong links with the social structure through caste and
community. Thus a large number of people engaged in the industry (entrepreneurs as well as workers) are even today from traditional leatherworking castes (belonging to the lower castes in the caste hierarchy) and the Muslim community. Due to the age of the industry and its links with the social structure, the organizational structure that has emerged is a very complex one that contains within it elements of continuity with traditional structures as well as those that represent a break with them. The processes in the footwear making include last making, pattern cutting, clicking, sewing Assembling and finishing. There is no gender selectivity in child labor. Adults earn wages that are only marginally higher than what the children earn. Irrespective of the experience, skill and family size and requirements the wage payment system remains insensitive and relatively inelastic. Children contribute 20 to 40 per cent of the family income. The labor in the leather industry is defined by the caste location . While market forces predominantly govern all other aspects of the industry, the labor is d r a w n e x c l u s i v e l y f r o m t h e m o s t downtrodden section. As heads of 60 per cent of the households are engaged in leather work, the leather sector study establishes the incidence of child labor in leather flaying as an intergenerational phenomenon.
Women are also employed in large numbers in Indian leather industry and are making important contribution to the national economy as well as to exports. Women are involved in large numbers, especially in footwear production in Athani (Karnataka), Rajasthan, Agra (UP) and Chennai, Ambur, Ranipet and Vaniambadi (Tamil Nadu) . Their entry into productive work has helped considerably in improving their household situation. With the `take off' of the footwear industry, especially in the last 20 years and the rapid rise of exports, women's employment
56 Indira Management Review - July 2012
Trade Unions in Leather industryin Kolkata
has increased. The leather industry has been designated as a hazardous industry under the Factory Act 1948, and has a mandatory requirement of formal approvals for expansion. It has been observed that formal units expand and set up illegal units, where the bulk of women workers, especially dalit women are found. Women are not documented as 'workers' on any official records. Therefore, they are not legally entitled to any compensations or benefits. These women are recruited through contractors and are engaged in all stages of the tanning process. Their tasks are time consuming, backbreaking and the most hazardous.
Leather industry in West Bengal :With its large livestock population, West Bengal produces 8 percent of India's cowhides and 11 percent of its goatskins. Large quantities of skins from Bihar (India's second largest producer of hides) and U.P. are also tanned here. Bata India Ltd. (BIL) has India's largest tannery (annual capacity 335,000 cow and buffalo hides) in a Calcutta suburb. Apart from BIL, leather is tanned by 600 small-scale, family-owned units concentrated in the Tanagra, Tiljala and Topsia areas. The largest of these is the USD 7 million Taj Leather Works (TLW) .
West Bengal accounts for 65 percent of India's leather goods exports. But its share of total Indian leather and leather goods exports is 15 percent. The European Union and North America are the leading importers of West Bengal's leather and leather goods (79 percent and 12 percent respectively ) . Unfortunately, West Bengal is generally considered a source of low-priced, poor quality leather goods. Improving the quality of both leather and leather goods is a problem as most tanneries and manufacturers are small and cannot afford the investments
required to upgrade production facilities. Only a few manufacturers have modern equipment. But most of them are handicapped by low overall production capacity, which prevents them executing large export orders. However, West Bengal is till considered India's largest manufacturer of leather goods. In addition to BIL (annual capacity over 20 million pairs of shoes/uppers) there are approximately 20,000 small units making footwear/uppers (12 million pairs per year); industrial gloves (50 million pairs per year); garments (800,000 pieces per year); and accessories and luggage 35 million pieces per year).
Kolkata is the single largest concentration of leather industry in West Bengal. Traditionally , Kolkata offers the leather industry several advantages like easy availability of a wide variety of leather (cow, calf, buffalo, sheep, goat, kid); low production costs; a large pool of unskilled, semi-skilled and skilled workers at competitive rates; and abundant water and power. An airport and two ports facilitate exports.
Labour scenario in West Bengal leather industry :West Bengal's leather industry employs over 200,000 people. As far as working conditions of West Bengal leather industries are concerned, Bata India Ltd. (BIL), Taj Leather Works (TLW) and a few other units like Khadims etc. are the exception. In addition to salubrious working conditions, BIL's workers enjoy subsidized housing, medical facilities and numerous other benefits. TLW has modern machines with devices to prevent accidents and injuries to workers. In contrast, working conditions in the tanneries and the leather manufacturing units are generally appalling and there is scant regard for workers' safety or health. However, with the shifting of large number of leather industry organizations to newly built Calcutta Leather
Indira Management Review - 57July 2012
Trade Unions in Leather industryin Kolkata
Complex (CLC) near Bantala, which is spreaded over across 1100 acres of land with all modern infrastructure and technical amenities about 50000 directly employed workers and about 150000 indirectly dependent work-force are enjoying better working conditions than their counterparts working in traditional concentrations . Composition of work-force in both traditional and modern leather organizations are however divided into regular and casual workers under the company pay-roll and the very large number of workforce under the contractors .
Trends of trade unionism in Kolkata leather cluster :Trends of trade unionism in Kolkata is nothing unique . As the industry witnesses moderate to large scale trade union participation in medium to large units . The industry witnesses maximum union participation in tanneries in terms of small and medium scale operations , whereas , very limited existence of trade union is the general feature of the most of the fabricating units and the export units . As the maximum intensity of trade union activities is observed in tanneries only the scholarly investigation has identified the existence of multi-union situation at the industry level covering most of such units in Kolkata leather cluster. These industry level unions are all affiliated to two or three major political parties and enjoy very high command over thousands of workers , both regular and casual , in Kolkata leather industry. However , few units engaged in fabrication jobs , employing more than 500 workers also witness the same trend . Large organizations like Bata , Taj Leather works , Khadims etc. have the workers' unions , but these are mostly organization specific or craft unions based on nature of occupational engagements . As per the recent estimate about 62% of the workforce employed in
tanneries (most ly under smal l and unorganized types) in Kolkata leather cluster hold the membership of some other trade union , whereas in large organized leather business organizations about 79%-82% workers are the members of any of the unions .Both the industry level unions covering the small and medium size unit workers and the organization specific unions in large units have their agenda , which are surprisingly similar in many situations . Both types of unions are concerned with the issues like job s e c u r i t y a n d p r o t e c t i o n f r o m retrenchment/lay-off , minimum physical facility provisions for the workers , payment of minimum wages , bonus , incentives etc. However , on the leadership issue external involvement is higher in industry level union coverage on small and medium unit workers , whereas the power mostly lies with internal leadership in the large scale unit specific unions , though the external political control is very much there .
Review of literature:The wide variety of literatures both of academic and non-academic nature are available on the different aspects of the topic discussed in the paper. However , only few major literatures have been covered here to provide a comprehensive idea about the research trends on the different dimensions of current research .
The review of literature has been classified into two major areas ;?Literatures on the trade unionism in India ?Literatures on the leather industry of Kolkata?Literatures on the workers' participation in the trade unions in leather industry of Kolkata
58 Indira Management Review - July 2012
Trade Unions in Leather industryin Kolkata
Trade Unions have become an integral and powerful factor in the contemporary system of production and distribution system .Modern industrialization has paved the way for trade unions . They are now exercising a strong influence on the methods of production of goods and services , their distribution , the allocation of economic resources , the volume of employment and unemployment , the character of of rights and privileges , policies of governments, the attitude and status of legal masses of population , and the very nature of economic and social organisations. However, under such conditions, their role has evoked deep and wide controversies. Therefore, the large pool of available literatures on trade unionism is clearly divided on their role in controlling the macro and micro aspects of economy, policy , employment and governance.
Sen, Ratna ( 2003) has explained the
development of Indian trade Unionism based
on the main emphasis of the trade union
theories . She has further explained the back-
ground of the different trade unions on
evolution of political groups in India along
with some unique characteristics of many
others , specially the local unions under the
patronage of different charismatic
personalities . Prior to the research of Prof.
Sen , Mathur and Mathur ( 1962) , Reveri (
1972) , Soman ( 1957) , Karnik ( 1960) ,
Kennedy ( 1955) , Sharma ( 1963) , Fonseca (
1964) , Ghosh ( 1960) and Malhotra ( 1963)
have provided a lot of information both
theoretical and empirical on trade union
movement in India . Mathur and Mathur ,
Karnik , Ghosh have traced the history of
trade union movement in India. The studies
of Kennedy ( 1955) , Vaid ( 1962) ,Dufty (
1964) , Fonseca ( 1964) , Sharma ( 1963) ,
Johri ( 1967) , Soman ( 1957) , Nigam ( 1984) ,
Agarwal ( 1984) and Bhangoo ( 1987) have
raised the issues such as process of unionism ,
its role in economic development , role of the
legislation and government in promoting
unionism , new problems and challenges of
trade unions and other related issues of trade
unionism in India. The major limitations of
these studies are their excessive dependence
on secondary data without using behavioral
data. The studies on unionism at the area ,
industry and enterprise level are very few in
India . Kulkarni's (1946) research was the
pace-setter in real sense in this regard.
Kennedy (1955) , Sheth ( 1960) , Singh ( 1968)
, Murphy ( 1981) , Gaur ( 1986) , and Asdhir (
1987) have studied trade unionism in
Bombay , Tamil Nadu , Ahmedabad , Rajasthan
and Punjab by applying historical approach .
Pandey and Vikram ( 1969) studied trade
unions in Delhi's construction industry and
Bograte ( 1968) have worked on the trade
union movement among the Kolkata Dock
workers . The important area , industry or
plant level studies include those of Mast (
1969) , Thakur ( 1968) , Punekar ( 1958) , Vaid
( 1965) , Ramaswamy ( 1977) , Sahoo ( 1977) ,
Monga ( 1973) , Arya ( 1980) , Sinha ( 1984)
etc. The studies indicate that there has not
b e e n a ny s i g n i f i c a n t d i f fe re n c e i n
characteristics of trade unions at area ,
industry , state and national levels with
regard to multiplicity of units , inter-union
and intra-union rivalries and other important
aspects of the trade unionism.
Pandey and Vikram (1969) have done the
causal analysis on level of workers'
participation in trade unions in industries .
They have identified the attributes such as
lack of enlightened leadership , illiteracy
Indira Management Review - 59July 2012
Trade Unions in Leather industryin Kolkata
among workers , managements' hostility ,
low interest of the etc. . The studies of Dayal
and Sharma ( 1970) , Sinha and Paul ( 1963) ,
Ganguli ( 1954) , Sayles and Strauss ( 1953) ,
Monga and Mogga ( 1981) and Mukherjee (
1985) have investigated the variables ,
attitude toward unions' functions and other
perceptions regarding unions . These studies
have mainly investigated the relationship
between trade union participation and
different variables like age , length of service ,
rural or urban background and educational
level .
Significant researches have also been
observed on the fundamental characteristics
of trade union leadership in India. The
researches in this regard can be witnessed in
the streams like dependence of leadership
efficiency on different demographic factors
of the leader , level of political interference in
trade union leaderships etc. Mathur and
Raman ( 1962) , Dayal and Sharma ( 1976) ,
Singh ( 1980) and Rao ( 1984) have
attempted to analyse the leadership
efficiency with the help of factors like age,
gender, caste, parental occupation , political
aff i l iat ion etc . Reindrop ( 1971) ,
Ramaswamy ( 1977) and Acharji ( 1980)
have observed that the outsiders, mainly the
political leaders play the dominant role in the
functions of trade unions in many industries .
Pattabhi ( 1967) , Aziz ( 1974) , Ashraf ( 1974)
, Baveskar ( 1974) in their research works
have highlighted the political manipulations ,
dependence and weakness of the unions and
the use of union funds for different political
purposes . Nanda ( 1968) and Ramaswamy (
1971) have contributed something very
significant on the research of the out-side
political intervention in trade union
Available literatures on leather industry in Kolkata mostly comprises of different reports , monographs and few research papers . Report of Council of Indian Leather exports (2005) has provided the information that West Bengal used to account for 65 percent of India's leather goods exports (1999-2000 exports were valued at USD 226 million) . But its share of total Indian leather and leather goods exports is 15 percent . The European Union and North America are the leading importers of West Bengal's leather and leather goods (79 percent and 12 percent respectively). Unfortunately, West Bengal is generally considered a source of low-priced, poor quality leather goods. Improving the quality of both leather and leather goods is a problem as most tanneries and manufacturers are small and cannot afford the investments required to upgrade production facilities. Only a few manufacturers have modern equipment. But most of them are handicapped by low overall production capacity, which prevents them executing large export orders. However, West Bengal is till considered India's largest manufacturer of leather goods. In addition to BIL (annual capacity over 20 million pairs of shoes/uppers) there are approximately 20,000 small units making footwear/uppers (12 million pairs per year); industrial gloves (50 million pairs per year); garments (800,000 pieces per year); and accessories and luggage 35 million pieces per year). Annual Report of the Indian leather producers Association ( 2009) has observed that Kolkata is the single largest concentration of leather industry in West Bengal and Kolkata offers the leather industry several advantages like easy availability of a wide variety of leather (cow, calf, buffalo, sheep, goat, kid); low production costs; a large pool of unskilled, semi-skilled and skilled workers at competitive rates; and
60 Indira Management Review - July 2012
Trade Unions in Leather industryin Kolkata
abundant water and power. An airport and two ports facilitate exports. West Bengal's leather industry directly and indirectly employs over 200,000 people . Roy , Satyaki ( 2009) has conducted an extensive research o n t h e i n s t i t u t i o n a l f a i l u r e s a n d imperfections that prevail in the supply of indivisible inputs and collective action in a typical 'low-road' cluster in Kolkata and has argued that market failures due to existence of information imperfections , externalities and public good and the institutional failure to resolve those shortcomings only partially explain the depressed status of these clusters , including Kolkata leather cluster .He further added that , the explanation critically rests on the fact of asymmetric power relations and conflicts arising between the trader and the small producer reproducing a production relation that thwarts the high road growth path. The spawning of small enterprises in such clusters is a result of self-exploitative fragmentation that does not flow from entrepreneurship , but from the survival strategy of labour in the context of depressed wages , as the author added . In this working paper the author has highlighted all comprehensive issues like production organisation, labour process and other issues pertaining to the socio-economic analysis of the functioning of the leather cluster of Kolkata. The paper further observes that most of the units are owned by the male and about 87.5 % of the units surveyed by the author are either owned as proprietorship or as family owned house-hold work .The paper further classifies the units of Kolkata leather cluster into three categories-the units those produce more than 200 pairs per week, those producing in between 200-500 pairs per week and those producing more than 500 units per week. The paper has only included
those units , which are producing shoes and finally observes that the success depends on the dynamic relationship between producer and the trader and the appropriate government intervention in streamlining the process of technology up-gradation, process improvement etc. Though , very few literatures have been identified on the work-force pattern and labour practices in the leather industry in Kolkata , but the research by Roy , Satyaki ( 2009) may be considered as the pioneering works on the issue. Report on leather industry including footwear and other art works in India , published by the Labour Bureau , Ministry of Labour and Employment , Government of India ( 2008) has given a comprehensive picture on the working conditions and social backgrounds of the workers , working in the leather industry across India , including the leather industry at Kolkata , which should be considered as another important source to depend on.
Surprisingly very less number of research materials are available on the trade union participation in Kolkata leather cluster, though adequate sources may be available on the same subject in many other industries . Mostly news paper reports published on workers agitations against different collective issues can be used here for the purpose. Therefore , an important research gap can be easily identified here paving the way of empirical investigation .
Indira Management Review - 61July 2012
Trade Unions in Leather industryin Kolkata
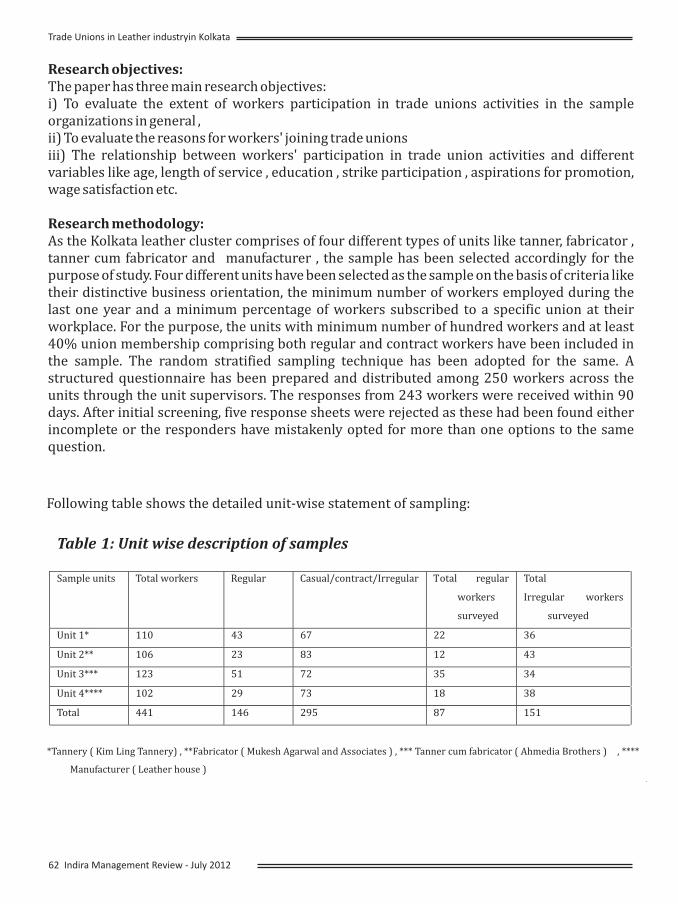
Research objectives:The paper has three main research objectives:i) To evaluate the extent of workers participation in trade unions activities in the sample organizations in general ,ii) To evaluate the reasons for workers' joining trade unions iii) The relationship between workers' participation in trade union activities and different variables like age, length of service , education , strike participation , aspirations for promotion, wage satisfaction etc.
Research methodology:As the Kolkata leather cluster comprises of four different types of units like tanner, fabricator , tanner cum fabricator and manufacturer , the sample has been selected accordingly for the purpose of study. Four different units have been selected as the sample on the basis of criteria like their distinctive business orientation, the minimum number of workers employed during the last one year and a minimum percentage of workers subscribed to a specific union at their workplace. For the purpose, the units with minimum number of hundred workers and at least 40% union membership comprising both regular and contract workers have been included in the sample. The random stratified sampling technique has been adopted for the same. A structured questionnaire has been prepared and distributed among 250 workers across the units through the unit supervisors. The responses from 243 workers were received within 90 days. After initial screening, five response sheets were rejected as these had been found either incomplete or the responders have mistakenly opted for more than one options to the same question.
Following table shows the detailed unit-wise statement of sampling:
Table 1:
Sample units
Unit wi tion o plesse descrip
Total workers
f sam
Regular Casual/contract/Irregular Total regular
workers
surveyed
Total
Irregular workers
surveyed
Unit 1* 110 43 67 22 36
Unit 2** 106 23 83 12 43
Unit 3*** 123 51 72 35 34
Unit 4**** 102 29 73 18 38
Total 441 146 295 87 151
Tannery ( Kim Ling Tannery) , **Fabricator ( Mukesh Agarwal and Associates ) , *** Tanner cum fabricator ( Ahmedia Brothers ) , ****
Manufacturer ( Leather house )
*
62 Indira Management Review - July 2012
Trade Unions in Leather industryin Kolkata
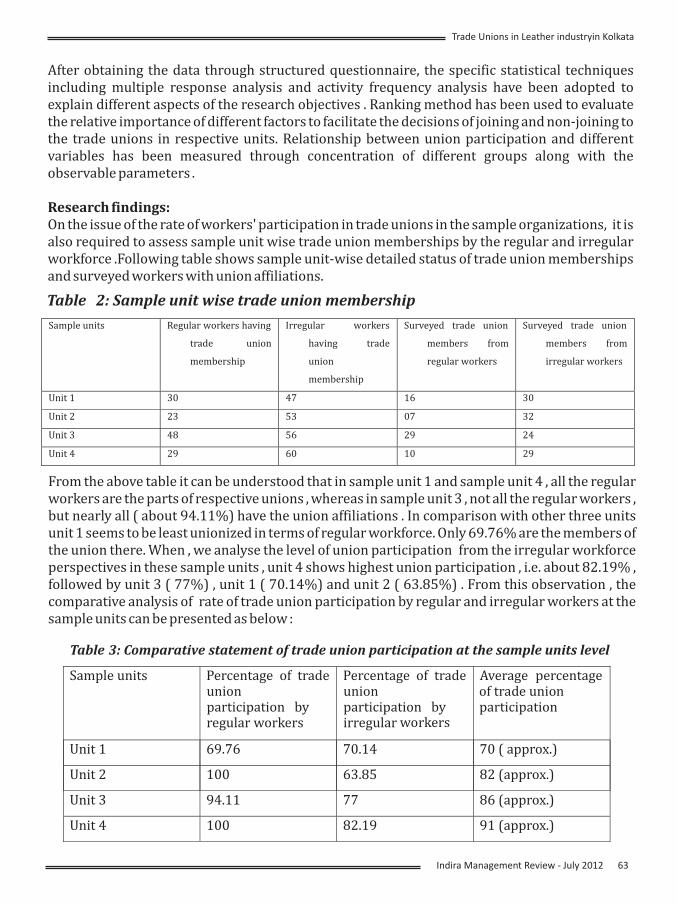
After obtaining the data through structured questionnaire, the specific statistical techniques including multiple response analysis and activity frequency analysis have been adopted to explain different aspects of the research objectives . Ranking method has been used to evaluate the relative importance of different factors to facilitate the decisions of joining and non-joining to the trade unions in respective units. Relationship between union participation and different variables has been measured through concentration of different groups along with the observable parameters .
Research findings:On the issue of the rate of workers' participation in trade unions in the sample organizations, it is also required to assess sample unit wise trade union memberships by the regular and irregular workforce .Following table shows sample unit-wise detailed status of trade union memberships and surveyed workers with union affiliations.
Table 3: Com
Sample units
parative o n thstatement f trade u
Percentage of tradeunionparticipation byregular workers
ion participation at
Percentage of tradeunionparticipation byirregular
e sample units level
Average percentageof trade unionparticipation
rkerswo
Unit 1 69.76 70.14 70 ( approx.)
Unit 2 100 63.85 82 (approx.)
Unit 3 94.11 77 86 (approx.)
Unit 4 100 82.19 91 (approx.)
Table 2:
Sample units
Sample n emb punit wise trade u
Regular workers having
trade union
membership
ion m ershi
Irregular workers
having trade
union
membership
Surveyed trade union
members from
regular workers
Surveyed trade union
members from
irregular workers
Unit 1 30 47 16 30
Unit 2 23 53 07 32
Unit 3 48 56 29 24
Unit 4 29 60 10 29
From the above table it can be understood that in sample unit 1 and sample unit 4 , all the regular workers are the parts of respective unions , whereas in sample unit 3 , not all the regular workers , but nearly all ( about 94.11%) have the union affiliations . In comparison with other three units unit 1 seems to be least unionized in terms of regular workforce. Only 69.76% are the members of the union there. When , we analyse the level of union participation from the irregular workforce perspectives in these sample units , unit 4 shows highest union participation , i.e. about 82.19% , followed by unit 3 ( 77%) , unit 1 ( 70.14%) and unit 2 ( 63.85%) . From this observation , the comparative analysis of rate of trade union participation by regular and irregular workers at the sample units can be presented as below :
Indira Management Review - 63July 2012
Trade Unions in Leather industryin Kolkata
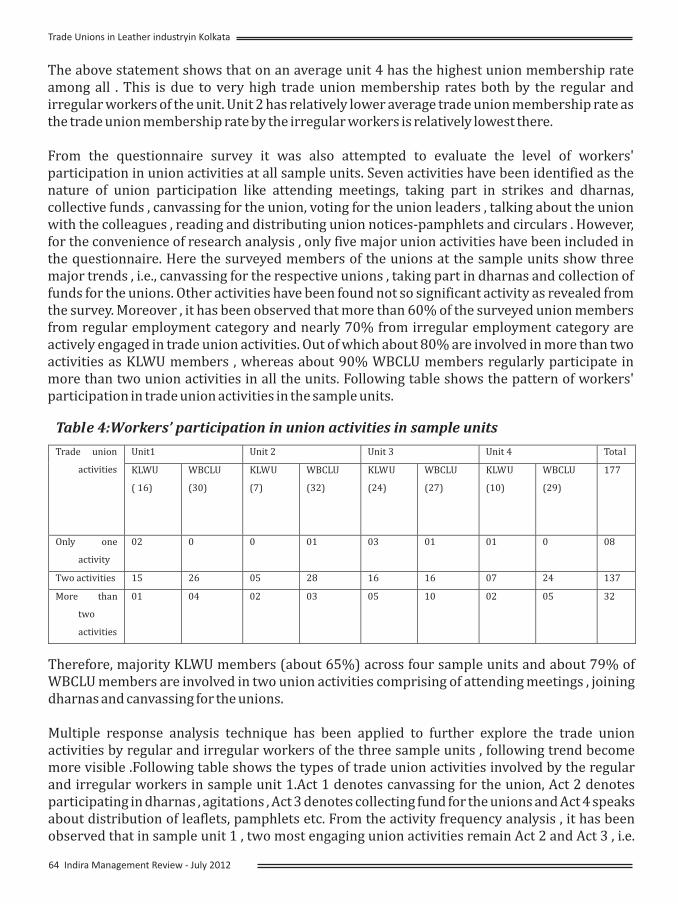
The above statement shows that on an average unit 4 has the highest union membership rate among all . This is due to very high trade union membership rates both by the regular and irregular workers of the unit. Unit 2 has relatively lower average trade union membership rate as the trade union membership rate by the irregular workers is relatively lowest there.
From the questionnaire survey it was also attempted to evaluate the level of workers' participation in union activities at all sample units. Seven activities have been identified as the nature of union participation like attending meetings, taking part in strikes and dharnas, collective funds , canvassing for the union, voting for the union leaders , talking about the union with the colleagues , reading and distributing union notices-pamphlets and circulars . However, for the convenience of research analysis , only five major union activities have been included in the questionnaire. Here the surveyed members of the unions at the sample units show three major trends , i.e., canvassing for the respective unions , taking part in dharnas and collection of funds for the unions. Other activities have been found not so significant activity as revealed from the survey. Moreover , it has been observed that more than 60% of the surveyed union members from regular employment category and nearly 70% from irregular employment category are actively engaged in trade union activities. Out of which about 80% are involved in more than two activities as KLWU members , whereas about 90% WBCLU members regularly participate in more than two union activities in all the units. Following table shows the pattern of workers' participation in trade union activities in the sample units.
Tabl 4:We o s’ participati union activit n sample unirker on in ies i ts
Unit1 Unit 2 Unit 3 Unit 4 TotalTrade union
activities KLWU
( 16)
WBC
(30)
LU KLW
7)
U
(
WBC
(32)
LU KLW
(24)
U WBC
(27)
LU KLW
(10)
U WBC
(29)
LU 177
Only one
activity
02 0 0 01 03 01 01 0 08
Two activities 15 26 05 28 16 16 07 24 137
More than
two
activities
01 04 02 03 05 10 02 05 32
Therefore, majority KLWU members (about 65%) across four sample units and about 79% of WBCLU members are involved in two union activities comprising of attending meetings , joining dharnas and canvassing for the unions.
Multiple response analysis technique has been applied to further explore the trade union activities by regular and irregular workers of the three sample units , following trend become more visible .Following table shows the types of trade union activities involved by the regular and irregular workers in sample unit 1.Act 1 denotes canvassing for the union, Act 2 denotes participating in dharnas , agitations , Act 3 denotes collecting fund for the unions and Act 4 speaks about distribution of leaflets, pamphlets etc. From the activity frequency analysis , it has been observed that in sample unit 1 , two most engaging union activities remain Act 2 and Act 3 , i.e.
64 Indira Management Review - July 2012
Trade Unions in Leather industryin Kolkata
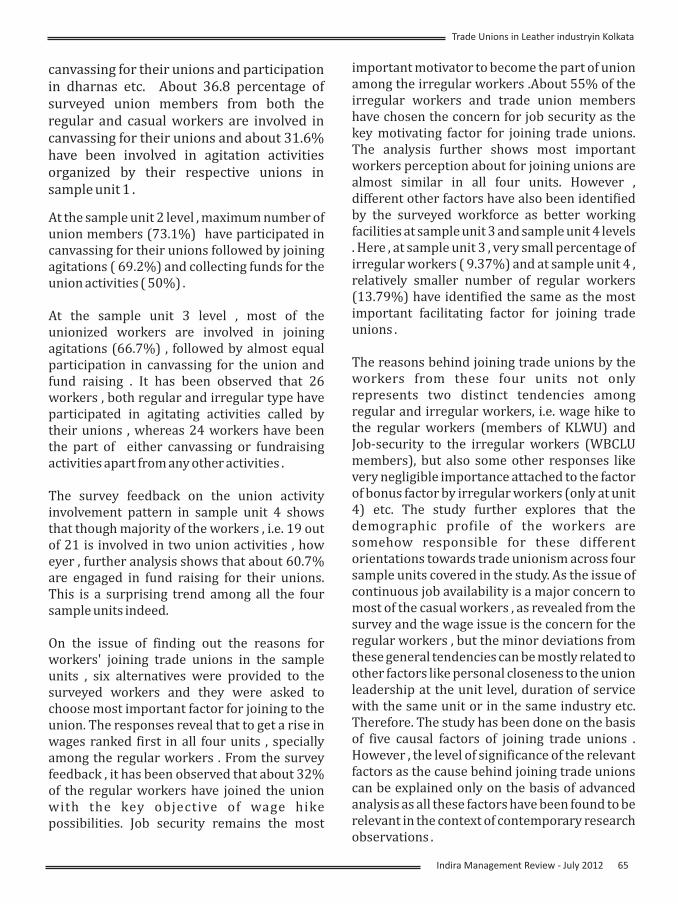
canvassing for their unions and participation in dharnas etc. About 36.8 percentage of surveyed union members from both the regular and casual workers are involved in canvassing for their unions and about 31.6% have been involved in agitation activities organized by their respective unions in sample unit 1 .
At the sample unit 2 level , maximum number of union members (73.1%) have participated in canvassing for their unions followed by joining agitations ( 69.2%) and collecting funds for the union activities ( 50%) .
At the sample unit 3 level , most of the unionized workers are involved in joining agitations (66.7%) , followed by almost equal participation in canvassing for the union and fund raising . It has been observed that 26 workers , both regular and irregular type have participated in agitating activities called by their unions , whereas 24 workers have been the part of either canvassing or fundraising activities apart from any other activities .
The survey feedback on the union activity involvement pattern in sample unit 4 shows that though majority of the workers , i.e. 19 out of 21 is involved in two union activities , how eyer , further analysis shows that about 60.7% are engaged in fund raising for their unions. This is a surprising trend among all the four sample units indeed.
On the issue of finding out the reasons for workers' joining trade unions in the sample units , six alternatives were provided to the surveyed workers and they were asked to choose most important factor for joining to the union. The responses reveal that to get a rise in wages ranked first in all four units , specially among the regular workers . From the survey feedback , it has been observed that about 32% of the regular workers have joined the union with the key objective of wage hike possibilities. Job security remains the most
important motivator to become the part of union among the irregular workers .About 55% of the irregular workers and trade union members have chosen the concern for job security as the key motivating factor for joining trade unions. The analysis further shows most important workers perception about for joining unions are almost similar in all four units. However , different other factors have also been identified by the surveyed workforce as better working facilities at sample unit 3 and sample unit 4 levels . Here , at sample unit 3 , very small percentage of irregular workers ( 9.37%) and at sample unit 4 , relatively smaller number of regular workers (13.79%) have identified the same as the most important facilitating factor for joining trade unions .
The reasons behind joining trade unions by the workers from these four units not only represents two distinct tendencies among regular and irregular workers, i.e. wage hike to the regular workers (members of KLWU) and Job-security to the irregular workers (WBCLU members), but also some other responses like very negligible importance attached to the factor of bonus factor by irregular workers (only at unit 4) etc. The study further explores that the demographic profile of the workers are somehow responsible for these different orientations towards trade unionism across four sample units covered in the study. As the issue of continuous job availability is a major concern to most of the casual workers , as revealed from the survey and the wage issue is the concern for the regular workers , but the minor deviations from these general tendencies can be mostly related to other factors like personal closeness to the union leadership at the unit level, duration of service with the same unit or in the same industry etc. Therefore. The study has been done on the basis of five causal factors of joining trade unions . However , the level of significance of the relevant factors as the cause behind joining trade unions can be explained only on the basis of advanced analysis as all these factors have been found to be relevant in the context of contemporary research observations .
Indira Management Review - 65July 2012
Trade Unions in Leather industryin Kolkata
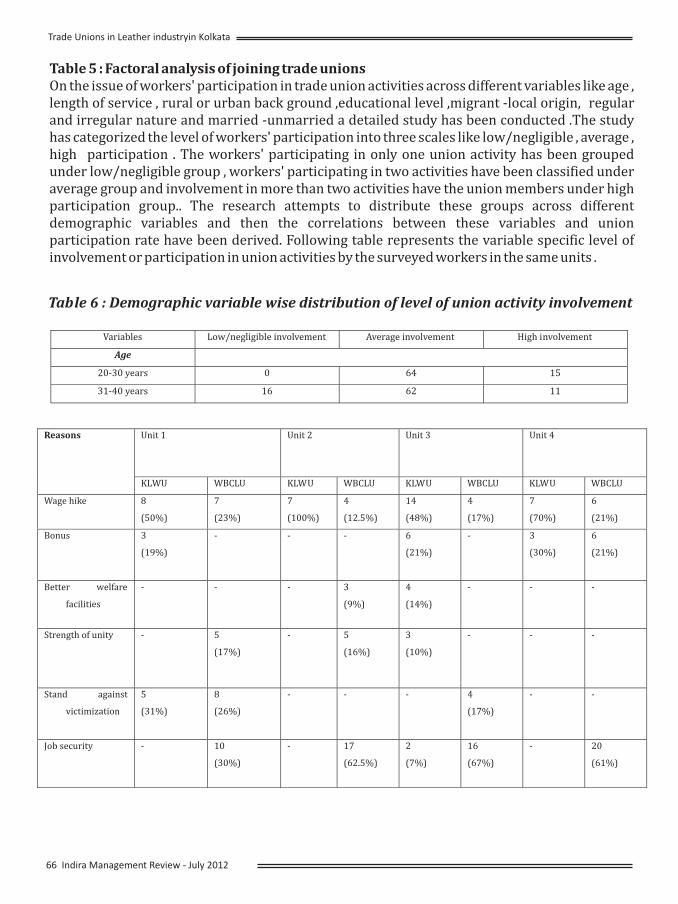
Table 5 : Factoral analysis of joining trade unionsOn the issue of workers' participation in trade union activities across different variables like age , length of service , rural or urban back ground ,educational level ,migrant -local origin, regular and irregular nature and married -unmarried a detailed study has been conducted .The study has categorized the level of workers' participation into three scales like low/negligible , average , high participation . The workers' participating in only one union activity has been grouped under low/negligible group , workers' participating in two activities have been classified under average group and involvement in more than two activities have the union members under high participation group.. The research attempts to distribute these groups across different demographic variables and then the correlations between these variables and union participation rate have been derived. Following table represents the variable specific level of involvement or participation in union activities by the surveyed workers in the same units .
Tab emograp istrib of union lvementle 6 : D
Variables
hic variable wise d
Low/negligible involvement
ution of level
Average involvement
activity invo
High involvement
Age
20-30 years 0 64 15
31-40 years 16 62 1
1
Unit 1 Unit 2 Unit 3 Unit 4Reasons
KLWU WBCLU KLWU WBCLU KLWU WBCLU KLWU WBCLU
Wage hike 8
0%)(5
7
3%)(2
7
00%)(1
4
2.5%)(1
14
8%)(4
4
7%)(1
7
0%)(7
6
1%)(2
Bonus 3
)(19%
- - - 6
(21%)
- 3
(30%)
6
(21%)
Better welfare
facilities
- - - 3
(9%)
4
(14%)
- - -
Strength of unity - 5
(17%)
- 5
(16%)
3
10%)(
- - -
Stand against
victimization
5
(31%)
8
(26%)
- - - 4
)(17%
- -
Job security - 10
(30%)
- 17
(62.5%)
2
(7%)
16
(67%)
- 20
(61%)
66 Indira Management Review - July 2012
Trade Unions in Leather industryin Kolkata
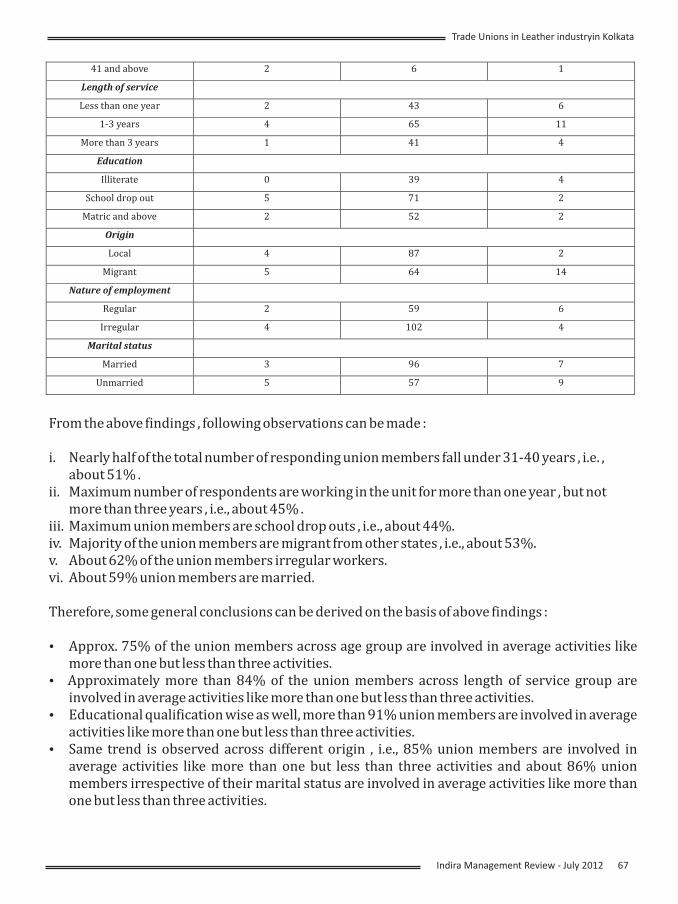
41 and above 2 6 1
Length of service
Less rthan one yea 2 43 6
1-3 years 4 65 11
More than 3 years 1 41 4
Education
Illiterate 0 39 4
School drop out 5 71 2
Matric and above 2 52 2
Origin
Local 4 87 2
Migrant 5 64 14
Nature ymentof emplo
Regular 2 59 6
Irregular 4 102 4
Ma usrital stat
Married 3 96 7
Unmarried 5 57 9
From the above findings , following observations can be made :
i. Nearly half of the total number of responding union members fall under 31-40 years , i.e. , about 51% .
ii. Maximum number of respondents are working in the unit for more than one year , but not more than three years , i.e., about 45% .
iii. Maximum union members are school drop outs , i.e., about 44%.iv. Majority of the union members are migrant from other states , i.e., about 53%.v. About 62% of the union members irregular workers.vi. About 59% union members are married.
Therefore, some general conclusions can be derived on the basis of above findings :
?Approx. 75% of the union members across age group are involved in average activities like more than one but less than three activities.
?Approximately more than 84% of the union members across length of service group are involved in average activities like more than one but less than three activities.
?Educational qualification wise as well, more than 91% union members are involved in average activities like more than one but less than three activities.
?Same trend is observed across different origin , i.e., 85% union members are involved in average activities like more than one but less than three activities and about 86% union members irrespective of their marital status are involved in average activities like more than one but less than three activities.
Indira Management Review - 67July 2012
Trade Unions in Leather industryin Kolkata
Implications of the study :The findings of the study are of good significance for may reasons . Firstly , the paper is a glimpse of contemporary demographic characteristics of an highly employment generating industry ,i.e. the leather industry .Secondly , the study is one of its kind on Kolkata leather industry as the detailed study on the issue has been found to be nearly absent in the knowledge domain. Thirdly, the study has further opened up the possibilities of large scale research on the impact of demographic trends in industrial relations scenario in Kolkata leather industry .Fourthly, the very fundamental observations of the paper have highlighted the needs of some immediate interventions by the appropriate authority at the required level to facilitate the process of decent work practices etc. as mentioned by ILO in its mission agenda for 2020. Finally , the paper can be further expanded on the certain grounds like cross sectional analysis in terms of impact multiple variables of trade union participation across the workforce in the industry.
Limitations of study :The study has the limitations as all the data have been collected through single source self reported measures. Therefore , common method variance may be a major problem. Responses of individual survey items may not be truly independent as there has been a chance influence of group membership. From this perspective , it can be said that more research is needed to examine the generalization of this study.
Conclusions:The study is a systematic effort to understand the contemporary trends of trade unionism in organized leather industry of Kolkata . This has not only highlighted the issues like the existence of politically influenced blanket
unionism , but also indicated briefly about the different priorities of different segments of the trade union members across industry. The major concerns of different groups , the different levels of involvements etc. have been highlighted as the first hand observation , which can be selectively used or referred for further research .
References :
1. Agarwal , M.L.(1984) , "Trade Unions in India-Trends
and a Gandhian Perspective" ,Indian Journal of Labour
Economics , Vol.26,No. 4 , 1984,pp.400-08.
2. Annual Report (2009), Indian Leather Products
Association, Kolkata.
3. Ashdir, Vijay (1987), Industrial relations in India ,
Deep and Deep publications , New Delhi ,pp. 23-32
4. Acharji, Nilma ( 1980) , Trade Union leadership profile
, Ambica Publications , New Delhi , pp.45-48
5. Aziz, Abdul (1974) , "Aspects of Trade Unionism in
Karnataka",The Economic Times , No.5 ., June 21,
Bombay
6. Ashraf, M.S.(1974) , "Political Affiliations of Industrial
Workers-an Area study,"Indian Journal of Industrial
relations , Vol.10, No.2 , pp.48-53
7. Baveskar , B.S.(1974) ,"Sociology of politics", in survey
of Research in Sociology and Social Anthropology , Vol. II
, ICSSR , Popular Prakashan , New Delhi , pp.67-90
8. Bhangoo, K.S.(1987) ,"Trade unions in India :
Problems and responsibilities ', in J.L.Rastogi
et.al.,Planning for industrial relations Management ,
Deep and Deep Publications , New Delhi , pp. 205-213.
9. Bose, Indranil( 2011) , 'Job security and its impact on
unionization of work force:A survey on selected leather
organizations of Kolkata' , ACRM journal of Business and
Management research , Sep , Bengaluru , pp. 45-61
10. Dayal, Ishwar and B.R.Sharma (1970) ,The strike of
supervisory staffs in state Bank of India , Progessive
Corporation , Bombay , pp.37-78.
11. Dayal, Ishwar and B.R.Sharma (1976), Management
of Trade Unions , Shri Ram Centre , New Delhi.
12. Dufty , N.F. (1964) , Industrial relations in India ,
Allied Publishers , Bombay , pp.56-58
13. Fonseca , A.J.(1964) ,Wage determination and
organized labour in India, Oxford University Press, New
Delhi, pp. 123-134
14. Ganguli , H.C.(1954) , "Relations of union
membership to attribute of Industrial Workers", Indian
Journal of Social work , Vol.15 , No.3 ,pp.45-49
68 Indira Management Review - July 2012
Trade Unions in Leather industryin Kolkata
15. Gaur , G.L.(1986) ,Trade unionism and industrial relations , Deep and Deep publications , New Delhi ,pp.56-57
16. Ghosh , Deepak ( 1960),'Industrial relations in changing perspective', Indian journal of Industrial relations ,
Vol.11,Issue 3, New Delhi, pp.156-162
17. Jaspal Singh ( 1980) , India's trade union leadership , National publishing house , New Delhi, pp.56-67
18. Johri, C.K.(1967) ,Unionism in the developing countries , Asia publishing house , Bombay , pp.92-97
19. Karnik , V.B.(1960,1965,1971) , "Indian Trade Unions : A survey " , Allied Publishers , Bombay , pp.67-69
20. Kennedy , V.D.(1955) ,Problem of Indian Trade Unionism and Labour Relations , University of California Press ,
California , pp.45-56
21. Kulkarni ,P.D.(1946,1949.1952) ,"Textile trade unionism in Bombay ', Indian Journal of Social work , Vol.7,No.3 ,
New Delhi, pp.67-69
22. Mathur , A.S.(1964) , Indian working class movement , Chaitanya , Allahabad , pp.12-19
23. Mathur , A.S.,J.S. (1957, 1965) , 'Trade union movement in India', Chaitanya , Allahabad ,pp.78-80
24. Malhotra,P.C.(1963) ,"Indian Labour movement -A survey", S.Chand and Company , New Delhi ,pp.56-65
25. Mathur , A.S.and P.Raman ( 1962,1978) ," Trade union leadership in India", Agra University journal of researchers ,
Vol.10 , pp.97-110
26. Monga, M.L.,Ashok (1981) , 'Commitment to unionism', Productivity , Vol.22,No.3 , New Delhi,pp.11-18
27. Mukherjee , Indrani ( 1985), "Industrial workers in a developing society : A sociological study' , Mittal Publications ,
New Delhi, pp.48-51
28. Mrphy, Eaman(1981) ,'Unions in conflict:A comparative study of Four South Indian Textile centres, 1918-
39",Manohar Publications , New Delhi , pp.67-83
29. Nanda, A.C.(1968,1976) ,"Trade union influence in Elections : A case study', Economic and Political weekly, Vol.3 ,
No. 10, 1968
30. Pandey, S.M., Vikram, C.M. (1969) , 'Trade unionism in Delhi's Building industry', Indian Journal of Industrial
Relations , Vol.4 , No.3 , 1969,pp.298-321
31. Pattabhi,Raman, N.M., "Political involvement of India's trade unions", Asia Publishing House, Bombay , 1967
32. Ramaswamy,E.A.(1971) ,"Trade unions and electoral processes", Indian Journal of Industrial relations,Vol.7 , No.2
,pp.118-129
33. Rao,M.M.(1984) ,"Union leadership profile in Visakhapatnam", Indian Journal of Industrial relations , Vol.19 , No.4
,pp.502-506
34. Ray, Satyaki ( 2009) , 'Labour Issues in unorganized sector employment', Political and Economic Weekly , Economic
and Political weekly,Vol.12, Nos. 29 &30 ,1960 ,pp.1159-60.
35. Reindrop, Julian (1971) , Leaders and leadership in the Trade Unions in Bangalore , the Christian Literature Society
, Madras , pp.341-362
36. Report of Council of Leather exports, Govt. of India, 2005
37. Report on leather industry including footwear and other art works in India , published by the Labour Bureau ,
Ministry of Labour and Employment , Government of India ( 2008).
38. Reveri , C.(1972,1979) ,The Indian Union Movement , Orient Longman , Bombay ,pp.67-105
39. Sayles , L.R. , Strauss , G.(1953.1960) ,'The local union : Its place in the industrial plant', Harper Collins , New York ,
pp. 345-410
40. Sen, Ratna ( 2003), 'Dynamics of Industrial Relations' , PHI , New Delhi ,pp.47-86
41. Singh , V.B.( 1965) , 'Trade Union Movement in India', in V.B.Singh (ed.) , Economic History of India(1857-1956),
Asia, Bombay ,pp.67-78
42. Sharma , G.K.(1964) ,Labour Movement in India , Sterling Publishers , Jalandhar ,pp.167-181
43. Sheth ,N.R.(1960) ,'Trade union in an Indian Factory: A sociological Study', Economic and Political weekly,Vol.12,
Nos. 29 &30 ,1960 ,pp.1159-60.
44. Soman, R.J.(1963,1976) , 'Peaceful industrial Relations -Their Science and Technique' , Vora Publications,
Ahmedabad , pp.67-75
Indira Management Review - 69July 2012
Trade Unions in Leather industryin Kolkata
*Professor, School of Management, SRM University, Chennai 603203([email protected])
**Asst. Professor, SRM B-School, SRM University,Chennai 600026([email protected])
***Research Scholar, School of Management, SRM University, Chennai 603 [email protected]
Key words:Multi-faceted, Paradigm Shift, Expert systems, Artificial Intelligence, Knowledge Economy
Knowledge Management & Electronic Human Resource Management
Abstract
Knowledge management often encompasses identifying and mapping intellectual assets within the organization, generating new knowledge for competitive advantage within the organization, making vast amounts of corporate information accessible, sharing of best practices, and technology that enables all of the above - including groupware and intranets. Globally, knowledge has become the most important factor in economic development and knowledge assets are considered essential for economic growth, competitive advantage, human development and quality of human life. Knowledge management presents HRM with the opportunity to become pivotal to the strategic management of the organization and a catalyst for knowledge creation and building value. This involves more than just re-labeling Human Resources - it is a fundamental paradigmatic shift for HRM and senior management. Thus this paper is to promote the ideas of applying Knowledge Management to EHRM solutions. It is to provide business organizations with pragmatic understanding about integrating knowledge management strategy and t e c h n o l o g i e s i n H u m a n R e s o u r c e Management for successful performance.
Introduction
The importance of 'knowledge' for the economy and business has been discussed since at least 1945, if only sporadically, and received growing attention from the 1960s. The idea that knowledge could and should be managed, however, seems not to have been seriously considered until a decade or so later. Knowledge management is a business activity with two primary aspects[1 and 2]:?Treating the knowledge component of business activities as an explicit concern of business reflected in strategy, policy, and practice at all levels of the organization. ?Making a direct connection between an organization's intellectual assets - both explicit [recorded] and tacit [personal know-how] - and positive business results.
In practice, knowledge management often encompasses identifying and mapping intellectual assets within the organization, generating new knowledge for competitive advantage within the organization, making vast amounts of corporate information accessible, sharing of best practices, and technology that enables all of the above - including groupware and intranets [3] which is shown in figure 1. Knowledge management shares with education and artificial intelligence the need
Dr. A. Chandra Mohan,*M. Valliammal**
Manivannan. S. K***
70 Indira Management Review - July 2012
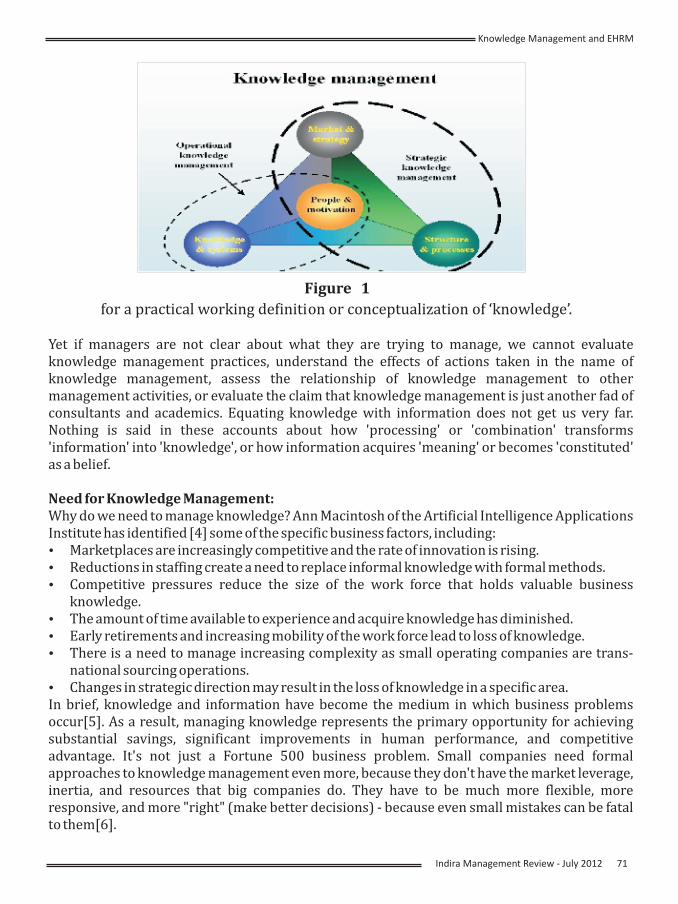
Yet if managers are not clear about what they are trying to manage, we cannot evaluate knowledge management practices, understand the effects of actions taken in the name of knowledge management, assess the relationship of knowledge management to other management activities, or evaluate the claim that knowledge management is just another fad of consultants and academics. Equating knowledge with information does not get us very far. Nothing is said in these accounts about how 'processing' or 'combination' transforms 'information' into 'knowledge', or how information acquires 'meaning' or becomes 'constituted' as a belief.
Need for Knowledge Management:Why do we need to manage knowledge? Ann Macintosh of the Artificial Intelligence Applications Institute has identified [4] some of the specific business factors, including:?Marketplaces are increasingly competitive and the rate of innovation is rising.?Reductions in staffing create a need to replace informal knowledge with formal methods. ?Competitive pressures reduce the size of the work force that holds valuable business
knowledge.?The amount of time available to experience and acquire knowledge has diminished. ?Early retirements and increasing mobility of the work force lead to loss of knowledge. ?There is a need to manage increasing complexity as small operating companies are trans-
national sourcing operations. ?Changes in strategic direction may result in the loss of knowledge in a specific area.In brief, knowledge and information have become the medium in which business problems occur[5]. As a result, managing knowledge represents the primary opportunity for achieving substantial savings, significant improvements in human performance, and competitive advantage. It's not just a Fortune 500 business problem. Small companies need formal approaches to knowledge management even more, because they don't have the market leverage, inertia, and resources that big companies do. They have to be much more flexible, more responsive, and more "right" (make better decisions) - because even small mistakes can be fatal to them[6].
Figure 1
for a practical working definition or conceptualization of ‘knowledge’.
Indira Management Review - 71July 2012
Knowledge Management and EHRM
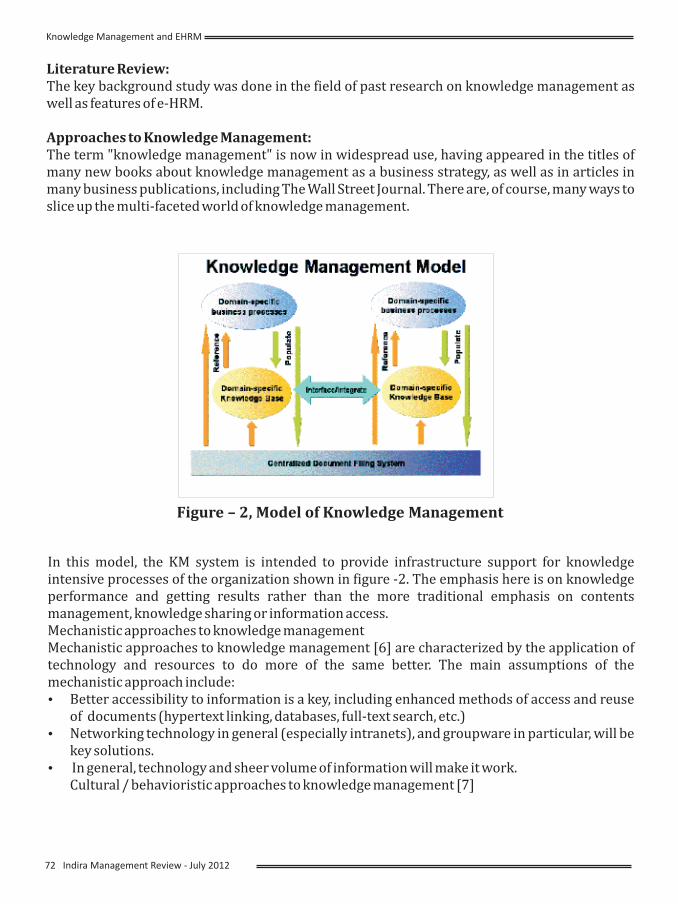
Literature Review:The key background study was done in the field of past research on knowledge management as well as features of e-HRM.
Approaches to Knowledge Management:The term "knowledge management" is now in widespread use, having appeared in the titles of many new books about knowledge management as a business strategy, as well as in articles in many business publications, including The Wall Street Journal. There are, of course, many ways to slice up the multi-faceted world of knowledge management.
Figure – 2, Model of Knowledge Management
In this model, the KM system is intended to provide infrastructure support for knowledge intensive processes of the organization shown in figure -2. The emphasis here is on knowledge performance and getting results rather than the more traditional emphasis on contents management, knowledge sharing or information access.Mechanistic approaches to knowledge managementMechanistic approaches to knowledge management [6] are characterized by the application of technology and resources to do more of the same better. The main assumptions of the mechanistic approach include:?Better accessibility to information is a key, including enhanced methods of access and reuse
of documents (hypertext linking, databases, full-text search, etc.) ?Networking technology in general (especially intranets), and groupware in particular, will be
key solutions.? In general, technology and sheer volume of information will make it work.
Cultural / behavioristic approaches to knowledge management [7]
72 Indira Management Review - July 2012
Knowledge Management and EHRM
Cultural/behavioristic approaches, with substantial roots in process re-engineering and change management, tend to view the "knowledge problem" as a management issue. Technology though ultimately essential for managing explicit knowledge resources - is not the solution. These approaches tend to focus more on innovation and creativity (the "learning organization") than on leveraging existing explicit resources or making working knowledge explicit[8]. Assumptions of cultural/behavioristic approaches often include:
?Organizational behaviors and culture need to be changed … dramatically. In our information-intensive environments, organizations become dysfunctional relative to business objectives. ?Organizational behaviors and culture can be changed, but traditional technology and methods of attempting to solve the "knowledge problem" have reached their limits of effectiveness. A "holistic" view is required.[8] Theories of behavior of large-scale systems are often invoked. ?It's the processes that matter, not the technology. ?Nothing happens or changes unless a manager makes it happen. Systematic approaches to knowledge management [9]
Systematic approaches to knowledge management retain the traditional faith in rational analysis of the knowledge problem: the problem can be solved, but new thinking of many kinds is required. Some basic assumptions:
?It's sustainable results that matter, not the processes or technology … or your definition of "knowledge."
?A resource cannot be managed unless it is modeled, and many aspects of the organization's knowledge can be modeled as an explicit resource. ?Solutions can be found in a variety of disciplines and technologies, and traditional methods of analysis can be used to re-examine the nature of knowledge work and to solve the knowledge problem. ?Cultural issues are important, but they too must be evaluated systematically. Employees may or may not have to be "changed," but policies and work practices must certainly be changed, and technology can be applied successfully to business knowledge problems themselves. ?Knowledge management has an important management component, but it is not an activity or discipline that belongs exclusively to managers.
Business Activities related to Knowledge Management
?Management of Information Systems (MIS) or Information Technology and Information M a n a g e m e n t ( I T / I M ) - K n o w l e d g e management emerged in part out of IT management as it became clear that access to information and data was insufficient to provide enough insight to support decision-making. Recently, major software companies (e.g., Microsoft) have also decided to offer KM services to help integrate technology into the workplace.?Human Resource Management - It is said that the 1980s fixation with "business process re-engineering" had emphasized cost-cutting without appreciating the value of people[10]. It became clear that people were not costs, they were in fact assets because of their knowledge and experience. Within human resource management circles, knowledge management grew as a way of demonstrating,
Indira Management Review - 73July 2012
Knowledge Management and EHRM
in a more systematic way, the value of people to business processes[11].?Change Management - As regular or continuous change became a feature of organizational life, it was recognized that successful change needed to be managed. Since organizational change tends to involve the orchestration of people, technology and resources, knowledge management was considered a key method of tying these threads together[12].?Project and Team Management - As organizations began to rely on short-term projects, serial short-term contracts, and use of teams, it became necessary to provide appropriate support - and capture the resulting knowledge.Corporate Intelligence and Research & Development - In an organization there are also several areas specifically devoted to acquiring and creating useful knowledge, such as technology research centres, intelligence gathering operations, corporate research and training facilities, and libraries[13 and 14].
K n o w l e d g e M a n a g e m e n t i n t h e Technological Era:
The traditional paradigm of information systems is based on seeking a consensual interpretation of information based on socially dictated norms or the mandate of the company bosses[15]. This has resulted in the confusion between 'knowledge' and 'information'. However, knowledge and information are distinct entities![16] While information generated by the computer systems is not a very rich carrier of human interpretation for potential action, 'knowledge' resides in the user's subjective c o n t e x t o f a c t i o n b a s e d o n t h a t information[17 and 18]. Hence, it may not be incorrect to state that knowledge resides in the user and not in the collection of
information, a point made two decades ago by West Churchman, the leading thinker on information systems[19].
Karl Erik Sveiby, the author of The New Organizational Wealth: Managing and Measuring Knowledge-Based Assets , contends that the confusion between `knowledge' and `information' has caused managers to sink billions of dollars in technology ventures that have yielded marginal results. He asserts that the business managers need to realize that unlike information, knowledge is embedded in people... and knowledge creation occurs in the process of social interaction[20]. On a similar note, Ikujiro Nonaka, the renowned Professor of Knowledge, has emphasized that only human beings can take the central role in knowledge creation. He argues that computers are merely tools, however great their information-processing capabilities may be[21]. A very recent Harvard Business Review special issue on Knowledge Management seems to lend credence to this point of view. This issue highlighted the need for constructive conflict in organizations that aspire to be leaders in innovation and creation of new knowledge.
The 'wicked environment' of the new world of business imposes the need for variety and complexity of interpretations of information outputs generated by computer systems. Such variety is necessary for deciphering the multiple world views of the uncertain and unpredictable future. As underscored by the strategy guru Gary Hamel at the recent Academy of Management meeting address, n o n - l i n e a r c h a n g e i m p o s e s u p o n organizations the need for devising non-linear strategies. Such strategies cannot be 'predicted' based on a static picture of information residing in the company's databases. Rather, such strategies will depend
74 Indira Management Review - July 2012
Knowledge Management and EHRM
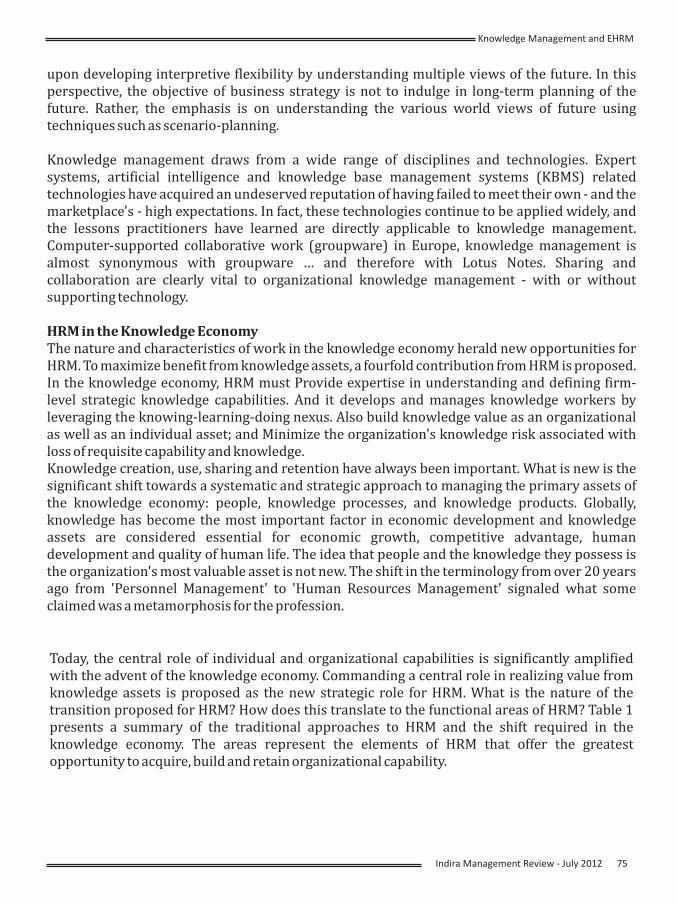
upon developing interpretive flexibility by understanding multiple views of the future. In this perspective, the objective of business strategy is not to indulge in long-term planning of the future. Rather, the emphasis is on understanding the various world views of future using techniques such as scenario-planning.
Knowledge management draws from a wide range of disciplines and technologies. Expert systems, artificial intelligence and knowledge base management systems (KBMS) related technologies have acquired an undeserved reputation of having failed to meet their own - and the marketplace's - high expectations. In fact, these technologies continue to be applied widely, and the lessons practitioners have learned are directly applicable to knowledge management. Computer-supported collaborative work (groupware) in Europe, knowledge management is almost synonymous with groupware … and therefore with Lotus Notes. Sharing and collaboration are clearly vital to organizational knowledge management - with or without supporting technology.
HRM in the Knowledge EconomyThe nature and characteristics of work in the knowledge economy herald new opportunities for HRM. To maximize benefit from knowledge assets, a fourfold contribution from HRM is proposed. In the knowledge economy, HRM must Provide expertise in understanding and defining firm-level strategic knowledge capabilities. And it develops and manages knowledge workers by leveraging the knowing-learning-doing nexus. Also build knowledge value as an organizational as well as an individual asset; and Minimize the organization's knowledge risk associated with loss of requisite capability and knowledge.Knowledge creation, use, sharing and retention have always been important. What is new is the significant shift towards a systematic and strategic approach to managing the primary assets of the knowledge economy: people, knowledge processes, and knowledge products. Globally, knowledge has become the most important factor in economic development and knowledge assets are considered essential for economic growth, competitive advantage, human development and quality of human life. The idea that people and the knowledge they possess is the organization's most valuable asset is not new. The shift in the terminology from over 20 years ago from 'Personnel Management' to 'Human Resources Management' signaled what some claimed was a metamorphosis for the profession.
Today, the central role of individual and organizational capabilities is significantly amplified with the advent of the knowledge economy. Commanding a central role in realizing value from knowledge assets is proposed as the new strategic role for HRM. What is the nature of the transition proposed for HRM? How does this translate to the functional areas of HRM? Table 1 presents a summary of the traditional approaches to HRM and the shift required in the knowledge economy. The areas represent the elements of HRM that offer the greatest opportunity to acquire, build and retain organizational capability.
Indira Management Review - 75July 2012
Knowledge Management and EHRM
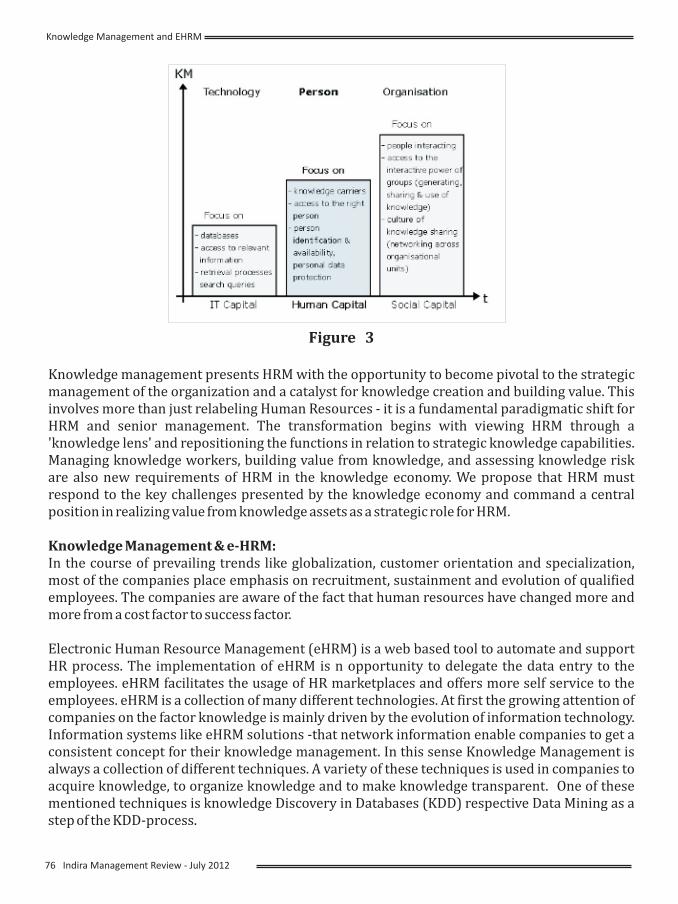
Figure 3
Knowledge management presents HRM with the opportunity to become pivotal to the strategic management of the organization and a catalyst for knowledge creation and building value. This involves more than just relabeling Human Resources - it is a fundamental paradigmatic shift for HRM and senior management. The transformation begins with viewing HRM through a 'knowledge lens' and repositioning the functions in relation to strategic knowledge capabilities. Managing knowledge workers, building value from knowledge, and assessing knowledge risk are also new requirements of HRM in the knowledge economy. We propose that HRM must respond to the key challenges presented by the knowledge economy and command a central position in realizing value from knowledge assets as a strategic role for HRM.
Knowledge Management & e-HRM:In the course of prevailing trends like globalization, customer orientation and specialization, most of the companies place emphasis on recruitment, sustainment and evolution of qualified employees. The companies are aware of the fact that human resources have changed more and more from a cost factor to success factor.
Electronic Human Resource Management (eHRM) is a web based tool to automate and support HR process. The implementation of eHRM is n opportunity to delegate the data entry to the employees. eHRM facilitates the usage of HR marketplaces and offers more self service to the employees. eHRM is a collection of many different technologies. At first the growing attention of companies on the factor knowledge is mainly driven by the evolution of information technology. Information systems like eHRM solutions -that network information enable companies to get a consistent concept for their knowledge management. In this sense Knowledge Management is always a collection of different techniques. A variety of these techniques is used in companies to acquire knowledge, to organize knowledge and to make knowledge transparent. One of these mentioned techniques is knowledge Discovery in Databases (KDD) respective Data Mining as a step of the KDD-process.
76 Indira Management Review - July 2012
Knowledge Management and EHRM
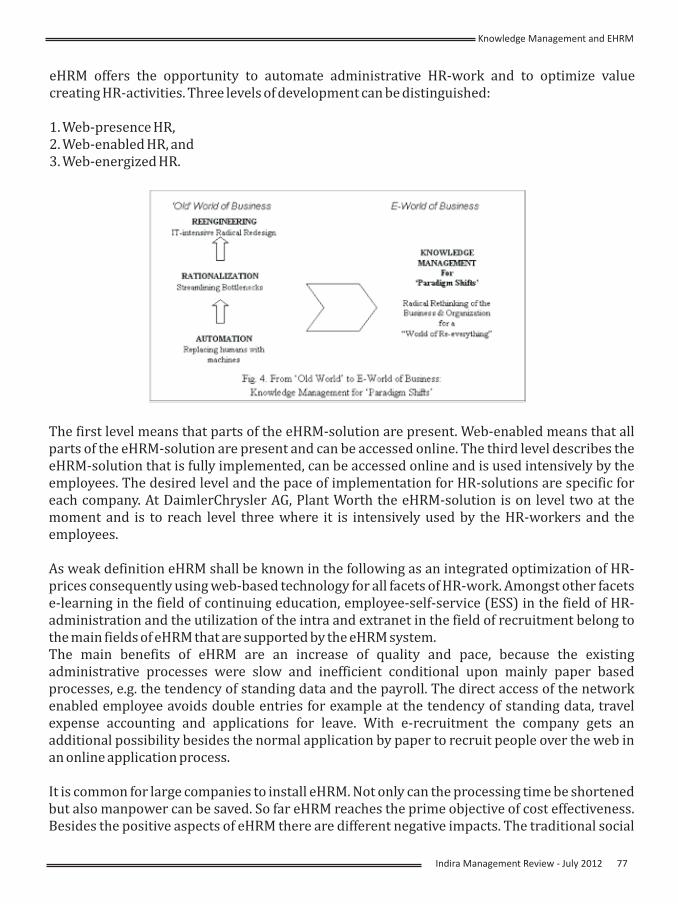
eHRM offers the opportunity to automate administrative HR-work and to optimize value creating HR-activities. Three levels of development can be distinguished:
1. Web-presence HR,2. Web-enabled HR, and3. Web-energized HR.
The first level means that parts of the eHRM-solution are present. Web-enabled means that all parts of the eHRM-solution are present and can be accessed online. The third level describes the eHRM-solution that is fully implemented, can be accessed online and is used intensively by the employees. The desired level and the pace of implementation for HR-solutions are specific for each company. At DaimlerChrysler AG, Plant Worth the eHRM-solution is on level two at the moment and is to reach level three where it is intensively used by the HR-workers and the employees.
As weak definition eHRM shall be known in the following as an integrated optimization of HR-prices consequently using web-based technology for all facets of HR-work. Amongst other facets e-learning in the field of continuing education, employee-self-service (ESS) in the field of HR-administration and the utilization of the intra and extranet in the field of recruitment belong to the main fields of eHRM that are supported by the eHRM system.The main benefits of eHRM are an increase of quality and pace, because the existing administrative processes were slow and inefficient conditional upon mainly paper based processes, e.g. the tendency of standing data and the payroll. The direct access of the network enabled employee avoids double entries for example at the tendency of standing data, travel expense accounting and applications for leave. With e-recruitment the company gets an additional possibility besides the normal application by paper to recruit people over the web in an online application process.
It is common for large companies to install eHRM. Not only can the processing time be shortened but also manpower can be saved. So far eHRM reaches the prime objective of cost effectiveness. Besides the positive aspects of eHRM there are different negative impacts. The traditional social
Indira Management Review - 77July 2012
Knowledge Management and EHRM
task of the HR department suffers under the increasing aril distance that eHRM causes with its virtual online processes. The partial loss of face to face communication is rated negative by the employees. Finally the HR worker is affected by the changes in the HR processes. The ongoing automation of formerly time consuming tasks leads to long term staff cuts in the HR department. Thus the HR worker is central component of the implementation of eHRM because he is the key factor to realize the newly installed processes. With a demotivated HR worker due to the anxiety to loose his own job an implementation of eHRM is futile. A main task must therefore be the reorientation of the HR workers to a new scope of duties, especially in the area of strategic Human Resource Management that is recruitment, personnel evolution and continuing education.
Conclusion:Knowledge management has emerged as a growing field of practice and research in response to the recognition that knowledge is a potent force in the economy, and for competitive advantage. The concept of knowledge itself, however, remains vague and unsatisfactory, a situation that may well hinder the development of knowledge management theory and practice. Knowledge itself cannot be managed, only the conditions of its use-in-action, which necessarily centers on people. Knowledge management practice, if it is to remain distinct from information management, which also focused on knowledge representations, must give pride of place to the management of people.
Knowledge Management (KM) is typically defined to be the holistic combination of measures for managing people, processes, and technology, the explicit integration of Human Resource Management into KM initiatives is seldom examined. In the course of prevailing trends like globalization, customer orientation and specialization, most of the companies place emphasis on recruitment, sustainment and evolution of qualified employees. Electronic Human Resource Management (eHRM) is a web based tool to automate and support HR process. The implementation of eHRM is an opportunity to delegate the data entry to the employees. eHRM facilitates the usage of HR marketplaces and offers more self service to the employees.
References:
1. Andrews, K.M. (2003). Get businesslike about knowledge management. HR Monthly, November: pp.12-16.
2. Andrews, K.M. and B.L. Delahaye. (2009). Influences on knowledge processes in organisational learning: The
psychosocial filter. Journal of Management Studies, 37(6): pp.797-810.
3. Bolisani E., Scarso E., (2009). "Information Technology management: a knowledge-based perspective"
Technovation, pp.209-217.
4. A. Macintosh, Artificial Intelligence Applications Institute (AIAI). In Proceedings of AI in Engineering. 1987,
42-44
5. DeNisi, A.S., M.A. Hitt and S.E. Jackson.(2008). Managing knowledge for sustained competitive advantage. San
Francisco: Jossey-Bass.
6. Frey, B.S. and Jegen, R. (2000) Motivation Crowding Theory: A Survey of Empirical Evidence (revised version).
Institute for Empirical Research in Economics , University of Zurich. ISSN 1424-0459.
7. Hislop D., (2007) "Mission Impossible? Communicating and sharing knowledge via information technology", Journal
of Information Technology, pp.165-177.
78 Indira Management Review - July 2012
Knowledge Management and EHRM
8. Johannessen J.A., Olaisen J., Olsen B., (2007), "Mismanagement of tacit knowledge: the importance of tacit
knowledge, the danger of information technology, and what to do about it", International Journal of Management, pp.
3-20.
9. Lockett, G. and K. Legge. (1993). Epilogue - an agenda for research. Journal of Management Studies, 30(6): pp.1017-
1020.
10. Lucier, C. (2003) When knowledge adds up to nothing. Development and Learning in Organizations: An
International Journal, Vol. 17, pp. 32-35.
9. Malhotra, Y. and Galletta, D.F. (2003). "Role of Commitment and Motivation in Knowledge Management Systems
Implementation: Theory, Conceptualization, and Measurement of Antecedents of Success". 36th Hawaii International
Conference on System Sciences. p. 10.
11. Milne, P. (2007), Motivation, incentives and organisational culture. Journal of Knowledge Management, Vol. 11, pp.
28-38.
12. Morello, D. and Caldwell, F. (2001). What Are Knowledge Workers? What Makes Them Tick? Stamford : Gartner,
Research. SPA-12-7780.
13. Osterloh, M. and Frey, B.S. (2000), "Motivation, Knowledge Transfer, and Organizational Form". Organization
Science. Septembre-octobre, Vol. 11, 5, pp. 538-550.
14. Pan S.L., Scarbrough H., (2009), "Knowledge Management in Practice: An Exploratory Case Study", Technology
Analysis & Strategic Management, Vol.11, No.3, pp.56-63.
15. Prusak, L. (2008). Where did knowledge management come from? IBM Systems Journal, 40(4): pp.1002-1007.
16. Roberts J., (2008), "From Know-how to Show-how? Questioning the Role of Information and Communication
Technologies in Knowledge Transfer", Technology Analysis & Strategic Management; Vol. 12, No. 4, pp..72-79.
17. Semar, W. (2004). "Incentive systems in knowledge management to support cooperative distributed forms of
creating and acquiring knowledge.", International Conference on Information and Knowledge Engineering. pp. 406-
411.
18. Sveiby, K.E. and R. Simons. (2009). Collaborative climate and the effectiveness of knowledge work. Journal of
Knowledge Management, 6 (5): pp.420-433.
19. C. West Churchman (1979), 'The Systems Approach, Delacorte Press, New York, p.328
20. Karl Erik Sveiby (1999), ''The New Organizational Wealth: Managing and Measuring Knowledge-Based Assets',
Berrett-Koehler, p.245
21. I. Nonaka (1994) - A Dynamic Theory of Organizational Knowledge Creation, Organization Science February 1994
vol. 5 no. 1 14-37
22. Harvard Business Review, Special issue on Knowledge Management Jul-Aug 1997
Indira Management Review - 79July 2012
Knowledge Management and EHRM
What is talent management? What must firms do to leverage on the modalities of talent management in a competitive economy? What are the best practices in this area? If formalized, can these talent management practices be applied across a range of firms? These then are some of the important questions that will come to a reader's mind as he works his way through this anthology of essays. This book can be used as both a source of insights for constructing a theory of talent management, and as a casebook with specific instances of what works in this area. There are six cases included here comprising organizations such as Bersin & Associates, Cisco, McDonald's, Avon Products, Children's Healthcare (Atlanta), and Ciena. These organizations are not in the same sector and the goal is not to argue that all these organizations have the same set of challenges by any means. Instead, we have a collection of approaches that have worked in specific contexts, and it is for the reader to decide the extent to which any of these case studies is applicable to the organization in which he finds himself. Larry Israelite, the editor of this anthology, argues that while we will uncover insights that have universal value, more often than not, we must be prepared to understand that 'things are local'. What is at stake in this area then 'comprise a combination of philosophies, tools, processes, and systems' that proved to be useful in the case studies included here. While readers are welcome to try these elements in their respective firms, it is important not to take a deterministic approach to these applications. They are
Talent Management: Strategies for Success from Six Leading Companies Larry Israelite (2010)(Delhi: Cengage Learning), pp. 260, ISBN 978-81-315-1612-6.
Book Review
more like the 'implications' of approaches to talent management rather than direct 'applications' to managing talent in organizations.
There are eleven chapters and an appendix in this book including an introduction and conclusion by the editor who is the VP of HRD at the Liberty Mutual Group. Larry Israelite points out that talent management is an emerging area in management. It is therefore necessary to improvise the processes appropriate to doing so. There are no fixed rules for managing talent, and it is not the intention of the editor or any of the contributors to lead the reader into thinking that can indeed be the case. Instead, readers should approach this problem with an open mind and think-through the different aspects of talent management whether it be ' p e r f o r m a n c e m a n a g e m e n t , c a r e e r development, management development', or even the role of an 'employee opinion survey'. Josh Bersin of Bersin Associates, for instance, argues that an integrated approach is what is needed now. He is interested in working out how a talent management approach that is aligned to the interests of a business can be worked out in a way that accommodates the roles played by the process of learning and development. He differentiates between performance-driven and talent-driven approaches to learning based on the time period that is at stake in manpower planning processes in a firm. The approach that he favors is related to identifying business
80 Indira Management Review - July 2012
problems first rather than approach talent directly. The deployment of a specific instance of talent then is proffered as a solution. The governance and ownership of talent management should be a function of the business as a whole rather than an area within HR - especially if HR is perceived to be preoccupied with questions of functional autonomy. In the absence of effective alignment with the strategic function of a business enterprise, it becomes much more difficult to measure the tangible gains, if any, of talent management.
The contributors to this book are pushing for a 'local knowledge' approach to talent management that favors the need for conceiving practical approaches rather than inquire into what talent is as an end in itself since most of them are caught up with these challenges in the organizations in which they find themselves. Annmarie of Cisco worries aloud about the shortage of talent in a globalizing economy; hence Cisco's preoccupation with the need to identify and develop the human and leadership elements of talent management. An approach that works wonderfully well is the emphasis on 'unlearning' as a prelude to new learning. Cisco also had to learn how to 'mature' its talent management processes in order to 'meet the demands of a transforming global enterprise'. This means coming to terms with needless complexity within the organization especially when the number of variables is continually increasing in the external environment. How can talent be successfully deployed in such circumstances? Neal argues that 'when times are good, have a simple plan; when times are complex, have a very simple plan'. Likewise Neal Kulick of McDonald's argues that talent management is strongly related to performance management since in
a sense 'all management is performance management'. But at the same time it is important to differentiate between 'potential' and 'performance' by working on related factors such as the rating system, aligning compensation to performance, and by ensuring that 'pay differentiation' is related to 'performance differentiation'. It was also important to come up with a talent management plan with clarity on the processes relevant to doing so along with periodic talent reviews. The implementation would proceed with the help of a talent management template that would be made available to all the major business units of the firm. The components listed in the template would ensure that all the main aspects would be covered while translating talent management imperatives into practice. While getting this template right would involve several iterations, it would ensure that talent management practices were aligned to the strategic goals of the firm. McDonald's sense of urgency in this matter was precipitated by the unexpected illness and death of two CEOs in quick succession.
Marc Effron of Avon Products explains in his turn how his firm managed to build 'a new talent management system' given that it was growing faster than the firm could support. It was therefore important to understand the situation in Avon in the context of corporate restructuring and its implications for the organizational hierarchy. Avon began by identifying its weaknesses in managing talent before proposing a new model that would work with a greater degree of transparency in matters pertaining to career development, development plans, and performance reviews. Here, again, the focus was on bringing a greater amount of simplicity to bear on the situation by repeatedly asking what the
Indira Management Review - 81July 2012
Book Review
Book Review
82 Indira Management Review - July 2012
business gains of talent deployment might be. Once the answers to these questions became clear, it became much easier to make a business case for managing talent especially in the context of performance management. In Effron's words, 'with limited funds to spend, we needed to make a decision about which talent bets would truly pay off'. Talent management practices basically provide a set of guidelines on how to make these bets pay-off consistently. This also means that the workforce should be differentiated more effectively and being egalitarian is not the most effective way going forward. And, finally, it is important to find a way of measuring the gains on organizational turnarounds that are propelled by talent management practices if the gains are to be sustainable. While there is not sufficient space to list all the insights available in the cases and reflections included in this book, the characteristic feature of the approaches included here is that they are not only specific forays in talent management, but haunted by the idea that there is no objective or even comprehensive approach that will be applicable across a range of contexts. What these cases however succeed in doing well is in giving talent mangers a chance to rehearse their options, practices, and techniques in opening up for discussion an exciting new area in the theory and practice of talent management. It is therefore important for such managers to differentiate between processes and outcomes, develop adequate measures, and work-out the forms of alignment that will make an effective business case possible while betting every now and then on specific instances of talent.
Shiva Kumar Srinivasan, Professor, Behavioral Sciences, Indian Institute of Planning and Management, Chennai,
email: [email protected]
R

R
Please take a few minutes to complete the form and mail it to The Editor, Indira Management Review, Indira Group of Institutes, 85/5A, Tathawade, Near Wakad Junction, Pune 411 033 or email to [email protected]. This will help in keeping us clued to needs of industry and academia.
Please tick the appropriate choice. If your choice is (iii) please mention details
LAYOUT : i. Good ii. Satisfactory iii. Can be improved
iii)____________________________________________________________________________
______________________________________________________________________________
CONTENT :i. Good ii. Satisfactory iii. Can be improved
iii)____________________________________________________________________________
______________________________________________________________________________
QUALITY OF ARTICLES :
i. Good ii. Satisfactory iii. Can be improved
iii. ____________________________________________________________________________
What are the subjects on which you would like IMR to feature articles. Please Specify.
______________________________________________________________________________
______________________________________________________________________________
We would welcome quality articles of value to industry and academia such as research / academic papers / case studies / posers / book reviews etc for IMR. For details see our notes to contributors on the inside back cover of the issue.
Would you like to write for IMR? Yes If so, your choice of subject - Also mention name/s of journals in which you have published your work :
______________________________________________________________________________
______________________________________________________________________________
Your name : ____________________________________ Institute _________________________
Address : ___________________________________________email id : ___________________
Designation ____________________________ Date : ________________________________
Signature _______________________________
Feedback Form
INDIRA MANAGEMENT REVIEW
Welcomes academic and research articles on subjects of contemporary relevance to the study of
Management .
Notes to Contributors
IMR is a vehicle for disseminating today's thinking on everything that moves business. As such, it welcomes
serious writing in the form of , critiques , posers, academic or research papers etc. that promote new thought
on accepted concepts or initiate new concepts. The subjects may be as varied as logistics and human
resources, IT sourcing and the multiplex boom , or the rural markets and RFID . However , a level of academic
and professional authority or understanding of the issue on the part of the writer, is a must, while considering
the work for publication . WE encourage papers with an Indian context, more so if they examine issues with
reference to India's place in the bigger international picture. Articles are put through the blind / peer review
process before being accepted.
Authors are requested to note the following while forwarding written material for publication:
1. The paper should be max. 15 pages length in MS word format in Arial font size 12 typed in 1.5 line
spacing . Graphs and tables should be in the body of the text and not separate.
2. The article should carry a brief abstract not exceeding 100 words profiling the nature of work to
follow.
3. Bibliography in the accepted European Format should accompany at the end of the article , as
shown below:
Abel-Smith B and Townsend P (1995) : The poor and the Poorest , London Bell.
Adorno , Theodor, (1964)(1986) L The Jargon of Authenticity , London , Routledge and Kegan Paul.
Ahmed Abad and Abraham E (1994) (eds) , Management Research in India 2 Vols, AIMS Publication
Argyris , Chris, (1991):”Teaching Smart People How to learn “' Harvard Business Review, May-June.
4. A declaration on the following lines should accompany the article , signed by the author/s
I/We confirm that the enclosed article (name of the article) __________________ is the original
work of the undersigned and that all referenced material mentioned therein are duly acknowledged
by us at the end thereof. I/We confirm responsibility for all the information used in the article
which is in the private ownership of other individuals / entities. The article has not been submitted
to any other publication / journal and is not under consideration for publication anywhere else.”
5. A brief biosketch of the author/s may also be forwarded (max. 100 words each)
6. One copy of the text should be couriered to the Editor, Indira Management Review , Shree Chanakya
Education Society , 85/5A Tathwade , Pune –Banglore Bypass , Near Wakad Junction , Pune-411033.
And the same be also emailed to [email protected]
7. Articles/ papers approved by the review panel will be taken up for publication , and the date of
publication will depend upon the editorial constraints of time and space. The Editor will not enter
into correspondence with the authors re: the date of publication . Authors are requested not to
remind us regarding the same. WE shall convey to the author the fate of their article when the
review process is completed and the decision received from the reviewer – be it acceptance ,
rejection or a recommendation for effecting modifications/ additions , deletions from the text , for
compliance by the author.
8. The mailing of article for publication to IMR signifies acceptance of the Editor's decision regarding
acceptance or otherwise of a contribution to be final and binding .
9. Authors of articles accepted for publication will be paid a token honorarium.

The Indira Group of Institutes has established itself as a highly credible educational Institution in the space of just 12 years. The Group is recognised as such for its commitment to deliver the best to enable its students to not just make the grade, but to beat all benchmarks. IGI's interest in education covers all levels – nursery to school to undergraduate and postgraduate. The Management Courses - both Pune University affiliated and autonomous, give the students everything that it takes to keep up with the competition not just today but for years into the future. That's because IGI believes in education that is truly holistic – from the classroom and from the school of life, which means more outdoor projects, visits, association and interaction with industry etc. that makes the Indira student stand apart.
IGI believes that untiring communication is the key to not only dissemination of knowledge, but to ensure greater understanding of the mechanics and dynamics that shape the world around us. In this belief IGI brings out a tri-annual journal, Tapasya, which has already become a byword in the academic world as also among the corporate and student community. With its mature content targeting specific industries, management function or growth areas, in the shape of interviews, articles, features, biosketches of successful corporate leaders etc. it has virtually become a reference point for various purposes among the business and student fraternity. Tapasya enjoys the contribution of some of the best known names in industry, government and trade bodies, which makes it a highly readable and authentic representation of the corporate world's thinking on contemporary Management issues. Do write to us at [email protected] to put your name on the mailing list of Tapasya.
R