Embed Size (px)
Citation preview

INDIRA GANDHI NATIONAL OPEN UNIVERSITY
INDIRA GANDHI NATIONAL OPEN UNIVERSITY
PRIVATE COMMERCIAL BANKS IN ETHIOPIA
INDIRA GANDHI NATIONAL OPEN UNIVERSITY
FACTORS IMPACTING PROFITABILITY OF PRIVATE COMMERCIAL BANKS IN ETHIOPIA
FULFILLMENT OF THE REQUAIRMENT FOR
INDIRA GANDHI NATIONAL OPEN UNIVERSITY
FACTORS IMPACTING PROFITABILITY OF PRIVATE COMMERCIAL BANKS IN ETHIOPIA
A THESIS PRESENTED IN THE PARTIAL FULFILLMENT OF THE REQUAIRMENT FOR
INDIRA GANDHI NATIONAL OPEN UNIVERSITY
FACTORS IMPACTING PROFITABILITY OF PRIVATE COMMERCIAL BANKS IN ETHIOPIA
A THESIS PRESENTED IN THE PARTIAL FULFILLMENT OF THE REQUAIRMENT FOR
INDIRA GANDHI NATIONAL OPEN UNIVERSITY
FACTORS IMPACTING PROFITABILITY OF PRIVATE COMMERCIAL BANKS IN ETHIOPIA
A THESIS PRESENTED IN THE PARTIAL FULFILLMENT OF THE REQUAIRMENT FOR
MASTER OF ARTS IN ECONOMICS
INDIRA GANDHI NATIONAL OPEN UNIVERSITY
FACTORS IMPACTING PROFITABILITY OF PRIVATE COMMERCIAL BANKS IN ETHIOPIA
A THESIS PRESENTED IN THE PARTIAL FULFILLMENT OF THE REQUAIRMENT FOR
MASTER OF ARTS IN ECONOMICS
INDIRA GANDHI NATIONAL OPEN UNIVERSITY
FACTORS IMPACTING PROFITABILITY OF PRIVATE COMMERCIAL BANKS IN ETHIOPIA
A THESIS PRESENTED IN THE PARTIAL FULFILLMENT OF THE REQUAIRMENT FOR
MASTER OF ARTS IN ECONOMICS
INDIRA GANDHI NATIONAL OPEN UNIVERSITY
FACTORS IMPACTING PROFITABILITY OF PRIVATE COMMERCIAL BANKS IN ETHIOPIA
A THESIS PRESENTED IN THE PARTIAL FULFILLMENT OF THE REQUAIRMENT FOR
MASTER OF ARTS IN ECONOMICS
INDIRA GANDHI NATIONAL OPEN UNIVERSITY
FACTORS IMPACTING PROFITABILITY OF PRIVATE COMMERCIAL BANKS IN ETHIOPIA
A THESIS PRESENTED IN THE PARTIAL FULFILLMENT OF THE REQUAIRMENT FOR
MASTER OF ARTS IN ECONOMICS
INDIRA GANDHI NATIONAL OPEN UNIVERSITY
FACTORS IMPACTING PROFITABILITY OF PRIVATE COMMERCIAL BANKS IN ETHIOPIA
A THESIS PRESENTED IN THE PARTIAL FULFILLMENT OF THE REQUAIRMENT FOR
MASTER OF ARTS IN ECONOMICS
INDIRA GANDHI NATIONAL OPEN UNIVERSITY
FACTORS IMPACTING PROFITABILITY OF PRIVATE COMMERCIAL BANKS IN ETHIOPIA
TULU DERESSA
A THESIS PRESENTED IN THE PARTIAL FULFILLMENT OF THE REQUAIRMENT FOR
MASTER OF ARTS IN ECONOMICS
INDIRA GANDHI NATIONAL OPEN UNIVERSITY
FACTORS IMPACTING PROFITABILITY OF PRIVATE COMMERCIAL BANKS IN ETHIOPIA
TULU DERESSA
A THESIS PRESENTED IN THE PARTIAL FULFILLMENT OF THE REQUAIRMENT FOR
MASTER OF ARTS IN ECONOMICS
INDIRA GANDHI NATIONAL OPEN UNIVERSITY
FACTORS IMPACTING PROFITABILITY OF PRIVATE COMMERCIAL BANKS IN ETHIOPIA
TULU DERESSA
A THESIS PRESENTED IN THE PARTIAL FULFILLMENT OF THE REQUAIRMENT FOR
MASTER OF ARTS IN ECONOMICS
INDIRA GANDHI NATIONAL OPEN UNIVERSITY
FACTORS IMPACTING PROFITABILITY OF PRIVATE COMMERCIAL BANKS IN ETHIOPIA
TULU DERESSA
A THESIS PRESENTED IN THE PARTIAL FULFILLMENT OF THE REQUAIRMENT FOR
MASTER OF ARTS IN ECONOMICS
INDIRA GANDHI NATIONAL OPEN UNIVERSITY
FACTORS IMPACTING PROFITABILITY OF PRIVATE COMMERCIAL BANKS IN ETHIOPIA
TULU DERESSA
A THESIS PRESENTED IN THE PARTIAL FULFILLMENT OF THE REQUAIRMENT FOR
MASTER OF ARTS IN ECONOMICS
INDIRA GANDHI NATIONAL OPEN UNIVERSITY
FACTORS IMPACTING PROFITABILITY OF PRIVATE COMMERCIAL BANKS IN ETHIOPIA
TULU DERESSA
A THESIS PRESENTED IN THE PARTIAL FULFILLMENT OF THE REQUAIRMENT FOR
MASTER OF ARTS IN ECONOMICS
INDIRA GANDHI NATIONAL OPEN UNIVERSITY
FACTORS IMPACTING PROFITABILITY OF PRIVATE COMMERCIAL BANKS IN ETHIOPIA
TULU DERESSA
A THESIS PRESENTED IN THE PARTIAL FULFILLMENT OF THE REQUAIRMENT FOR
MASTER OF ARTS IN ECONOMICS
INDIRA GANDHI NATIONAL OPEN UNIVERSITY
FACTORS IMPACTING PROFITABILITY OF PRIVATE COMMERCIAL BANKS IN ETHIOPIA
TULU DERESSA
A THESIS PRESENTED IN THE PARTIAL FULFILLMENT OF THE REQUAIRMENT FOR
MASTER OF ARTS IN ECONOMICS
INDIRA GANDHI NATIONAL OPEN UNIVERSITY
FACTORS IMPACTING PROFITABILITY OF PRIVATE COMMERCIAL BANKS IN ETHIOPIA
TULU DERESSA
A THESIS PRESENTED IN THE PARTIAL FULFILLMENT OF THE REQUAIRMENT FOR
MASTER OF ARTS IN ECONOMICS
INDIRA GANDHI NATIONAL OPEN UNIVERSITY
FACTORS IMPACTING PROFITABILITY OF PRIVATE COMMERCIAL BANKS IN ETHIOPIA
TULU DERESSA
A THESIS PRESENTED IN THE PARTIAL FULFILLMENT OF THE REQUAIRMENT FOR
MASTER OF ARTS IN ECONOMICS
INDIRA GANDHI NATIONAL OPEN UNIVERSITY
FACTORS IMPACTING PROFITABILITY OF PRIVATE COMMERCIAL BANKS IN ETHIOPIA
TULU DERESSA
A THESIS PRESENTED IN THE PARTIAL FULFILLMENT OF THE REQUAIRMENT FOR
MASTER OF ARTS IN ECONOMICS
INDIRA GANDHI NATIONAL OPEN UNIVERSITY
FACTORS IMPACTING PROFITABILITY OF PRIVATE COMMERCIAL BANKS IN ETHIOPIA
A THESIS PRESENTED IN THE PARTIAL FULFILLMENT OF THE REQUAIRMENT FOR
MASTER OF ARTS IN ECONOMICS
INDIRA GANDHI NATIONAL OPEN UNIVERSITY
FACTORS IMPACTING PROFITABILITY OF PRIVATE COMMERCIAL BANKS IN ETHIOPIA
A THESIS PRESENTED IN THE PARTIAL FULFILLMENT OF THE REQUAIRMENT FOR
MASTER OF ARTS IN ECONOMICS
Addis A
INDIRA GANDHI NATIONAL OPEN UNIVERSITY
FACTORS IMPACTING PROFITABILITY OF PRIVATE COMMERCIAL BANKS IN ETHIOPIA
A THESIS PRESENTED IN THE PARTIAL FULFILLMENT OF THE REQUAIRMENT FOR
MASTER OF ARTS IN ECONOMICS
Addis A
INDIRA GANDHI NATIONAL OPEN UNIVERSITY
FACTORS IMPACTING PROFITABILITY OF PRIVATE COMMERCIAL BANKS IN ETHIOPIA
A THESIS PRESENTED IN THE PARTIAL FULFILLMENT OF THE REQUAIRMENT FOR
MASTER OF ARTS IN ECONOMICS
Addis A
INDIRA GANDHI NATIONAL OPEN UNIVERSITY
FACTORS IMPACTING PROFITABILITY OF PRIVATE COMMERCIAL BANKS IN ETHIOPIA
A THESIS PRESENTED IN THE PARTIAL FULFILLMENT OF THE REQUAIRMENT FOR
MASTER OF ARTS IN ECONOMICS
Addis Ababa
INDIRA GANDHI NATIONAL OPEN UNIVERSITY
FACTORS IMPACTING PROFITABILITY OF PRIVATE COMMERCIAL BANKS IN ETHIOPIA
A THESIS PRESENTED IN THE PARTIAL FULFILLMENT OF THE REQUAIRMENT FOR
MASTER OF ARTS IN ECONOMICS
baba
INDIRA GANDHI NATIONAL OPEN UNIVERSITY
FACTORS IMPACTING PROFITABILITY OF PRIVATE COMMERCIAL BANKS IN ETHIOPIA
A THESIS PRESENTED IN THE PARTIAL FULFILLMENT OF THE REQUAIRMENT FOR
April 2016
baba,
INDIRA GANDHI NATIONAL OPEN UNIVERSITY
FACTORS IMPACTING PROFITABILITY OF PRIVATE COMMERCIAL BANKS IN ETHIOPIA
A THESIS PRESENTED IN THE PARTIAL FULFILLMENT OF THE REQUAIRMENT FOR
April 2016
, Ethiopia
INDIRA GANDHI NATIONAL OPEN UNIVERSITY
FACTORS IMPACTING PROFITABILITY OF PRIVATE COMMERCIAL BANKS IN ETHIOPIA
A THESIS PRESENTED IN THE PARTIAL FULFILLMENT OF THE REQUAIRMENT FOR
April 2016
Ethiopia
PRIVATE COMMERCIAL BANKS IN ETHIOPIA
FULFILLMENT OF THE REQUAIRMENT FOR
April 2016
Ethiopia
April 2016
Ethiopia

ii
Program Code: MEC
Course Code:
Enrolment No.
Study Center Code:
Regional Center: Addis Ababa
FACTORS IMPACTING PROFITABILITY OF PRIVATE COMMERCIAL BANKS IN ETHIOPIA
Project work submitted to Indra Gandhi National Open University in Partial
fulfillment of the requirement for the award of the degree-Master of arts in
Economics. I hereby declare that this work has been done by me and has not
been submitted elsewhere.
Signature of the candidate: …………………………..
Name of the Candidate: Tulu Deressa Bedada
Address: Addis Ababa
Year: April 2016
MECP-OO1
I D 1 3 1 9 3 5 4
8 1 0 5

iii
CERTIFICATE
Certified that the project work entitled “FACTORS IMPACTING
PROFITABILITY OF PRIVATE COMMERCIAL BANKS IN ETHIOPIA’’ submitted
by Tulu Deressa Bedada is his own work and has been done in the light of
evaluator’s comments under my supervision.
Signature:…………………………………….
Name:…………………………………………..
Adress:………………………………………….
Study Centre:………...........................
Regional Centre:……………………………
Date:……………………………………………..

iv
ABSTRACT
Factors Impacting Profitability of Private Commercial Banks in Ethiopia
Tulu Deressa
Indira Gandhi National Open University, 2016
Banking sector is the backbone of any economy and plays an important role
in the economic development of a country. Mobilization of the national
savings to the productive sectors is possible only with the help of commercial
banks that augments the economic growth rate of a country.
This study investigates the effect of bank specific and macroeconomic
factors on banks’ profitability on profitability of private commercial banks in
Ethiopia. The determinants of banks’ profitability used in this study were
bank size, capital adequacy, assets quality, expenses management and
liquidity management as bank specific factors and NBE Bill, GDP, Inflation
rate and real interest rate as macroeconomic factors. The econometric model
of fixed effects regression method was used in this study, using a panel
data of 6 banks in Ethiopia for period from 2006 to 2015.
Overall, results of this study show that, the profitability of the private
commercial banks under study is mostly affected by bank specific factors
(that are internal factors determined by bank’s management decisions and
policy objectives). Yet, macroeconomic factors with the exception of NBE Bill
do not seem to significantly affect profitability. These results have important
implications for banks’ survival and growth. It is expected that this study
will guide the policy makers and bank management in the formulation and
implementation of better policies and strategies which may results better
performance of banks in Ethiopia.

v
Acknowledgement
My sincere and deepest gratitude goes to my advisor Mr. Negatu Legesse for his candid
assistance in giving me relevant comments and guidance throughout the study.
I must express my very profound gratitude to my parents for providing me with
unreserved support and continuous encouragement throughout my years of study.
This accomplishment would not have been possible without them. They are the best
parents anyone can have and I owe my success to them.

vi
Contents LIST OF TABLES AND FIGURES .............................................................................. viii
LIST OF ACRONYMS .................................................................................................. ix
Chapter 1 ................................................................................................................... 1
1. Introduction ........................................................................................................... 1
1.1 Background of the Study ................................................................................... 1
1.2 Statement of the problem .................................................................................. 5
1.3 Objectives of the study ...................................................................................... 7
1.3.1 General Objective ........................................................................................... 7
1.3.2 Specific objectives .......................................................................................... 7
1.4 Research Methodology ....................................................................................... 7
1.4.1 Data Type and Sources .................................................................................. 7
1.4.2 Method of Data Analysis ................................................................................. 8
1.4.3 Description of Variables ................................................................................. 9
1.5 Scope of the study ........................................................................................... 13
1.6 Significance of the study ................................................................................. 13
1.7 Organization of the study ................................................................................ 13
Chapter 2 ................................................................................................................. 14
2. Literature Review ................................................................................................. 14
2.1 Theoretical Literature Review .......................................................................... 14
2.1.1 Structural Approach to Measure Bank’s Profitability ................................. 14
2.1.2 Internal determinants of Profitability ......................................................... 18
2.1.3 External determinants of Profitability ........................................................ 22
2.2 Empirical Literature Review ............................................................................ 24
2.2.1 Empirical studies in Ethiopia .................................................................... 31
2.3 Overview of banking in Ethiopia ...................................................................... 35
2.3.1 Historical Overview ................................................................................... 35
2.3.2 The Current Development ......................................................................... 39
2.3.3 Role of National Bank of Ethiopia .............................................................. 40
2.4 Conclusions and Knowledge Gap ..................................................................... 42
Chapter Three .......................................................................................................... 44
3. Methodology ......................................................................................................... 44
3.1 Data Type ....................................................................................................... 44

vii
3.2 Sample Design ................................................................................................ 45
3.3 Method of Data Collection and Analysis ........................................................... 45
3.4 Description of Variables .................................................................................. 46
3.4.1 Dependent Variable ................................................................................... 46
3.4.2 Independent Variables .............................................................................. 46
3.5 Model Specification ......................................................................................... 51
Chapter 4 ................................................................................................................. 54
4. Empirical Results and Discussions ....................................................................... 54
4.1 Choice of Model ............................................................................................... 55
4.2 Classical Linear Regression Model Assumptions and ....................................... 56
Diagnostic Test ..................................................................................................... 56
4.2.1 Test for Heteroskedasticity ........................................................................ 56
4.2.2 Test for Autocorrelation ............................................................................. 57
4.2.3 Test for multicollinearity ........................................................................... 59
4.2.4 Normality Test ........................................................................................... 60
4.3 Descriptive Statistics ....................................................................................... 62
Observations ......................................................................................................... 65
4.4 Empirical Results from Panel Data Analysis .................................................... 65
4.5 Analysis and Discussions ................................................................................ 68
Chapter 5 ................................................................................................................. 73
5. Conclusion and Recommendation ........................................................................ 73
5.1 Conclusions .................................................................................................... 74
5.2 Recommendations ........................................................................................... 77
References................................................................................................................ 81
Appendices .............................................................................................................. 87

viii
LIST OF TABLES AND FIGURES
Table 1 : Summary Of The Independent Variables And Their Expected Relationship With The
Dependent Variable ........................................................................................................ 50
Table 2 : Test For Heteroskedasticity ..................................................................................... 57
Table 3 : Results Of Correlations Between Independent Variables .......................................... 60
Table 4 : Results Of Descriptive Statistics For Variables ......................................................... 65
Table 5 : Determinants Of Return On Assets (Roa) ................................................................. 67
Figure 1 : Normality Test For Residual ................................................................................... 61

ix
LIST OF ACRONYMS
ACRONYMS FULL NAME
LogA Logarithm of Total Assets
CA Capital Adequacy
NPL Non-Performing Loans
EM Expense Management
LD Loan to Deposit Ratio
GDP Gross Domestic Product
INF Inflation
RI Real Interest Rate
NBB National Bank of Ethiopia Bill
NIM Net Interest Margin
ROA Return on Assets
ROE Return on Equity
NBE National Bank of Ethiopia
CPI Consumer Price Index
OLS Ordinary Least Square
REM Fixed Effect Model
FEM Random Effect Model
DW Durbin-Watson
CLRM Classical Linear Regression Model
BJ Bera-Jarque

1
Chapter 1
1. Introduction
1.1 Background of the Study
The fact that there are no capital and bond markets in Ethiopia put forth
the importance of the banking sector as the only substantial source to
mobilize saving thereby providing the much needed financial assistance to
the real sector of the economy. Banks in developing countries like Ethiopia
are basically engaged in the business of accepting deposits from depositors
and channeling the resources to those who needs them. They are also
engaged in areas like money transfer and international banking operations
i.e. import and export businesses.
Banks plays an immense role in augmenting development process of a
country. They are driving force for the real sectors of the economy and an
engine for economic growth (Shoaib et el., 2015).
In Ethiopia, the liberalization of the banking industry in 1990s has
created conducive environment for the emergence of private commercial
banks. At present, there are three government owned banks and sixteen
privately owned banks in the country. The banking sector of the country
is not well developed even with the standard of Sub Saharan countries.
Card Banking Service does have a history of less than a decade. Most of
the banks do not provide online banking services till 2012. However,

2
currently there is stiff competition among these banks and they are trying
to persuade customers by providing technology based products, by
expanding their branch network to serve customers at door step, by
providing banking product that targets specific section of the population
(like interest free banking), etc. This Competition is a continuous driver
for the participants in the industry to strive for best practices and up to
date technology to improve their efficiency and to gain customer
satisfaction. All these factors are being translated in to increased business
and higher profitability.
Data obtained from National Bank of Ethiopia shows that, numbers of
banks operating in the country has increased from 11 in FY 2006 to 19 as
at the end of FY 2015. Total capital of banking system has also increased
massively from Birr 3.5 million in 2005 to Birr 31.5 billion in 2015.
Number of bank branches in the country increased substantially from 389
branches as at end of FY 2005 to 2,693 as at the end of FY 2015. As a
result, total population per bank branch ratios has declined from
175,778.4:1 in FY 2005 to 33,448.2:1 in FY 2015 (National Bank of
Ethiopia, Annual Report June 2015). This shows the continuous growth
and future prospect of the banking industry in Ethiopia as considerable
section of the population is not using the banking services.

3
In a developing country like Ethiopia a well-functioning broad based and
stable financial system is a pre-requisite to support the much needed
economic development and growth. Owing to its vital role in the economy it
is important to regularly measure banking sector’s performance.
In order to measure the performance of banking sector its profitability is
used, as it is the single most important indicator of the financial health
and sustainability in long run. A profitable banking sector is more likely to
withstand a financial and economic distress like recent global financial
crises of 2008 (Ani et al., 2012).
There are a number of studies undertaken on the factors affecting the
profitability of the banks especially in developed countries. These
literatures categorize the factors affecting the profitability of banks as
internal and external.
Jiang et al. (2003) analyzed the profitability of banking industry in Hong
Kong between 1990 and 2002, empirical results showing that both bank-
specific as well as macroeconomic factors are important determinants in
the profitability of banks. With regard to macroeconomic factors, real GDP
growth, inflation and real interest rates have a positive impact. On the
other hand, the size variable, represented by loans or deposits, has a
negative relationship with profitability, suggesting that, on average, larger
banks achieve a lower ROA than smaller ones.

4
Mishkin Frederic et al. (2009) suggested that a basic measure of bank
profitability is the Return on Asset (ROA) which corrects for the size of the
bank. It is true that ROA provides useful and necessary information on
bank profitability but this is not on the major interest of the bank’s owners
(equity holders). They are more concerned about how much the bank is
earning on their equity investment, an amount that is measured by the
return on equity (ROE), the net income per currency of equity capital.
Wall (1985) concludes that a bank’s asset and liability management, its
funding management and the non-interest cost controls all have a
significant effect on the profitability record. There is an abundant number
of studies concluding that one of the primary factors influencing the bank
profitability is the control on the expenses. The profitability can be
improved through the expense management making this an opportunity
for the banks to control it.
To the knowledge of the researcher, although an extensive literature on the
determinants of banks’ profitability exits for developed economies and
other part of the world only scanty empirical research can be found in
Ethiopia. Besides, to the knowledge of the researcher the impact of NBE
bill which has been imposed on private banks since April 2011 has not
been looked at in depth by any researcher. Therefore, the present study
fills an important gap in the existing literature and improves the
understanding of bank profitability in Ethiopia.

5
1.2 Statement of the problem
Banking sector is the backbone of any economy and plays an important
role in the economic development of a country. Mobilization of the
national savings to the productive sectors is possible only with the help of
commercial banks that augments the economic growth rate of a country.
Profitable commercial banks also stabilize the financial system of a
country. The efficient and profitable banking industry is better able to
withstand negative shocks and contribute to the stability of the financial
sector of a country (Ani et al., 2012).
Despite reforms in the financial sector with a view of improving access to
financial services financial depth in Ethiopia has remained very low. The
banking sector in Ethiopia is still at an infant stage and there is
considerable potential yet to be tapped through expanding the banking
sector to widen the scope of financial inclusions.
Being the only sources to mobilize saving thereby providing the much
needed financial assistance to the real sector of the economy, the
importance of healthy banking to the economic development is immense.
This development and economic growth caused by the financial assistance
from the banking sector plays substantial role in facilitating development
endeavor of the country.
Owing to its vital role in the economy it is important to regularly measure
the bank sector’s performance. In order to measure the performance of

6
banking sector its profitability is measured, as it is the single most
important indicator of the financial health and sustainability in long run.
Ethiopian Private Banks faces a number of challenges in executing their
operation. They face challenges with regards to deposit mobilization as the
Commercial banks of Ethiopia (CBE), the single largest bank alone
mobilized 66.1 percent of the total deposits of the banking system of the
country as at June 30, 2015. CBE is also taking a number of steps that
private banks couldn’t withstand. Low deposits mean less income is
generated from loans and advances in the form of interest and this would
challenge the long term sustainability of banks as their major source of
income come from interest income.
Restrictive directives of NBE such as reserve requirements, export to
China which handed the sole responsibility to Commercial Bank of
Ethiopia to conduct every export formality for products that are exported
to China, etc are inhibiting the profitability of private banks significantly.
Moreover, NBE has introduced a directive which requires all private
commercial banks in the country to purchase NBE Bill amounting to 27%
of total loan disbursed starting from 4th April 2011 (Directive number:
MFA/NBE Bills/001/2011). The bill has a maturity period of 5 years. The
interest rate on the bills is 3 percent while the rate of interest that banks
charge when they accept deposits is 5 percent. This literally meant that
banks offered loan for the NBE at a loss of 2 percent. This does have a

7
significant negative impact on the profitability of private banks. Thus,
study aims at looking at the impact of this NBE Bill and other factors on
the profitability of banking sector in the Ethiopia.
1.3 Objectives of the study
1.3.1 General Objective
The main objective of the study is to assess the factors that impact the
profitability of selected private bank in Ethiopia over the period 2006 to
2015.
1.3.2 Specific objectives
The specific objective of this study is to fill an important gap in the existing
literature and improve the understanding of bank profitability in Ethiopia
and to draws policy implications for industry improvement in the country.
1.4 Research Methodology
1.4.1 Data Type and Sources
In order to analyze the determinants of banks’ profitability, the study uses
nine variables, one of them is the dependent and the others are
independent variables. The independent variables are comprised of bank-
specific and macroeconomic determinants of bank profitability. The
Dependent Variable is Return on Assets (ROA) whereas the independent
variables are Bank size as measured by logarithm of total assets, Capital
adequacy as determined by the ratio of equity to total assets, Asset Quality

8
as measured by non-performing loan to total loan ratio (NPL), Expenses
Management as determined by the ratio of non-interest expenses to
average assets, Liquidity as measured by the ratio of loans to deposits,
Annual real gross domestic product growth rate (GDP), annual inflation
rate (INF), real interest rate (RI), NBE Bill as measured by the ratio of NBE
Bill to total loan.
The data for this study comprised of the panel secondary data (i.e.
comprising cross-sectional and time-series data) which obtained from
audited financial reports of 6 banks in existence as at the end of 2015 and
that are in operation for at least 15 years. The cross sectional element is
reflected by the six banks under consideration and the time series element
is reflected in the period of study (2006 – 2015). The main advantage of
using panel data is that it allows overcoming of the unobservable,
constant, and heterogeneous characteristics of each bank included in the
sample (Saona, 2011).
1.4.2 Method of Data Analysis
This study employed both descriptive and econometric analysis. The
descriptive approach was used to analyze the sample and the observations
that have been used in this study. The econometric method is used in this
study to evaluate the main determinants affecting profitability of banking
sector in Ethiopia.

9
Structured document survey is used to collect the necessary data from
audited financial statements of each commercial bank in the sample for
bank specific factors and annual reports of National Bank of Ethiopia and
Ministry of Finance and Economic Development for macro factors.
1.4.3 Description of Variables
ROA: it is a general measure for bank profitability reflects bank ability to
achieve
return on its sources of fund to generate profits. In the literature ROA is
regarded as the best and widely used indicator of earnings and
profitability, because ROA assesses how efficiently a bank is managing its
revenues and expenses, and also reflects the ability of the management of
the bank to generate profits by using the available financial and real
assets’ (Obamuyi, 2013).
Bank size: In most finance literature, total assets of the banks are used as
a proxy for bank size. Bank size is represented by natural logarithm of
total asset (log A). The effect of bank size on profitability is generally
expected to be positive (Smirlock, 1985). Bank size accounts for the
existence of economies or diseconomies of scale (Naceur & Goaied, 2008).
The banking theory asserts that a firm enjoys economies of scale up to a
certain level, beyond which diseconomies of scale set in. This implies that
profitability increases with increase in size, and decreases as soon as there
are diseconomies of scale. Thus, literature has shown that the relationship

10
between the bank size and profitability can be positive or negative
(Staikouras and Wood, 2004; Athanasoglou et al., 2005; Flamini et al.,
2009; Dietrich and Wanzenrid, 2009).
Capital adequacy: The ratio of equity to total assets (CA) is considered one
of the basic ratios for capital strength. It is expected that the higher this
ratio, the lower the need for external funding and the higher the
profitability of the bank. It shows the ability of bank to absorb losses and
handle risk exposure with shareholder. Equity to total assets ratio is
expected to have positive relation with profitability that well-capitalized
banks face lower costs of going bankrupt which reduces their costs of
funding and risks (Berger, 1995; Bourke, 1989)
Asset Quality: The quality of assets held by a bank depends on exposure
to specific risks, trends in nonperforming loans, and the health and
profitability of bank borrowers. Poor asset quality and low levels of
liquidity are the two major causes of bank failures. Poor asset quality led
to many bank failures (Olweny and Shipo, 2011). The theory proposes that
firm profitability will decrease if the firm is highly exposed by credit risk,
hence we expect the inverse relationship between bank profitability and
non-performing loan to total loan ratio (NPL) which is used to measure
asset quality. For the purpose of this study, non-performing loan to total
loan ratio (NPL) used to measure asset quality.

11
Expenses Management: The ratio of non-interest expenses to average
assets is the ratio that more frequently used on studies of bank
profitability in measuring the management quality (Kosmidou et al, 2006).
It is expected a negative relationship between management quality
(expenses management) and profitability, since improved management
quality will increase efficiency and hence rise profits (Athanasoglou et al.,
2005).
Liquidity: The ratio of loans to deposits is used in this study as a measure
of liquidity. The higher this percentage the more liquid the bank is.
Insufficient liquidity is one of the major reasons of bank failures. However,
holding liquid assets has an opportunity cost of higher returns. Bourke
(1989) finds a positive significant link between bank liquidity and
profitability. However, in times of instability banks may choose to increase
their cash holding to mitigate risk. Unlike Bourke (1989), Molyneux and
Thorton (1992) come to a conclusion that there is a negative correlation
between liquidity and profitability levels.
GDP: It is a measure of the total economic activity and it is adjusted for
inflation. It is expected to have an effect on many determinants related to
the demand and supply for banks deposits and loans. In the literature
GDP growth is expected to have a positive effect on bank profitability
(Demirguc-Kunt and Huizinga, 1999.

12
Annual Inflation Rate: This measures the overall percentage increase in
Consumer Price Index (CPI) for all goods and services. Inflation affects the
real value of costs and revenues. Inflation and profitability may have
positive or negative relation depending on whether it is anticipated or
unanticipated (Perry, 1992). In the literature most of studies observe a
positive impact between inflation and profitability (Bourke, 1989;
Molyneux and Thorton 1992; Kosmidou, 2006).
Real Interest Rate: According to previous studies, the evidence has
shown that, there is a positive relationship between interest rates and
banks performance, bank profits increase with rising interest rates
(Samuelson 1945).
National Bank of Ethiopia Bill (NBE Bill): empirical research conducted
on the effect of NBE Bill on profitability of private banks in Ethiopia
appears to show a positive relationship. NBE bill seems contributed
positively to performance via moping the excess liquidity holding of banks
or providing an opportunity for private banks to invest their excess funds
in government securities than the customary practice of holding their
liquid asset in zero earning accounts at the National Bank of Ethiopia. In
addition, it instigated banks to work on fee generating sources (Tesfay B.
Lelisa 2014).

13
1.5 Scope of the study
This study is limited to looking at the factors impacting the profitability of
selected private commercial banks in the country over the period 2006 to
2015. It will look at the impact of Bank size Capital adequacy, Asset
Quality, Expenses Management, Liquidity, GDP, inflation, and NBE Bill on
profitability for six sample banks for the stated period.
1.6 Significance of the study
The study intends to make contributions on the factors impacting the
profitability of private commercial banks in Ethiopia. This will have a
paramount significance as the efficient and profitable banking industry is
better to withstand negative shocks and contribute to the stability of the
financial sector of a country. Therefore, the major beneficiaries from this
study are commercial banks in general and private banks in particular,
regulatory bodies, academicians and the country as a whole.
1.7 Organization of the study
This research report is organized in five chapters. Chapter one provides
the general introduction about the whole report. Chapter two describes the
review of related literatures. Chapter three provide detail description of the
methodology employed by the researcher. Chapter four contains data
presentation, analysis and interpretation. Finally, the last chapter
concludes the total work of the research and gives relevant
recommendations based on the findings.

14
Chapter 2
2. Literature Review
In the literature, determinants of bank profitability can be split between
those that are internal and those that are external. Internal determinants
or bank specific factors can be defined as those factors that are influenced
by the bank’s management decisions and policy objectives. Management
impacts are the results of differences in bank management objectives,
strategies policies, decisions, and actions reflected in differences in bank
operating results. The external factors are determinants that are not
related to bank management but reflect the macroeconomic, political and
legal factors that affect the operation and performance of banks. Various
determinants have been proposed for both internal and external factors
according to the nature and objective of each research. In the following
sections the researcher is trying to review both theoretical and empirical
literatures on the factors affecting profitability of commercial banks.
2.1 Theoretical Literature Review
2.1.1 Structural Approach to Measure Bank’s Profitability
Structural theories on issues of profitability of banks are considered to be
divided into three major categories. These are Market Structure Theories,
theories related to conduct & performance and those related to efficiency
structure.

15
2.1.1.1 Market Structure Theories and Bank Profitability
The traditional theory of the firm was assumed that a firm’s objective is
simply to maximize profits. In practice this theory is not applicable
because of most modern industries, involvement in providing a variety of
products/services, and faced with much more complex decisions to be
taken in a dynamic and uncertain environment Devinaga (2010).
Market structure theory suggested two alternative policy drives in order to
increase profit of the bank industry and for rationalizing market structure
in banking industry. The first one lies in limiting the number of banking
units in the market through encouraging mergers among existing banks.
This is help to increase the bank size for pursuing scale of economics.
The second strategy is the sharing common facilities such as ATM with
other banks in the industry. Both strategies may be useful in enhancing
the competition in the market and improving the overall profitability and
efficiency of the market (Devinaga (2010).).
2.1.1.2 Structure Conduct Performance (SCP) Hypothesis
Market structure conduct and performance (SCP) framework derived from
the neo-classical analysis of markets. The SCP was the central opinion of
the Harvard school of thought and popularized during 1940-60 with its
empirical work involving the identification of correlations between industry
structure and profitability. Most early research explanation for the

16
relationship between the market concentration and profitability based on
the structure-conduct performance (SCP) hypothesis, and focused on the
interpretation of a positive empirical relationship between concentration
and profitability (Goddard et al. 2004).
The SCP paradigm asserts that there is a relationship between the degree
of market concentration and the degree of competition among firms. This
hypothesis assumes that firms behave or rivalry in the market determined
by market structure conditions, especially the number and size
distribution of firms in the industry and the conditions of entry. This
rivalry leads to unique levels of prices, profits and other aspects of market
performance (Berger et al. 1989).
The Structure-Conduct-Performance (SCP) hypothesis, which also
sometimes referred to as the Market Power (MP) hypothesis, asserts that
increased market power yields monopoly profits. The assumptions of SCP
hypotheses have been applied in different research by various researcher
and supported positive relationship between market concentration
(measured by concentration ratio) and performance (measured by profits)
exists. Firms in more concentrated industries can earn higher profit than
firms operating in less concentrated industries earn, irrespective of their
efficiency (Goldberg et al.1996).
SCP, in general, provides two main benefits to studies, which investigate
the banks profit behavior. First, it shows the way to the banks’ profits are

17
operating. Thus, it explains different forces that restrict or expand the
scope of banks’ operations in the market. Especially with profitability
studies, SCP helps to interpret different sources of productivity and
efficiency gains or losses. Second, SCP provides a rational basis for
analyzing the market behavior (Goldberg et al.1996).
2.1.1.3 The Efficient Structure Hypothesis (ESH)
The other formulation of theoretical framework for studying determinants
of commercial banks profitability is the efficient structure hypothesis.
According to the ‘efficiency’ hypothesis, a positive concentration–
profitability relationship may reflect a positive relationship between size
and efficiency. It states that efficient banks in the market lead to increase
in the firms’ size and market share due to the aggressive behavior. This
behavior of the efficient banks allowed such firms to concentrate and earn
higher profits with further enhancing their market share. Those firms can
maximize profits either by maintaining the present level of product price or
service charge and firms’ size or by reducing the service charge and
expanding the firm size (Smirlock 1985).
The ESH stated that the positive relationship between profit and
concentration results from the lower cost achieved through superior
management and efficient production process.
In contrast to SCP hypothesis, the ESH is uncertain whether the high
profits of large banks are a consequence of concentrated market

18
structures and collusion. As explained by Berger and Hannan (1989), ESH
and SPC stand on similar observation on the relationship between
concentration and performance (profitability). However, the difference in
two theories consisted mainly in ways of interpretation of the relationship.
2.1.2 Internal determinants of Profitability
Internal determinants or bank specific factors can be defined as those
factors that are influenced by the bank’s management decisions and policy
objectives. Management impacts are the results of differences in bank
management objectives, strategies policies, decisions, and actions reflected
in differences in bank operating results.
Zimmerman (1996) has mentioned that management decisions,
particularly regarding loan portfolio concentration, were an important
factor contributing in bank performance. Researchers frequently attribute
good bank performance to quality management. Management quality is
assessed in terms of senior officers’ awareness and control of the bank’s
policies and performance.
Wall (1985) concludes that a bank’s asset and liability management, its
funding management and the non-interest cost controls all have a
significant effect on the profitability record. There are abundant numbers
of studies concluding that one of the primary factors influencing the bank
profitability is the control on the expenses. The profitability can be

19
improved through the expense management making this an opportunity
for the banks to control it.
The level of staff expenses appears to have a negative impact on banks
ROA in the study of Bourke (1989) even though Goddard et al. (2004)
found a positive relationship between total profits and staff expenses.
There exists direct causation in both way between capital and profitability
(Berger, 1995). Growing at international level banking demand high level
of capital to make sure that banks are more capable to take extra risk
(Hanweck & Kilcollin, 1984).There is a straight connection between the
capital and the earnings of the local banks, as well-organized banks are
more profitable because they earn more return on their investment
(Demirgüç-Kunt & Huizinga, 1999).
Size of the bank is also the result of administration policy that cannot
grantee the excess profit. (Vernon, 1971) among the first few researchers
who found the direct relationship between the banks size and profitability
and according to him larger banks have high profitability.
Bank size has direct impact on profitability by reducing the cost of raising
the capital for large banks was conducted in a study by (Short, 1979).
Bank size is introduced to report for present economies and diseconomies
of scale in the marketplace a study conducted by (Akhavein, Berger, &
Humphrey, 1997).

20
Deposit is the most valuable and significant indicator of the balance sheet
as it symbolizes a clue of conventionality banking activities. The deposit
structure of banks indicates that banks which are strongly committed to
short term and long term deposits are earning lower as compare to banks
that depends on demands deposits described by (Heggestad, 1977).
Smirlock (1985) explored that short term deposits are more inexpensive
source of financing and had significant impact of banks profitability.
The banks which have high deposits comparative to their assets and using
those to strength the equity to enhance the performance of the bank ,
those are the better developing banks as illustrated by(Naceur & Goaied,
2001).
Lending decision of a bank is very important because it determine the
future profitability and performance of the bank. Recently banks are
becoming more and more conscious in customer selection to avoid the
negative impact of bad loan or non-performing loan. The issue of
nonperforming loans (NPLs) has gained increasing attentions in the last
few decades. Amounts of bad loans are alarmingly increasing in not only
the developing and under developed countries but also in developed
countries. Banks’ lending policy could have crucial influence on non-
performing loans. A default is not entirely an irrational decision. Rather a
defaulter takes into account probabilistic assessment of various costs and
benefits of his decision. Lazy banking’ critically reflects on banks’
21
investment portfolio and lending policy (Reddy & Mohan (2003); Sinkey
(1991) & Dash (2010)
The immediate consequence of large amount of NPLs in the banking
system is bank failure as well as economic slowdown. The causes of
nonperforming loans are usually attributed to the lack of effective
monitoring and supervision on the part of banks, lack of effective lenders’
recourse, weaknesses of legal infrastructure, and lack of effective debt
recovery strategies (Adhikary,2006).
There is no global standard to define non-performing loans at the practical
level. Variations exist in terms of the classification system, the scope, and
contents. Such problem potentially adds to disorder and uncertainty in the
NPL issues. Non-performing loans have non-linear negative effect on
banks’ lending behavior (Hou, 2001)
At large, the main effect of bad loans on banks is the fact that increasing
bad loans limit the financial growth of banks (Karim, Chan & Hassan,
2010; Kuo et al., 2010). This consequence is as a result of the fact that
bad loans deprive banks of the needed liquidity and limit their capability
to fund other potentially viable businesses and make credit facilities
available to individuals. Karim et al. (2010) argues that there are a lot of
other viable businesses that the bank cannot explore as a result of the fact
that its funds are caught up in bad loans. In the face of these
consequences, the bank experiences a shortfall in generated revenues

22
(Ghana Banking Survey, 2013), and this translates into reduced financial
performance (Karim et al., 2010; Nawaz et al. 2012; Ghana Banking
Survey, 2013). Another basic effect of bad loans on the bank is a reduction
in the bank’s lending potential (Karim et al., 2010).
2.1.3 External determinants of Profitability
External factors identify the outcome of the macroeconomic environment
on banks profitability and these are the factors which are not under the
control of bank supervision and they signify the measures outside the
impact of the bank. However the management can take steps to explore
the expected variation in external environment and adjust the organization
to get the expected advantages of economic advancement.
Bank performance is expected to be sensitive to macroeconomic control
variables. The impact of macroeconomic variables on bank risk has
recently been highlighted in the literature. GDP growth as can be used as
a control for cyclical output effects, which we expect to have a positive
influence on bank profitability. As GDP growth slows down, and, in
particular, during recessions, credit quality deteriorates, and defaults
increase, thus reducing bank returns (Valentina et al 2009).
Demirguc-Kunt and Huizinga (1999) show that rapid economic growth
increase profitability for a large number of countries. Technically speaking,
GDP captures upswings and downswings manifesting in the business

23
cycles. Consequently, movements in general activity level are expected to
generate direct impacts on profitability of banks.
The effects of inflation can be substantial and undermines the stability of
the financial system and the ability of the regulator to control the solvency
of financial intermediaries. (Revell, 1979) noted that variations in bank
profitability can be strongly explained by the level of inflation. The impact
of inflation on bank income or profit depends on whether banks running
cost growing higher than inflation rate. This is why the effect of inflation is
reliant on the general macroeconomic solidity that permits the accurate
forecasting of inflation.
Inflation is normally linked with high profitability and efficiency as it
suggests extra income from float that inclines to pay for high labor costs
incorporated by (Hanson, 1986.)(Bourke, 1989); Molyneux and Thornton
(1992) discover a positive link between inflation and bank profitability.
Inflation is a significant factor that impact profitability of bank positively
as high inflation is strongly related with the high interest rate on credit
and high return on investment as effect of inflation depends whether the
inflation is predicted or unpredicted as investigated by (Perry, 1992). If we
find inflation as a predictable factor and interest rate is accordingly set,
then there is a direct association between the bank profitability and
inflation. It is explored by Hoggarth et al. (1998) that an unexpected
variation in inflation can create problems in the planning of loans and also

24
effect profitability. Increase in inflation has a positive association with
performance of bank in a study conducted by (Guru et al., 2002).
Inflation is highly associated with bank profitability; inflation involves high
cost as more business operation and large branch network rise cost but
also more revenue from bank float, this constructive link shows that bank
earnings rise with inflation more than bank cost. Inflation also impacts
company evaluating behavior as it projected that the trend of rates will
increase in future then the corporations will also increase their rates that
lead to an additional increment in the profit of bank as discussed by
Driver (2008).
Interest rate is constructive with profitability in countries where capital
market and banking sectors of well advanced and profit earned by banks
in their normal activates highly related with the GDP growth rate and
interest rate on lending. High interest rate on lending creates problems for
borrowers and their credit risk possibility explored by (Kindleberger). It is
accepted that increase in interest rate leads to high commercial banks
profit by increasing the gap between the deposits and borrowing rates.
2.2 Empirical Literature Review
Abreu and Mendes (2001) discovered inverse relationship between the
inflation factors and profitability of Europe banks. The banks in less
advance world are earning low in inflationary atmosphere, at the time high

25
capital ratio as in these countries bank expenses are more than bank
earning was explored by (Demirgüç-Kunt & Huizinga, 1999).
It is discovered that more saving and more borrowing both have a positive
association that leads to high profitability a study of USA from 1976-1984
and is also explored that decrease in interest rate in the period of
recession decrease in growth in loans and enhance in loan loss (Hanweck
& Kilcollin, 1984). High interest rate is directly related with profitability in
less developed nation explored by (Demirgüç-Kunt & Huizinga, 1999).
This identified that current deposits pay nothing in developing states. In
the related sense the interest rate unpredictability normally infers high
interest margins as financial institutions largely able to handover the high
risk to their customers a study incorporate by (Ho & Saunders, 1981).
The profitability of the European banking industry was studied by
Goddard et al. (2004) during the 1990s. The empirical study was
performed on six European banks - Denmark, France, Germany, Italy,
Spain and the UK (665 banks) and revealed that the relationship between
the capital–assets ratio and profitability (ROE) was positive.
Athanasoglou et al. (2005) investigated the profitability of Greek banks
between 1985- 2001 and found that credit risk and operational expenses
have a negative impact on profitability, while labour productivity and
inflation are positively correlated with financial performance.
26
Dietrich şi Wanzenried (2010) studied the profitability of 453 commercial
banks in Switzerland over the period 1999-2008. In order to take into
account the impact of the recent financial crisis, they additionally consider
the pre-crisis period and the crisis years 2007-2008 separately. The
capital ratio, which is defined as equity over total assets, has a positive
and significant effect on bank profitability as measured by ROA, and this
holds in all three time periods considered. The coefficient of the cost-to-
income ratio, a measure of efficiency, is negative and highly significant for
the whole period as well as for the years before the crisis. The more
efficient a bank is, the higher is its profitability. The loan loss provision
relative to total loans ratio, which is a measure of credit quality, does not
have a statistically significant effect on bank profitability before the crisis.
The loan loss provisions, which have also significantly increased during
the crisis, negatively affect ROA.
Hoffmann (2011) examines the determinants of the US banks profitability
during the period 1995-2007. The empirical analysis combines bank
specific and macroeconomic variables. The empirical findings document a
negative relationship between the capital ratio and the profitability, which
supports the notion that banks are operating over-cautiously and ignoring
potentially profitable trading opportunities.
Capital plays vital role in the performance of a bank, as the banks that
have higher capitals perform well as compare to smaller. A direct

27
association between the capital and the bank profit was concluded in a
study of European commercial banks by (Staikouras & Wood, 2003). A
significant direct link between the equity and profit of banks was found by
(Abreu & Mendes, 2001).
There is an indirect association between the bank size and profitability in
the study conducted by the (Boyd & Runkle, 1993). Banking size has an
inverse link with larger banks and direct association with smaller banks
profitability but the intermediate size bank earns high return on
investment. Berger et al. (1987) explored a negative relationship between
the bank size and return by using a set of scale and product mix on the
other hand no association between size and profitability, so slight cost
reduction can be achieved by raising the magnitude of the banking firm.
Bank size is introduced to report for present economies and diseconomies
of scale in the marketplace a study conducted by (Akhavein, Berger, &
Humphrey, 1997). Steinherr and Huveneers (1994), in their study using
bank size as an independent factor found that it has mixed impact on the
banks profitability. As investigated by Kapoor (2004) the fundamental
purpose of commercial banks is to enhance their size not to have the
benefit of cost approving from the financial system of scale but also to
force their existence in the fresh market situation of Europe after
introducing euro. The impact of bank size on its performance is different
as explored in a study conducted by Goddard et al. (2004) from 1992-1998

28
of Europe it shows mix association and relationship among size and
profitability.
Hoggarth et al., (1998) conclude that the behavior of real GDP fails to
explain the greater variability of banking sector profits in the UK than in
Germany. But they do not say that GDP variability did not affect profits,
only that they could not use it to explain different UK/German banks
performance. If this variable is not statistically significant in explaining
profitability, then the conclusions of the authors are reinforced. Otherwise,
the expected sign should be positive since higher growth implies both
lower probabilities of individual and corporate default and an easiest
access to credit.
Jiang et al. (2003) analysed the profitability of banking industry in Hong
Kong between 1990 and 2002, empirical results showing that both bank-
specific as well as macroeconomic factors are important determinants in
the profitability of banks. With regard to macroeconomic factors, real GDP
growth, inflation and real interest rates have a positive impact. On the
other hand, the size variable, represented by loans or deposits, has a
negative relationship with profitability, suggesting that, on average, larger
banks achieve a lower ROA than smaller ones. The conclusion of this
study is that a profitable banking sector is better able to withstand
negative shocks and contribute to the stability of the financial system.

29
Gul et.al (2011) examined the relationship between bank-specific (capital
ratio, equity to total assets) and macroeconomic (GDP real growth,
inflation and market capitalization) characteristics over bank profitability
(ROA, ROE, net interest margin) by using data of top fifteen Pakistani
commercial banks over the period 2005-2009. The conclusions were that
between total loans, deposits, inflation, GDP on the one hand and ROA on
the other hand is a positive relationship, while between market
capitalization and ROA the correlation is negative.
The study on Malaysian banks by Guru et al. (2002) shows that efficient
management is among the most important factors that explain high bank
profitability. Further found out that credit risk and operational
inefficiencies explain most of the variation in net interest margins across
the region, with macroeconomic factors, having less influence on
performance.
Deposit is the most valuable and significant indicator of the balance sheet
as it symbolizes a clue of conventionality banking activities. Guru tried to
elaborate the factors of successful deposits banks for the sake to give a
useful guide for enhance profitability performance of these banks, for this
purpose in this study included 17 Malaysian banks.
In a study of European banks (Abreu & Mendes, 2001) it is explored that
the operational expenses of the banks have an indirect correlation with
bank profit, even though they have a direct association with net interest

30
margins of the banks. Different studies in different parts of the world
found that bank expenses have negative relations with profitability of the
banks as incorporated by (Grigorian & Manole, 2006).
As expense has inverse relationship with profit, high expense leads to less
profitability, this indirect association between expense and profit is
investigated by the study of (Bourke, 1989). Positive relation between cost
and profitability was found by (Jiang, Tang, Law, & Sze, 2003).
Opposite view of (Molyneux & Thornton, 1992) expense factors influenced
European bank profit significantly. They suggest that high earnings
produced by the firm in rigid industry may be proper in the shape of high
pay and remuneration cost. Their studies assist the efficiency wage theory,
which states that the output of the workers boost with wage rate. Similarly
direct and significant association between profit and expenses is explore in
Tunisia (Naceur, 2003).
Bank expenses are regarded as very essential determinant of profitability,
directly associated to concept of proficient management. As expected
coefficient of cost to income ratio is inverse and positive in different
studies, telling that efficiency in expenses management is the strong
factors of UK bank performance and profitability (Guru &
Staunton),(Pasiouras & Kosmidou, 2007).
Mohammed (2012) studied the bank performance in context of corporate
governance for which mainly the ratios of non-performing loans and loan

31
deposits have been used. Study was conducted on 9 banks of Nigeria for a
period of 10 years from 2001-2010. According to generalized least square
regression results, non-performing loans ratio has significant negative
effect while loan deposit ratio has insignificant negative effect on
performance. So, survival of banks is strongly dependent upon the better
asset quality means dependent upon minimizing the non-performing loans
ratio.
2.2.1 Empirical studies in Ethiopia
Most literatures that are examined in this study used banks specific,
industry specific and macroeconomic factors as a determinant of banks
profitability. Empirical evidence which included in this study are
determinants of commercial banks profitability: an empirical study on
Ethiopian commercial banks by, Demena (2011), determinants of
commercial banks profitability: an empirical review of Ethiopian
commercial banks by Belayneh (2011), factors affecting profitability: an
empirical study on Ethiopian banking industry by Amdemikael (2012),
determinants of commercial banks profitability: an empirical evidence from
the commercial banks of Ethiopia by Birhanu (2012), determinants of
bank profitability: an empirical study on Ethiopian private commercial
banks by Habtamu (2012). Samuel (2015) Determinants of Commercial
Banks Profitability: The Case of Ethiopian Commercial Banks.

32
Damena (2011) in his study examined the determinants of Ethiopian
commercial banks profitability. The study applied the balanced panel data
of seven Ethiopian commercial banks that covers the period 2001- 2010.
The paper used Ordinary Least Square (OLS) technique to investigate the
impact of some internal as well as external variables on major profitability
indicator i.e., ROA. The estimation results showed that all bank-specific
determinants, with the exception of saving deposit, significantly affect
commercial banks profitability in Ethiopia.
Belayneh (2011) examined the determinants of Ethiopian commercial
banks profitability. The study applied the balanced panel data of seven
Ethiopian commercial banks that covers the period 2001- 2010. The paper
used Ordinary Least Square (OLS) technique to investigate the impact of
some internal as well as external variables on major profitability indicator
i.e., ROA, The estimation results of his study show that all bank-specific
determinants, with the exception of saving deposit, significantly affect
commercial banks profitability in Ethiopia. Market concentration is also a
significant determining factor of profitability. Finally, with regard to
macroeconomic variables, only economic growth exhibits a significant
relationship with banks profitability.
The study made by Amdemikael (2012) examined the determinants of
Ethiopian commercial banks profitability. The study applied the balanced
panel data of eight Ethiopian commercial banks that covers the period

33
2001- 2011. The study adopts a mixed methods research approach by
combining documentary analysis and in-depth interviews to investigate
the impact of some internal as well as external variables on major
profitability indicator i.e., ROA. The findings of the study show that capital
strength, income diversification, bank size and gross domestic product
have statistically significant and positive relationship with banks
profitability. On the other hand, variables like operational efficiency and
asset quality have a negative and statistically significant relationship with
banks profitability. However, the relationship for liquidity risk,
concentration and inflation is found to be statistically insignificant.
Birhanu (2012) examined the determinants of Ethiopian commercial
banks profitability. The study applied the balanced panel data of eight
Ethiopian commercial banks that covers the period 2001- 2011. The paper
used Ordinary Least Square (OLS) technique to investigate the impact of
some internal as well as external variables on profitability indicator i.e.,
ROA, NIM. The finding shows all bank-specific determinants, with the
exception of bank size, expense management and credit risk, affect bank
profitability significantly and positively in the anticipated way. However,
bank size, expense management and credit risk affect the commercial
banks profitability significantly and negatively. In addition to this, no
evidence is found in support of the presence of market concentration.
Finally, from macro-economic determinants GDP has positive and
significant effect on both asset return and interest margin of the bank. But

34
interest rate policy has significant and positive effect only on interest
margin.
Habtamu (2012) examined the determinants of Ethiopian private
commercial banks profitability. The study applied the balanced panel data
of seven Ethiopian commercial banks that covers the period 2002- 2011.
The paper used Ordinary Least Square (OLS) technique to investigate the
impact of some internal as well as external variables on profitability
indicator i.e., ROA, ROE & NIM. The empirical results shows that bank
specific factors; capital adequacy, managerial efficiency, bank size and
macro-economic factors; level of GDP, and regulation have a strong
influence on the profitability of private commercial banks in Ethiopia.
Samuel (2015) investigates determinants of commercial banks profitability
in Ethiopia by using panel data of eight commercial banks from year 2002
to 2013. The study used mixed research approach and secondary financial
data are analyzed by using multiple linear regressions models for the bank
profitability measure, Return on Asset (ROA). Fixed effect regression model
was applied to investigate the impact of bank size, capital adequacy,
liquidity risk, operating efficiency, management efficiency, employee
efficiency, funding cost, banking sector development, real GDP, inflation
rate and foreign exchange rate on Return on Asset (ROA) and also primary
data was used to support the result of the documentary analyses. The
findings of the study show that bank size, capital adequacy and gross

35
domestic product have statistically significant and positive relationship
with bank’s profitability. On the other hand, variables like liquidity risk,
operational efficiency, funding cost and banking sector development have
a negative and statistically significant relationship with banks’
profitability.
2.3 Overview of banking in Ethiopia
2.3.1 Historical Overview
The agreement that was reached in 1905 between Emperor Minilik II and
Mr.Ma Gillivray, representative of the British owned National Bank of
Egypt marked the introduction of modern banking in Ethiopia. Following
the agreement, the first bank called Bank of Abyssinia was inaugurated in
Feb.16, 1906 by the Emperor. The Bank was totally managed by the
Egyptian National Bank
The society at that time being new for the banking service, Bank of
Abyssinia had faced difficulty of familiarizing the public with it. It had also
need to meet considerable cost of installation and the costly journeys by
its administrative personnel.
Generally, in its short period of existence, Bank of Abyssinia had been
carrying out limited business such as keeping government accounts, some
export financing and undertaking various tasks for the government.
Moreover, the Bank faced enormous pressure for being inefficient and
purely profit motivated and reached an agreement to abandon its

36
operation and be liquidated in order to disengage banking from foreign
control and to make the institution responsible to Ethiopia’s credit needs.
Thus by 1931 Bank of Abyssinia was legally replaced by Bank of Ethiopia
shortly after Emperor Haile Selassie came to power.
The new Bank, Bank of Ethiopia, was a purely Ethiopian institution and
was the first indigenous bank in Africa and established by an official
decree on August 29, 1931 with capital of £750,000. Bank of Ethiopia took
over the commercial activities of the Bank of Abyssinia and was authorized
to issue notes and coins. The Bank with branches in Dire Dawa, Gore,
Dessie, Debre Tabor, Harar, agency in Gambella and a transit office in
Djibouti continued successfully until the Italian invasion in 1935. During
the invasion, the Italians established branches of their main Banks
namely Banca d’Italia, Banco di Roma, Banco di Napoli and Banca
Nazionale del lavoro and started operation in the main towns of Ethiopia.
However, they all ceased operation soon after liberation except Banco di
Roma and Banco di Napoli which remained in Asmara.
In 1941 another foreign bank, Barclays Bank, came to Ethiopia with the
British troops and organized banking services in Addis Ababa, until its
withdrawal in 1943. Then on 15th April 1943, the State Bank of Ethiopia
commenced full operation after 8 months of preparatory activities. It acted
as the central Bank of Ethiopia and had a power to issue bank notes and
coins as the agent of the Ministry of Finance. In 1945 and 1949 the Bank

37
was granted the sole right of issuing currency and deal in foreign
currency. The Bank also functioned as the principal commercial bank in
the country and engaged in all commercial banking activities.
The State Bank of Ethiopia had established 21 branches including a
branch in Khartoum, Sudan and a transit office on Djibouti until it ceased
to exist by bank proclamation issued on December, 1963. Then the
Ethiopian Monetary and Banking law that came into force in 1963
separated the function of commercial and central banking creating
National Bank of Ethiopia and commercial Bank of Ethiopia. Moreover it
allowed foreign banks to operate in Ethiopia limiting their maximum
ownership to be 49 percent while the remaining balance should be owned
by Ethiopians.
The National Bank of Ethiopia with more power and duties started its
operation in January 1964. Following the incorporation as a share
company on December 16, 1963 as per proclamation No.207/1955 of
October 1963, Commercial Bank of Ethiopia took over the commercial
banking activities of the former State Bank of Ethiopia. It started operation
on January 1, 1964 with a capital of Ethiopian Birr 20 million. In the new
Commercial Bank of Ethiopia, in contrast with the former State Bank of
Ethiopia, all employees were Ethiopians.

38
There were two other banks in operation namely Banco di Roma S. C. and
Banco di Napoli S.C. that later reapplied for license according to the new
proclamation each having a paid-up capital of Ethiopian Birr 2 million.
The first privately owned bank, Addis Ababa Bank Share Company, was
established on Ethiopians initiative and started operation in 1964 with a
capital of Birr 2 million in association with National and Grindlay Bank,
London which had 40 percent of the total share. In 1968, the original
capital of the Bank rose to Birr 5.0 million and until it ceased operation, it
had 300 staff at 26 branches.
Following the declaration of socialism in 1974 the government extended its
control over the whole economy and nationalized all large corporations.
Organizational setups were taken in order to create stronger institutions
by merging those that perform similar functions. Accordingly, the three
private owned banks, Addis Ababa Bank, Banco di Roma and Banco di
Napoli Merged in 1976 to form the second largest Bank in Ethiopia called
Addis Bank with a capital of Ethiopian Birr 20 million. Then Addis Bank
and Commercial Bank of Ethiopia S.C. were merged by proclamation
No.184 of August 2, 1980 to form the sole commercial bank in the country
till the establishment of private commercial banks in 1994. The
Commercial Bank of Ethiopia commenced its operation with a capital of
Birr 65 million.

39
The financial sector that the socialist oriented government left behind
constituted only 3 banks and each enjoy monopoly power in its respective
market. These are The National Bank of Ethiopia (NBE), The Commercial
Bank of Ethiopia (CBE) and Agricultural and Industrial Development Bank
(AIDB).
Following the demise of the Dergue regime in 1991 that ruled the country
for 17 years under the rule of command economy, the EPRDF declared a
liberal economy system. In line with this, Monetary and Banking
proclamation of 1994 established the national bank of Ethiopia as a
judicial entity, separated from the government and outlined its main
function (retrieved from www.nbe.gov.et).
2.3.2 The Current Development
Monetary and Banking proclamation No.83/1994 and the Licensing and
Supervision of Banking Business No.84/1994 laid down the legal basis for
investment in the banking sector. Consequently shortly after the
proclamation the first private bank, Awash International Bank was
established in 1994 by 486 shareholders and by 1998 the authorized
capital of the Bank reached Birr 50.0 million. Dashen Bank was
established on September 20, 1995 as a share company with an
authorized and subscribed capital of Birr 50.0 million (retrieved from
www.nbe.gov.et).

40
As at June 30, 2014, 19 banks are operating in the county of which 16 are
privately owned and the remaining 3 are state owned. The total branch
network in country stood at 2,208 during the same period and the
population to bank ratio was 1:39,402.
The total capital of the banking industry reached Birr 26.4 billion by the
end of June 2014. The share of private banks in total capital was 55.3
percent, whereas the share of CBE in total capital of the banking sector
stood at 38.7 percent as at the end of June 2014.
Total resources mobilized by the banking system in the form of deposit,
loan collection and borrowing increased by 13.6 percent and reached Birr
111.4 billion at the end of 2013/14. Spurred by remarkable branch
expansion, deposit liabilities of the banking system reached Birr 292.8
billion during the same period.
Total outstanding credit of the banking system (excluding NBE) including
the central government increased by 19.9 percent and reached Birr 181.3
billion at the end of June 2014. Meanwhile, Total gross profit of private
banks during the 2013/14 fiscal year was Birr 4.4 billion (NBE 2014).
2.3.3 Role of National Bank of Ethiopia
In accordance with Article 55(1) of the constitution of the Federal
Democratic Republic of Ethiopia, the NBE is established to control the
financial system and monetary policy of the country. This monetary policy

41
refers to a bundle of actions and regulatory stances taken by the central
bank including; setting minimum interest rates on deposits or the
rediscount rate charged to Commercial banks borrowing reserves, setting
reserve requirements on various classes of deposits, increasing or
decreasing commercial bank reserves through open market purchases or
sales of government securities.
Furthermore, regulatory actions to constrain commercial bank financial
activity or to set minimum capital requirements, intervention in foreign
exchange markets to buy and sell domestic currency for foreign exchange
and decide on the level of required reserve of commercial banks total
deposit. In Ethiopia, National Bank exercises control over the banking
sector through issuance of directives pertaining formation and operation of
a banking business. Most of the directives on operation aim at reducing
risk of liquidity and solvency in the banking system. Some of NBE‟s
directives are issued as part of the central bank’s conduct of monetary
policy and some are issued to ensure that the sector plays adequate role in
channeling funds to priority sectors of the economy. Most notable action
by NBE is its revision of the reserve requirement to combat souring
inflation in the country. The bank revised the reserve requirement from 5%
to 10% in 2007 (NBE directive NO.SBB/42/2007) and to 15% in 2008
(NBE directive NO.SBB/45/2008).

42
In the beginning of 2009 NBE imposed a credit cap on private commercial
with the aim of curbing the inflationary pressure and calming down the
seemingly overheating economy. However, the cap was removed and
subsequently NBE has introduced a directive which requires all private
commercial banks in the country to purchase NBE Bill amounting to 27%
of total loan disbursed starting from 4th April 2011 (Directive number:
MFA/NBE Bills/001/2011). The bill has a maturity period of 5 years. The
interest rate on the bills is 3 percent while the rate of interest that banks
charge when they accept deposits is 5 percent.
2.4 Conclusions and Knowledge Gap
It has been indicated that, determinants of bank profitability can be split
between those that are internal and those that are external. Internal
determinants or bank specific factors can be defined as those factors that
are influenced by the bank’s management decisions and policy objectives.
Management impacts are the results of differences in bank management
objectives, strategies policies, decisions, and actions reflected in
differences in bank operating results. The external factors are
determinants that are not related to bank management but reflect the
macroeconomic, political and legal factors that affect the operation and
performance of banks. Various determinants have been proposed for both
internal and external factors according to the nature and objective of each
research.

43
It has been argued that internal factors mainly, management decisions,
particularly regarding loan portfolio concentration, a bank’s asset and
liability management, its funding management and the non-interest cost
controls, Bank size Deposit, Lending and non-performing loans (NPLs) are
affecting bank’s profitability considerably.
Various theoretical and empirical literatures have tried to show the impact
of macroeconomic variables such as GDP, Inflation, Interest Rate, etc on
profitability of banks. Empirical literatures in Ethiopia have also been tried
to show factors affecting profitability of commercial banks in Ethiopia.
However, none of the studies discussed in the above section have seen the
impact of regulation such as that of National Bank of Ethiopia’s Bill (NBE
Bill) on the profitability of banks.
Therefore, the objective of this study is to examine the factors that affect
bank profitability in Ethiopia and to fill the knowledge gap that exists in
the area by including and testing new variable, NBE bill that is not tested
by prior Ethiopian researchers. Besides, the researcher uses large
numbers of observations and time span to have a comprehensive look at
the factors affecting profitability of private commercial banks in Ethiopia.

44
Chapter Three
3. Methodology
Having seen both the empirical and theoretical review of literature in the
preceding chapter, this chapter will be devoted to the methodological
aspect of the study.
3.1 Data Type
In order to analyze the determinants of banks’ profitability, the study uses
nine variables, one of them is the dependent and the others are
independent variables. The independent variables are comprised of bank-
specific and macroeconomic determinants of bank profitability. The
Dependent Variable is Return on Assets (ROA) whereas the independent
variables are Bank size as measured by logarithm of total assets, Capital
adequacy as determined by the ratio of equity to total assets, Asset Quality
as measured by non-performing loan to total loan ratio (NPL), Expenses
Management as determined by the ratio of non-interest expenses to
average assets, Liquidity as measured by the ratio of loans to deposits,
Annual real gross domestic product growth rate (GDP), annual inflation
rate (INF), real interest rate (RI), NBE Bill.

45
3.2 Sample Design
The data for this study comprised of the panel secondary data (i.e.
comprising cross-sectional and time-series data) which obtained from
audited financial reports of the banks. Currently, there are sixteen private
commercial banks and three govern owned banks in operation in Ethiopia.
The researcher takes six banks that have been in operation for more than
ten years as at June 30, 2015 for the study purpose. The cross sectional
element is reflected by the six banks under consideration and the time
series element is reflected in the period of study (2005 – 2014). The main
advantage of using panel data is that it allows overcoming of the
unobservable, constant, and heterogeneous characteristics of each bank
included in the sample (Saona, 2011).
3.3 Method of Data Collection and Analysis
Structured document survey is used to collect the necessary data from
audited financial statements of each commercial bank in the sample for
bank specific factors. Thus, audited financial statements of six banks
namely, AIB, DB, WB, BoA, NIB and UB for ten years covering 2006-2015
have been looked at. For macroeconomic determents, the necessary data
have been collected from annual reports of National Bank of Ethiopia and
Ministry of Finance and Economic Development.

46
This study employed both descriptive and econometric analysis. The
descriptive approach was used to analyze the sample and the observations
that have been used in this study. The econometric method is used in this
study to evaluate the main determinants affecting profitability of banking
sector in Ethiopia.
3.4 Description of Variables
3.4.1 Dependent Variable
ROA: it is a general measure for bank profitability reflects bank ability to
achieve
return on its sources of fund to generate profits. In the literature ROA is
regarded as the best and widely used indicator of earnings and
profitability, because ROA assesses how efficiently a bank is managing its
revenues and expenses, and also reflects the ability of the management of
the bank to generate profits by using the available financial and real
assets’ (Obamuyi, 2013).
3.4.2 Independent Variables
Bank size: In most finance literature, total assets of the banks are used as
a proxy for bank size. Bank size is represented by natural logarithm of
total asset (log A). The effect of bank size on profitability is generally
expected to be positive (Smirlock, 1985). Bank size accounts for the
existence of economies or diseconomies of scale (Naceur & Goaied, 2008).
The banking theory asserts that a firm enjoys economies of scale up to a

47
certain level, beyond which diseconomies of scale set in. This implies that
profitability increases with increase in size, and decreases as soon as there
are diseconomies of scale. Thus, literature has shown that the relationship
between the bank size and profitability can be positive or negative
(Staikouras and Wood, 2004; Athanasoglou et al., 2005; Flamini et al.,
2009; Dietrich and Wanzenrid, 2009).
Capital adequacy: The ratio of equity to total assets (CA) is considered one
of the basic ratios for capital strength. It is expected that the higher this
ratio, the lower the need for external funding and the higher the
profitability of the bank. It shows the ability of bank to absorb losses and
handle risk exposure with shareholder. Equity to total assets ratio is
expected to have positive relation with profitability that well-capitalized
banks face lower costs of going bankrupt which reduces their costs of
funding and risks (Berger, 1995; Bourke, 1989)
Asset Quality: The quality of assets held by a bank depends on exposure
to specific risks, trends in nonperforming loans, and the health and
profitability of bank borrowers. Poor asset quality and low levels of
liquidity are the two major causes of bank failures. Poor asset quality led
to many bank failures (Olweny and Shipo, 2011). A bank’s profitability will
decrease if it is highly exposed by credit risk, hence inverse relationship
between bank profitability and non-performing loan to total loan ratio
(NPL) is expected. For the purpose of this study, non-performing loan to

48
total loan ratio (NPL) used to measure asset quality. Thus, a negative
relationship is expected to between NPL and Profit (ROA).
Expenses Management: The ratio of non-interest expenses to average
assets is the ratio that more frequently used on studies of bank
profitability in measuring the management quality (Kosmidou et al, 2006).
It is expected a negative relationship between management quality
(expenses management) and profitability, since improved management
quality will increase efficiency and hence rise profits (Athanasoglou et al.,
2005).
Liquidity: The ratio of loans to deposits is used in this study as a measure
of liquidity. The higher this percentage the more liquid the bank is.
Insufficient liquidity is one of the major reasons of bank failures. However,
holding liquid assets has an opportunity cost of higher returns. Bourke
(1989) finds a positive significant link between bank liquidity and
profitability. However, in times of instability banks may choose to increase
their cash holding to mitigate risk. Unlike Bourke (1989), Molyneux and
Thorton (1992) come to a conclusion that there is a negative correlation
between liquidity and profitability levels.
GDP: It is a measure of the total economic activity and it is adjusted for
inflation. It is expected to have an effect on many determinants related to
the demand and supply for banks deposits and loans. In the literature

49
GDP growth is expected to have a positive effect on bank profitability
(Demirguc-Kunt and Huizinga, 1999.
Annual Inflation Rate: This measures the overall percentage increase in
Consumer Price Index (CPI) for all goods and services. Inflation affects the
real value of costs and revenues. Inflation and profitability may have
positive or negative relation depending on whether it is anticipated or
unanticipated (Perry, 1992). In the literature most of studies observe a
positive impact between inflation and profitability (Bourke, 1989;
Molyneux and Thorton 1992; Kosmidou, 2006).
Real Interest Rate: According to previous studies, the evidence has
shown that, there is a positive relationship between interest rates and
banks performance, bank profits increase with rising interest rates
(Samuelson 1945).
National Bank of Ethiopia Bill (NBE Bill): empirical research conducted
on the effect of NBE Bill on profitability of private banks in Ethiopia
appears to show a positive relationship. NBE bill seems contributed
positively to performance via moping the excess liquidity holding of banks
or providing an opportunity for private banks to invest their excess funds
in government securities than the customary practice of holding their
liquid asset in zero earning accounts at the National Bank of Ethiopia. In
addition, it instigated banks to work on fee generating sources (Tesfay B.
Lelisa 2014).
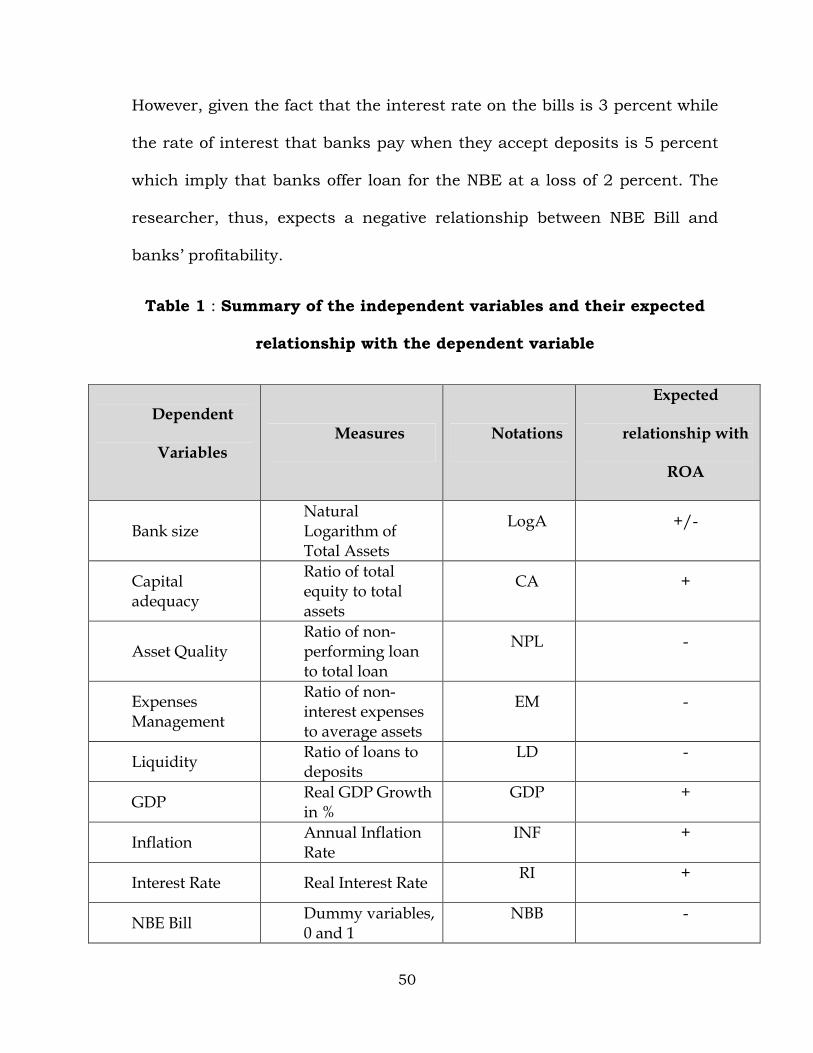
50
However, given the fact that the interest rate on the bills is 3 percent while
the rate of interest that banks pay when they accept deposits is 5 percent
which imply that banks offer loan for the NBE at a loss of 2 percent. The
researcher, thus, expects a negative relationship between NBE Bill and
banks’ profitability.
Table 1 : Summary of the independent variables and their expected
relationship with the dependent variable
Dependent
Variables Measures Notations
Expected
relationship with
ROA
Bank size Natural Logarithm of Total Assets
LogA +/-
Capital adequacy
Ratio of total equity to total assets
CA +
Asset Quality Ratio of non-performing loan to total loan
NPL -
Expenses Management
Ratio of non-interest expenses to average assets
EM -
Liquidity Ratio of loans to deposits
LD -
GDP Real GDP Growth in %
GDP +
Inflation Annual Inflation Rate
INF +
Interest Rate Real Interest Rate RI +
NBE Bill Dummy variables, 0 and 1
NBB -

51
3.5 Model Specification
The econometric method was used in this study to evaluate the main
determinants affecting profitability of private banks in Ethiopia. To
investigate the factors affecting bank profitability, the study used panel
data. In panel data models, the data set consists of n cross sectional units,
denoted i = 1… N, observed at each of t time periods, t = 1… T. In data set,
the total observation is n x t. The basic framework for the panel data is
defined according to the following regression model (Brooks, 2008):
Yit = α+βXit + µit
Where Yit is the dependent variable, α is the intercept term, β is a K x 1
vector of parameters to be estimated on the explanatory variables, and Xit
is a 1 x k vector of observations on the explanatory variables, t = 1… T; i =
1… N.
In regression analysis the dependent variable, or regressand, is frequently
influenced not only by ratio scale variables (e.g., income, output, prices,
costs, height, temperature) but also by variables that are essentially
qualitative, or nominal scale, in nature, such as sex, race, color, religion,
nationality, geographical region, political upheavals, and party affiliation.

52
Since such variables usually indicate the presence or absence of a
“quality” or an attribute, such as male or female, black or white, Catholic
or non-Catholic, Democrat or Republican, they are essentially nominal
scale variables. One way we could “quantify” such attributes is by
constructing artificial variables that take on values of 1 or 0, 1 indicating
the presence (or possession) of that attribute and 0 indicating the absence
of that attribute (Gujarati, 2004).
A Dummy variable is added to the model to classify the periods in to two:
before and after the bill purchase policy was introduced. A variable 1 is
assigned to represent the period after the bill purchase policy and 0,
otherwise.
We can therefore extend the above equation, by including explanatory
variables and ROA as dependent variables as follows;
ROAit= α0 + β1 (LogAit) + β2 (CAit) + β3 (NPLit) + β4 (EMit) + β5 (LDit) + β6 (GDPt)
+ β7 (INFt) + β8 (RIt) + β9 (Dt) + µit
Where:
ROAit = Return on Asset of Bank i at time t
α0 = Intercept
LogAit = bank size of bank i at time t
CAit = Capital Adequacy of bank i at time t
NPLit = Asset Quality of bank i at time t
EMit =Expenses Management of Bank i at time t

53
LDit = Liquidity Ratio of Bank i at time t
GDPt = Gross Domestic Product (GDP) at time t
INF= Annual Inflation Rate at time t
RIt = Annual Real Interest Rate at time t
Dt = A Dummy variable t=1 for the period after the NBE bill purchase
policy and t=0, otherwise.
µit = Error term where i is cross sectional and t time identifier

54
Chapter 4
4. Empirical Results and Discussions
In chapter two, important literatures relating to the topic that gives an
insight into the matter under discussion were reviewed. Issues with
regards to Data Type, Method of Data Collection and Analysis, Sample
Design and Description of Variables have been discussed in the preceding
chapter. This chapter is devoted to presentation of findings of the analysis.
The data for this study is comprised of the panel secondary data (i.e.
comprising cross-sectional and time-series data) which are obtained from
audited financial reports of 6 banks that are in operation for at least 15
years as at June 30, 2015. The cross sectional element is reflected by the
six banks under consideration namely; Awash International Bank, Dashen
Bank, Wegagen Bank, Bank of Abyssinia, Nib International Bank and
United Bank and the time series element is reflected in the period of study
(2006 – 2015).
Since panel data relate to individuals, firms, states, countries, etc. over
time, there is bound to be heterogeneity in these units. The techniques of
panel data estimation can take such heterogeneity explicitly into account
by allowing for individual-specific variables. We use the term individual in
a generic sense to include micro units such as individuals, firms, states,
and countries. By combining time series of cross-section observations,

55
panel data give “more informative data, more variability, less collinearity
among variables, more degrees of freedom and more efficiency (Gujarati
2004).”
4.1 Choice of Model
Panel-data models are extensions of standard regression models that take
into account group (or panel) effects. There are two most prominent
models in dealing with Panel Data analysis.
(1) The fixed effects model (FEM)
(2) The random effects model (REM)
In FEM the intercept in the regression model is allowed to differ among
individuals in recognition of the fact each individual, or cross-sectional,
unit may have some special characteristics of its own. In REM, on the
other hand, it is assumed that the intercept of an individual unit is a
random drawing from a much larger population with a constant mean
value. The individual intercept is then expressed as a deviation from this
constant mean value (Gujarati, 2004).
If T (the number of time series data) is large and N (the number of cross-
sectional units) is small, there is likely to be little difference in the values
of the parameters estimated by fixed effect model (FEM) and random effect
model (REM) (Gujarati, 2004). Since the number of time series (i.e. 10
year) is greater than the number of cross-sectional units (i.e. 6 commercial

56
banks), the researcher has made the choice based on computational
convenience. The researcher finds the FEM model to be computationally
convenient while dealing with the data.
According to Brooks (2008); Verbeek (2004) and Wooldridge (2006), it is
often said that the REM is more appropriate when the entities in the
sample can be thought of as having been randomly selected from the
population, but a FEM is more plausible when the entities in the sample
effectively constitute the entire population/sample frame. Hence, the
sample for this study was not selected randomly and thus the researcher
found the FEM to be appropriate.
4.2 Classical Linear Regression Model Assumptions and
Diagnostic Test
It is essential to test the assumptions Classical Linear Regression Model
prior to undertaking the estimations of variables. We have to be sure that
the assumptions underlying Ordinary Least Square (OLS) estimation are
not violated. This is done through testing each assumption.
4.2.1 Test for Heteroskedasticity
One of the important assumptions of the classical linear regression model
is that the variance of each disturbance term ui, conditional on the chosen
values of the explanatory variables, is some constant number equal to σ2.

57
This is the assumption of homoscedasticity. If the errors do not have a
constant variance, they are said to be heteroscedastic.
To test this assumption the whites test was used having the null
hypothesis of Heteroskedasticity. Both F-statistic and chi-square (χ)2 tests
statistic were used.
In this study as shown in table 4.1, both the F-statistic and Chi-Square
versions of the test statistic gave the same conclusion that there is no
evidence for the presence of Heteroskedasticity, since the p-values were in
excess of 0.05. The third version of the test statistic, “Scaled explained
SS”, which as the name suggests is based on a normalized version of the
explained sum of squares from the auxiliary regression, also gave the same
conclusion that there is no evidence for the presence of Heteroskedasticity
problem, since the p-value was considerably in excess of 0.05.
Table 2 : Test for Heteroskedasticity
Heteroskedasticity Test: White
F-statistic 2.474837 Prob. F(49,10) 0.0617
Obs*R-squared 55.42916 Prob. Chi-Square(49) 0.2452
Scaled explained SS 34.54657 Prob. Chi-Square(49) 0.9413 Source: Eviews 9
4.2.2 Test for Autocorrelation
The term autocorrelation may be defined as “correlation between members
of series of observations ordered in time [as in time series data] or space

58
[as in cross-sectional data].’’ In the regression context, the classical linear
regression model assumes that such autocorrelation does not exist in the
disturbances ui (Gujarati 2004). In other words, it is assumed that the
errors are uncorrelated with one another and correlation of error terms
implies violation of the OLS assumption that error terms are not serially
correlated.
There are a number of tests available for Autocorrelation. The most
celebrated test for detecting serial correlation is Durbin-Watson test (DW
Test).
The value of Durbin Watson Test (d) always lies between 0 and 4. If the
Durbin–Watson statistic is substantially less than 2, there is evidence of
positive serial correlation. As a rough rule of thumb, if Durbin–Watson is
less than 1.0, there may be cause for alarm. Small values of d indicate
successive error terms are, on average, close in value to one another, or
positively correlated. If d > 2, successive error terms are, on average, much
different in value from one another, i.e., negatively correlated. In
regressions, this can imply an underestimation of the level of statistical
significance. If d is equal to 2 it indicates that there is no Autocorrelation.
If d is closer to 2, it indicates that the problem of serial correlation in not
serious (Gujarati 2004).

59
As it has been shown in Table 4.4 of regression result, the Durbin Watson
statistic stood at 1.76 which is much closer to 2 indicating that there is no
serious autocorrelation problem in the data set.
4.2.3 Test for multicollinearity
Multicollinearity refers to the existence of a perfect or exact, linear
relationship among some or all explanatory variables of a regression
model. If multicollinearity is perfect, the regression coefficients of the
explanatory variables are indeterminate and their standard errors are
infinite. If multicollinearity is less than perfect, the regression coefficients,
although determinate, possess large standard errors (in relation to the
coefficients themselves), which means the coefficients cannot be estimated
with great precision or accuracy. It thus violates the classical linear
regression model (CLRM) assumption which states that there is no
multicollinearity among the regressors included in the regression model
(Gujarati 2004).
Table 4.2 below presents the summary results of the correlation analysis
for the study in order to determine the level of association among the
explanatory variables. As seen in the table, there are fairly low data
correlations among the independent variables. As per statistics in the table
most of the variables are weakly correlated with coefficients of correlation
less than 0.4. Kennedy (2008), state that correlation is high when its value
is above 0.80 or 0.90.

60
Bryman and Cramer (2001) view that multicollinearity is when correlation
exceeds 0.80 whereas, Anderson, Sweeney and Williams (1990) use 0.70
as standard point indicating multicollinearity. Hence due to these low
correlation coefficients the results show that there is no multicollinearity
problem for the independent variables.
Table 3 : Results of Correlations between Independent Variables
CA D01 EM GDP INF LD LOGA NPL RI
CA 1
D01 0.29801 1
EM 0.24766 0.21951 1
GDP -0.2093 -0.7191 0.00466 1
INF -0.0190 -0.1054 -0.1214 -0.3805 1
LD 0.06917 -0.3665 0.13214 0.52471 -0.0346 1
LOGA -0.0063 0.7198 0.01297 -0.575 -0.1386 -0.7287 1
NPL 0.21905 -0.4003 0.24415 0.19399 0.22737 0.40081 -
0.5404 1
RI 0.12806 0.25381 0.04277 -0.5734 0.21057 -0.7326 0.5841 -
0.0316 1
Source: Computed from Eviews result
4.2.4 Normality Test
Normality Test is another important test to undertake while undertaking
the regression analysis. Brooks (2008) stated that the normality
assumption (ut ∼ N (0, σ2) is required in order to conduct single or joint
hypothesis tests about the model parameters. One of the most commonly
applied tests for normality is the Bera-Jarque (BJ) test. BJ uses the
property of a normally distributed random variable that the entire
distribution is characterized by the first two moments - the mean and the

61
variance Brooks (2008). In case of this study, the researcher used BJ
normality test to test the null hypothesis of normally distributed errors
assumptions.
As shown in figure 4.2 since, the histogram is bell-shaped and the Bera-
Jarque statistic is not significant. This means that the p-value given at the
bottom of the normality test screen should be bigger than 0.05 to not
reject the null of normality at the 5% level so, the residuals are normally
distributed in this study, concluded that there is no the problem of
normality on ROA model (see figure 1).
Figure 1 : Normality Test for Residual
0
2
4
6
8
10
12
-0.6 -0.4 -0.2 0.0 0.2 0.4 0.6 0.8
Series: Standardized ResidualsSample 2006 2015Observations 60
Mean -1.16e-17Median 0.038203Maximum 0.891952Minimum -0.676455Std. Dev. 0.329536Skewness -0.080916Kurtosis 2.918861
Jarque-Bera 0.081933Probability 0.959861
Source: Eviews 9

62
4.3 Descriptive Statistics
Descriptive statistical variables are summarized and presented in table 4.2
which shows the mean value for each variable, as well as minimum and
maximum values, and standard deviation. As shown by the results, for the
six private banks under study, the mean of ROA was 2.86 percent with a
minimum of 0.37 percent and a maximum of 4.02 percent over the time
period covering from 2006 to 2015. That means the most profitable bank
among the banks under study earned 4.02 percent of profit after tax for a
single birr invested in the assets of the firm. On the other hand, the least
profitable bank of the sampled banks earned 0.37 cents of profit after tax
for each birr invested in the assets of the firm. The standard deviation
statistics for ROA was (0.59) which indicates that the profitability variation
between the selected banks was not that much significant.
Looking at explanatory variables, the average capital adequacy ratio is
12.86 percent, which is higher than the National Bank’s Capital Adequacy
requirements of 8percent (Directives No. SBB/50/2011). Theoretically it is
likely that higher capital adequacy ratio means less risky weighted assets
which indicate a better asset quality. Minimum value for Capital Adequacy
is 8.06 percent and maximum value is 19.22 percent indicating that there
is no significant variation among the banks under study with this regard.
Banks often report their ratio of nonperforming loans to total loans as a
measure of the quality of their outstanding loans. The average asset

63
quality the private banks under study stood at 3.7percent which is much
lower than the acceptable ratio set by NBE of 5.0 percent. It implies that
the banks under consideration follow prudent loan granting practices.
The ratio of loans to deposits is used in this study as a measure of
liquidity. The average liquidity of the private banks understudy during the
period covering from 2006 to 2015 was 65.3 percent implying that these
banks have not utilized about 35 percent of their fund for lending purpose.
The main reason for such a high liquidity ratio figure is the credit cap
imposed by National Bank on these banks and the imposition of NBE bill
after the lifting of the cap. The maximum Loan to Deposit ratio during the
started period was 101.6 percent implying that that specific bank lent
more loans that the deposit it collected from customers. The reason for
such an instance is banks do lend from their paid-up capital and this
would lead to rise in deposit to loan ratio.
The average growth rate of real GDP is approximately 10.56 percent during
the period under study. The maximum real GDP growth rate was 11.8
whereas the minimum was 8.7 percent. With regards to Inflation rate, the
country experienced double digit inflation during most of the period under
study. The average inflation rate recorded during the study period is 17.2
percent, the maximum being 36.4 percent and the minimum is 2.8
percent.

64
Real interest rate was negative during most of the period under study. The
high inflation rate that had been persistent during the period was the
main reason for the negative real interest rate recorded. The average real
interest rate was -5.55 percent, the maximum being 9.45 percent and the
minimum is -24.15 percent.
On the other hand, bank size which is measured by logarithm of total
asset has the average figure of 6.86%, the maximum being 6.9 percent and
the minimum is 7.4 percent. Logarithm of total asset has standard
deviation of 0.29 percent which is the least standard deviation figure
implying that the variation among the banks under study is insignificant
with respect to asset size.
The ratio of non-interest expenses to average assets is the ratio that more
frequently used on studies of bank profitability in measuring the
management quality. The descriptive statistics of shows that an average
Expense management for the banks under study stood at 3.13 percent
implying that for a single Birr invested in the assets of the firms those
banks spent Birr 0.031 as non-interest expense (see table 4.2).
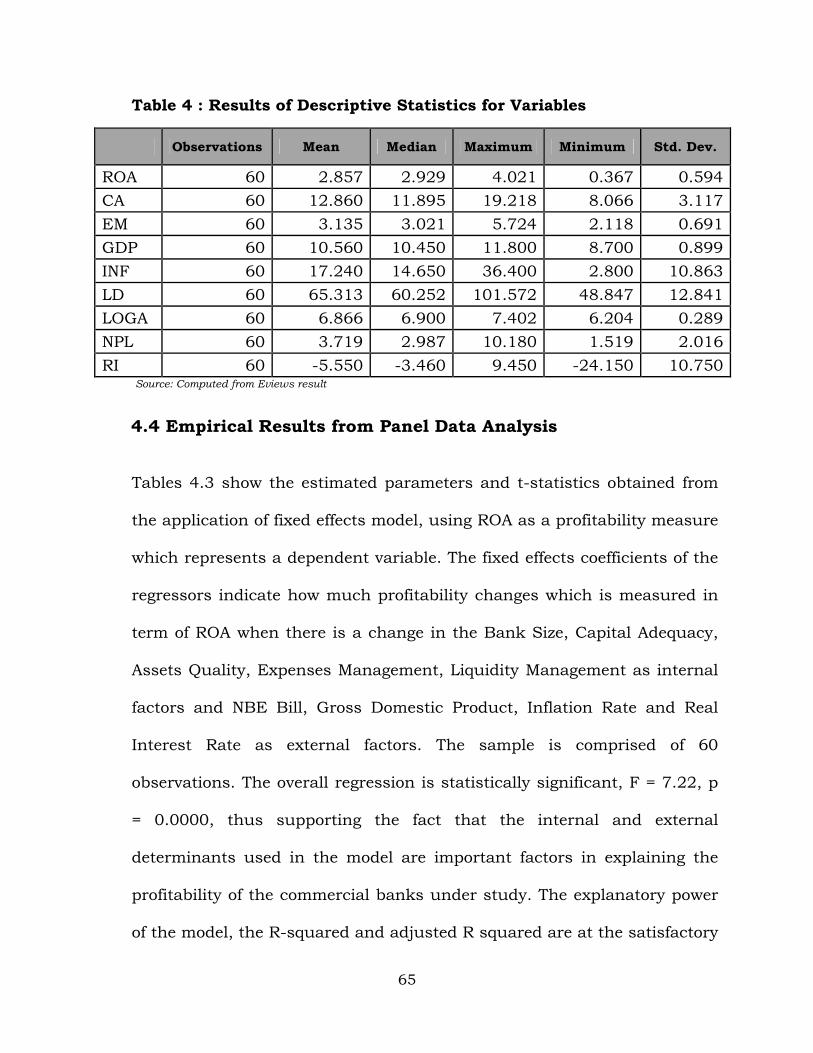
65
Table 4 : Results of Descriptive Statistics for Variables
Observations Mean Median Maximum Minimum Std. Dev.
ROA 60 2.857 2.929 4.021 0.367 0.594
CA 60 12.860 11.895 19.218 8.066 3.117
EM 60 3.135 3.021 5.724 2.118 0.691
GDP 60 10.560 10.450 11.800 8.700 0.899
INF 60 17.240 14.650 36.400 2.800 10.863
LD 60 65.313 60.252 101.572 48.847 12.841
LOGA 60 6.866 6.900 7.402 6.204 0.289
NPL 60 3.719 2.987 10.180 1.519 2.016
RI 60 -5.550 -3.460 9.450 -24.150 10.750 Source: Computed from Eviews result
4.4 Empirical Results from Panel Data Analysis
Tables 4.3 show the estimated parameters and t-statistics obtained from
the application of fixed effects model, using ROA as a profitability measure
which represents a dependent variable. The fixed effects coefficients of the
regressors indicate how much profitability changes which is measured in
term of ROA when there is a change in the Bank Size, Capital Adequacy,
Assets Quality, Expenses Management, Liquidity Management as internal
factors and NBE Bill, Gross Domestic Product, Inflation Rate and Real
Interest Rate as external factors. The sample is comprised of 60
observations. The overall regression is statistically significant, F = 7.22, p
= 0.0000, thus supporting the fact that the internal and external
determinants used in the model are important factors in explaining the
profitability of the commercial banks under study. The explanatory power
of the model, the R-squared and adjusted R squared are at the satisfactory

66
level of 79.2% and 69.3% respectively. The standard error of the regression
is 0.3773. The result of the Durbin Watson Statistics of 1.76 indicates that
there is no autocorrelation among the variables included in the model,
making the model more reliable (see table 4.1).
Among the bank specific variables, capital adequacy (CA) and Bank size
(LogA) have positive effect on the profitability of the private commercial
banks under study. Capital adequacy happens to have a significant
positive impact on profitability whereas, the impact of asset size as
measured by logarithm of total assets is found to be insignificant. Asset
quality as measured by the ratio of non-performing loans, Expense
management and liquidity as measured by loan to deposit ratio have
significant negative impact on profitability. Among external determinant,
with the exception of NBE Bill, the impact of other variable has been found
to be insignificant.

67
Table 5 : Determinants of Return on Assets (ROA)
Variable Coefficient Std. Error t-
Statistic Prob.
C 5.20458 4.177054 1.24599 0.2192
CA 0.55807 0.036904 1.51222 0.0025
EM -0.40227 0.098887 -4.068 0.0002
LOGA 0.22435 0.700991 0.32004 0.7504
NPL -0.01978 0.043499 -0.4548 0.0114
LD -0.00372 0.008929 -0.4166 0.0039
D01 -0.35429 0.38414 -0.4016 0.0099
GDP 0.07159 0.155039 0.46172 0.6465
INF 0.19107 0.196954 0.97014 0.3372
RI 0.19533 0.196534 0.99385 0.3256
Effects Specification
Cross-section fixed (dummy variables)
R-squared 0.792161 Mean dependent var 2.85715
Adjusted R-squared 0.696389 S.D. dependent var 0.69394
S.E. of regression 0.377331 Akaike info criterion 1.10093
Sum squared resid 6.407033 Schwarz criterion 1.62452
Log likelihood -18.02786 Hannan-Quinn criter. 1.30573
F-statistic 7.227158 Durbin-Watson stat 1.76397
Prob(F-statistic) 0.000000
Source: Eviews 9

68
4.5 Analysis and Discussions
In this section the result of the regression analysis will be discussed in
light of the specific research hypotheses made and theoretical framework.
Capital Adequacy: The coefficient of capital adequacy is positive and
highly significant, reflecting the sound financial condition of the banks
under study. A bank with a sound capital adequacy is in the better
position to use better banking technologies which results in high efficiency
and thus achieving higher profitability. As Athanasoglou et al. (2005)
argue that, a bank with a sound capital position is able to pursue
business opportunities more effectively and has more time and flexibility
to deal with problems arising from unexpected losses, thus achieving
increased profitability. This result stands in line with the empirical
evidence of Dietrich and Wanzenrid (2009), Bourke (1989), DemirgucKunt
and Huizinga (1999), Goddard et al. (2004), Pasiouras and Kosmidou
(2007), Amdemikael (2012), Habtamu (2012) and Samuel (2015).
Bank Size: In most finance literature, total assets of the banks are
used as a proxy for bank size. Bank size is represented by natural
logarithm of total asset (log A). In the hypothesis the researcher expects
either negative or positive relationship between asset size and profitability.
The result of regression analysis shows that LogA is found to be positively
related with profitability of the private commercial banks under study and

69
the impact is found to be insignificant. (Vernon, 1971) was among the first
few researchers who found the direct relationship between the banks size
and profitability and according to him larger banks have high profitability.
The implication is that size of the bank is also the result of administration
policy and can have a positive impact on profitability; but that cannot
grantee the excess profit.
Be Berger et al. (1987), Birhanu (2012) and Samuel (2015) on the other
hand found out a negative relationship between the bank size and return
on assets. The impact of bank size on its performance is different as
explored in a study conducted by Goddard et al. (2004) from 1992-1998 of
Europe it shows mix association and relationship among size and
profitability.
Empirical study conducted by Amdemikael (2012) and Habtamu (2012)
shows that bank size has statistically significant and positive relationship
with banks profitability.
Expense Management: Expenses Management which is measured by
the ratio of non-interest expenses to average assets appears to be an
important determinant of banks’ profitability for the private commercial
banks under study. This variable has negative relationship with banks’
profitability and the impact is found to be statistically highly significant
which meets the expectation of this study. Operation cost control is a
prerequisite for an efficient and higher profitability of a bank. Thus cost

70
control management is very crucial for improved profitability of private
banks in Ethiopia. This result, which stands in line with the results of
Dietrich and Wanzenrid (2009) clearly show that, the more efficient a
bank, the higher is its profitability. Athanasoglou et al. (2008), clearly
shows that efficient cost management is a prerequisite for improved
profitability of a bank.
Asset Quality: The assets quality which is measured by non-
performing loan to total loan ratio (NPL) is found to have a significant
negative impact on banks’ profitability. Higher level of nonperforming
loans means higher credit risk and poor asset quality management in the
banks. It reduces interest income and increases provisioning costs, thus
decreasing profits of a bank. Banks tend to be more profitable when they
are able to undertake more lending activities. High provision is needed for
non-performing loan in Ethiopia and this would have a significant negative
impact on profitability.
This result is consistent with the empirical evidence of Athanasoglou et al.
(2008) observed that the loan-loss provisions to loans ratio (credit risk) is
negatively and significantly related to banks’ profitability.
Liquidity: Liquidity management which is measured by the ratio of
loans to deposits is found to have a negative relationship with banks’
profitability and the impact is statistically highly significant. Higher
liquidity implies that banks held high amount of deposits without

71
redirecting them for lending purpose. This implies that banks are paying
interest on the deposits, but they are not earning interest income on the
deposits by redirecting them for lending purpose. Thus, high liquidity
affects the profitability of banks negatively.
The result found to be consistent with that of Bourke (1989) who found
positive and significant relationship between bank liquidity and
profitability.
NBE Bill: National Bank of Ethiopia has introduced a directive which
requires all private commercial banks in the country to purchase NBE Bill
amounting to 27% of total loan disbursed having a maturity period of 5
years. The interest rate on the bills is 3 percent while the rate of interest
that banks charge when they accept deposits is 5 percent. This literally
meant that banks offered loan for the NBE at a loss of 2 percent. The
result found is consistent with the expectation and a significant negative
relationship has been observed between NBE Bill and profitability.
GDP: The coefficient of growth in GDP variable is positive and
insignificant. This finding agrees with theory and empirical evidence that;
the relationship between GDP trend growth and banks’ profitability could
be pro-cyclical. This would imply that when GDP trend growth is positive,
the effect to bank profitability is positive and when GDP trend growth is
negative, the effect on profitability is negative. An important finding from
this study is that, in recent years, economy experienced positive economic

72
growth that could have impacted positively on banks’ profitability. The
positive impact in GDP to banks’ profitability could be due the following
reasons. Bank credit could increase during boom period since such
periods are normally associated with lower risk. Insignificant positive effect
of GDP is supported by researches of (Athanasoglou and Staikouras, 2006;
Demirguc-Kunt and Huizinga, 1999, Flamini, et al 2009; Naceur, 2003).
Inflation: inflation is one of the Macro Economic determinants used by
the researcher. The coefficient of Inflation variable is positive but
insignificant on bank profitability. It implies that inflation is not significant
factor in affecting profitability of private commercial banks in Ethiopia.
The impact of inflation on bank income or profit depends on whether
banks running cost growing higher than inflation rate. The result is found
to be consistent with empirical studies conducted by Gul et.al (2011) and
Jiang et al. (2003) who found positive relationship between inflation and
profitability.
Real Interest Rate: For real interest rate variable, the coefficient is
positive but insignificant which implies that the effect of real interest rate
on profitability of private commercial banks under study is not significant.
The insignificant positive relationship of interest rate with banks’
profitability is in line with previous studies such as Aburime, 2008;
Athanasoglou, Brissimis and Delis, 2005: Demirgüç-Kunt & Detragiache,
1998; Demirguc-Kunt and Huizinga, 1999; Staikouras and Wood, 2004.

73
Chapter 5
5. Conclusion and Recommendation
Banking sector is the backbone of any economy and plays its important
role in the economic development of a country. Mobilization of the national
savings to the productive sectors is possible only with the help of
commercial banks that augments the economic growth rate of a country.
In Ethiopia, the liberalization of the banking industry in 1990s has created
a conducive environment for the emergence of private commercial banks.
At present, there are three government owned banks and sixteen privately
owned banks in Ethiopia. The banking sector of the country is not well
developed even with the standard of Sub Saharan countries. Card Banking
Service does have a history of less than a decade. Most of the banks do not
provide online banking services till 2012. However, currently there is stiff
competition among these banks and they are trying to persuade customers
by providing technology based products, by expanding their branch
network to serve customers at door step, by providing banking product
that targets specific section of the population (like interest free banking),
etc. This Competition is a continuous driver for the participants in the
industry to strive for best practices and up to date technology to improve
their efficiency and to gain customer satisfaction. All these factors are
being translated in to increased business and higher profitability.

74
In a developing country like Ethiopia a well-functioning broad based and
stable financial system is a pre-requisite to support the much needed
economic development and growth. Owing to its vital role in the economy it
is important to regularly measure banking sector’s performance. In order
to measure the performance of banking sector its profitability is used, as it
is the single most important indicator of the financial health and
sustainability in long run. A profitable banking sector is more likely to
withstand a financial and economic distress like recent global financial
crises of 2008 (Ani et al., 2012).
5.1 Conclusions
It is generally agreed that a strong and efficiency of banking system is
important for sustainable economic growth. This study investigates the
effect of bank specific and macroeconomic factors on banks’ profitability
on profitability of private commercial banks in Ethiopia. The determinants
of banks’ profitability used in this study were bank size, capital adequacy,
assets quality, expenses management and liquidity management as bank
specific factors and NBE Bill, GDP, Inflation rate and real interest rate as
macroeconomic factors. Some theoretical and empirical reviews were
employed to support the relationship between banks’ profitability and
determinants of banks’ profitability. The econometric model of fixed effects
regression method was used in this study, using a panel data of 6 banks
in Ethiopia for period from 2006 to 2015.

75
The followings conclusions have been drawn from the result of empirical
findings;
The coefficient of capital adequacy is positive and highly
significant, reflecting the sound financial condition of the banks
under study. A bank with a sound capital adequacy is in the better
position to use better banking technologies which results in high
efficiency and thus achieving higher profitability.
Bank size is found to be positively related with profitability of the
private commercial banks under study and the impact is found to
be insignificant. The implication is that size of the bank is also the
result of administration policy and can have a positive impact on
profitability; but that cannot grantee the excess profit.
Expenses Management has negative relationship with banks’
profitability and statistically highly significant which meets the
expectation of this study. Operation cost control is a prerequisite
for an efficient and higher profitability of a bank and it is very
crucial for improved profitability of private banks in Ethiopia.
The assets quality which is measured by non-performing loan to
total loan ratio (NPL) is found to have a significant negative impact
on banks’ profitability. Banks tend to be more profitable when they
are able to undertake more lending activities. High provision is

76
needed for non-performing loan in Ethiopia and this would have a
significant negative impact on profitability.
Liquidity management which is measured by the ratio of loans to
deposits is found to have negative and statistically highly
significant effects on banks’ profitability. Higher liquidity implies
that banks held high amount of deposits without redirecting them
for lending purpose. This implies that banks are paying interest on
the deposits, but they are not earning interest income on the
deposits by redirecting them for lending purpose. Thus, high
liquidity affects the profitability of banks negatively.
NBE’s directive which requires all private commercial banks in the
country to purchase NBE Bill amounting to 27% of total loan
disbursed is having a negative and a significant impact on
profitability of private commercial banks under study. The interest
rate on the bills is 3 percent while the rate of interest that banks
charge when they accept deposits is 5 percent. This literally meant
that banks offered loan for the NBE at a loss of 2 percent. The
result found is consistent with the expectation and a significant
negative relationship has been observed between NBE Bill and
profitability.
The coefficient of growth in GDP variable is positive and
insignificant. This finding agrees with theory and empirical
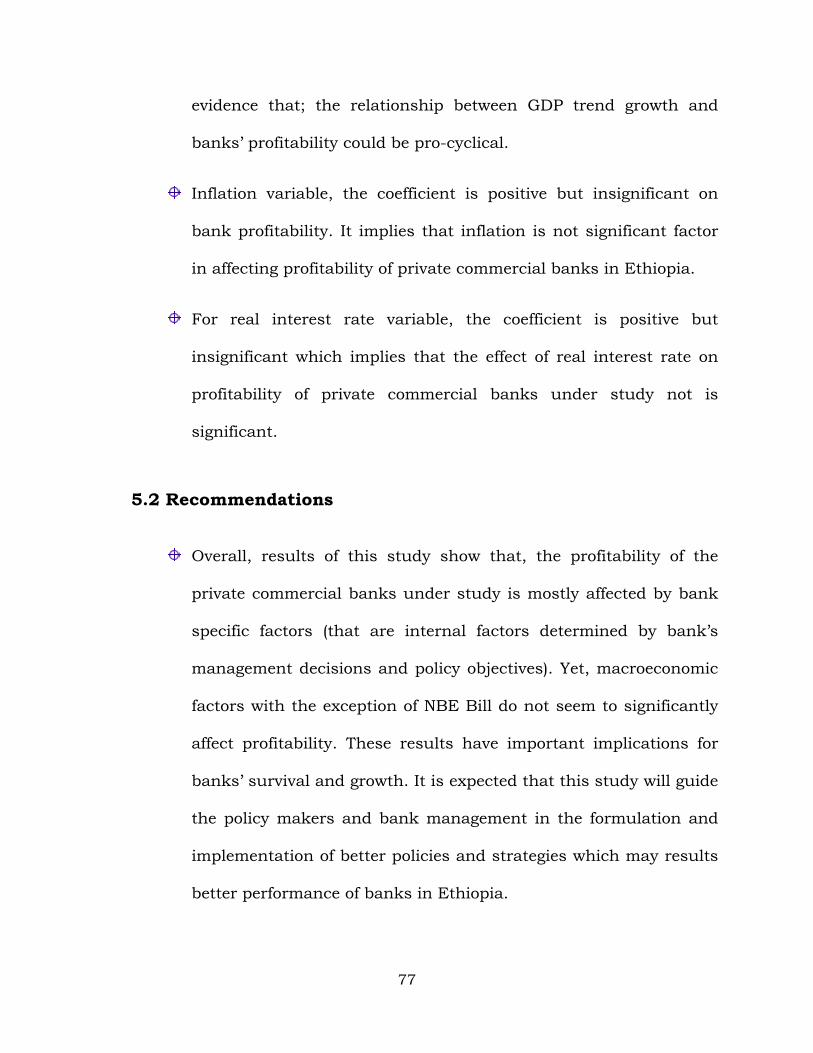
77
evidence that; the relationship between GDP trend growth and
banks’ profitability could be pro-cyclical.
Inflation variable, the coefficient is positive but insignificant on
bank profitability. It implies that inflation is not significant factor
in affecting profitability of private commercial banks in Ethiopia.
For real interest rate variable, the coefficient is positive but
insignificant which implies that the effect of real interest rate on
profitability of private commercial banks under study not is
significant.
5.2 Recommendations
Overall, results of this study show that, the profitability of the
private commercial banks under study is mostly affected by bank
specific factors (that are internal factors determined by bank’s
management decisions and policy objectives). Yet, macroeconomic
factors with the exception of NBE Bill do not seem to significantly
affect profitability. These results have important implications for
banks’ survival and growth. It is expected that this study will guide
the policy makers and bank management in the formulation and
implementation of better policies and strategies which may results
better performance of banks in Ethiopia.

78
Banks tend to be more profitable when they are able to undertake
more lending activities, yet due to the credit quality of lending
portfolios and the general practice in Ethiopia is a higher level of
provision is needed. Such a high level of provision for non-
performing loans against total loans in fact affects adversely banks’
profitability significantly. Thus, banks should follow a prudent
lending practice while granting loan.
Expense management is found to have a significant impact on
profitability of commercial banks under study. Thus, commercial
banks should strive to minimize controllable expenses. They
should minimize the high branch expansion cost through providing
state-of-the-art banking products which would minimize the need
for customer to visit bank branches. The role of internet banking,
mobile banking and card banking is considerable in this regard.
The banking sector in the country is at an exciting point in its
evolution. The opportunities are immense to enter into new
businesses and new markets, to develop new ways of working, to
improve efficiency and to deliver higher level of customer service.
Thus, private banks need to make service available anywhere
anytime 24/7.
Ethiopia is one of the most under banked country even with in the
standard of Sub-Saharan Africa. This shows there is a huge future
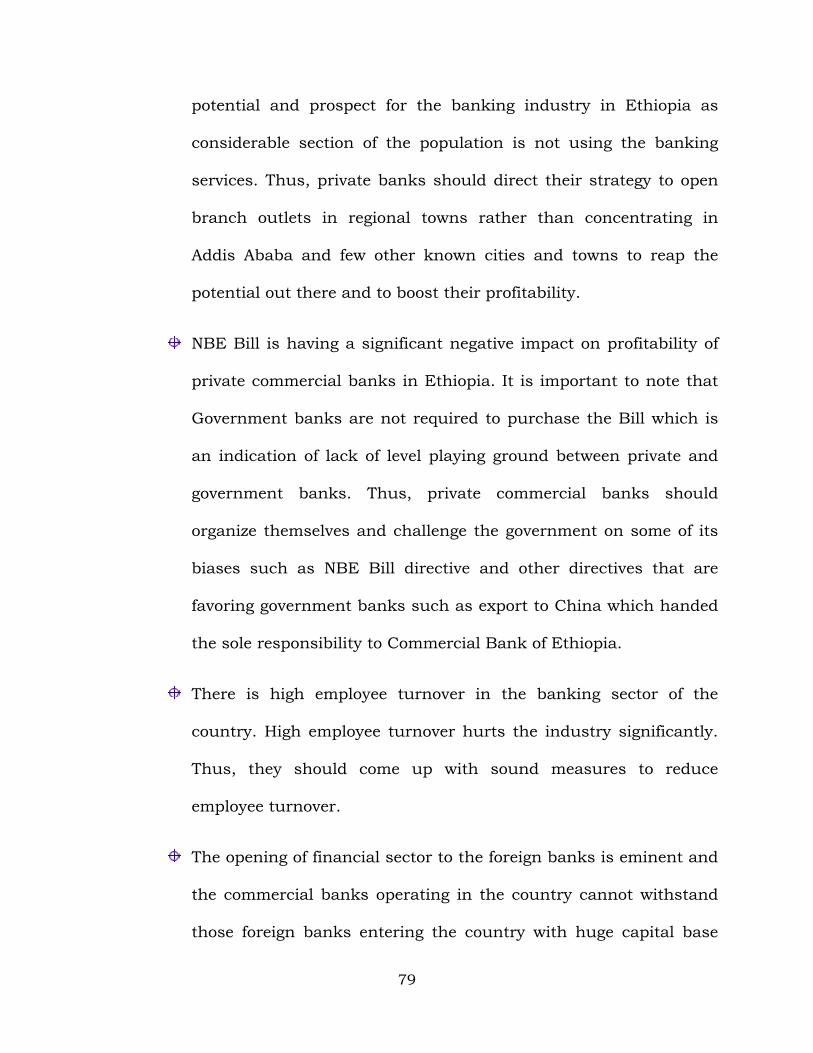
79
potential and prospect for the banking industry in Ethiopia as
considerable section of the population is not using the banking
services. Thus, private banks should direct their strategy to open
branch outlets in regional towns rather than concentrating in
Addis Ababa and few other known cities and towns to reap the
potential out there and to boost their profitability.
NBE Bill is having a significant negative impact on profitability of
private commercial banks in Ethiopia. It is important to note that
Government banks are not required to purchase the Bill which is
an indication of lack of level playing ground between private and
government banks. Thus, private commercial banks should
organize themselves and challenge the government on some of its
biases such as NBE Bill directive and other directives that are
favoring government banks such as export to China which handed
the sole responsibility to Commercial Bank of Ethiopia.
There is high employee turnover in the banking sector of the
country. High employee turnover hurts the industry significantly.
Thus, they should come up with sound measures to reduce
employee turnover.
The opening of financial sector to the foreign banks is eminent and
the commercial banks operating in the country cannot withstand
those foreign banks entering the country with huge capital base

80
and advanced technology and managerial skill. Thus, private
banks should devise a sound strategy to withstand the upcoming
eminent treat from foreign banks. They can raise huge capital base
from the public or they can strengthen their capital base through
merger.
For future research, this study can be extended to cover longer time
periods. Unbalanced panel data can be used to incorporate the banks
which are recently established. Other econometric techniques can be
applied to verify the relationship. More macroeconomic factors such as
exchange rate, imports, exports, tax rates and income level can be focused
on. Moreover, researcher shall conduct studies on the effect merger of
private banks on their performances.

81
References
Abreu, M., & Mendes, V. (2001). Commercial bank interest margins and profitability:
evidence for some EU countries.
Adhikary B.K,“ Nonperforming Loans in the Banking Sector of Bangladesh: Realities
and Challenges” BIBM, 2006
Akhavein, J., Berger, A. and D. Humphrey (1997). “The effects of megamergers on
efficiency and prices: Evidence from a bank profit function.” Finance and Economic
Discussion Series No. 9, Board of Governors of the Federal Reserve System,
Washington, D.C.
Amdemikael 2012, Factors affecting profitability: an empirical study on Ethiopian
banking industry, MSc project paper, Addis Ababa University
Ani, W. U.1, Ugwunta, D. O., Ezeudu, I. J. and Ugwuanyi, G. O. (2012), An empirical
assessment of the determinants of bank profitability in Nigeria: Bank characteristics
panel evidence, ‘’Journal of Accounting and Taxation’’ Vol. 4(3), pp. 38-43
Athanasoglou, P.P., Brissimis, S.N. and M.D. Delis (2005). “Bank-specific industry-
specific and macroeconomics determinants of bank profitability.” Bank of Greece
Working Paper 25, June
Athanasoglou, P. P., Delis, M. D. and Staikouras, C. K. (2006) “Determinants of Bank
Profitability in the South Eastern European Region” .Journal of Financial Decision
Making, Vol. 2, pp. 1-17
Belayneh (2011), determinants of commercial banks profitability: an empirical review of
Ethiopian commercial banks, MSc project paper, Addis Ababa University
Berger, S. A., F. R. Førsund, L. Hjalmarsson and M. Suominen (1993). 'Banking
efficiency in the Nordic countries.' Journal of Banking and Finance17 (2-3): 371-388.
Berger, A., Hanweck, G. and D. Humphrey (1987). “Competitive viability in banking:
Scale, scope and product mix economies.” Journal of Monetary Economics 20, 501-520

82
Berger, Allen N., and Timothy H. Hannan. 1998. “The Efficiency Cost of Market Power
in the Banking Industry: A Test of the ‘Quiet Life’ and Related Hypotheses.” Review of
Economics and Statistics 80: 454-465.
Berger, A. N. (1995) “The Relationship between Capital and Earnings in Banking”
Journal of Money, Credit and Banking, Vol. 27(2), pp.432-456
Birhanu 2012, determinants of commercial banks profitability: empirical evidence from
the commercial banks of Ethiopia, MSc project paper, Addis Ababa University
Bourke, P. (1989) “Concentration and Other Determinants of Bank Profitability in
Europe, North America and Australia” Journal of Banking and Finance, Vol.13 pp. 65-
79
Boyd, J. and D. Runkle (1993). “Size and performance of banking firms: Testing the
predictions of theory.” Journal of Monetary Economics 31, 47-67
Brooks C 2008,Introductory Econometrics for Finance, 2nd edn, Cambridge University
Press, New York
Damena, 2011, Determinants of commercial banks profitability: an empirical study on
Ethiopian commercial banks, MSc project paper, Addis Ababa University.
Devinaga, R. (2010). Theoretical Framework of Profitability as Applied to Commercial
Bank in Malaysia. European Journal of Economics, Finance and Administrative Sciences,
Multimedia University, Faculty of Business and Law, Melaka, Malaysia.
Demirgüç-Kunt, A., & Detragiache, E. (1998) “The Determinants of Banking Crises:
Evidence from Developed and Developing Countries” International Monetary Fund, Vol.
45(1), pp.81-109
Demerguc-KuntA& Huizinga H, 1999, Determinants of commercial bank interest
margins & profitability: some international evidence, World Bank Economic Review, vol.
13, pp. 379-408
Demirguc-Kunt, A. and H. Huizinga (2000). “Financial structure and bank profitability.”
World Bank Mimeo.

83
Dietrich, A. & Wanzenried, G. (2009) “Determinants of Bank Profitability before and
During the Crisis: Evidence from Switzerland”. Journal of International Financial
Markets, Institutions and Money, Vol.21 (3), pp. 307-327
Dietrich, A. & Wanzenreid, G. (2010). Determinants of Bank Profitability Before and
During the Crisis: Evidence from Switzerland
Driver, R. (2008). Public attitudes to inflation and interest rates.
Flamini, V. McDonald, C. A., and Schumacher, L B. (2009) “The determinants of
commercial bank profitability in Sub-Saharan Africa” IMF Working Papers (9), pp.1-30
Jiang G., Tang N., Law E., Sze A., „The profitability of the banking sector in Hong
Kong”, Hong Kong Monetary Authority Quarterly Bulletin, 2003
Ghana Banking Survey, Harnessing the SME Potential, 2013, pp. 4-50
Goddard, J., Molyneux, P., & Wilson, J. O. (2004) “Dynamics of Growth and Profitability
in Banking “Journal of Money, Credit and Banking, Vol. 36(6), pp.1069-1090.
Goldberg, L.G. and Anoop R. (1996). The Structure-performance Relationship for
European Banking. Journal of Banking & Finance, Vol.20, No.4, pp. 45-71.
Grigorian, D. A. and V. Manole (2006). 'Determinants of commercial bank performance
in transition: an application of data envelopment analysis.' Comparative Economic
Studies 48 (3): 497-522.
Gujarat, DN (2004), Basic Econometric, 4th edn, McGraw–Hill, USA.
Gul, S., Faiza, I., Khalid, Z. 2011, Factors Affecting Bank Profitability in Pakistan. The
Romanian Economic Journal, 2(3), pp 6-9.
Guru B J, Staunton and Balashanmugam 2002, Determinants of commercial bank
profitability in Malaysia.University Multimedia working papers, pp. 19 – 27.
Habtamu 2012, determinants of bank profitability: an empirical study on Ethiopian
private commercial banks, MSc project paper, Addis Ababa University.
Hanson, J., Rocha, R. (1986.). High interest rates, spreads and the cost of
intermediation: Two studies. World Bank Industry and Finance Series 18.

84
Hanweck, G. A., & Kilcollin, T. E. (1984). Bank profitability and interest rate risk.
Journal of Economics and Business, 36(1), 77-84.
Heggestad, A. A. (1977). Market structure, risk and profitability in commercial banking.
Journal of Finance, 1207-1216.
Ho, T. S. Y., & Saunders, A. (1981). The determinants of bank interest margins: theory
and empirical evidence. Journal of Financial and Quantitative Analysis, 16(4), 581-600.
Hoffmann, P., „Determinants of the profitability of the US banking industry”,
International Journal of business and social science, 2011, vol 2, no.22
Hoggarth, G. A., Milne, A., & Wood, G. E. (1998). Alternative routes to banking stability:
A comparison of UK and German banking systems. Financial Stability Review, 5, 55-68.
Jiang, G., Tang, N., Law, E., & Sze, A. (2003a). Determinants of bank profitability in
Hong Kong. HKMA Research Memorandums”, HKMA Research Memorandums. Jiang,
G., Tang, N., Law, E., & Sze, A. (2003b). The Profitability of the Banking Sector in Hong
Kong. Hong Kong Monetary Authority Quarterly Bulletin, 5-14.
Kapoor, G. P. (2004). Commercial BankingAP.H. Publishing Corporation, New Delhi.
Karim, M. Z. K, Chan, S. and Hassan, S. (2010). Bank Efficiency and Non-Performing
Loans: Evidence from Malaysia and Singapore, Prague Economic Papers, 2, 118-132.
Kosmidou, K. (2006). The Determinants of Banks’ Profits in Greece during the Period of
EU Financial Integration.
Kindleberger, C. Manias, panics and crashes: a history of financial crisis (1978): Basic
Books, New York.
Mishkin Frederic, S., A. Stanley and G. Eakins, 2009. Financial markets and
institutions. 6th Edn., Boston: Pearson PrenticeHall, xxxix, 675. ISBN: 9780321-37421
Molyneux, P. & Thornton, J. (1992) Determinants of European Bank Profitability: A
Note. Journal of Banking and Finance, Vol.16, pp.1173–1178.
Naceur, S. B. (2003). The determinants of the Tunisian banking industry profitability:
Panel evidence. Paper retrieved on April, 8, 2005.

85
Naceur, S. B., & Goaied, M. (2001). The determinants of the Tunisian deposit banks'
performance. Applied Financial Economics, 11(3), 317-319.
Naceur, S. B. and Goaied, M. (2008) “The Determinants of Commercial Bank Interest
Margin and Profitability: Evidence from Tunisia”. Frontiers in Finance and Economics,
Vol.5 (1),pp. 106-130.
National Bank of Ethiopia (2015). Annual report, Available at http://www.nbe.gov.et
National Bank of Ethiopia Licensing and Supervision of Banking Business Proclamation
No. 83/ 1994 and No.84/1994 (1994), Available at http://www.nbe.gov.et
National bank of Ethiopia directive No.SBB/42/2007, No. 45/2008, Available at
http://www.nbe.gov.et
Nawaz, M., Munir, S., Siddiqui, S. A., Afzal, F., Asif, M., and Ateeq, M. (2012). Credit
Risk and the Performance of Nigerian Banks, Interdisciplinary Journal of Contemporary
Research in Business, 4 (7): 51-63.
Pasiouras, F., & Kosmidou, K. (2007). Factors influencing the profitability of domestic
and foreign commercial banks in the European Union. Research in International
Business and Finance, 21(2), 222-237.
Obamuyi, T, M (2013) “Determinants of banks’ profitability in a developing economy:
evidence from Nigeria” Organizations and Markets in Emerging Economies, Vol. 4, No.
2(8)
Olweny, T. & Shipho, T. M. (2011)” Effects of Banking Sectoral Factors on the
Profitability of Commercial Banks in Kenya”, Economics and Finance Review, Vol.1 (5),
01-30.
Revell, J. (1979). Inflation and financial institutions. Financial Times, London.
Perry, P. (1992), Do Banks Gain or Lose From Inflation. Journal of Retail Banking, Vol.
14(2), pp.25-30
Samuel (2015), Determinants Of Commercial Banks Profitability: The Case of Ethiopian
Commercial Banks

86
Samuelson, P. A. (1945) “The Effect of Interest Rate Increases on the Banking System”
American Economic Review, Vol.35 pp.16-27.
Saona, P. H. (2011) “Determinants of the Profitability of the US Banking Industry”,
International Journal of Business and Social Science, Vol.2 (22), pp.255 – 269.
Shoaib Nisar Wang Susheng Jaleel Ahmed Peng Ke (2015), Determinants of Bank’s
Profitability in Pakistan: A Latest Panel Data Evidence “International Journal of
Economics, Commerce and Management”, Vol. 3(4), pp. 1
Smirlock, M. (1985), “Evidence on the (Non) Relationship between concentration and
profitability in Banking”. Journal of Money Credit and Banking, Vol.17 pp. 69-83
Staikouras, C., & Wood, G. (2003). The determinants of bank profitability in Europe.
Staikouras, C. K. & Wood, G. E. (2004), “The Determinants of European bank
Profitability”, International Business and Economic Research Journal, Vol.3 (6) pp.57–68.
Steinherr, A., & Huveneers, C. (1994). On the performance of differently regulated
financial institutions: Some empirical evidence. Journal of banking & finance, 18(2),
271-306.
Tesfaye B. Lellisa (2014), “The Impact of Policy Measures on Ethiopian Private Banks
Performance: the Case of Government Bill Purchase” European Journal of Business and
Management, Vol.6 (27), pp. 124
Vernon, J. R. (1971). Separation of ownership and control and profit rates, the evidence
from banking: Comment. Journal of Financial and Quantitative Analysis, 6(01), 615-625.
Weber, P. a. (2005).
Valentina Flamini, Calvin McDonald,and Liliana Schumacher (2009), The Determinants
of Commercial Bank Profitability in Sub-Saharan Africa, IMF Working Paper, African
Department
Wall, L.D., 1985. Why are some banks more profitable than others? Journal of Bank
Research, 15(4): 240-256.
Zimmerman, 1996. Factors influencing community bank performance in California,
Economic Review, Federal Reserve Bank of San Francisco: 26-40.

87
Appendices
Appendix –I: Tests for the Heteroskedasticity
Heteroskedasticity Test: White
F-statistic 2.474837 Prob. F(49,10) 0.0617
Obs*R-squared 55.42916 Prob. Chi-Square(49) 0.2452
Scaled explained SS 34.54657 Prob. Chi-Square(49) 0.9413
Test Equation:
Dependent Variable: RESID^2
Method: Least Squares
Date: 04/05/16 Time: 17:04
Sample: 1 60 Included observations: 60 Collinear test regressors dropped from specification
Variable Coefficient Std. Error t-Statistic Prob.
C -269.2151 230.6676 -1.167113 0.2702
CA^2 0.016552 0.009088 1.821249 0.0986
CA*D01 -0.177803 0.136607 -1.301572 0.2222
CA*EM -0.020623 0.044282 -0.465716 0.6514
CA*GDP 0.063898 0.075269 0.848935 0.4158
CA*INF 0.218806 0.160564 1.362739 0.2029
CA*LD 0.013191 0.006342 2.079935 0.0642
CA*LOGA 0.656583 0.240852 2.726086 0.0213
CA*NPL -0.034932 0.027748 -1.258917 0.2367
CA*RI 0.215954 0.158136 1.365621 0.202
CA -8.800914 3.462278 -2.541943 0.0293
D01^2 94.64516 45.14161 2.096628 0.0624
D01*EM 0.978718 0.77185 1.268017 0.2335
D01*GDP -8.346393 3.900226 -2.139977 0.058
D01*INF 0.008407 0.171427 0.04904 0.9619
D01*LD -0.066685 0.103733 -0.642849 0.5348
D01*LOGA -0.138695 2.963714 -0.046798 0.9636
D01*NPL -0.17929 0.238613 -0.751385 0.4697
EM^2 -0.159438 0.115181 -1.384239 0.1964
EM*GDP 0.385431 0.400787 0.961686 0.3589

88
EM*INF 0.00503 0.556823 0.009033 0.993
EM*LD -0.010785 0.030705 -0.351241 0.7327
EM*LOGA -0.914435 1.063178 -0.860096 0.4099
EM*NPL 0.064485 0.088627 0.727605 0.4835
EM*RI -0.012952 0.55171 -0.023476 0.9817
EM 3.494728 13.15224 0.265714 0.7959
GDP^2 -2.774768 1.203212 -2.306134 0.0438
GDP*INF -0.666868 1.011623 -0.659207 0.5247
GDP*LD -0.046419 0.058821 -0.789158 0.4483
GDP*LOGA 0.684989 1.064119 0.643715 0.5342
GDP*NPL -0.016613 0.114358 -0.145272 0.8874
GDP*RI -0.709392 0.991912 -0.715176 0.4909
GDP 67.66477 31.3844 2.156 0.0565
INF^2 -0.088322 0.070103 -1.259896 0.2363
INF*LD -0.164015 0.075524 -2.171686 0.055
INF*LOGA 2.588617 1.559095 1.660333 0.1278
INF*NPL 0.324894 0.157873 2.057946 0.0666
INF*RI -0.101158 0.075644 -1.337286 0.2108
LD^2 -0.002514 0.001723 -1.459119 0.1752
LD*LOGA 0.036795 0.105266 0.349539 0.7339
LD*NPL 0.009059 0.011327 0.799756 0.4424
LD*RI -0.164031 0.074825 -2.192208 0.0531
LD 2.335249 0.970871 2.405313 0.037
LOGA^2 0.045961 3.844876 0.011954 0.9907
LOGA*NPL -0.203101 0.691921 -0.293533 0.7751
LOGA*RI 2.536126 1.557971 1.627839 0.1346
LOGA -44.60341 55.83519 -0.798841 0.4429
NPL^2 -0.037167 0.022172 -1.676296 0.1246
NPL*RI 0.328909 0.158015 2.081514 0.064
NPL -2.141791 5.927598 -0.361325 0.7254
R-squared 0.923819 Mean dependent var 0.16648
Adjusted R-squared 0.550534 S.D. dependent var 0.22492
S.E. of regression 0.150793 Akaike info criterion -1.0709
Sum squared resid 0.227386 Schwarz criterion 0.67438
Log likelihood 82.12715 Hannan-Quinn criter. -0.3882
F-statistic 2.474837 Durbin-Watson stat 2.18091
Prob(F-statistic) 0.061708
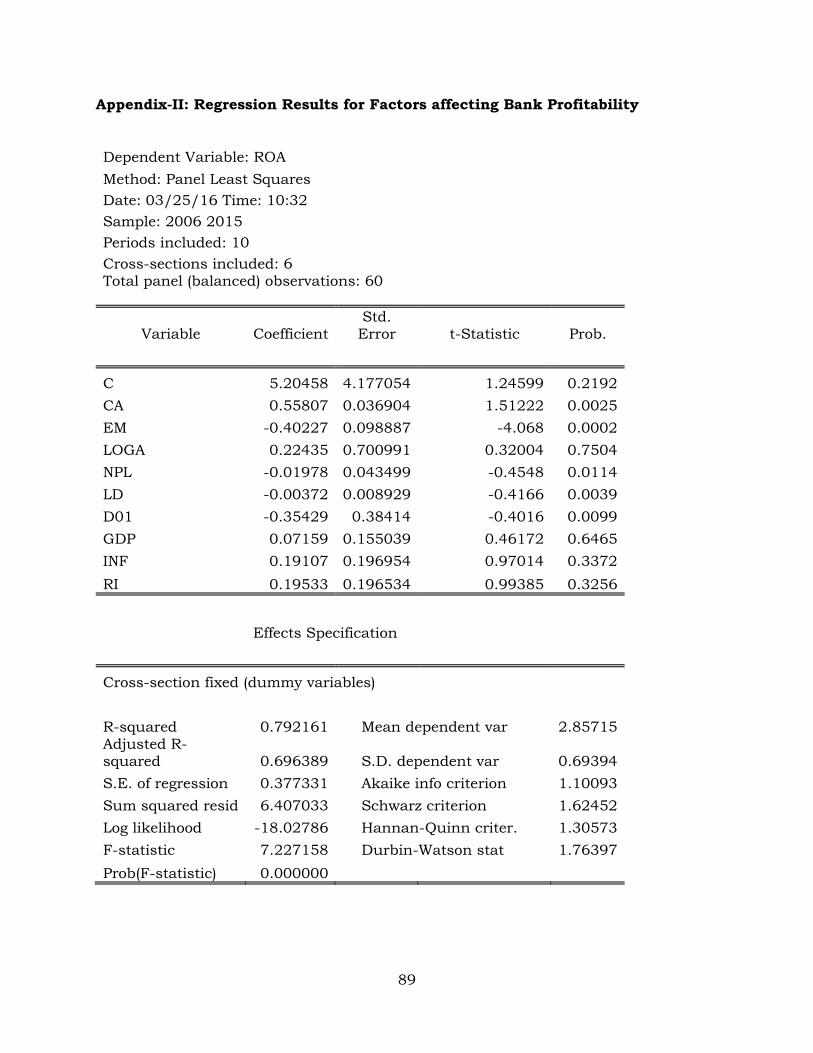
89
Appendix-II: Regression Results for Factors affecting Bank Profitability
Dependent Variable: ROA
Method: Panel Least Squares
Date: 03/25/16 Time: 10:32
Sample: 2006 2015
Periods included: 10
Cross-sections included: 6 Total panel (balanced) observations: 60
Variable Coefficient Std. Error t-Statistic Prob.
C 5.20458 4.177054 1.24599 0.2192
CA 0.55807 0.036904 1.51222 0.0025
EM -0.40227 0.098887 -4.068 0.0002
LOGA 0.22435 0.700991 0.32004 0.7504
NPL -0.01978 0.043499 -0.4548 0.0114
LD -0.00372 0.008929 -0.4166 0.0039
D01 -0.35429 0.38414 -0.4016 0.0099
GDP 0.07159 0.155039 0.46172 0.6465
INF 0.19107 0.196954 0.97014 0.3372
RI 0.19533 0.196534 0.99385 0.3256
Effects Specification
Cross-section fixed (dummy variables)
R-squared 0.792161 Mean dependent var 2.85715 Adjusted R-squared 0.696389 S.D. dependent var 0.69394
S.E. of regression 0.377331 Akaike info criterion 1.10093
Sum squared resid 6.407033 Schwarz criterion 1.62452
Log likelihood -18.02786 Hannan-Quinn criter. 1.30573
F-statistic 7.227158 Durbin-Watson stat 1.76397
Prob(F-statistic) 0.000000