Embed Size (px)
Citation preview

PT Indika Energy Tbk.
July 2021
INDIKA ENERGY GROUP
COMPANY UPDATE

Investors and security holders are cautioned that this communication contains forward-looking statements
and that forward-looking statements are subject to various risks and uncertainties, many of which are difficult
to predict and are generally beyond the control of PT Indika Energy Tbk.
Neither PT Indika Energy Tbk., its affiliates nor any other person assumes responsibility for the accuracy
and completeness of the forward-looking statements in this communication.
This communication does not constitute an offer to sell or the solicitation of an offer to buy any securities in
the United States or any other jurisdiction in which such offer, solicitation or sale would be unlawful prior to
registration or qualification under the securities laws of any such jurisdiction.
Disclaimers

3
Table of Contents
Page #
▪ Indika Energy - Overview 4 - 5
▪ Income Statement Analysis 6 - 9
▪ Highlights – Latest Cash and Debt Position 10 - 11
▪ Proactive Liability Management amid Low Coal Price Environment 12 - 13
▪ Cost Saving and Improvement Initiatives 14 - 16
▪ Operational Performance YTD and Corporate Guidance 2021 17
▪ Coal Price & Sector Development 18 - 22
▪ Our Growth and Diversification Strategy 23 – 24
▪ New Growth Projects, Non-Coal Diversification 25 - 34
▪ ESG Highlights 35 - 40
▪ Appendix 41 – 61

4
Indika Energy is Indonesia’s Leading Integrated and Diversified Company
✓ Integrated energy value chain with portfolio spanning across Indonesia
✓ Well-placed to capture domestic economic growth and global economic
recovery
✓ Provides complementary products and services to domestic and international
customers
✓ Strong operating track-record, with focus on cost control and unlocking
synergies within the Group
✓ Ongoing diversification initiatives such as renewables, digital technologies and
gold mining (target 50% non-coal revenue by 2025)
✓ Strong focus on and commitment to ESG initiatives
✓ Prudent financial management, with established track record in debt and equity
capital markets
(1) As measured by 2019 production according to Wood Mackenzie
Energy Resources1
Indonesia’s 3rd largest coal miner(1)
Coal exploration and production through
flagship Kideco and MUTU
Coal trading (ICI and IETPL)
Energy Services2
Contract mining and E&C services for
the mining sector (Petrosea)
EPC and O&M services in oil & gas and
power generation (Tripatra)
Other Businesses4
Gold development project (Awak Mas,
Nusantara Resources)
Evaluating renewable energy technologies
and opportunities
Digital technology activities (integration of
Group ICT systems)
Energy Infrastructure3
River and sea transportation solutions
(MBSS)
Port and logistics services, as well as
fuel storage (Interport)
Electricity generation (CEP/CEPR)
Green Initiatives
Digital technology

Key Recent Development
(1) FEED refers to Front End Engineering and Design
2017 2018 2019 2020
Apr-2018: Signed a storage
facility Agreement with PT
ExxonMobil Lubricants
Indonesia for 20 years with an
option for a 10-year extension
Mar-2019: Construction
agreement with PT Freeport
Indonesia for multiple
projects at Grasberg
Dec-2017: Increased
stake in Kideco to
91.0% from 46.0%
through acquisition of
45.0% from Samtan
Jun-2020: Revised
mining law passed
Dec-2018: Strategic
investment in ASX-listed
Nusantara Resources,
developing Awak Mas Gold
Project in South Sulawesi
Aug-2020: Acquired
indirect 25% in
Masmindo,
increasing effective
interest in Awak Mas
Gold Project to 45.8%
Sep-2018: Established Xapiens
Oct-2018: Established Zebra X
Digital technology
Apr-2017: 5-year
USD265mn 6.875%
bond (2022 Notes)
Nov-2017: 7-year
USD575mn 5.875%
bond (2024 Notes)
Mar-2020: Contract with
Masmindo to provide
FEED(1) services
Jun-2020: Transfer of
BUMA’s contract mining
volumes to Petrosea began
(completed in Sep-2020)
Ongoing: Actively exploring
opportunities in renewable
energy sources
Green Initiatives
Diversification
initiatives
Aug-2019: USD215mn
partial redemption of
2023 Notes
Jun-2018: Petrosea launched
Minerva project at Tabang
Nov 20: Fuel storage
facility in Kariangau
commenced commercial
operation
Oct/Nov-2020- Issued
USD 675m bonds to
refinance 2023 and
2024 Notes and
funding new projects
Dec 20: Govt appointed
Pantimban Consortium as
operator of Pantimban Port
with 40 years concession
Nov 20: Indika Energy
and IIR obtained ISO
37001 certification for anti
bribery management
system
Dec-2020: wins Gold PROPER
Award, the highest recognition
from Ministry of Environment and
Forestry (KLH) for company with
excellence performance in key
ESG aspects
5

Indika Energy – 6M21 Revenue Contribution
6
4)
Revenue 6M21: US$1,287.9 million Revenue 6M20: US$1,128.9 million
6M21
Coal : 86.3%
Non-Coal : 13.7%
3M20
Coal : 76.4%
Non-Coal : 23.6%
Kideco63%
Indika Resources
11%
Petrosea 14%
Tripatra7%
MBSS2%
Interport1%
Others 2%
Kideco55%
Indika Resources
11%
Petrosea 15%
Tripatra16%
MBSS2%
Interport0%
Others 1%

Indika Energy’s Consolidated Income Statement Highlights
7
*) Consolidated EBITDA plus dividends received from associates
**) Core Profit refers to the current year’s profit attributable to the owner of the company, excluding non-operating gains / losses and
related taxes (amortization of intangible assets, impairment of assets, fair value changes on contingent consideration obligation, and
gain from a bargain purchase).
Summary P&LQuarter Data Year To Date
2Q21 2Q20 YoY 1Q21 QoQ 6M21 6M20 YTD YoY
Revenues 705.7 487.4 44.8% 582.2 21.2% 1,287.9 1,128.9 14.1%
COGS (532.6) (418.0) 27.4% (461.2) 15.5% (993.9) (954.6) 4.1%
Gross Profit 173.0 69.4 149.5% 120.9 43.1% 294.0 174.3 68.7%
SG&A Expenses (38.5) (40.5) 3.5% (36.1) 6.6% (74.6) (76.7) -2.8%
Operating Profit 134.6 28.9 365.9% 84.9 58.6% 219.4 97.6 124.9%
Pre tax Profit 78.0 6.0 1202.7% 23.8 228.2% 101.7 (10.8) 1040.0%
Adjusted EBITDA *) 172.4 72.2 138.6% 134.2 28.5% 306.6 174.5 75.7%
Income Tax (45.9) (4.0) -1044.6% (26.9) 70.6% (72.9) (4.9) 1383.0%
Core Profit (Loss) 43.3 5.6 666.0% 12.5 245.4% 55.8 6.5 757.3%
Net Profit (Loss) 21.4 (0.9) 2496.5% (9.4) 328.2% 12.0 (21.9) -45.2%
Gross Margin(%) 24.5% 14.2% 20.8% 22.8% 15.4%
EBIT Margin(%) 19.1% 5.9% 14.6% 17.0% 8.6%
Core Profit Margin(%) 6.1% 1.2% 2.2% 4.3% 0.6%
Net Profit Margin(%) 3.0% -0.2% -1.6% 0.9% -1.9%

8
6M21 Business Highlights – Revenue Breakdown
Subsidiaries6M21
(US$ mn)
6M20
(US$ mn)YoY Chg Remarks
Kideco 876.8 663.2 32.2% • ASP ▲ 21.9% (+US$8.7/ton) to US$48.6/ton in 6M21,
• Sales Volume ▲ 8.5% (+1.4MT) to 18.1MT in 6M21
Petrosea 193.3 175.9 9.9%
• Contract mining revenue ▲ US$36.9m to US$140.9m; OB volume : 58.0 mbcm in 6M21 vs 45.8
mbcm in 6M20; Coal getting : 16.0 MT in 6M21 vs 12.7 MT in 6M20
• ENC revenue ▼US$8.8m to US$24.7m, mainly due to lower contribution from Freeport project
• PLSS revenue ▼ US$8.1m to US$6.8m mainly due to completion of Tg Batu and lower activities
in Sorong
Tripatra 95.8 195.8 -51.1%• Lower contribution from Tangguh project (-US$83.5m) to US$85.9m
• Lower revenue from Emily project (US$4.8m for 6M21 vs US$21.7m for 6M20)
• Completion of Vopak project in 2020 (6M20: Vopak = US$1.9m).
Indika Resources 158.5 133.5 18.7%• MUTU’s sales volume ▲ 34.2% (+0.2MT) to 0.9 MT in 6M21 with ASP ▲ 30.4% (+US$19.2 per
ton) to US$86.9 per ton in 6M21
• Coal traded volume ▼ 35.9% to 2.2MT in 6M21
MBSS 33.4 29.0 15.0%• Barging revenue ▲ (+US$2.3m) to US$23.4m in 6M21, volume ▼(-1.3MT) to 12.1MT in 6M21
• Transhipment revenue▲ (+US$2.1m) to US$10.0m, with higher volume (5.2MT in 6M21 vs
3.6MT in 6M20)
Interport 14.5 3.3 335.3%• Interport revenue +335.3% to US$14.5m in 6M21 as its fuel storage has started operation since
Nov 2020 with volume of 7.1kbd in 6M21
Others 29.7 17.2 72.7%
Total Gross Revenue 1,402.0 688.2 15.2%
Elimination (114.0) (87.6) -30.2%
Total Net Revenue 1,287.9 1,128.9 14.1%

9
6M21 Business Highlights- Gross Profit
Subsidiaries6M21
(US$ mn)
6M20
(US$ mn)
YoY
ChangeRemarks
Kideco 240.0 114.1 110.4%- SR declined to 5.1 x in 6M21 from 5.6x in 6M20
- Cash cost ex Royalty ▲ (+US$1.5/ton) from US$27.2/ton in 6M20 to US$28.7/ton in 6M21 on
normalized contractor rate and higher fuel cost
Petrosea 30.0 31.9 -5.8%
- Total gross margin decreased to 15.5% in 6M21 compared to 18.1% in 6M20 due to lower
E&C Margin.
- Contract mining gross profit margin increased to 28.0% in 6M21 compared to 21.7% in 6M20
due to an adjustment in contract mining rate with movement in coal price ( index linked).
- E&C gross profit margin decreased to 20.0% in 6M21 compared to 39.7% in 6M20
Tripatra (20.3) 12.0 -269.2% • Gross loss recognized due to BP Tangguh of US$20.3m in 6M21 vs US$12.0m profit in 6M20
• Gross margin dropped to -21.2% in 6M21 from 6.1% in 6M20.
Indika Resources 34.0 8.1 195.0% • ASP ▲ 30.4% (+US$19.2 per ton) to US$86.9 per ton in 6M21
• Cash cost▲ 0.9% (+US$0.5 /ton) to US$55.6/ton in 6M21
MBSS 5.4 1.5 260.0%- Improved GP margin in Barging : 16.0% in 6M21 vs 3.3% in 6M20 due to higher volume in
spot segment with higher barging rate
- Improved GP margin in FC : 32.9% in 6M21 vs 10.1% in 6M20
Interport 4.4 0.9 388.9%- Interport fuel storage has started operation since Nov 2020 with volume of 7.1kbd in 6M21.
Others 3.0 2.7 11.1%
Elimination (2.5) (0.3) 733.3%
Total Gross Profit294.0 174.3 70.5%

614.5
142.11,250.0
332.1
31.2
32.9
0.0
200.0
400.0
600.0
800.0
1000.0
1200.0
1400.0
1600.0
1800.0
CASH DEBT
Cash Other Fin. Assets Bonds 2) Bank Loans 3) Leases 4) Other loans 5)
Indika Energy – Strong Cash Position
10
756.61)
1,646.2
US$ million
Cash and Debt Breakdown as of 30 June 2021
4)
1) PTRO: US$107.5m, MBSS: US$34.3m, Tripatra: US$44.8m, Kideco: US$215.8m, IIR: US$55.0m, Interport: US$10.6m, HoldCo: US$288.4m
2) US$575mn due 2024 and US$675m due 2025
3) PTRO: US$125.1m, MBSS: US$18.2m, Tripatra: US$19.5m; HoldCo: US$169.4m
4). PTRO US$31.2m
5) Tripatra: US$32.9m

Indika Energy – Sound Balance Sheet
11
Net Debt Ratio Long Dated Debt Maturity Profile
US$ millionUS$ million
Cash Breakdown by Subsidiaries LTM Free Cash Flow
US$ millionUS$ million
337.9 336.9 310.4392.3 354.2
144.4 171.3114.1
187.5 215.8 59.6
81.3
84.7
134.4 107.5 152.5133.6
154.3
42.7 44.8
34.6 4040.3
35.2 34.3
2017 2018 2019 2020 6M21
HoldCo & Others Kideco Petrosea Tripatra MBSS
211.0
323.0
198.4 176.4
261.6
0
50
100
150
200
250
300
350
2017 2018 2019 2020 6M21
133.3 105.8 83.9
648.3 675
0
100
200
300
400
500
600
700
800
2021 2022 2023 2024 2025 2026
2.4
1.1
2.1
3.3
2.2
0.6 0.6
0.9
1.1 1.0
-
0.5
1.0
1.5
2.0
2.5
3.0
3.5
4.0
-
100.0
200.0
300.0
400.0
500.0
600.0
700.0
800.0
900.0
1,000.0
2017 2018 2019 2020 6M21
Net debt Net debt to EBITDA Net debt to Equity

78 102 83 72 45
265 285
575 675
0
100
200
300
400
500
600
700
800
2020 2021 2022 2023 2024 2025 2026
Successful Refinancing to Support Future Growth
12
US$ million
Indika Energy successfully issued global bond of US$675million with 5-year tenor and 8.25% coupon
Sources & Uses
USD Million Sources
Original Issue (16 October 2020) 450
Tap Issue (28 October 2020) 225
Total 675
USD Million Uses
Call Balance 2022s, Including Call
Premium 274
Call Balance 2023s, Including Call
Premium 288
Repayment of principal debt matured in
202125
Diversification, and Transaction
Expenses 88
Total 675
Consolidated Debt Maturity Profile Post Liability Management
Loans & Lease Bonds
• Additional debt to support diversification plan
• Improve liquidity and lengthen maturity profile
• Obtained 85.9% consent from 2024 bondholders to align with new bond covenants.
• Rating agencies maintain debt rating:
Moodys : Ba3 (negative outlook)
Fitch : BB- (negative outlook)

Strengthen Balance Sheet with active liability management
13
Consolidated CAPEX
US$ millionTotal Debt and Total Cash
US$ million
✓ Extending bonds maturity in 2022 & 2023 to 2025
✓ Net debt to EBITDA was 2.2x as of Jun 2021
✓ Cash balance remains strong at USD756.6m as of Jun 2021
✓ Selective capital spending – balancing maintenance capex and
replacement and additional capacity
1,073 1,038 1,026 977
806
1,440 1,476 1,523
1,694 1,646
421 406 411 339 312
729 763 704
792 757
-
200
400
600
800
1,000
1,200
1,400
1,600
1,800
2012 2013 2014 2015 2016 2017 2018 2019 2020 6M21
Total Debt Total Cash
212.5
74.5 68.558.7
21.9
65.6
150.4 156.9
84.2
37.0
0
50
100
150
200
250
2012 2013 2014 2015 2016 2017 2018 2019 2020 6M21

Group-wide Cost Saving and Operational Improvement Initiatives
14
Oil Brent Price
US$/bbl • Minerva Project - a technology-based initiative, using digitalization
and data analysis. Three main areas of improvement:
✓ Fleet management system
✓ Mine planning
✓ Performance management
• The initiative is aimed to increase assets utilisation (e.g fewer fleet
requirement/ unit production), reduce cost (e.g fuel consumption),
and improve efficiency/ productivity.
• More contracts for Petrosea in Kideco and Awak Mas Project
• Expanding existing projects (e.g fuel storage)
Value Creation : Synergy / Integration
73
-
10
20
30
40
50
60
70
80
Jan-1
9
Fe
b-1
9
Mar-
19
Apr-
19
May-1
9
Jun-1
9
Jul-19
Aug-1
9
Sep-1
9
Oct-
19
Nov-1
9
Dec-1
9
Jan-2
0
Fe
b-2
0
Mar-
20
Apr-
20
May-2
0
Jun-2
0
Jul-20
Aug-2
0
Sep-2
0
Oct-
20
Nov-2
0
Dec-2
0
Jan-2
1
Fe
b-2
1
Mar-
21
Apr-
21
May-2
1
Jun-2
1

15
Mine Operation Planning Dashboard (MOPAD)
Mine Operation Control Dashboard (MOCOM)
Fuel Consumption
Energy use management: Optimize mine design
with effective haul distance through real-time mine
planning dashboard (MOPAD) and live planning
(MOCOM) to provide dynamic mine planning for
minimize fuel use and hence emission
Mine Planning Optimization
Fuel consumption: provide real-time monitoring of
Fuel performance with capturing man, machine and
environment parameters. Then integrate with
operator individual performance reward.
Minerva App for monitor Operator individual performance
Realtime Fuel analyzer (Man, machine, and environment)
Digger Productivity
Gain 19% more digger
productivity though Realtime
performance Advance
19%
Truck Productivity
Gain 14% more truck
productivity through Dynamic
dispatch and Road Analyzer
14%
Fuel Ratio Reduction
Reduce 6% of fuel ratio through
Fuel analyzer and Road
Analyzer
6%
Overall reduction in fuel
consumption at project level
15%
Some benefits of technological
application in our operations:
Operational Improvement also reduces carbon emissions

16
Petrosea has been Inducted into WEF's Global Lighthouse Network
Industrial lighthouses are diversifying and digitizing beyond the four walls of the factory
Petrosea is the only local company in Indonesia and Southeast Asia with this status
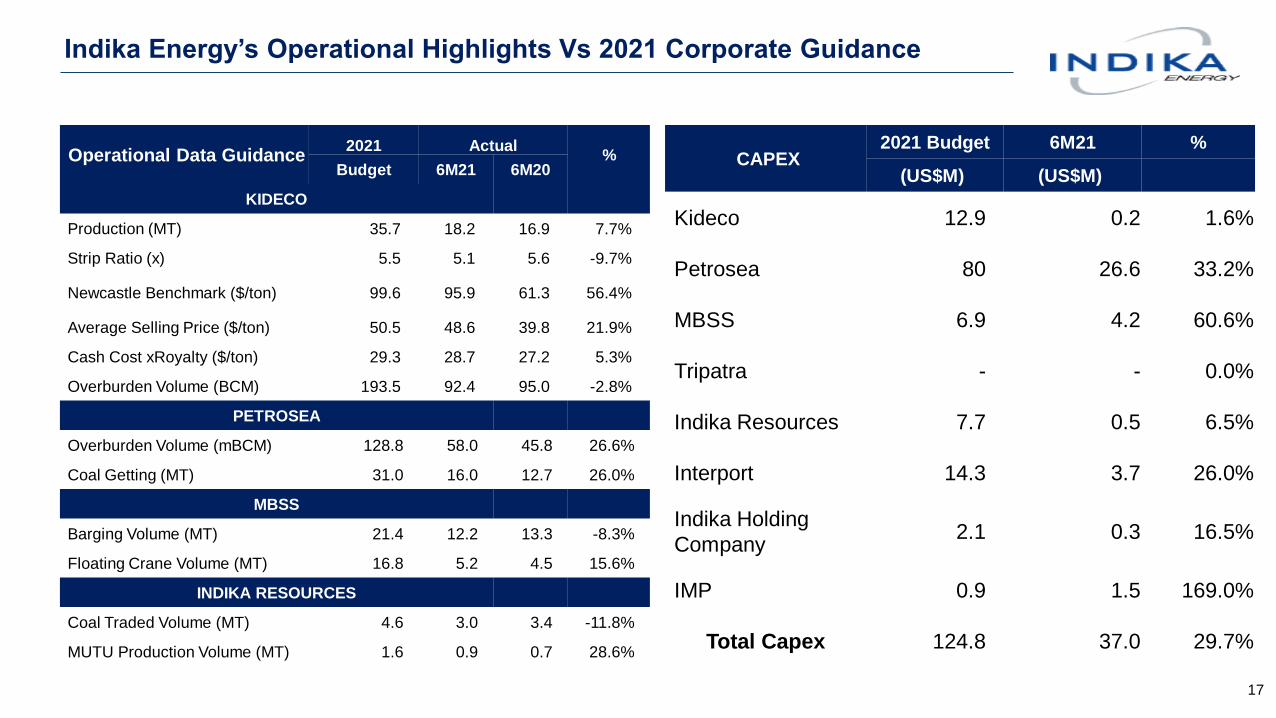
Indika Energy’s Operational Highlights Vs 2021 Corporate Guidance
17
Operational Data Guidance2021 Actual
%Budget 6M21 6M20
KIDECO
Production (MT) 35.7 18.2 16.9 7.7%
Strip Ratio (x) 5.5 5.1 5.6 -9.7%
Newcastle Benchmark ($/ton) 99.6 95.9 61.3 56.4%
Average Selling Price ($/ton) 50.5 48.6 39.8 21.9%
Cash Cost xRoyalty ($/ton) 29.3 28.7 27.2 5.3%
Overburden Volume (BCM) 193.5 92.4 95.0 -2.8%
PETROSEA
Overburden Volume (mBCM) 128.8 58.0 45.8 26.6%
Coal Getting (MT) 31.0 16.0 12.7 26.0%
MBSS
Barging Volume (MT) 21.4 12.2 13.3 -8.3%
Floating Crane Volume (MT) 16.8 5.2 4.5 15.6%
INDIKA RESOURCES
Coal Traded Volume (MT) 4.6 3.0 3.4 -11.8%
MUTU Production Volume (MT) 1.6 0.9 0.7 28.6%
CAPEX2021 Budget 6M21 %
(US$M) (US$M)
Kideco 12.9 0.2 1.6%
Petrosea 80 26.6 33.2%
MBSS 6.9 4.2 60.6%
Tripatra - - 0.0%
Indika Resources 7.7 0.5 6.5%
Interport 14.3 3.7 26.0%
Indika Holding
Company2.1 0.3 16.5%
IMP 0.9 1.5 169.0%
Total Capex 124.8 37.0 29.7%

18
Thermal Coal Price 2021 – Price looks robust
USD/ton
Demand
• China increases import quota for coal in 2021, on the back of
economic recovery
• Summer period in NE Asia, heatwave and drought to reduce
hydropower and boost demand.
• Demand from India looks steady despite the spread of Covid-
19, while demand from SEA remains robust
Supply
• Stringent measures on health & safety related to mine fatalities
in China limits domestic production
• Heavy rainfall in some areas in Kalimantan, impacting
production and logistics in first few months 2021..
• Indonesia to increase production to 625MT in 2021, back to
2019 level.
• Australia scales back production, infrastructure challenges in
some producing countries, e.g S. Africa, Columbia and Russia.
103.4 106.6 117.5
102.4 92.4 75.6
65.9 63.9 68.4 54.3
54.2 66.1
89.2
111.5
48.0 44.8 41.6
33.5 35.5 37.6 33.0 34.2
34.4 25.3 24.2
32.3 40.8 54.2
56.452.1 53.3 49.3 45.7 47.1
44.4 45.1 43.036.4 36.3
35.445.2 52.1
-
20.0
40.0
60.0
80.0
100.0
120.0
140.0
1Q18 2Q18 3Q18 4Q18 1Q19 2Q19 3Q19 4Q19 1Q20 2Q20 3Q20 4Q20 1Q21 2Q21
Newcastle ICI-4 ASP

19
Indonesia aims to increase production 11% YoY to 625MT in 2021
MT
451 459 461
549 610
561 625
86 91 97 115 138 132 138
367 370 389 429 455
405
488
0
100
200
300
400
500
600
700
2015 2016 2017 2018 2019 2020 2021F
Indonesia Production, DMO and Export volume
Production DMO Export
• Government expects coal production in 2021 to increase to
625MT; on the back of strong demand, as coal price has been
robust recently.
• No significant change on 2021 DMO policy with price capped at
USD70/ton FOB and minimum allocation of 25% (for first
550MT production)
• Coal still plays as major contributor to domestic power
generation in the Long Term. National electricity supply is
expected to grow by 4.05% pa in 2020-2029 with additional
41,775 MW by 2029, about half of the new capacity is to come
from coal.
38.2 37.0 40.0
31.5 29.4
32.1 31.4 29.3 28.2
32.1
37.0
40.6 38.3
33.8 34.4 33.1
37.0
-
5.0
10.0
15.0
20.0
25.0
30.0
35.0
40.0
45.0
Sources: APBI and others
Indonesia Export Volume (monthly)

20
Indonesia Export volume in 5M21 remains stable despite strong demand
due to weather problem
• Heavy rainfall and flood in some areas in Kalimantan limit
production in 1H21.
• Concerns over Covid outbreak also put operational challenges
• Global freight cost has increased YoY
Indonesia Export Volume stable - 5M21 vs 5M20 China remains the largest export market for Indonesia
China35%
India21%
SE Asia23%
Jap Kor Taiwan17%
Other4%
5M20
China41%
India21%
SE Asia21%
Jap Kor Taiwan13%
Other4%
5M21
Sources: APBI and others
73.8103.8 109.0 125.7 138.6 141.0
130.2
151.8 162.1156.2
160.8 163.1
0.0
50.0
100.0
150.0
200.0
250.0
300.0
350.0
2015 2016 2017 2018 2019 2020
Indonesia Other Countries
China’s Coal Import from Indonesia steadily increases
Countries 5M20 5M21 % Chg
China 61.6 71.9 17%
India 36.8 37.2 1%
SE Asia 41.0 37.4 -9%
Japan – Korea - Taiwan 30.0 23.7 -21
Other 6.7 6.4 -4%
Total 176.1 176.6 0.3%

21
Coal Outlook – LT Demand Remains Solid
Source: BP Energy Outlook 2019
• In the LT basis, International Energy Agency forecasts higher global coal
consumption by 2030 and only marginally lower consumption by 2040
• Thermal coal remains the largest power generator in the world
• Growing demand driven by China, India and SE Asia ( Vietnam, Indonesia)

22
Kideco: Impact of the Revised Mining Law
On 10-Jun-2020, the Indonesian parliament issued Mining Law No. 3 of 2020, which technically guarantees holders of CoW / CCoW
extensions for an effective:
(a) 20 years (in the form of two 10-year extensions) if the CoW or CCoW has never been extended; or
(b) 10 years (in the form of one 10-year extension) if the CoW or CCoW has been extended before
The authority to issue licenses and production approvals now are exclusively at the central government and ministry level, where it had
previously been at the governor and regency head. Additional guidance on the government royalty, income tax, and VAT to issued
Kideco’s existing CCoW expires in Mar-2023 and will be extended by conversion to an IUPK Continuation (IUPK sebagai Kelanjutan Operasi)
subject to application to the government including the submission of necessary documentation and other statutory requirements being fulfilled
Many large Indonesian miners have mining licenses that will expire before Kideco's
CCOW
1st Generation
Revised Mining Law No. 3
(2020)Key Highlights
Concession 49,000ha(1) Can Keep existing size of
concession(2)
Revised mining law allows for existing concession sizes to remain with
a conversion to IUPK
Licensing Period 2 x 10-year
extensions 2 x 10-year extensions
20 years (in the form of two 10-year extensions) if the CoW or CCoW
has never been extended; or
10 years (in the form of one 10-year extension) if the CoW or CCoW
has been extended before
% Government Royalty 13.5% TBD Royalty scheme will be further clarified in subsequent legislation
% Corporate Income Tax 45% 22% Separate legislation lowered Indonesian corporate income taxes
Additional Levy on Net Profit None 10% 10% levy on net profit introduced
Source: Mining Law 3/2020 (10-Jun 2020)
(1) Kideco’s size of concession
(2) Based on Mining Law 3/2020
Latest Developments

Strategies to Enhance Our Position as a Leading Integrated and Diversified
Indonesian Company
23
Diversify cash flows and increase revenue contribution from non-coal related businesses
• Increasing non-coal customer segments for energy-related services
• Exploring investment opportunities in non-coal mining sectors
• Developing other non-coal businesses
Strong focus and commitment to ESG in all aspects of our operations and management
• Continuing to maintain strong environmental management practices at our operations and promote green initiatives in the
community
• Continuing to be a leader in social responsibility through education, health, safety and community empowerment initiatives
• Maintaining a robust corporate governance framework and ensuring compliance with all prevailing laws and regulations
Continue to extract operational efficiencies and harness significant synergies among Group companies
• Continuing to increase operational efficiency and reduce costs
• Managing capital expenditure and negotiating with suppliers to distribute impact of adverse market conditions
• Continuing to provide a high-quality service and ongoing efficiency and optimisation improvements at coal mining services
business
• Continuing to leverage intra-Group cross-selling opportunities and integration of capabilities across businesses to increase
profitability
• Centralizing certain functions among Group companies (e.g. ICT, supply chain and procurement)
Continue to exercise prudent financial management and maintain healthy operating cash flows
• Using internally-generated cash ahead of external financing and maintaining a target total debt to EBITDA ratio
• Ongoing focus on delivering and controlling costs to position to be able to take advantage of future opportunities
• Generating sufficient cash flows from operations and diversifying access to available capital sources

24
Transforming into a diversified business portfolio
Current: Coal as core business Future: Diversified Business Portfolio
Business that
relies on coal, from
resources,
services and
infrastructure
✓ Diversified Business
Portfolio
✓ Significant growth
✓ Less volatility
✓ Eco-friendly
✓ Target to generate 50% revenue from non-coal businesses by 2025
✓ Growing the existing non-coal business and expanding into key areas of interest by leveraging our core competence
✓ Reducing exposure in coal related business, including through divestment
✓ Benefit of synergies across businesses
✓ Financial prudence and discipline maintained for all investments

25
Indika Energy people know today
Strong capabilities across the entire coal value chain
The future of Indika Energy
Unlocking sustainable development in Indonesia
New
portfolio
s
Logistics &
Infrastructure
Logistic assets, EPC
services, infrastructure,
e.g. fuel storage
Minerals Exploration of gold and
other metals and minerals
Nature
Solutions
Renewable energy, EV mobility, green economies
Digital
Ventures
Digital transformation and
analytics
Others Business incubation to develop
emerging new businesses
Field exploration of coal
resources, production and trading
Coal contract mining
and EPC services in oil
& gas
Transportation of bulk materials
and port infrastructure
Coal-fired power plant
Energy
resources
Energy
services
Energy
infrastructure
GAPURA TERMINALENERGI

26
Diversification Investments – Gold Asset Project
A Strategic investment in Nusantara Resources Limited (ASX: NUS). Nusantara
owned 100% PT Masmindo Dwi Area which has sole rights to exploit in Awak
Mas Gold Project
Location : South Sulawesi, 370 km from Makasar
Potential Resources : 2.29 million onz
Potential Reserves : 1.46 million onz *(1.35g/t)
License : COW (Contract of Work) amended in March 2018
Total concession : 14,390Ha, explored area ± 2,000Ha
Current Status : FEED
Definitive feasibility study has been completed in 2018
Ownership : Total 45.8% in Masmindo , through 27.8% in Nusantara
Resources Limited & 25% direct ownership in Masmindo.
Indika Energy has entered Scheme Implementation Deed
“SID” to acquire the remaining shares in Nusantara.
Potential Direct or Indirect ownership = 100%
* Reserve at USD1,400 per ounce gold price

Awak Mas/Masmindo Gold Project – Investment Structure
27
27.8%
Exercised 1st option:
USD 15m for 25% in MDWI
Indika Energy
Nusantara
(ASX Listed)
Masmindo DWI Area (gold project)
75%
Project Activities 2 stage
Stage 1 : To reach Final Investment Decision (1H21)
Complete: FEED
Detailed Design, permit for Tailings Storage Facility (TSF)
Land Access and compensation
Early Civil works
Conclude Debt and equity funding
Stage 2: Mid 2021
Award major contracts
Full scale construction
Commissioning is expected 2Y from Final Investment Decision
Ownership: Has exercised first stage option; paid USD 15m and owns directly 25% of Masmindo.
Transaction has been approved by MEMR on 25 Aug 20.
Direct 25%
Current ownership: 45.8%
• To acquire remaining ~72% shares of Nusantara through binding “Scheme Implementation
Deed” (SID) with an estimated cost AU$58.8m (~US$45m).
• NUS’ Independent Board Committee unanimously recommend to vote in favor of the scheme
• To get approval from NUS’ General Meeting to be held in mid- late Sept 2021

28
Diversification Investments – Fuel Storage Project
Build and operate fuel storages exclusively for ExxonMobil
Location : Balikpapan, Kariangau, East Kalimantan
Project Company : PT Karingau Gapura Terminal Energy
Total Project Cost : US$115million
Funding Structure : US$75 million - bank loan & US$38 million - equity
Storage Capacity : 75ML – Diesel; 13ML – MoGas; - 8ML –B100
Construction Periods : 18 months starting January 2019
COD : Commercial operation as of 9 November 20
Contractors : Tripatra & Petrosea
Phase 1

29
Diversification Investments – Patimban Port
▪ A strategic infrastructure project development; as the first integrated supply chain port in Indonesia
▪ On 30 Dec 20, Ministry of Transport has appointed Consortium of Patimban as operator of Patimban Port
▪ Indika joined the consortium through Indika Logistic & Support Services (ILSS) with 29% stake
Location : Patimban, Subang West Java
Scheme : Procure – Operate – Transfer
Concession Period : 40 years (2021 to 2061)
Capacity : 3.75 million TEUs for container terminal
600,000 CBU for car terminal
Development : 4 phases
Phase I
• Car terminal with capacity of 218,000 CBU (expected to operate by end
2021)
• Container terminal with area of 10.74 ha and capacity of 250,000 TEUs
Phase II
• Development will be in 2021-2027
• Car terminal with capacity of 382,000 CBU
• Container terminal with area of 63.45 ha and total capacity of 3.75m
(TEUS)

Indonesia to rely more on New and Renewable Energy (NRE)
30
NRE; 4.2
Fuel; 43.0
Coal; 34.2
Gas; 18.6
2014
NRE Fuel Coal Gas
National Primary Energy Mix (MTOE)
NRE; 23
Fuel; 25
Coal; 30
Gas; 22
2025
NRE Fuel Coal Gas
~400 MTOE
NRE; 31
Fuel; 20
Coal; 25
Gas; 24
2050
NRE Fuel Coal Gas
197 MTOE ~1,000 MTOE
8.6 16.2 45.2
69.7
118.6
167.6
-
50.0
100.0
150.0
200.0
250.0
300.0
350.0
400.0
450.0
500.0
2015 2020 2025 2030 2040 2050
Power Supply Generation (GW)
Fossil NRE
1 2 5 7 11
13
0%
10%
20%
30%
40%
50%
60%
70%
80%
90%
100%
2019 2020 2021 2022 2023 2024
NRE - Power Generation Mix (%)
Geothermal Hydro Wind Bio Others Solar
Source: Rencana Strategis Kementerian ESDM 2020-2024 (RUEN)

31
INVESTASI
• Indika Energy formed a JV to operate solar power business with Fourth Partner Energy,
India’s leading solar developer, called Empat Mitra Indika Tenaga Surya (EMITS), with
51% stakes.
• EMITS will provide a one-stop-shop, renewable energy solutions platform for Indonesia’s
commercial and industrial sectors.
• EMITS aims to install 500MW in the next 5 year in Indonesia, combination of Utilities,
Commercial & Industrial and Off Grid/ Mini GridDIVERSIFICATIONINVESTMENT
Renewable Energy
Diversification Investments – Solar PV
C&I PV Rooftop C&I Provider Sale to PLN
ConceptClients Install Rooftop PV to
save electricity bill
Clients supply their own
electricity (off grid)
Build Solar PV and inject
power to PLN's grid
ClientCommercial & Industrial
Clients
Commercial & Industrial
ClientsPLN
Development
time< 1 year 1-2 years >2 years
Types of Market Segmentation

32
Govt to boost the use of Solar Energy
Policy To increase Solar Power capacity
RUEN
• Target to develop solar power capacity by 2025
• The use of solar rooftop and floating solar power
plant
• Fiscal and non-fiscal incentives for developer
30%
Utilisation of rooftop for solar panel
25%Requirement to utilize minimum 25% of rooftop area
on luxury houses, housing complex, and apartment
trough IMB (building licence)
Requirement to utilize minimum of 30% rooftop area
on government building for solar panel. 6.5GW
Source: Rencana Strategis Kementerian ESDM 2020-2024 (RUEN), Perpress NO 22/2017
77 92
119
180
260
34 44 52
73
146
-
50
100
150
200
250
300
2015 2016 2017 2018 2019
Solar Power Installed Capacity (MW)
Target Realization
CAGR
44%
261 589
929 1,572
2,215
6,500
-
1,000
2,000
3,000
4,000
5,000
6,000
7,000
2020F 2021F 2022F 2023F 2024F 2025F
Solar Power - Installed Capacity (MW)
CAGR 114%

Diversification business – Electric 2W
33
8.01
7.06
7.74 7.87
6.48 5.93 5.89
6.38 6.49
3.66
-
1.00
2.00
3.00
4.00
5.00
6.00
7.00
8.00
9.00
2011 2012 2013 2014 2015 2016 2017 2018 2019 2020
2W domestic sales (m units)
Source: AISI and BPS
• Indika Energy, through PT Electra Mobilitas Indonesia (EMI), plans to
develop 2W electric vehicle business in Indonesia
✓ Large 2W domestic market, with estimated 116m vehicles as of 2020;
ratio of 2W to population is 1:2.3
✓ More than 43% of 2W is > 10 years old
✓ Government aims to boost 2W EV reaching 2 million by 2025
✓ Gojek with current driver partners of 2 million plans to use EVs by 2030
for all its transport services (2W and 4W)
✓ PLN to build charging stations across the country, supporting the
infrastructure development
Underbone6%
Scooter88%
Sport6%
Domestic 2W category -2020

34
INVESTASI
Diversification Investments – Industrial Forestry
Through Indika Multi Properti, developing more than 24,000 ha industrial
forest area, located in East Kalimantan
• Wood pellets for biomass (for co-firing)
• Carbon credit potentials
Biomass for co-firing Calorific value (kcal/kg)
Palm fiber 4,556
Calliandra 4,200
Bagasse (cane) 4,213
Empty palm oil bunches 3,700
Rice hulls 3,053
Source: Rencana Strategis Kementerian ESDM 2020-2024 (RUEN)

Strong Focus on and Commitment to ESG Initiatives
35
Environmental
✓ Comply with all Indonesian environmental laws,
regulations and standards
✓ Strong focus on five key elements
✓ Climate change (Greenhouse gas and carbon
emissions)
✓ Water & effluents
✓ Waste management
✓ Biodiversity conservation
✓ Environmentally friendly initiatives
✓ Environmentally friendly technologies at operations
✓ Ultra-supercritical coal-fired technology which reduces
CO2 emissions
✓ Solar panels at Kideco and CEP
✓ Low ash and sulfur Kideco coal relatively cleaner
burning
✓ Industry 4.0 (decreased materials, fuel and spare parts
usage)
✓ Environmental management practises recognized by
governments
✓ Kideco received Gold PROPER award from Ministry of
Environment and Forestry
✓ Promote green activities, including by partnering with
local communities
✓ Contribute to Indonesia’s wildlife protection efforts
Social Responsibility
✓ Focus on supporting long-term economic growth and
improving the quality of life in regions of operation
Governance
✓ Continuously implementing and improving good
corporate governance
✓ Recent addition of three individuals to Board of
Directors, including a female member (representing
20% of the board)
✓ Robust anti-bribery management system – Indika
Energy, IIR and Petrosea obtained ISO37001, while
the other subsidiaries are in the process of obtaining
✓ Complying with prevailing laws and regulations
Transparency
Accountability
Responsibility
Independence
Fairness & Equality
Corporate Principles
Education Develop education infrastructure
Provide scholarships and key skills
vocational training
Health and
Safety
Employees receive mandatory health
and safety specialized training
Comply with Indonesian safety and
health standards
Engage in programs to promote
healthier living in the community
Community
Significant portion of site workforce
from local areas
Support small community businesses
Sponsor infrastructure development in
local communities
Collaboration with key welfare
organisations (Indorelawan)
Intercultural Innovation Awards (UNAOC(1) and
BMW Group)1
“Achievements in promoting national tolerance and diversity”
(1) United Nations Alliance of Civilizations

Awards / Recognition/Certification
• Kideco has won Gold PROPER National
Award from Ministry of Environment
and Forestry (KLH) - 2020
• Out of 2,038 national companies
participated in the evaluation, only 32
companies including Kideco received
the Gold award in Dec 2020
• Gold is the highest rank that given only
for companies that have demonstrated
environmental excellence in their
production and services. They also have
conducted business that is highly ethical,
socially responsible as well as commitment
in sustainability development.
PT Indika Energy Tbk has been ranked 1st in the Basic Materials
Sector of the 2020 Global Fixed-Income Investor Relations
ranking by Institutional Research for the following categories:
✓ 1st Best Investor Relation - High Yield (2019-2020)
✓ 1st Best Use of Debt – High Yield (2019-2020)
✓ 2nd Best Use of Debt – Investment Grade (Asia)
Evaluation were based on 5 areas:
1. Balance sheet transparency
2. Communication of strategy shifts
3. Clarity of debt covenant calculations and other provisions
4. Responsiveness to questions on debt ratings
5. Engagement with bondholders
Indika Group (including subsidiaries) has received ISO 37001
certification for anti bribery system at end of 2020
✓ Indika Energy Tbk (INDY)
✓ PT Kideco Jaya Agung
✓ Petrosea Tbk
✓ Tripatra
✓ Mitrabahtera Segara Sejati Tbk (MBSS)
✓ Indika Resources
✓ Interport
MSCI
ESG Ratings
* Prev BB
BBB
Sustainalytics
ESG Risk Rating
** Prev 44.2
38.1

37
Our Commitment to the Environment
Lower Carbon Emission
Scope 1 GHG
emissions*
1,398,597 Ton CO2 eq
13.5%
Total energy usage**
14,307,917 GJ 8.1%
Total fuel
consumption***
466,587,377 liter
12.2%
GHG emission
intensity**
0.041
12.8%
Energy intensity
ratio**
0.42
4.0%
Efficient Use of Water
Total water
consumption*
5,109,615 M3
8.0%
Waste Management
Total usage of
recycled waste**
504.6 ton
73.1%
Total weight of
reused waste**
2,065.0 ton85.7%
Reclamation
Reclamation and
reforestation**
5,357 Ha
11.9%
Biodiversity Preservation
Together with local organizations and communities,
we protect and preserve biodiversity, flora and
fauna. We monitor and minimize impact on
biodiversity through rehabilitation program,
reforestation, seed nursery, land reclamation and
develop conservation areas and wildlife corridors in
East Kalimantan.
Developing Solar PV panel for
Kideco camp and officeAll information in this page, based on activities in:
*) Kideco, Petrosea and Tripatra
**) Kideco
***) Kideco and Petrosea

38
Our Commitments to the Communities
Provided Job Opportunities
Impacting 27.000+
family members across
Indonesia
7,539
People
Donation for Covid-19 Handling
Total numbers PCR Swab
testing for staff and families
and surrounding communities
in Jakarta 2,333 and
Balikpapan 5,567
8,000+
Indika Solidarity Collaboration with various parties
Total donation made by
Indika Energy Group
including through Indika
Foundation and other
organization
US$5.9
million
Total Rapid Test Antibody
dan Antigen 4,576 (Jakarta),
2,496 (Balikpapan) 7,000+
Rice packages for
surrounding communities in
Balikpapan and supported
local vendors as rice
suppliers and transport.
20,000+
Isolation Center
Providing self-care medical facilities for
employees and families affected by COVID-
19 in Jakarta.
We, in collaboration with some-minded
parties, took part in a number of initiatives
in relation to COVID-19 impact to the
country and its people.
In addition, as part of Indika Energy 20th
Anniversary, we donate Rp2 billion for
Swab and Save Indonesia. (Swab and
Save Indonesia is a donation program
under GSI Lab providing PCR swab tests
for those who can’t afford it).

39
Our Commitment to Good Governance
Strong Business Ethics
Obtained
ISO37001:2016 for Anti-
Bribery Management
System from British
Standard Institute
Transparency and Communication
with Investors
20%
Board Diversity Share Buyback
Voted by Institutional
Investor in the 2020
Global Fixed Income
Investor Relations survey
as: 1st Best Overall IR
(High-yield) and 2nd Best
Use of Debt in Asia
(Investment Grade), in
Basic Material Sector
+3New members of the
Board of Directors to
strengthen management
Dividend
Indika Energy distributed cash dividend of
Rp467.0 billion (Rp89,6 per share) from its
retained earnings to the shareholders.
The Company bought back 7.5 million shares with
avergae price of Rp 692.99 per share.Board of Directors is
Female
Rp 467.0 Billion
7,500,000 shares

Appendix
40

41
PT Indika Energy Tbk.
Energy Services Energy InfrastructureEnergy Resources
▪
-Established since 1991
-3rd largest coal producer
-Resources 1,625 MT, reserves
569 MT as of end Dec 2017
-91.0% ownership as of 6 Dec.
2017
▪
-Established since 1989
-Bituminous thermal & coking coal
-Resources 75.2 MT, reserves
40.6 MT
-85.0% ownership
▪
-Established since 2012
-Coal trading, ~7.0 MT volume
▪
-Established since 1994
- Integrated water coal transportation
and logistic
-51% ownership
▪
-Established since 2007
-20.0% owned 660MW, enviro-
friendly supercritical technology
-6.25% owned 1000MW expansion ,
ultra supercritical technology (under
construction)
▪
-Established since 2018
- Integrated logistic services
-Build and operate fuel storage
facility
-Port Business Entity license to
operate and provide port and logistic
services at all Indonesia major ports
▪
-Established since 1973
-Leading EPC and O&M services in
oil & gas and power generation
-100% ownership
▪
-Established since 1972
-Coal contract mining and E&C
capabilities in mining and oil and
gas
-69.8% ownership
Other Portfolios
▪
-Established since 2011
- Investment company in mineral
mining
-Developing gold project Awak Mas
in South Sulawesi
-Resources 2 million oz, reserves
1,1 million oz
-21% ownership
4321
Indika Energy, Indonesia’s leading fully integrated energy company

42
As a Group, Indika Energy creates synergy and offers comprehensive
set of multi-sector expertise and competencies
Example: IEG end-to-end competencies in coal value chain
En
erg
y
reso
urc
es
En
erg
y s
erv
ice
sE
ne
rgy in
fra
str
uc
ture
Identification /
acquisition of assets
Exploration
Economic and
feasibility study
Engineering and
construction
Production
Processing
Land transportation
Barging
Loading /
transshipment
Power generation
Offtake sales
• Operational synergy from intra-Group cross-selling opportunities- Petrosea and MBSS provides part of Kideco's
overburden removal, coal barging and transshipment services
- Kideco provides 1.9mt of coal per year to CEP- MBSS provides coal barging and transshipment
services to MUTU and Kideco
• Cost synergy from integrated operations (work-sharing and knowledge-sharing) among Tripatra, Petrosea and MBSS
• Increasingly stable earnings and cashflow from continued multi-sector diversification
Synergy across the Group

Total Backlog Total Backlog Total Backlog 660MW Power Plant
$883.5M $79.1M $111.8M
6M21 Net Income 6M21 Net Income 6M21 Net Income 6M21 Net Income
$11.9M $0.1M -$32.9M $5.0M (20% Indika)
6M21 EBITDA Margin 6M21 EBITDA Margin 6M21 Adj. EBITDA Margin 6M21 EBITDA Margin
25.6% 33.7% -28.2% 31.8%
ROE ROE ROE ROE
5.0% 0.0% -36.9% 6.4%
43
Indika Energy Subsidiary Results
Petrosea MBSS Tripatra Cirebon Electric Power
• Coal contract mining and E&C
capabilities
• Opportunity to increase group
synergies by winning more Kideco
contracting share
• 69.8% ownership
• Integrated coal transport & logistics
business
• Consists of 78 barges, 87 tugboats,
1 support vessel, 4 floating cranes
and 2 floating loading facilities
• 51% ownership
• Multi-disciplined engineering/EPC
and project capabilities
• Two subsidiaries:
1. PT Cotrans Asia – 45% stake
barging / transportation business
2. PT Sea Bridge Shipping – 46%
stake; domestic coal
transshipment for Kideco
• Kideco cross sells approximately
1.7MT to CEP annually
• Indika’s portion of net income in
6M21 is US$5.0M
• 20% ownership of CEP
• 6.25% ownership of CEP II
(expansion project)

Indika Energy’s Subsidiaries Backlog
44
Descriptions
Remaining
Contract Value
New Contract/
Adjustment
ValueRevenue
Recognition
Remaining
Contract Value
in 2020
Per 31 Dec 2020 Per 30 Jun 2021 Per 30 Jun 2021
Petrosea
Contract mining 750.6 207.4 140.4 817.6
E&C 47.3 14.5 25.9 35.9
POSB 32.1 25.0 27.1 30.0
Total (USD mn) 830 246.8 193.3 883.5
Tripatra
Tripatra Engineers & Constructors 129.2 46.3 77.6 97.9
Tripatra Engineering 17.8 4.5 8.5 13.9
Total (USD mn) 147.0 50.9 86.1 111.8
MBSS
Barging 47.6 17.6 23.4 41.8
Floating Crane 44.9 2.4 10.0 37.3
Total (USD mn) 92.5 20.0 33.4 79.1
Total Consolidated (USD mn) 1,069.5 317.7 312.8 1,074.4

45
Indika Energy’s Financial Highlights
Gross Profit (USD mn) Operating Profit (USD mn)
Income from Associates (USD mn)Core Profit/Loss**
(USD mn)
Net Profit/Loss*(USD mn)
* Profit/loss for the period attributable to owners of the company** Core Profit refers to the current year’s profit attributable to the owner of the company, excluding non-operating gains / losses and related taxes
(amortization of intangible assets, impairment of assets, fair value changes on contingent consideration obligation, gain on revaluation, acceleration on
amortization of bond issuance cost, gain from bargain purchase).
.
Revenues (USD mn)
1,098.8
2,962.9
2,079.9 2,077.2
1,287.9
-
500.0
1,000.0
1,500.0
2,000.0
2,500.0
3,000.0
3,500.0
2017 2018 2019 2020 6M21
122.9
641.2
426.7
253.9 294.0
0
130
260
390
520
650
780
2017 2018 2019 2020 6M21
34.1
508.1
289.5
115.9
219.4
0
100
200
300
400
500
600
700
800
2017 2018 2019 2020 6M21
136.2
20.6 30.0 32.6
16.7
0
40
80
120
160
2017 2018 2019 2020 6M21
335.5
80.1
(18.2)(117.5) 12.0
-120
-20
80
180
280
380
2017 2018 2019 2020 6M21
94.5
168.4
75.5
(52.2)
55.8
-100
-50
0
50
100
150
200
2017 2018 2019 2020 6M21

Gross Debt & Net Debt / LTM Adj. EBITDA (x)
LTM Adj. FCF / Debt (%)
Debt / Capital (%)
46
Indika Energy’s Key Business and Credit Ratios
LTM Adj EBIT / Interest (x)
LTM Adj EBITDA* (USD mn) & LTM Adj EBITDA
Margin (%)
LTM Adj EBIT (USD mn) & EBIT Margin (%)
291.9
652.5
436.0
274.1
406.1
26.6%
15.6%15.7%
13.2%
18.2%
0.0%
5.0%
10.0%
15.0%
20.0%
25.0%
30.0%
-
200.0
400.0
600.0
800.0
1,000.0
2017 2018 2019 2020 6M21
EBITDA EBITDA Margin
330.8
519.9
298.7
132.7
236.3
30.1%
17.5%
10.7%6.4%
11.5%
0.0%
5.0%
10.0%
15.0%
20.0%
25.0%
30.0%
35.0%
0.0
200.0
400.0
600.0
800.0
1000.0
2017 2018 2019 2020 6M21
Adj. EBIT EBIT Margin
4.9
2.3
3.5
6.2
4.1
2.4
1.1
1.9
3.3
2.2
-
1.0
2.0
3.0
4.0
5.0
6.0
7.0
2017 2018 2019 2020 6M21
56.4% 56.7%
59.9%
66.1%65.0%
50.0%
52.0%
54.0%
56.0%
58.0%
60.0%
62.0%
64.0%
66.0%
68.0%
2017 2018 2019 2020 6M21
0.4
5.1
2.6
1.1 1.2
0.0
1.0
2.0
3.0
4.0
5.0
6.0
2017 2018 2019 2020 6M21
15.7%
21.9%
13.0%
10.4%
15.9%
0.0%
5.0%
10.0%
15.0%
20.0%
25.0%
2017 2018 2019 2020 6M21

39.0
32.1 32.034.0 34.3 33.0
30.0
4.0
2015 2016 2017 2018 2019 2020 2021F
Actual Gov Approval Additional Target
47
Kideco – Leading Coal Producer in Indonesia
SM 4200-4300 Kcal
65%
Blended 4500 Kcal
8%
Roto 4900 Kcal
27%
Kideco Product Mix Kideco Production
Million Ton
34.0
Kideco Sales – by country
• Third largest coal producer in Indonesia
• Environmental friendly thermal coal with ultra-low sulphur of 0.1% and low ash of
(2.1% to 4.9%)
• Attractive location with well-built infrastructure, and integrated value chain within
the group, allowing for strong control over operation
• Low cost coal producer
• Resources of 1,550 MT and reserves of 531 MT based on JORC report Dec 2019
• Geographically diversified customer base
China33%
Indonesia35%
Korea5%
India9%
Taiwan3%
Southeast Asia14%
Japan1%
Others0%

48
Kideco’s Financial Highlights
Revenues (USD mn) Gross Profit (USD mn) Operating Profit (USD mn)
Net Profit (USD mn) EBITDA (USD mn) Cash Balance (USD mn)
1,633.0
1,802.2
1,574.2
1,249.5
876.8
0
400
800
1,200
1,600
2,000
2017 2018 2019 2020 6M21
527.8492.1
248.5
177.2
240.0
0
100
200
300
400
500
600
2017 2018 2019 2020 6M21
469.4450.3
208.2
138.3
216.4
0
100
200
300
400
500
2017 2018 2019 2020 6M21
277.1260.1
119.8
75.4
120.3
0
50
100
150
200
250
300
2017 2018 2019 2020 6M21
526.0489.5
245.7
160.7
227.6
0.0
100.0
200.0
300.0
400.0
500.0
600.0
2017 2018 2019 2020 6M21
144.4
171.3
114.3
187.5
215.8
0
50
100
150
200
250
2017 2018 2019 2020 6M21

49
Kideco’s Operational Highlights
Cash Cost Breakdown Coal Production (mn ton) Coal Sales (mn ton)
Stripping Ratio (x) Average Selling Price (USD/ton) Cash Cost (USD mn)
Contract Mining + Rental54%
Gov. Royalty
17%
Material10%
Freight7%
O/H11%
Labor1%
32.034.0 34.3 33.0
18.2
0.0
15.0
30.0
45.0
2017 2018 2019 2020 6M21
31.534.1 34.9
33.0
18.1
0
15
30
45
2017 2018 2019 2020 6M21
6.1 6.3 6.35.7
5.1
0
2
4
6
8
2018 2018 2019 2020 6M21
51.9 52.9
45.1
37.8
48.6
0.0
15.0
30.0
45.0
60.0
2017 2018 2019 2020 6M21
34.437.8 37.3
31.834.7
28.030.9 31.2
27.028.7
2017 2018 2019 2020 6M21
Incl Royalty Excl Royalty

Kideco’s Operational Highlights
50
Summary P&L (US$mn)Quarter Data YTD
2Q21 2Q20 YoY 1Q20 QoQ 6M21 6M20 YoY
Sales 461.9 286.9 61.0% 414.9 11.3% 876.8 663.2 32.2%
Gross profit 136.3 46.5 193.2% 103.7 31.4% 240.0 114.1 110.4%
Operating profit 124.7 35.4 252.5% 91.7 36.1% 216.4 92.2 134.6%
Net income 69.2 21.6 220.0% 51.1 35.3% 120.3 46.7 157.4%
EBITDA 130.3 41.0 217.8% 97.2 34.1% 227.6 103.3 120.2%
Gross margin 29.5% 16.2% 25.0% 27.4% 17.2%
Operating margin 27.0% 12.3% 22.1% 24.7% 13.9%
Net margin 15.0% 7.5% 12.3% 13.7% 7.0%
EBITDA margin 28.2% 14.3% 23.4% 26.0% 15.6%
Overburden (mn bcm) 44.8 48.5 -7.7% 47.6 -5.8% 92.4 95.0 -2.8%
Production volume (Mt) 9.1 8.1 12.1% 9.1 -0.1% 18.2 16.9 7.7%
Sales volume (Mt) 8.9 7.9 12.4% 9.2 -3.4% 18.1 16.6 8.5%
Stripping ratio (X) 4.9 6.0 -17.6% 5.2 -5.7% 5.1 5.6 -9.7%
Cash Cost excl royalty
(US$/ton)29.8 24.7 20.4% 27.6 7.9% 28.7 27.2 5.3%
Average selling price (US$/ton) 52.1 36.4 43.2% 45.2 15.2% 48.6 39.8 21.9%

69%
34%
27%
15%
0%
10%
20%
30%
40%
50%
60%
70%
80%
PTBA INDY ADRO ITMG
Peer Comparison (3M21 Data)
51
EBITDA MARGIN
PRODUCTION ANNUAL (MT) STRIP RATIO (x)
RESERVE/RESOURCE RATIO
CASH COSTS ex Royalty (US$/t)
Domestic Sales/ Total (DMO 25%)
*Kideco only
DMO requirement
51
36
1816
0
10
20
30
40
50
60
ADRO INDY * PTBA ITMG
5.2
3.8
5.2
11.5
0
2
4
6
8
10
12
14
PTBA ADRO INDY * ITMG
35%
22%
16%
23%
0%
5%
10%
15%
20%
25%
30%
35%
40%
ADRO PTBA ITMG INDY*
16%
22%
31%
40%
0%
5%
10%
15%
20%
25%
30%
35%
40%
45%
ITMG ADRO INDY PTBA
36 39
33
53
-
10
20
30
40
50
60
ADRO PTBA INDY * ITMG

52
Petrosea’s Financial Highlights (1)
Revenues (USD mn)
*
EBITDA (USD mn)Coal Getting Volume (MT) Net Profit/Loss* (USD mn)
Gross Profit (USD mn) Overburden Removal (mbcm)
313.5
465.7 476.4
340.7
193.3
0
100
200
300
400
500
600
2017 2018 2019 2020 6M21
45.7
73.1
81.1 74.9
30.0
0
20
40
60
80
100
2017 2018 2019 2020 6M21
97.6
121.1 123.5
94.4
58.0
0
35
70
105
140
2017 2018 2019 2020 6M21
24.8
34.6
31.0
26.7
16.0
0
8
16
24
32
40
2017 2018 2019 2020 6M21
74.6
116.8127.1
112.9
50.0
0
30
60
90
120
150
2017 2018 2019 2020 6M21
11.6
23.4
31.3 32.5
11.8
0.0
15.0
30.0
45.0
2017 2018 2019 2020 6M21

53
Petrosea’s Financial Highlights (2)
*
Revenues Breakdown by Value
*Cost Structure
6M21: US$193.1mn 6M20: US$175.9 mn
6M21: US$163.3 mn 6M20: US$144.0 mn
Contract Mining72.6%
E&C12.8%
POSB14.0%
Others0.6%
Contract Mining59.1%
E&C19.1%
POSB19.7%
Other2.1%
Salary31.4%
Operations24.8%
Depreciation20.3%
Subs & Rental9.3%
Rental7.9%
Material4.9%
Amortization & other cost
1.4%
Salary34.9%
Operations22.2%
Depreciation20.9%
Subs & Rental8.9%
Rental8.7%
Material3.2%
Amortization & other cost
1.2%

54
Tripatra’s Financial Highlights (1)
* Profit/loss for the period attributable to owners of the company
** Including dividends from associates
Month/year Month/year
Revenue (USD mn) Gross Profit (USD mn) Net Profit* (USD mn)
Income from Associates (USD mn)
Month/year Month/year
Adjusted EBITDA** (USD mn)
274.8 278.3
462.3
299.4
95.8
0
125
250
375
500
2017 2018 2019 2020 6M21
45.041.7
37.5
-31.7
-20.3
-40
-25
-10
5
20
35
50
2017 2018 2019 2020 6M21
8.4
10.2 10.29.3
5.3
0
3
6
9
12
2017 2018 2019 2020 6M21
35.2 35.129.2
-36.6
-20.9
-45
-37
-29
-21
-13
-5
3
11
19
27
35
2017 2018 2019 2020 6M21
25.8 28.4
16.9
-43.5
-32.9
-49
-42
-35
-28-21
-14
-7
0
7
14
21
28
35
2017 2018 2019 2020 6M21

55
Tripatra’s Financial Highlights (2)
*
Revenues Breakdown by Value
Cost Structure
6M21: US$95.8 mn 6M20 : US$195.8mn
3M21 US$52.1 mn 3M20: US$93.2 mn
TPEC88.9%
TPE11.1%
TPEC92.0%
TPE8.0%
Material18.6%
Sub Contractors
39.3%
Salary6.2%
Handling1.2%
Rental9.7%
Others25.0%
Material41.1%
Sub Contractors
30.0%
Salary6.1%
Handling4.5%
Rental7.8%
Others10.4%

56
MBSS’ Financial Highlights (1) *
Revenues (USD mn)
Net Profit (USD mn)
EBITDA (USD mn)
Floating Crane Vol. (mn ton)Barging Vol. (mn ton)
Gross Profit (USD mn)
68.5 75.4 77.8
54.9
33.4
-
25.0
50.0
75.0
100.0
2017 2018 2019 2020 6M21
2.5
4.9
18.4
3.95.4
0
4
8
12
16
20
2017 2018 2019 2020 6M21
18.4
24.0
27.7
14.8
11.2
0
5
10
15
20
25
30
2017 2018 2019 2020 6M21
-8.9
-18.2
4.3
-14.9
0.1
-20
-15
-10
-5
0
5
10
15
20
2017 2018 2019 2020 6M21
18.5
22.1
25.1 24.6
13.4
0
5
10
15
20
25
30
2017 2018 2019 2020 6M21
8.7
11.810.1
8.1
5.2
0
5
10
15
20
25
2017 2018 2019 2020 6M21

57
MBSS’ Financial Highlights (2)
*
Revenues Breakdown
*Cost Structure
6M21: US$288.0 mn 6M20: US$27.5 mn
6M21 US$33.4mn 6M20: US$29.0mn
Barging70%
FC 30%
Barging73%
FC 27%
Depreciation36%
Fuel19%
Salaries12%
Spareparts9%
Port charges5%
Insurance3%
Others16%
Depreciation39.8%
Fuel13.5%
Salaries12.4%
Spareparts13.0%
Port charges7.1%
Insurance2.8% Others
11.4%

Indika Resources’ Financial Highlights
Revenues (USD mn)
Net Profit (USD mn)
Gross Profit (USD mn)
MUTU Production Vol. (mn ton)Coal Trading Vol. (mn ton)
Cost of Good Sold (USD mn)
58
319.8
398.8
325.9
192.9
156.3
-
50.0
100.0
150.0
200.0
250.0
300.0
350.0
400.0
450.0
2017 2018 2019 2020 6M21
306.5
359.4
300.8
170.3
122.7
-
50.0
100.0
150.0
200.0
250.0
300.0
350.0
400.0
2017 2018 2019 2020 6M21
13.3
36.2
21.3 22.6
33.6
-
5.0
10.0
15.0
20.0
25.0
30.0
35.0
40.0
2017 2018 2019 2020 6M21
(142.4)
2.4 4.3 2.2
20.6
(160.0)
(120.0)
(80.0)
(40.0)
-
40.0
2017 2018 2019 2020 6M216.8
8.4
6.5
4.3
3.0
0
2
4
6
8
10
2017 2018 2019 2020 6M21
0.5
1.2
1.6
1.3
0.8
0
0.5
1
1.5
2
2017 2018 2019 2020 6M21

59
Indika Resources’ Financial Highlights (2)
*
Revenues Breakdown
*MUTU ASP (USD/ton)
6M21: US$156.3 mn 6M20: US$132.3 mn
MUTU Cash Cost ex Royalty (USD/ton)
Coal Trading54.6%
MUTU45.4%
Coal Trading69.4%
MUTU30.6%
78.3
87.6
76.3
60.1
82.3
0
20
40
60
80
100
2017 2018 2019 2020 6M21
62.2 61.3
53.2
46.644.04
0
10
20
30
40
50
60
70
2017 2018 2019 2020 6M21

60
Notes Outstanding
The Senior
Notes are rated:BB - / Negative Outlook
International Ratings (as of Oct 2020)
A + / Negative Outlook
National Ratings (as of Oct 2020)
Ba 3
Negative Outlook (as of Oct. 2020)
Indo Energy Capital IV Pte. Ltd.
USD675.0 mn
8.250% 5-year Senior Notes
Reg S / 144A
due 2025
October 2020
Indo Energy Capital III Pte. Ltd.
USD575.0 mn
5.875% 7-year Senior Notes
Reg S / 144A
due 2024
November 2017


![Results Update Presentation [Company Update]](https://img.pdfslide.us/doc/110x75/577ca7a11a28abea748c7c9d/results-update-presentation-company-update.jpg)

![Earnings Update [Company Update]](https://img.pdfslide.us/doc/110x75/577c7f491a28abe054a3eab4/earnings-update-company-update.jpg)

![Performance Update [Company Update]](https://img.pdfslide.us/doc/110x75/577c7c411a28abe05499ee66/performance-update-company-update.jpg)

![Investor Update [Company Update]](https://img.pdfslide.us/doc/110x75/577ca7aa1a28abea748c8178/investor-update-company-update-578a5bfde230f.jpg)

![Update of Legal Proceedings initiated by the Company [Company Update]](https://img.pdfslide.us/doc/110x75/577cb4161a28aba7118c4baa/update-of-legal-proceedings-initiated-by-the-company-company-update.jpg)
![Earnings Update Q1FY16 [Company Update]](https://img.pdfslide.us/doc/110x75/577cb4121a28aba7118c49d7/earnings-update-q1fy16-company-update.jpg)
![Company Update [Company Update]](https://img.pdfslide.us/doc/110x75/577c982f1a28ab163a8b480c/company-update-company-update.jpg)

![Quarterly Update [Company Update]](https://img.pdfslide.us/doc/110x75/577cb4b01a28aba7118c9d76/quarterly-update-company-update-578abd0f0e24d.jpg)
![Earnings Update Q3FY16 [Company Update]](https://img.pdfslide.us/doc/110x75/577ca5961a28abea748b9878/earnings-update-q3fy16-company-update.jpg)