Embed Size (px)
Citation preview
7/31/2019 indice raios
http://slidepdf.com/reader/full/indice-raios 1/9
P2.12 TROPICAL FREQUENCY AND DISTRIBUTION OF LIGHTNING BASED ON 10 YEARSOF OBSERVATIONS FROM SPACE BY THE LIGHTNING IMAGING SENSOR (LIS)
Rachel Albrecht*University of Maryland, College Park, Maryland
Steve GoodmanNOAA/NESDIS – NASA/GSFC, Greenbelt, Maryland
Dennis Buechler University of Alabama in Huntsville, Huntsville, Alabama
Themis ChronisHellenic Center for Marine Research, Greece
1. INTRODUCTION
Since its inception in late 1997, theTropical Rainfall Measuring Mission (TRMM)satellite has collected detailed measurements of
convective cloud systems over the tropics. TheLightning Imaging Sensor (LIS) aboard TRMMmeasures total lightning (intracloud and cloud-to-ground) using an optical staring imager. Thissensor identifies lightning activity by detectingchanges in the brightness of clouds as they areilluminated by lightning electrical discharges(Christian et al. 1999). A range of spatial, spectraland temporal filters are used to associate thesechanges into lightning (Christian et al., 2000).
LIS has a 600 km X 600 km field of viewwith a spatial resolution between 3 km (at nadir)and 6 km (at limb) (Christian et al., 1994). Since
TRMM travels with a velocity of 7 km s-1
relative toEarth's surface, LIS can monitor a position on theEarth for lightning activity for approximately 80 s.One flash in 80 s allows a minimum detectableflash (fl) rate of 0.7 fl min -1 (Cecil et al., 2005) andthe detection efficiency is estimated to be about85% (Boccippio et al., 2002). The 35 o inclination of TRMM orbit implies that locations near the equator are observed less frequently than the higher 35 o
latitude. This low-earth-orbiting feature requires aminimum period of 49 days for LIS instrument toobserve most locations on Earth at least once ineach local solar hour of the diurnal cycle(Boccippio et al., 1998; Boccippio et al., 2000).
Due to the low frequency of observationsnear the equator, total lightning climatology studiesusing LIS and the Optical Transient Detector weredone with a horizontal grid resolution of 2.5 or 0.5
* Corresponding author address : Rachel I. Albrecht,Cooperative Institute for Climate Studies (CICS), NOAA/ESSIC, University of Maryland, College Park, MD20740, e-mail: [email protected] .
degrees (Boccippio et al., 2000; Nesbitt et al,2000; Williams et al., 2000; Christian et al., 2003;Cecil, et al., 2005; Petersen et al., 2005; Cecil,2006). Among these studies, Boccippio et al.(2000) analyzed the regional differences in tropical
lightning distributions, addressing the differencesbetween land and ocean and various geographicregions. Christian et al. (2003) generated lightningclimatology maps based on 5 years of OTD totallightning measurements. These authors studiedthe geographical and seasonal distribution of lightning activity for the globe, pointing out thegreatest flash density areas.
Nowadays, LIS has collected lightningmeasurements for over 10 years. In this study, weconstructed climatology maps for the tropicalregion based on 10 years (1998-2007) of LIS totallightning data. As 10 years of measurements
correspond to a considerable sample of earth'selectrical activity over the equator, we constructedclimatology maps over the tropics using a higher horizontal resolution. In section 2 we detail thedata processing, and in section 3 we present theclimatology maps, the main regional differences,and the flash lightning maximum ranking aroundthe tropics.
2. METHODOLOGY
LIS raw data are a list of charged coupleddevice (CCD) events caused by optical pulses.Over these optical pulses, changes in the neutraloxygen emission line at 777.4 nm are monitored,corresponding to the strongest emission featuresin the cloud top optical spectra. Several spatial,spectral and temporal filters algorithms are used togeolocate the events, remove noise (Boccippio etal., 2002), and organize the remaining events intoflashes by a clustering algorithm (Christian et al.,2000). In this study, a horizontal spatial resolutionof 0.25 oX0.25 o is used, where the view time and
7/31/2019 indice raios
http://slidepdf.com/reader/full/indice-raios 2/9
7/31/2019 indice raios
http://slidepdf.com/reader/full/indice-raios 3/9
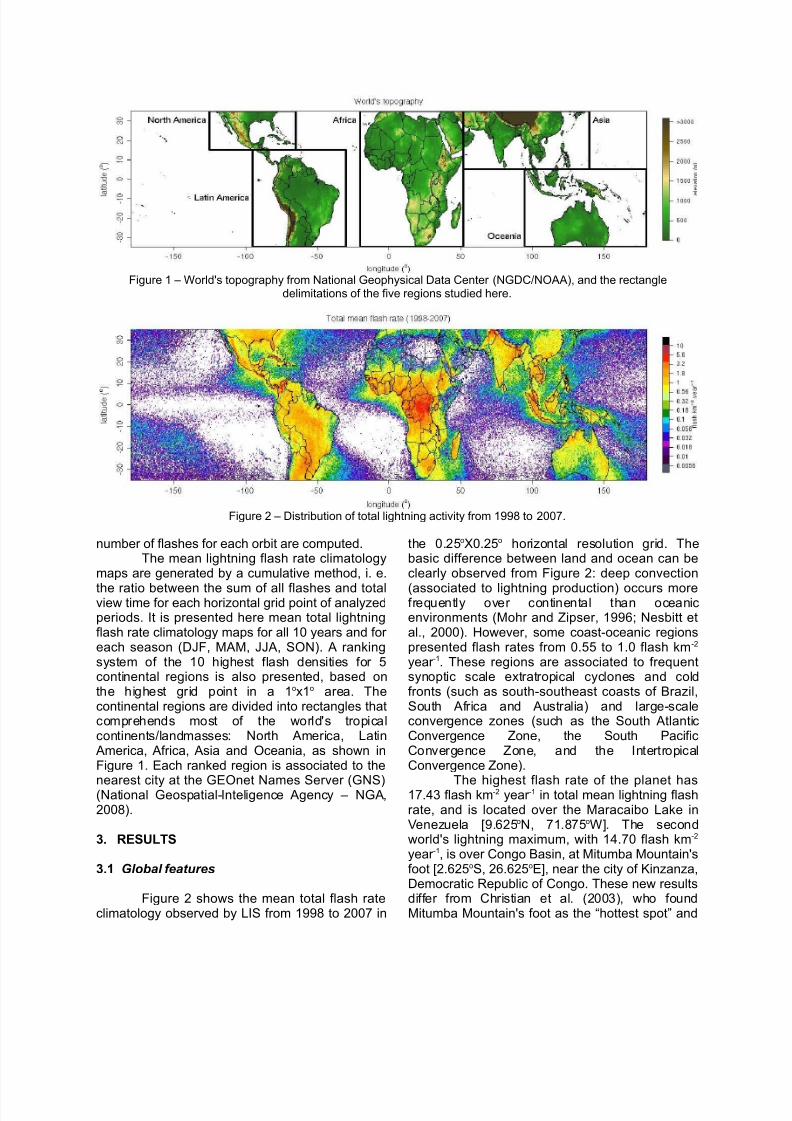
did not point Venezuela in their findings.The distribution of total mean lightning
activity over Lake Maracaibo and MitumbaMountain regions are shown in details in Figures 3and 4, respectively, and Figure 5 shows thecumulative frequency of total mean flash rate for these two regions. It can be seen from these threefigures that the world's maximum flash rate(Maracaibo Lake, Venezuela – Figure 3) is verylocalized surrounded by a few grid points over 5.6flash km -2 year -1, while the second maximum(Kinzanza, Dem. Rep. Congo – Figure 4) has amuch greater area of flash rates over 5.6.Moreover, 50% of Maracaibo lightning activitypresents flashes rates over 0.55 flash km -2 year -1
while 50% of Mitumba lightning activity presentsrates greater than 2.0 flash km -2 year -1. On the taildistribution of flash rates, i. e., greater than 5.6flash km -2 year -1, Congo has 13% of its grid pointswhile Northwestern South America has only 4%.Maracaibo Lake localized maximum featureexplains why this region wasn't found by Christianet al. (2003) on their analysis, once these author studied global lightning activity using a 0.5 ox0.5 o
composing grid with a 2.5 o spatial moving averageoperator.
Both first and second world's maximumflash rate are induced by complex topography. TheMaracaibo Lake is located inside AndesMountains, at their most north chain where Andesforms a fork of elevated terrain, up to ~3650 m of height (Figure 3). Negri et al. (2002) found anannual mean rainfall rate local maximum greater
than 0.6 mm h-1
over Maracaibo Lake, with adiurnal cycle peak from 0200 to 0400 local time.Figure 6 shows the local solar hourly mean flashrate for Northwestern South America and MitumbaMountain regions of Figures 3 and 4, respectively.The nocturnal maximum lighting activity is clearlyseen from 2300 to 0400 local solar hours (0.27 to0.32 flash km -2 year -1), and a second maximum isfound 1700-1800 (~0.25 flash km -2 year -1). Actually,nocturnal thunderstorms over Maracaibo Lake areso frequent that their lightning activity is locallyknown as the “Lighthouse of Catatumbo”, a localriver that ends southwest of Maracaibo Lake. The
“Lighthouse of Catatumbo” was used as a guideby Caribbean navigators in colonial times(Codazzi, 1841) and mentioned in the LaDragontea (1598) poem from the Spanish poetFelix Lope De Vega. Nowadays, these frequentthunderstorms are known as “The Never-EndingStorm of Catatumbo” and are explored by the localVenezuelan tourism with night trips tours toobserve the beautiful storms.
Figure 3 – Distribution of total lightning activity from 1998 to2007 over Northwestern South America. Gray “x” indicates
the planet's first hot spot , and the white lines indicate terrainelevation every 500 m.
Figure 4 – Distribution of total lightning activity from 1998 to2007 over Congo Basin Gray “x” indicates the planet's
second hot spot , and the white lines indicate terrainelevation every 500 m.
Figure 5 – Cumulative frequency distribution of total meanflash rate for the global region (Figure 2), Northwestern
South America (Figure 3), and Mitumba Mountain ( Figure 4 ).
Figure 6 – Local solar hourly mean flash rate for the globalregion (Figure 2), Northwestern South America (Figure 3),
and Mitumba Mountain (Figure 4).
7/31/2019 indice raios
http://slidepdf.com/reader/full/indice-raios 4/9
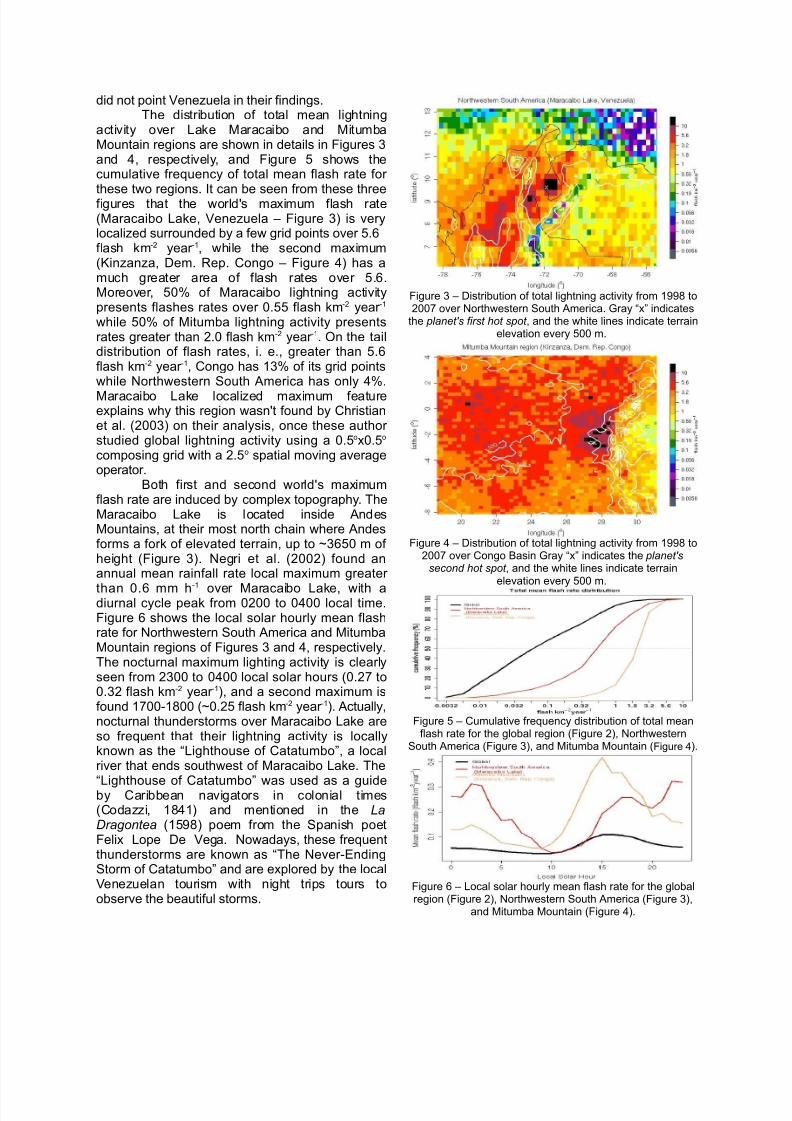
Kinzanza's maximum flash rate isaccompanied by high flash density (>5.6 flash km -2
year -1) from 3.25 oS to 0.25 oN and from 26.00 oE to28.75 oE, along the N-S Mitumba Mountain's westfoot at the Democratic Republic of Congo, whilethe rest of Congo's Basin presents flashes rates>3.2 flash km -2 year -1. Congo Basin is known for very deep convection (Boccippio et al., 2000;Nesbitt et al. 2000; Cecil et al. 2005) and has apeculiar difference in rainfall estimation from localrain gauges and satellites. McCollum et al. (2000)found that the Global Precipitation ClimatologyProject (GPCP) satellite estimates haveapproximately twice the magnitude of estimatesproduced from local rain gauges. These authorssuggested that the rain gauges sample is not theproblem and explained the discrepancy by uniquelocal physical properties of air masses and cloudmicrophysics for such deep convection and lowrainfall over this region: i) abundance of Saharanaerosols, resulting in abundance of cloudcondensation nuclei, small drops and inefficientrain process; and ii) convective clouds formingunder drier conditions, which in general havehigher cloud base heights, that could increase theevaporation rate of falling rain. The moisture flux atCentral Africa indicates a high westward transportfrom the Indian Ocean that is blocked by MitumbaMountains east face in the lower levels (1000-865mb), suggesting that convection at the west face of the mountains is initiated by a small but significantamount of eastward low-level moisture transportfrom Atlantic Ocean (McCollum et al., 2000). Drier
and higher cloud base environments can alsocontribute to stronger in-cloud updrafts, which canalso inhibit the warm cloud rain and enhance coldcloud rain, where the lightning is produced(Williams, et al. 2005; Carey et al., 2007; Albrechtet al., 2007). The lightning diurnal cycle of Figure 6shows that thunderstorms over Congo Basin aredriven by local solar heating, with a mean flashrate peak of 0.41 flash km -2 year -1 at 1500 Solar Local Hour.
High elevated and complex terrain regions(Figure 1) over the tropics can be identified by lowlighting activity in the mean total flash rateclimatology map (Figure 2). For example, theSouth America's Andes can be seen by a0.10-0.18 flash km -2 year -1 line over its top fromnorth Venezuela to south Chile, with mediumelectrical discharges of 0.56-1.8 flash km -2 year -1
around its east foot. Mitumba Mountains in CongoBasin has relatively lower mean total flash ratedensities (0.32-1.00 flash km -2 year -1) than its westfoot, and the Himalayas presents very low activity(0.1-1.8 flash km -2 year -1) all around its north foot(China).
3.2 Seasonal features
Figure 7 shows the seasonal distribution of total lightning from 1998 to 2007. Northern andSouthern hemispheric lightning activity followsseason solar activity, with higher flash rates over continental regions of South America, Africa andOceania in December-January-February (DJF),
Figure 7 – Seasonal distribution of total lightning activity from 1998 to 2007.
7/31/2019 indice raios
http://slidepdf.com/reader/full/indice-raios 5/9
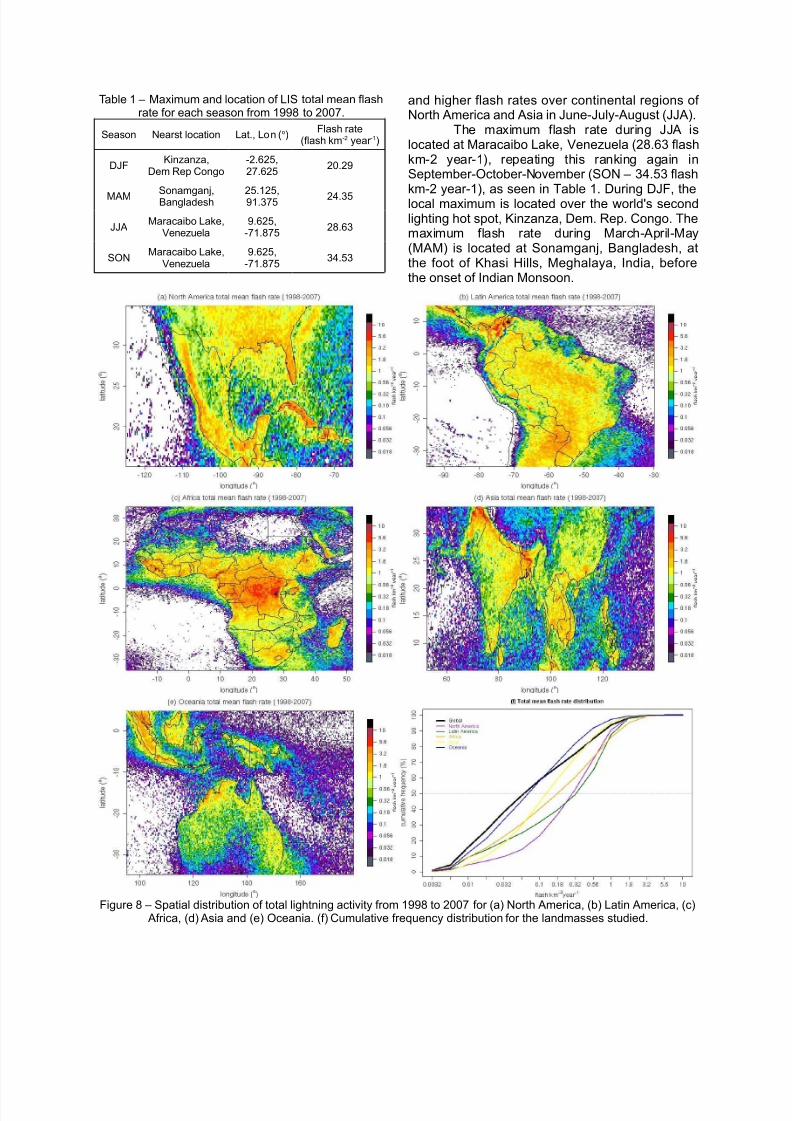
Table 1 – Maximum and location of LIS total mean flashrate for each season from 1998 to 2007.
Season Nearst location Lat., Lon ( o) Flash rate(flash km -2 year -1)
DJF Kinzanza,Dem Rep Congo
-2.625,27.625 20.29
MAMSonamganj,Bangladesh
25.125,91.375 24.35
JJA Maracaibo Lake,Venezuela
9.625,-71.875 28.63
SON Maracaibo Lake,Venezuela
9.625,-71.875 34.53
and higher flash rates over continental regions of North America and Asia in June-July-August (JJA).
The maximum flash rate during JJA islocated at Maracaibo Lake, Venezuela (28.63 flashkm-2 year-1), repeating this ranking again inSeptember-October-November (SON – 34.53 flashkm-2 year-1), as seen in Table 1. During DJF, thelocal maximum is located over the world's secondlighting hot spot, Kinzanza, Dem. Rep. Congo. Themaximum flash rate during March-April-May(MAM) is located at Sonamganj, Bangladesh, atthe foot of Khasi Hills, Meghalaya, India, beforethe onset of Indian Monsoon.
Figure 8 – Spatial distribution of total lightning activity from 1998 to 2007 for (a) North America, (b) Latin America, (c) Africa, (d) Asia and (e) Oceania. (f) Cumulative frequency distribution for the landmasses studied.

7/31/2019 indice raios
http://slidepdf.com/reader/full/indice-raios 6/9
3.3 Reginal features
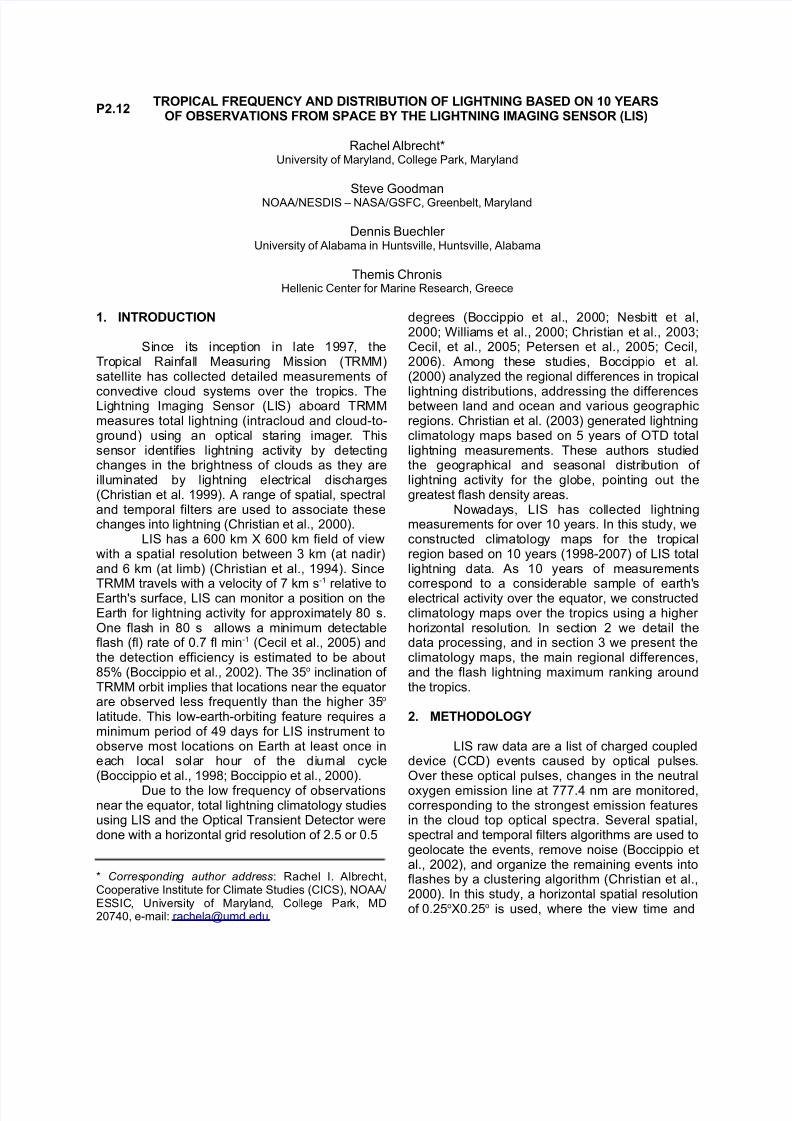
Spatial lightning flash rate distribution for the major tropical landmasses (North America,Latin America, Africa, Asia and Oceania – Figure1) is presented in Figures 8a-e, while thecumulative frequency distribution of flash rates for these landmasses are presented in Figure 8f.Tables 2, 3, 4, 5 and 6 show the ranking of the tenhighest flash rate locations for each one of thelandmasses, respectively.
It can be seen from Figure 8 that North America and Latin America regions have most of their land with mean flash rates higher than 0.28flash km -2 year -1 (50% and 47%, respectively),while Africa has a higher distribution of higher flashrates (over 28% of >0.56 flash km -2 year -1). Asiaand Oceania presented higher percentages of lower flash rates, with 50% of the lightning activitylower than 0.13 and 0.11 flash km -2 year -1,respectively. The hot spots over North America(Table 2) are concentrated over Cuba and Haiti,with the first maximum at Finca Cocuyo [22.875 oN,82.125 oW] having 7.59 flash km -2 year -1. Note thatNorth America's first place is less than half electrical active than world's hottest spot(Kinzanza, Dem. Rep. Congo, 17.43 flash km -2
year -1). Mexico is in the 6 th place, with 5.86 flashkm -2 year -1 at Pedreira Segunda Seccion[17.625 oN, 93.625 oW] at the Sierra Madre del Sur'sfoot. Mexico was also ranked as the 8 th and 9 th
highest flash density of this region, at Las Torres[22.375 oN, 105.375 oW] and Mesa Los Leales[26.375 oN, 107.875 oW], respectively, both east of the Sierra Madre del Norte. United States of
America appears only in 10 th place, with 5.07 flashkm -2 year -1 at Orangetree, Florida.
Latin America highest flash rates areconcentrated at Northwestern-Western South
America and Central America, having 8 of the 10ranking places (Table 3). The first one is, of course, the world's hottest spot, Maracaibo Lake,at Venezuela, 17.43 flash km -2 year -1. The secondcity ranked is also in Venezuela, San Carlos, with11.53 flash km -2 year -1, while the 3 rd, 4 th and 6 th
place are over Colombia, at Andes' foot. Boliviahas the 5 th Latin America highest flash density(6.59 flash km -2 year -1), west of Andes' foot, while
Argentina has the last two places (EstanciaNoetinger-Lepetit – 5.27 flash km -2 year -1, andCancha Mercedes – 5.18 flash km -2 year -1).
Africa has 8 of the 10 highest flashdensities over the Congo Basin (Dem. Rep.Congo, Table 4). This landmass has the highestfrequency of flash rates greater than 0.9 flash km -2
year -1, that is 17%. Therefore, the 10 th Africa'shighest flash density (Kingombe, Dem. Rep.Congo) has 7.48 flash km -2 year -1, comparable toNorth America hottest point (Finca Cocuyo, Cuba
– 7.59 flash km -2 year -1). Besides Congo Basin,Cameroon (east Africa), has the 6 th and 8 th
Table 2 – Maximums and locations of LIS total meanflash rate over North America.
Rank Nearst location Lat., Lon ( o) Flash rate(flash km -2 year -1)
1 Finca Cocuyo,Cuba
22.875,-82.125 7.59
2 Rio Seco,Cuba
22.375,-84.125 6.72
3 Savanette,Haiti
19.125,-72.125 6.29
4 Miranda,Cuba
20.375,-75.875 6.05
5 Conformidad,Cuba
22.875,-82.625 5.98
6 Pedr. Seg. Seccion,Mexico 17.625,-93.625 5.86
7 Bahia de Yara,Cuba
20.375,-77.125 5.84
8 Las Torres,Mexico
22.375,-105.375 5.81
9 Mesa Los Leales,Mexico
26.375,-107.875 5.45
10 Orangetree, FloridaUSA
26.375,-81.625 5.07
Table 3 – Maximums and locations of LIS total meanflash rate over Latin America.
Rank Nearst location Lat., Lon ( o) Flash rate(flash km -2 year -1)
1 Lake Maracaibo,Venezuela
9.625,-71.875 17.43
2 San Carlos,Venezuela
9.125,-72.875 11.56
3 El Garcero,Colombia
8.375,-74.625 10.48
4 Nuevo Horizonte,Colombia
8.875,-74.375 10.14
5 Finca La Primavera,Guatemala
14.375,-91.125 7.96
6 Labaredos,Colombia 5.375,-74.975 7.60
7 Quebrada La Union,Colombia
6.125,-75.625 7.25
8 Icuna,Bolivia
-17.125,-65.125 6.59
9 Estancia Noetinger-Lepetit, Arugentina
-27.125,-59.625 5.27
10 Cancha Mercedes, Argentina
-25.626,-57.875 5.18
7/31/2019 indice raios
http://slidepdf.com/reader/full/indice-raios 7/9
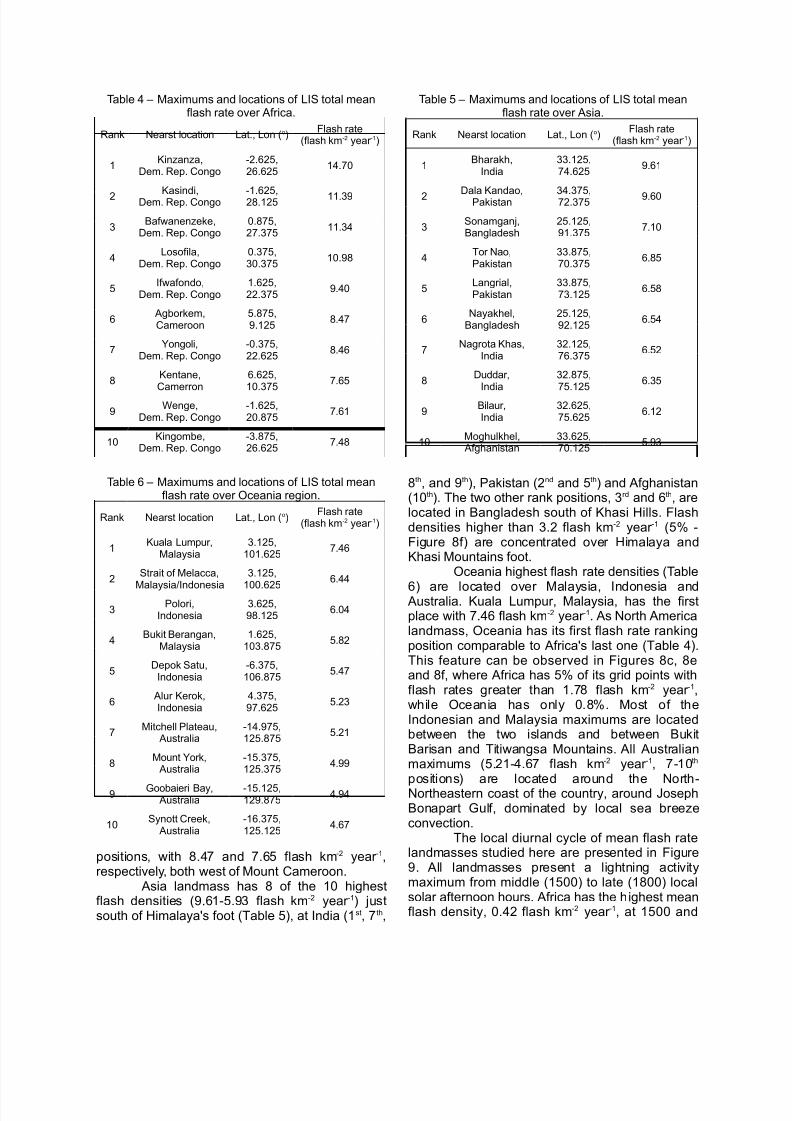
Table 4 – Maximums and locations of LIS total meanflash rate over Africa.
Rank Nearst location Lat., Lon ( o) Flash rate(flash km -2 year -1)
1 Kinzanza,Dem. Rep. Congo
-2.625,26.625 14.70
2Kasindi,
Dem. Rep. Congo-1.625,28.125 11.39
3 Bafwanenzeke,Dem. Rep. Congo
0.875,27.375 11.34
4 Losofila,Dem. Rep. Congo
0.375,30.375 10.98
5 Ifwafondo,Dem. Rep. Congo
1.625,22.375 9.40
6 Agborkem,Cameroon
5.875,9.125 8.47
7 Yongoli,Dem. Rep. Congo
-0.375,22.625 8.46
8 Kentane,Camerron
6.625,10.375 7.65
9 Wenge,Dem. Rep. Congo
-1.625,20.875 7.61
10 Kingombe,Dem. Rep. Congo
-3.875,26.625 7.48
Table 5 – Maximums and locations of LIS total meanflash rate over Asia.
Rank Nearst location Lat., Lon ( o) Flash rate(flash km -2 year -1)
1 Bharakh,India
33.125,74.625 9.61
2Dala Kandao,
Pakistan34.375,72.375 9.60
3 Sonamganj,Bangladesh
25.125,91.375 7.10
4 Tor Nao,Pakistan
33.875,70.375 6.85
5 Langrial,Pakistan
33.875,73.125 6.58
6 Nayakhel,Bangladesh
25.125,92.125 6.54
7 Nagrota Khas,India
32.125,76.375 6.52
8 Duddar,India
32.875,75.125 6.35
9 Bilaur,India
32.625,75.625 6.12
10 Moghulkhel, Afghanistan
33.625,70.125 5.93
Table 6 – Maximums and locations of LIS total meanflash rate over Oceania region.
Rank Nearst location Lat., Lon ( o) Flash rate(flash km -2 year -1)
1 Kuala Lumpur,Malaysia
3.125,101.625 7.46
2 Strait of Melacca,
Malaysia/Indonesia
3.125,
100.6256.44
3 Polori,Indonesia
3.625,98.125 6.04
4 Bukit Berangan,Malaysia
1.625,103.875 5.82
5 Depok Satu,Indonesia
-6.375,106.875 5.47
6 Alur Kerok,Indonesia
4.375,97.625 5.23
7 Mitchell Plateau, Australia
-14.975,125.875 5.21
8 Mount York, Australia
-15.375,125.375 4.99
9 Goobaieri Bay, Australia
-15.125,129.875 4.94
10 Synott Creek, Australia
-16.375,125.125 4.67
positions, with 8.47 and 7.65 flash km -2 year -1,respectively, both west of Mount Cameroon.
Asia landmass has 8 of the 10 highestflash densities (9.61-5.93 flash km -2 year -1) justsouth of Himalaya's foot (Table 5), at India (1 st , 7 th,
8 th, and 9 th), Pakistan (2 nd and 5 th) and Afghanistan(10 th). The two other rank positions, 3 rd and 6 th, arelocated in Bangladesh south of Khasi Hills. Flashdensities higher than 3.2 flash km -2 year -1 (5% -Figure 8f) are concentrated over Himalaya andKhasi Mountains foot.
Oceania highest flash rate densities (Table
6) are located over Malaysia, Indonesia and Australia. Kuala Lumpur, Malaysia, has the firstplace with 7.46 flash km -2 year -1. As North Americalandmass, Oceania has its first flash rate rankingposition comparable to Africa's last one (Table 4).This feature can be observed in Figures 8c, 8eand 8f, where Africa has 5% of its grid points withflash rates greater than 1.78 flash km -2 year -1,while Oceania has only 0.8%. Most of theIndonesian and Malaysia maximums are locatedbetween the two islands and between BukitBarisan and Titiwangsa Mountains. All Australianmaximums (5.21-4.67 flash km -2 year -1, 7-10 th
positions) are located around the North-Northeastern coast of the country, around JosephBonapart Gulf, dominated by local sea breezeconvection.
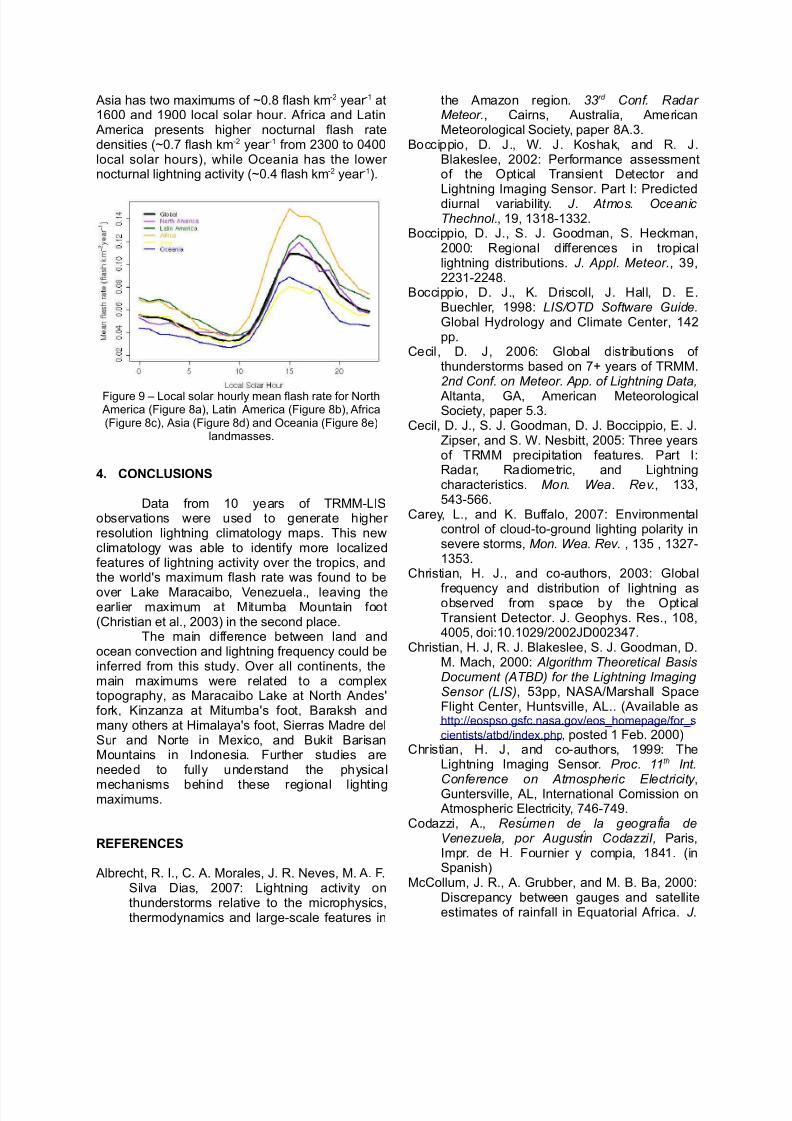
The local diurnal cycle of mean flash ratelandmasses studied here are presented in Figure9. All landmasses present a lightning activitymaximum from middle (1500) to late (1800) localsolar afternoon hours. Africa has the highest meanflash density, 0.42 flash km -2 year -1, at 1500 and
7/31/2019 indice raios
http://slidepdf.com/reader/full/indice-raios 8/9
Asia has two maximums of ~0.8 flash km -2 year -1 at1600 and 1900 local solar hour. Africa and Latin
America presents higher nocturnal flash ratedensities (~0.7 flash km -2 year -1 from 2300 to 0400local solar hours), while Oceania has the lower nocturnal lightning activity (~0.4 flash km -2 year -1).
Figure 9 – Local solar hourly mean flash rate for North America (Figure 8a), Latin America (Figure 8b), Africa
(Figure 8c), Asia (Figure 8d) and Oceania (Figure 8e)landmasses.
4. CONCLUSIONS
Data from 10 years of TRMM-LISobservations were used to generate higher resolution lightning climatology maps. This newclimatology was able to identify more localizedfeatures of lightning activity over the tropics, andthe world's maximum flash rate was found to beover Lake Maracaibo, Venezuela., leaving theearlier maximum at Mitumba Mountain foot(Christian et al., 2003) in the second place.
The main difference between land andocean convection and lightning frequency could beinferred from this study. Over all continents, themain maximums were related to a complextopography, as Maracaibo Lake at North Andes'fork, Kinzanza at Mitumba's foot, Baraksh andmany others at Himalaya's foot, Sierras Madre delSur and Norte in Mexico, and Bukit BarisanMountains in Indonesia. Further studies areneeded to fully understand the physical
mechanisms behind these regional lightingmaximums.
REFERENCES
Albrecht, R. I., C. A. Morales, J. R. Neves, M. A. F.Silva Dias, 2007: Lightning activity onthunderstorms relative to the microphysics,thermodynamics and large-scale features in
the Amazon region. 33rd Conf. Radar Meteor., Cairns, Australia, AmericanMeteorological Society, paper 8A.3.
Boccippio, D. J., W. J. Koshak, and R. J.Blakeslee, 2002: Performance assessmentof the Optical Transient Detector andLightning Imaging Sensor. Part I: Predicteddiurnal variability. J. Atmos. Oceanic Thechnol., 19, 1318-1332.
Boccippio, D. J., S. J. Goodman, S. Heckman,2000: Regional differences in tropicallightning distributions. J. Appl. Meteor., 39,2231-2248.
Boccippio, D. J., K. Driscoll, J. Hall, D. E.Buechler, 1998: LIS/OTD Software Guide.Global Hydrology and Climate Center, 142pp.
Cecil, D. J, 2006: Global distributions of thunderstorms based on 7+ years of TRMM.2nd Conf. on Meteor. App. of Lightning Data,
Altanta, GA, American MeteorologicalSociety, paper 5.3.
Cecil, D. J., S. J. Goodman, D. J. Boccippio, E. J.Zipser, and S. W. Nesbitt, 2005: Three yearsof TRMM precipitation features. Part I:Radar, Radiometric, and Lightningcharacteristics. Mon. Wea. Rev., 133,543-566.
Carey, L., and K. Buffalo, 2007: Environmentalcontrol of cloud-to-ground lighting polarity insevere storms, Mon. Wea. Rev. , 135 , 1327-1353.
Christian, H. J., and co-authors, 2003: Global
frequency and distribution of lightning asobserved from space by the OpticalTransient Detector. J. Geophys. Res., 108,4005, doi:10.1029/2002JD002347.
Christian, H. J, R. J. Blakeslee, S. J. Goodman, D.M. Mach, 2000: Algorithm Theoretical BasisDocument (ATBD) for the Lightning Imaging Sensor (LIS), 53pp, NASA/Marshall SpaceFlight Center, Huntsville, AL.. (Available ashttp://eospso.gsfc.nasa.gov/eos_homepage/for_scientists/atbd/index.php , posted 1 Feb. 2000)
Christian, H. J, and co-authors, 1999: TheLightning Imaging Sensor. Proc. 11th Int.
Conference on Atmospheric Electricity ,Guntersville, AL, International Comission on Atmospheric Electricity, 746-749.
Codazzi, A., Resúmen de la geografia deVenezuela, por Augustín CodazziI, Paris,Impr. de H. Fournier y compia, 1841. (inSpanish)
McCollum, J. R., A. Grubber, and M. B. Ba, 2000:Discrepancy between gauges and satelliteestimates of rainfall in Equatorial Africa. J.
7/31/2019 indice raios
http://slidepdf.com/reader/full/indice-raios 9/9
Appl. Metor., 39, 666-679.Mohr, K. I., and E. J. Zipser, 1996: Defining
mesoscale convective systems by their 85Ghzice-scattering signatures. Bull. Amer.Meteor. Soc., 77, 1179-1189.
National Geospatial-Intelligence Agency – NGA,2008: GEOnet Names Server, CompleteFiles of Geographic Names for Geopolitical
Areas from GNS. (Available as http://earth-info.nga.mil/gns/html/geonames_dd_dms_date_20081223.zip , posted 23 Dec 2008).
Nesbitt, S. W., E. J. Zipser, D. J. Cecil, 2000: Acensus of precipitation features in the tropicsusing TRMM: Radar, ice scattering, andlightning observations. J. Climate, 13,4087-4106.
Petersen, W. A., H. J. Christian, and Steven A.
Rutledge, 2005: TRMM observations of theglobal relationship between ice water contentand lightning. Geophys. Res. Lett., 32,L14819, doi:10.1029/2005GL023236.
Williams, E., V. Mushtak, D. Rosenfeld, S.Goodman, and D. Boccippio, 2005:Thermodynamic conditions favorable tosuperlative thunderstorm updraft, mixedphase microphysics and lightning flash rate,
Atm. Res., 76, 288-306.Williams, E., K. Rothkin, D. Stevenson, D.
Boccippio, 2000: Global lightning variationscaused by changes in thunderstorm flashrate and by changes in the number of thunderstorms. J. Appl. Meteor., 39,2223-2230.