Embed Size (px)
Citation preview
The Macaulay Institute
Apri
White V., McCrum G., Bla
The MacauCraigie
AbeAB1
INDICAT
SUSTAIN
SUSTAINAB
SOME EXA
ORS OF
ABILITY &
LE TOURISM:
MPLE SETS
l 2006
ckstock K.L., and Scott A. lay Institute buckler
rdeen 5 8QH
CONTENTS
1. Introduction 1 2. World Tourism Organisation Indicators 2 3. UN Commission on Sustainable Development-
Indicators of Sustainable Development 6 4. OECD Indicators of Environmental Sustainability 8 5. European Environment Agency 12 6. UK Sustainable Development Indicators 15 7. Spanish System of Environmental Tourism Indicators 17 8. English Tourism Council: National Sustainable Tourism
Indicators 2002 18 9. Scotland: ‘Meeting the Needs’ - Indicators of
Sustainable Development 19 10. Green Globe 21: The Douglas Shire Community
Working Group Experience 20 11. Cairngorms National Park: Park Plan (Proposed) Indicators 21 12. Cairngorms National Park: Sustainable Tourism Strategy 22 13. Conclusion 23 Abbreviations CNPA Cairngorm National Park Authority FT/PT Full-time; part-time SD Sustainable Development ST Sustainable Tourism STI Sustainable Tourism Indicator ViSIT Visitor Service, Information and Tourism This work was part of a SEERAD funded project on Sustainable Rural Development (RO203909). The authors would like to acknowledge the input by Cairngorm National Park Authority staff and members of the ViSIT forum during the life of this project. "Any use which a third party makes of this document, or any reliance upon it, or decisions to be made based upon it, are the responsibility of such a third party. The Macaulay Institute accepts no duty of care or liability whatsoever to any such third party, and no responsibility for damages, if any, suffered by any third party as a result of decisions or actions taken or not taken on the basis of the contents of this document."

1
1 Introduction The Cairngorms National Park has been awarded the ‘European Charter for Sustainable Tourism in Protected Areas’ and the CNPA is currently working towards adopting and applying a set of indicators. In support of this work, the Macaulay Institute has provided the CNPA with a report that provides a suggested approach to selecting and implementing indicators of sustainable tourism (see ‘A Framework for Developing Indicators of Sustainable Tourism’). The project aimed to support the CNPA and their ViSIT forum by providing a structure for thinking through the process of selecting indicators that encouraged transparency and deliberation by asking provocative questions, rather than providing ‘answers’. This document provides some example sets of indictors that may be usefully considered by the CNPA and the ViSIT forum. It consists of tables of existing indicators sets that may be appropriate for adoption or adaptation for the Cairngorms National Park. It is one of three supplementary documents to the Framework report. The others are:
• Indicators and Sustainable Tourism: Interview Findings. • Indicators and Sustainable Tourism: Literature Review.
2
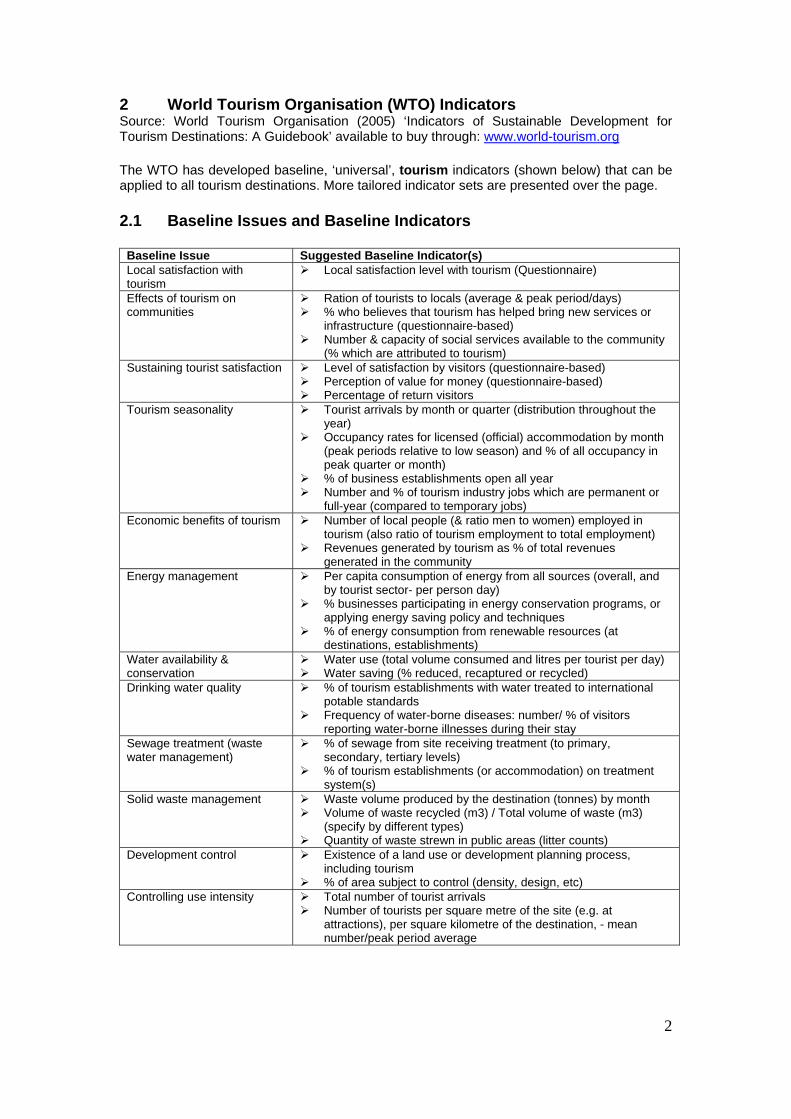
2 World Tourism Organisation (WTO) Indicators Source: World Tourism Organisation (2005) ‘Indicators of Sustainable Development for Tourism Destinations: A Guidebook’ available to buy through: www.world-tourism.org The WTO has developed baseline, ‘universal’, tourism indicators (shown below) that can be applied to all tourism destinations. More tailored indicator sets are presented over the page. 2.1 Baseline Issues and Baseline Indicators
Baseline Issue Suggested Baseline Indicator(s) Local satisfaction with tourism
Local satisfaction level with tourism (Questionnaire)
Effects of tourism on communities
Ration of tourists to locals (average & peak period/days) % who believes that tourism has helped bring new services or
infrastructure (questionnaire-based) Number & capacity of social services available to the community
(% which are attributed to tourism) Sustaining tourist satisfaction Level of satisfaction by visitors (questionnaire-based)
Perception of value for money (questionnaire-based) Percentage of return visitors
Tourism seasonality Tourist arrivals by month or quarter (distribution throughout the year)
Occupancy rates for licensed (official) accommodation by month (peak periods relative to low season) and % of all occupancy in peak quarter or month)
% of business establishments open all year Number and % of tourism industry jobs which are permanent or
full-year (compared to temporary jobs) Economic benefits of tourism Number of local people (& ratio men to women) employed in
tourism (also ratio of tourism employment to total employment) Revenues generated by tourism as % of total revenues
generated in the community Energy management Per capita consumption of energy from all sources (overall, and
by tourist sector- per person day) % businesses participating in energy conservation programs, or
applying energy saving policy and techniques % of energy consumption from renewable resources (at
destinations, establishments) Water availability & conservation
Water use (total volume consumed and litres per tourist per day) Water saving (% reduced, recaptured or recycled)
Drinking water quality % of tourism establishments with water treated to international potable standards
Frequency of water-borne diseases: number/ % of visitors reporting water-borne illnesses during their stay
Sewage treatment (waste water management)
% of sewage from site receiving treatment (to primary, secondary, tertiary levels)
% of tourism establishments (or accommodation) on treatment system(s)
Solid waste management Waste volume produced by the destination (tonnes) by month Volume of waste recycled (m3) / Total volume of waste (m3)
(specify by different types) Quantity of waste strewn in public areas (litter counts)
Development control Existence of a land use or development planning process, including tourism
% of area subject to control (density, design, etc) Controlling use intensity Total number of tourist arrivals
Number of tourists per square metre of the site (e.g. at attractions), per square kilometre of the destination, - mean number/peak period average

3
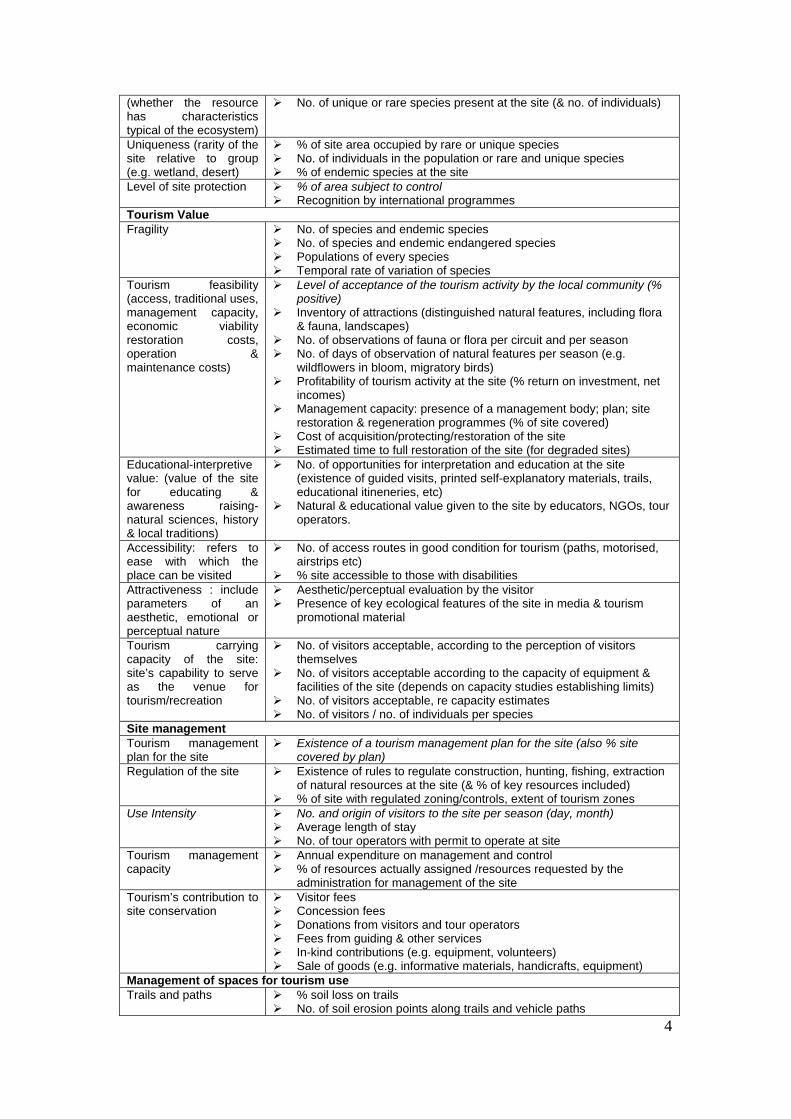
2.2 Destination Applications The WTO has suggested indicators for specific destination areas. Included here are the suggestions which could be relevant to the Cairngorms National Park: ‘Parks and Protected Area’; ‘Communities within or adjacent to Protected Areas’; and ‘Natural and Sensitive Ecological Sites’. (Italic indicates a ‘Baseline Indicator’)
Destination: Parks & Protected Areas Suggested Indicators Issues Indicators Visitor numbers Total number of visitors to the Park and to key sites
Peak numbers (peak day, month) Length of stay Use intensity on key sites (persons per km2) Revenue from paid visitors Number of guides/operators permitted to use park % of all visitors who are in controlled/guided visits
Integrity of key protected systems
Number of sites/ecosystems/assets considered to be damaged or threatened (% of all defined systems/assets in protected area)
Indicators of health related to key plant & animal species % of park hardened for visitor or other use % of protected area subject to different levels of control
Damage attributable to visitor activity
% of protected system in degraded condition (where possible classified due to cause)
% trails & routes (length) in damaged condition Cost of repair to damaged systems (annually) % of park area affected by unauthorised activities (hunting, tree cutting,
poaching etc) Number of incidents of poaching identified
Level of visitor control and monitoring
Number of human/animal contacts reported involving injury or risk of injury
Number of crimes against tourists Number of incidents of vandalism % visitors who do not pay for entry (where entry fee is charged) Number of wardens or control staff (and number per tourist)
Marketing Amount spent on marketing the protected area Management Number of park officials (wardens, managers, maintenance etc)
Number of enforcement personnel per visitor Cost of protection Number of public/community meetings held with stakeholders including
local periphery communities Ratio of revenues to costs for Park operations
Destination: Communities within or adjacent to Protected Areas Suggested Indicators Impacts of community activity on the park- management & protection
Number of incidents regarding violation of park rules by local residents
Impacts of the park on community residents
Opinion of the value/relationship of the protected area to the community (questionnaire based)
Number of complaints to park management Degree to which co-planning & management is done Level of co-operation between the protected area and park community
Existence of a participatory process to community and protected area collaboration in planning & management
Degree of/frequency of participation in participatory processes Alternative tourism programmes in adjacent communities promoted or
organised at the park (number and capacity, participation, tourist satisfaction with programmes)
Destination: Natural and Sensitive Ecological Sites Suggested Indicators Ecological Value Representativeness No. of species typical of the area present at the site (& no. individuals)
4
(whether the resource has characteristics typical of the ecosystem)
No. of unique or rare species present at the site (& no. of individuals)
Uniqueness (rarity of the site relative to group (e.g. wetland, desert)
% of site area occupied by rare or unique species No. of individuals in the population or rare and unique species % of endemic species at the site
Level of site protection % of area subject to control Recognition by international programmes
Tourism Value Fragility No. of species and endemic species
No. of species and endemic endangered species Populations of every species Temporal rate of variation of species
Tourism feasibility (access, traditional uses, management capacity, economic viability restoration costs, operation & maintenance costs)
Level of acceptance of the tourism activity by the local community (% positive)
Inventory of attractions (distinguished natural features, including flora & fauna, landscapes)
No. of observations of fauna or flora per circuit and per season No. of days of observation of natural features per season (e.g.
wildflowers in bloom, migratory birds) Profitability of tourism activity at the site (% return on investment, net
incomes) Management capacity: presence of a management body; plan; site
restoration & regeneration programmes (% of site covered) Cost of acquisition/protecting/restoration of the site Estimated time to full restoration of the site (for degraded sites)
Educational-interpretive value: (value of the site for educating & awareness raising- natural sciences, history & local traditions)
No. of opportunities for interpretation and education at the site (existence of guided visits, printed self-explanatory materials, trails, educational itineneries, etc)
Natural & educational value given to the site by educators, NGOs, tour operators.
Accessibility: refers to ease with which the place can be visited
No. of access routes in good condition for tourism (paths, motorised, airstrips etc)
% site accessible to those with disabilities Attractiveness : include parameters of an aesthetic, emotional or perceptual nature
Aesthetic/perceptual evaluation by the visitor Presence of key ecological features of the site in media & tourism
promotional material
Tourism carrying capacity of the site: site’s capability to serve as the venue for tourism/recreation
No. of visitors acceptable, according to the perception of visitors themselves
No. of visitors acceptable according to the capacity of equipment & facilities of the site (depends on capacity studies establishing limits)
No. of visitors acceptable, re capacity estimates No. of visitors / no. of individuals per species
Site management Tourism management plan for the site
Existence of a tourism management plan for the site (also % site covered by plan)
Regulation of the site Existence of rules to regulate construction, hunting, fishing, extraction of natural resources at the site (& % of key resources included)
% of site with regulated zoning/controls, extent of tourism zones Use Intensity No. and origin of visitors to the site per season (day, month)
Average length of stay No. of tour operators with permit to operate at site
Tourism management capacity
Annual expenditure on management and control % of resources actually assigned /resources requested by the
administration for management of the site Tourism’s contribution to site conservation
Visitor fees Concession fees Donations from visitors and tour operators Fees from guiding & other services In-kind contributions (e.g. equipment, volunteers) Sale of goods (e.g. informative materials, handicrafts, equipment)
Management of spaces for tourism use Trails and paths % soil loss on trails
No. of soil erosion points along trails and vehicle paths

5
% of protected area in eroded or degraded state Vehicular congestion (average travel times on main access routes
during high/low season Camping areas and accommodation
Area or campsites per tent No. of campfires allowed for camping areas No. of erosion points in camping areas Total density of camping use (persons per m2 in peak season) No. of campers per toilet No. of beds (other accommodation) % of occupancy of camping sites and accommodation
Community Participation Local community participation
% of local products and service consumed by tourism (at least 70% of goods and services acquired for tourism operation of the site from local enterprises or individuals)
Employment of local residents in site management and tourism operations (numbers, income levels)
Level of satisfaction of residents regarding tourism development in the area- particularly regarding that targeting natural systems
Level of assistance to local environmental awareness: no. of local awareness-raising actions (courses, meetings, promotion of content in the curriculum of local educational system, etc)
Ecosystem Management Water quality Water quality: contaminants in surface water and ground water
Turbidity of streams Air, noise pollution Noise pollution due to motors: visitors perceiving annoying motor
noises (cars, launches, motorcycles, planes, generators) in natural areas
Impacts on flora and fauna
Biodiversity index of flora and fauna Population sizes of key species No. of introduced species (exotic fauna and/or flora) (% of total) Level of illegal hunting & fishing at site during high season (loss of
animals, number of incidents) Loss of species due to use as tourism souvenirs No. fauna run over by traffic (road kills) during high season (ratio to
low season) % increase in infectious diseases to flora and fauna of site Frequency of species census % variation of species
Aesthetics Amount of litter in natural areas (seasonality of waste can relate to tourist numbers)
Presence of visual barriers, visual pollution Existence of viewpoints Scenic valuation by tourists (perception- questionnaire)
Visitor satisfaction Visitors Level of satisfaction of visitors Intermediaries Opinion of local Tour Operators (% with favourable opinion)
Opinion of foreign tour operators (% with favourable opinion)
6
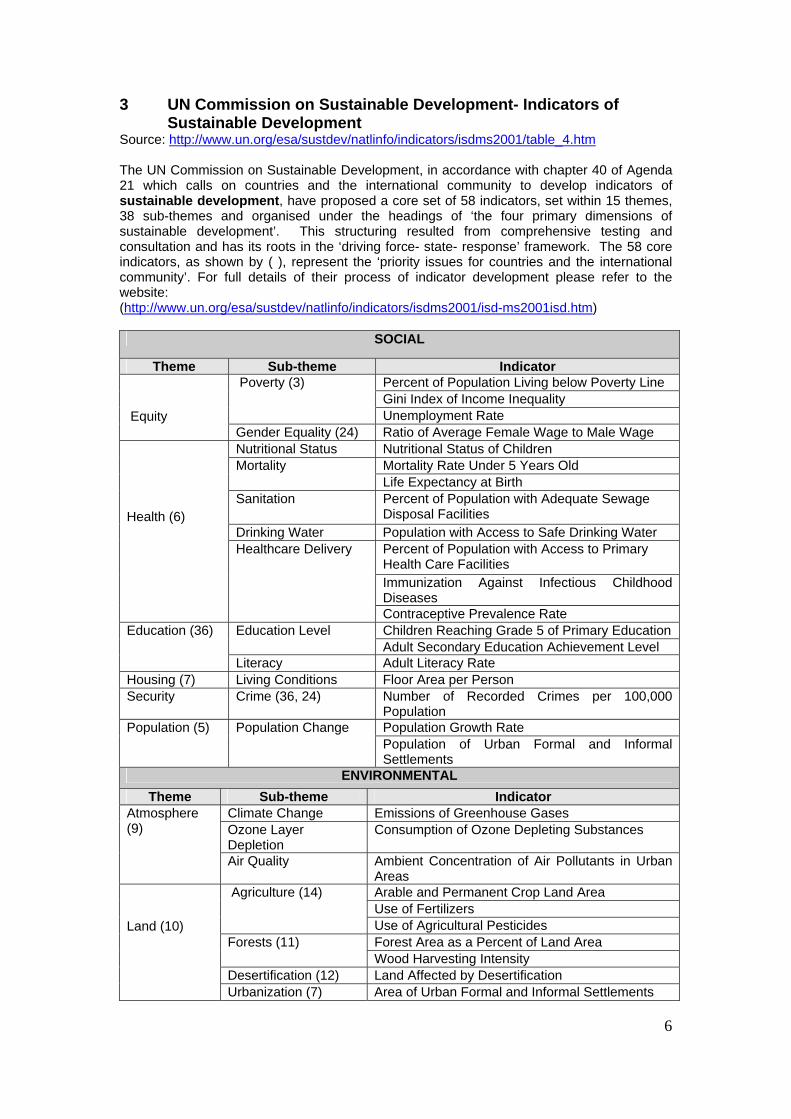
3 UN Commission on Sustainable Development- Indicators of Sustainable Development
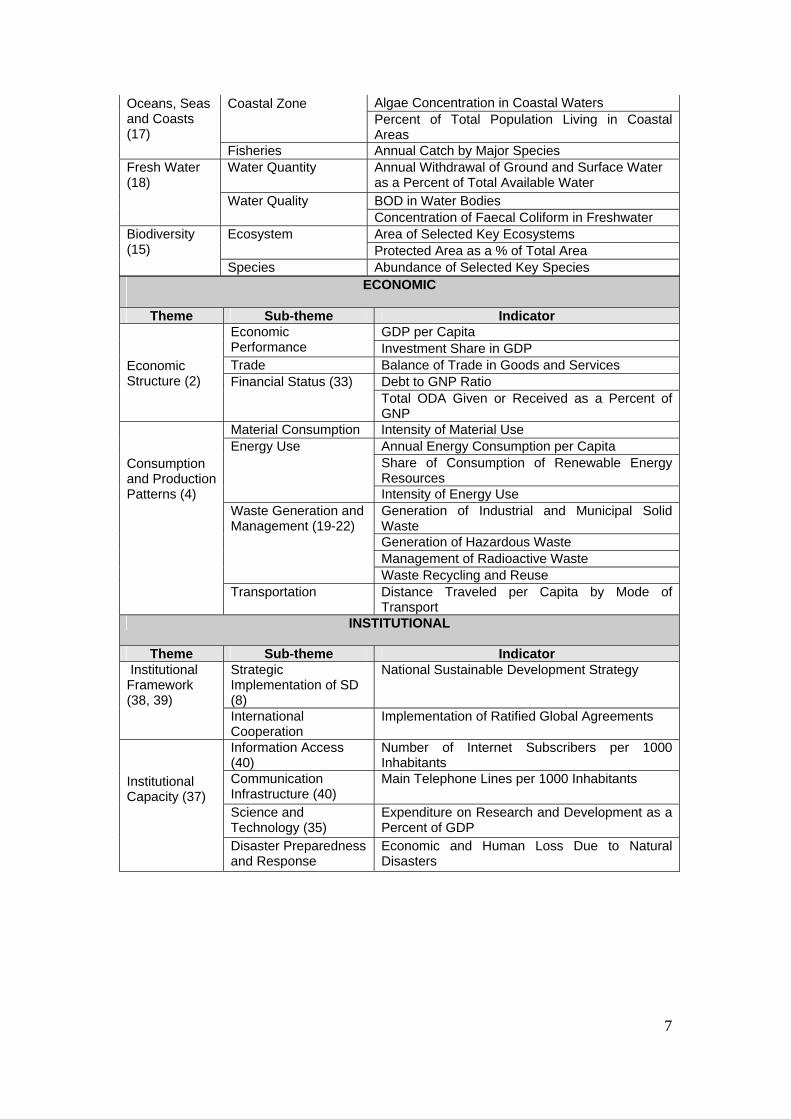
Source: http://www.un.org/esa/sustdev/natlinfo/indicators/isdms2001/table_4.htm The UN Commission on Sustainable Development, in accordance with chapter 40 of Agenda 21 which calls on countries and the international community to develop indicators of sustainable development, have proposed a core set of 58 indicators, set within 15 themes, 38 sub-themes and organised under the headings of ‘the four primary dimensions of sustainable development’. This structuring resulted from comprehensive testing and consultation and has its roots in the ‘driving force- state- response’ framework. The 58 core indicators, as shown by ( ), represent the ‘priority issues for countries and the international community’. For full details of their process of indicator development please refer to the website: (http://www.un.org/esa/sustdev/natlinfo/indicators/isdms2001/isd-ms2001isd.htm)
SOCIAL
Theme Sub-theme Indicator Percent of Population Living below Poverty Line Gini Index of Income Inequality
Poverty (3)
Unemployment Rate
Equity Gender Equality (24) Ratio of Average Female Wage to Male Wage Nutritional Status Nutritional Status of Children
Mortality Rate Under 5 Years Old Mortality Life Expectancy at Birth
Sanitation Percent of Population with Adequate Sewage Disposal Facilities
Drinking Water Population with Access to Safe Drinking Water Percent of Population with Access to Primary Health Care Facilities Immunization Against Infectious Childhood Diseases
Health (6)
Healthcare Delivery
Contraceptive Prevalence Rate Children Reaching Grade 5 of Primary Education Education Level Adult Secondary Education Achievement Level
Education (36)
Literacy Adult Literacy Rate Housing (7) Living Conditions Floor Area per Person Security Crime (36, 24) Number of Recorded Crimes per 100,000
Population Population Growth Rate Population (5) Population Change Population of Urban Formal and Informal Settlements
ENVIRONMENTAL Theme Sub-theme Indicator
Climate Change Emissions of Greenhouse Gases Ozone Layer Depletion
Consumption of Ozone Depleting Substances Atmosphere (9)
Air Quality Ambient Concentration of Air Pollutants in Urban Areas Arable and Permanent Crop Land Area Use of Fertilizers
Agriculture (14)
Use of Agricultural Pesticides Forest Area as a Percent of Land Area Forests (11) Wood Harvesting Intensity
Desertification (12) Land Affected by Desertification
Land (10)
Urbanization (7) Area of Urban Formal and Informal Settlements
7
Algae Concentration in Coastal Waters Coastal Zone Percent of Total Population Living in Coastal Areas
Oceans, Seas and Coasts (17)
Fisheries Annual Catch by Major Species Water Quantity Annual Withdrawal of Ground and Surface Water
as a Percent of Total Available Water BOD in Water Bodies
Fresh Water (18)
Water Quality Concentration of Faecal Coliform in Freshwater Area of Selected Key Ecosystems Ecosystem Protected Area as a % of Total Area
Biodiversity (15)
Species Abundance of Selected Key Species ECONOMIC
Theme Sub-theme Indicator
GDP per Capita Economic Performance Investment Share in GDP Trade Balance of Trade in Goods and Services
Debt to GNP Ratio
Economic Structure (2) Financial Status (33)
Total ODA Given or Received as a Percent of GNP
Material Consumption Intensity of Material Use Annual Energy Consumption per Capita Share of Consumption of Renewable Energy Resources
Energy Use
Intensity of Energy Use Generation of Industrial and Municipal Solid Waste Generation of Hazardous Waste Management of Radioactive Waste
Waste Generation and Management (19-22)
Waste Recycling and Reuse
Consumption and Production Patterns (4)
Transportation Distance Traveled per Capita by Mode of Transport
INSTITUTIONAL
Theme Sub-theme Indicator Strategic Implementation of SD (8)
National Sustainable Development Strategy Institutional Framework (38, 39)
International Cooperation
Implementation of Ratified Global Agreements
Information Access (40)
Number of Internet Subscribers per 1000 Inhabitants
Communication Infrastructure (40)
Main Telephone Lines per 1000 Inhabitants
Science and Technology (35)
Expenditure on Research and Development as a Percent of GDP
Institutional Capacity (37)
Disaster Preparedness and Response
Economic and Human Loss Due to Natural Disasters
8
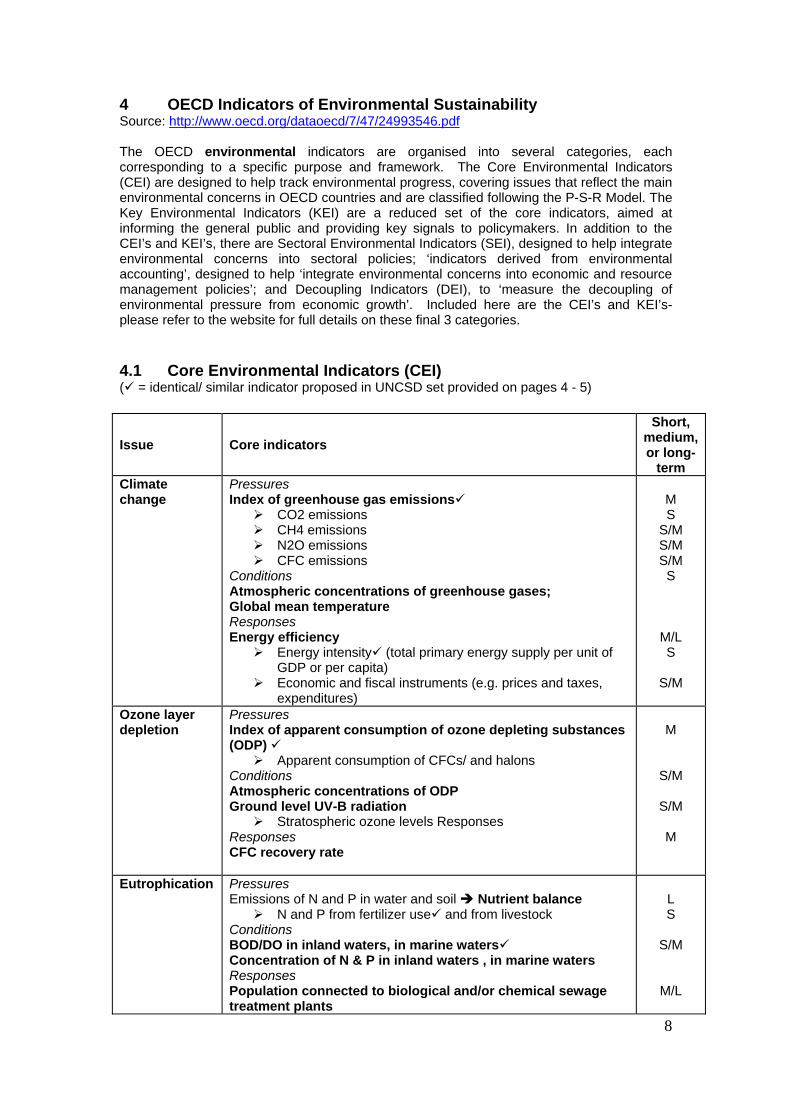
4 OECD Indicators of Environmental Sustainability Source: http://www.oecd.org/dataoecd/7/47/24993546.pdf The OECD environmental indicators are organised into several categories, each corresponding to a specific purpose and framework. The Core Environmental Indicators (CEI) are designed to help track environmental progress, covering issues that reflect the main environmental concerns in OECD countries and are classified following the P-S-R Model. The Key Environmental Indicators (KEI) are a reduced set of the core indicators, aimed at informing the general public and providing key signals to policymakers. In addition to the CEI’s and KEI’s, there are Sectoral Environmental Indicators (SEI), designed to help integrate environmental concerns into sectoral policies; ‘indicators derived from environmental accounting’, designed to help ‘integrate environmental concerns into economic and resource management policies’; and Decoupling Indicators (DEI), to ‘measure the decoupling of environmental pressure from economic growth’. Included here are the CEI’s and KEI’s- please refer to the website for full details on these final 3 categories. 4.1 Core Environmental Indicators (CEI) ( = identical/ similar indicator proposed in UNCSD set provided on pages 4 - 5)
Issue Core indicators
Short, medium, or long-
term Climate change
Pressures Index of greenhouse gas emissions
CO2 emissions CH4 emissions N2O emissions CFC emissions
Conditions Atmospheric concentrations of greenhouse gases; Global mean temperature Responses Energy efficiency
Energy intensity (total primary energy supply per unit of GDP or per capita)
Economic and fiscal instruments (e.g. prices and taxes, expenditures)
M S
S/M S/M S/M S
M/L S
S/M
Ozone layer depletion
Pressures Index of apparent consumption of ozone depleting substances (ODP)
Apparent consumption of CFCs/ and halons Conditions Atmospheric concentrations of ODP Ground level UV-B radiation
Stratospheric ozone levels Responses Responses CFC recovery rate
M
S/M
S/M
M
Eutrophication Pressures Emissions of N and P in water and soil Nutrient balance
N and P from fertilizer use and from livestock Conditions BOD/DO in inland waters, in marine waters Concentration of N & P in inland waters , in marine waters Responses Population connected to biological and/or chemical sewage treatment plants
L S
S/M
M/L

9
Population connected to sewage treatment plants User charges for waste water treatment Market share of phosphate-free detergents
S M
S/M
Acidification Pressures Index of acidifying substances
Emissions of NOx and SOx Conditions Excedance of critical loads of pH in water & soil
Concentrations in acid precipitation Responses % of car fleet equipped with catalytic converters Capacity of SOx and NOx abatement equipment of stationary sources
M/L S
M/L S
S/M M/L
Toxic contamination
Pressures Emissions of heavy metals Emissions of organic compounds
Consumption of pesticides Conditions Concentration of heavy metals & organic compounds in env. media & in living species
Concentration of heavy metals in rivers Responses Changes of toxic contents in products and production processes
Market share of unleaded petrol
M/L L S/M
L S/M
L S
Urban environmental quality
Pressures Urban air emissions (SOx, NOx, VOC) Urban traffic density Urban car ownership Degree of urbanisation (urban population growth rates, urban land)
Conditions Population exposure to air pollution, to noise
Concentrations of air pollutants Ambient water conditions in urban areas Responses Green space (Areas protected from urban development) Economic, fiscal and regulatory instruments
Water treatment and noise abatement expenditure
M/L M/S S S/M
L/M S M/L
M/L M S/M
Biodiversity Pressures Habitat alteration and land conversion from natural state to be further developed (e.g. road network density, change in land cover, etc.) Conditions Threatened or extinct species as a share of total species known Area of key ecosystems Responses Protected areas as % of national territory and by type of ecosystem
Protected species
L
S M
S/L S
Cultural landscapes
Indicators to be further developed e.g. presence of artificial elements, sites protected for historical, cultural or aesthetic reasons

10
Waste Pressures Generation of waste (municipal, industrial, hazardous, nuclear)
Movements of hazardous waste
Responses Waste minimisation (to be further developed)
Recycling rates Economic and fiscal instruments, expenditures
S S L
S/M M
Water resources
Pressures Intensity of use of water resources (abstractions/available resources) Conditions Frequency, duration and extent of water shortages Responses Water prices and user charges for sewage treatment
S
M/L
S/M
Forest resources
Pressures Intensity of forest resource use (actual harvest/productive capacity) Conditions Area , volume and structure of forests Responses Forest area management and protection (e.g. % of protected forest area in total forest area; % of harvest area successfully regenerated of afforested)
M
S/M
M/L
Fish resources Pressures Fish catches Conditions Size of spawning stocks Responses Fishing quotas
S
M
S/M Soil degradation (desertification & erosion)
Pressures Erosion risks: potential and actual use of land for agriculture
Change in land use Conditions Degree of top soil losses Responses Rehabilitated areas
L S
M/L
M/L Material resources (new issue)
Intensity of use of material resources (Indicators to be developed, link to Material Flow Accounting)
Socio-economic, sectoral and general indicators (not attributable to specific environmental issues)
Pressures Population growth & density Growth and structure of GDP Private & government final consumption expenditure Industrial production Structure of energy supply Road traffic volumes; Stock of road vehicles Agricultural production Responses Environmental expenditure
Pollution abatement and control expenditure Official Development Assistance (indicator added on the
basis of experience with environmental performance reviews)
Public opinion
S S S S S S S
M/L S/M S
S
11
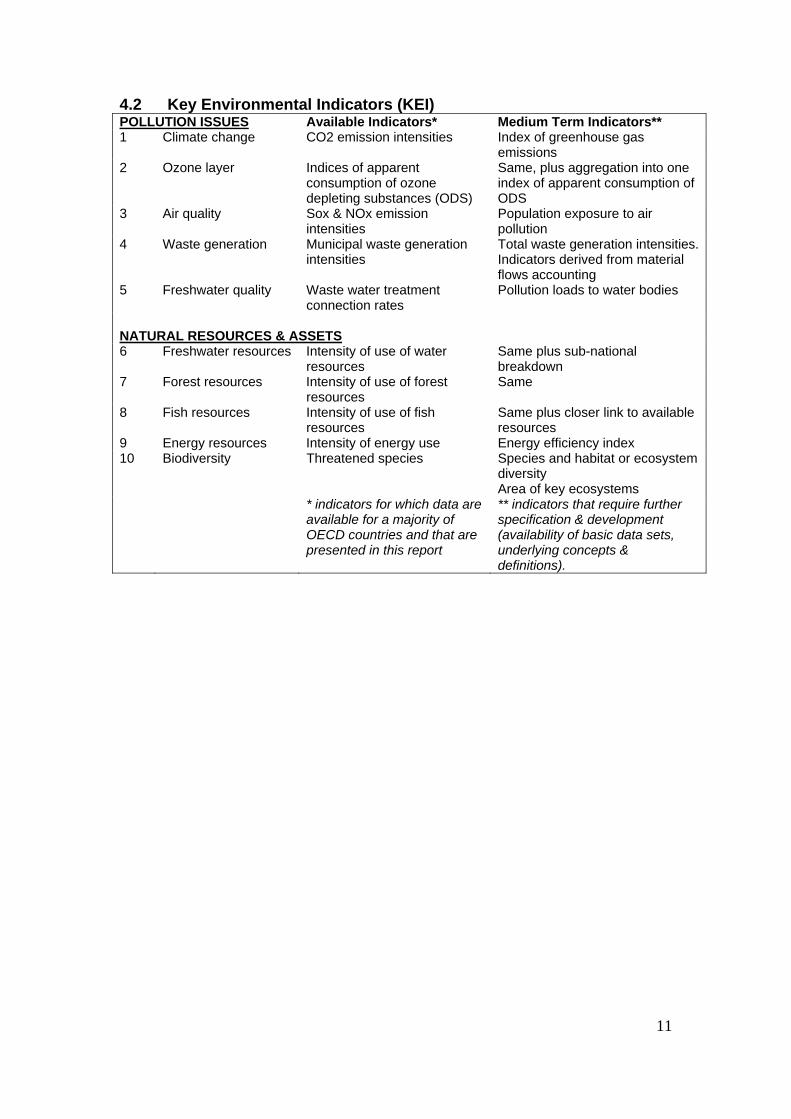
4.2 Key Environmental Indicators (KEI) POLLUTION ISSUES Available Indicators* Medium Term Indicators** 1 Climate change CO2 emission intensities Index of greenhouse gas
emissions 2 Ozone layer Indices of apparent
consumption of ozone depleting substances (ODS)
Same, plus aggregation into one index of apparent consumption of ODS
3 Air quality Sox & NOx emission intensities
Population exposure to air pollution
4 Waste generation Municipal waste generation intensities
Total waste generation intensities. Indicators derived from material flows accounting
5 Freshwater quality Waste water treatment connection rates
Pollution loads to water bodies
NATURAL RESOURCES & ASSETS
6 Freshwater resources Intensity of use of water resources
Same plus sub-national breakdown
7 Forest resources Intensity of use of forest resources
Same
8 Fish resources Intensity of use of fish resources
Same plus closer link to available resources
9 Energy resources Intensity of energy use Energy efficiency index 10 Biodiversity Threatened species Species and habitat or ecosystem
diversity Area of key ecosystems
* indicators for which data are available for a majority of OECD countries and that are presented in this report
** indicators that require further specification & development (availability of basic data sets, underlying concepts & definitions).
12
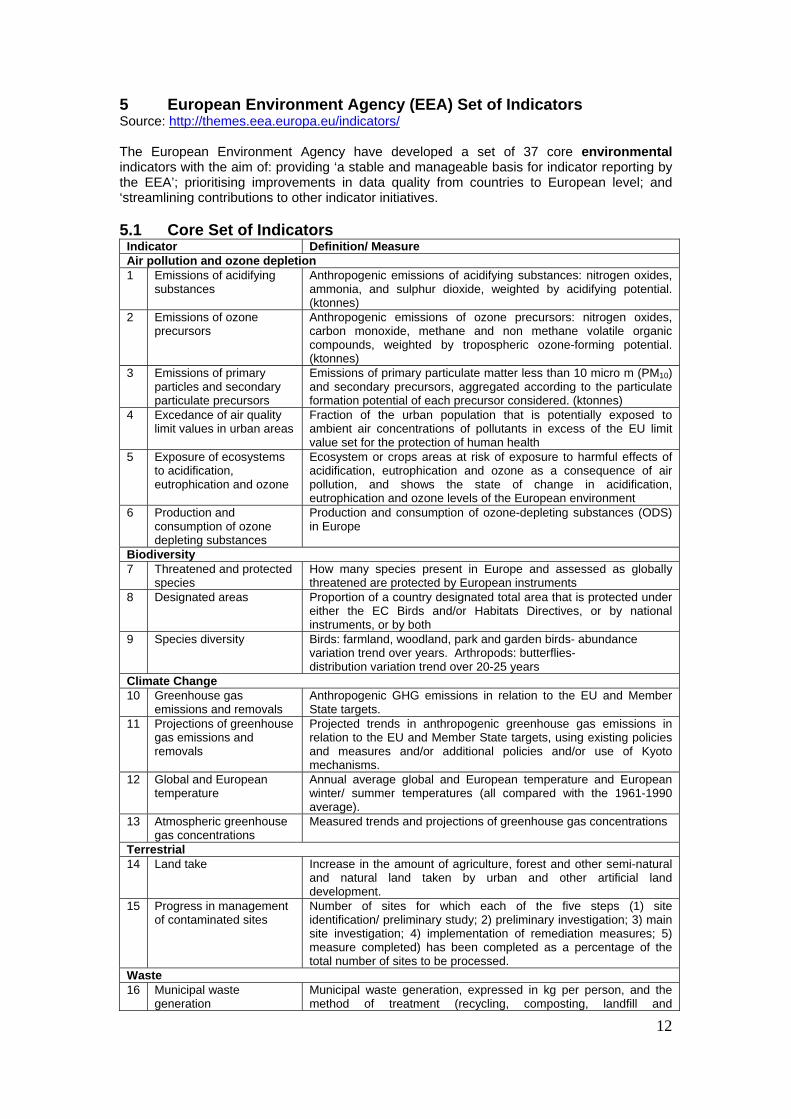
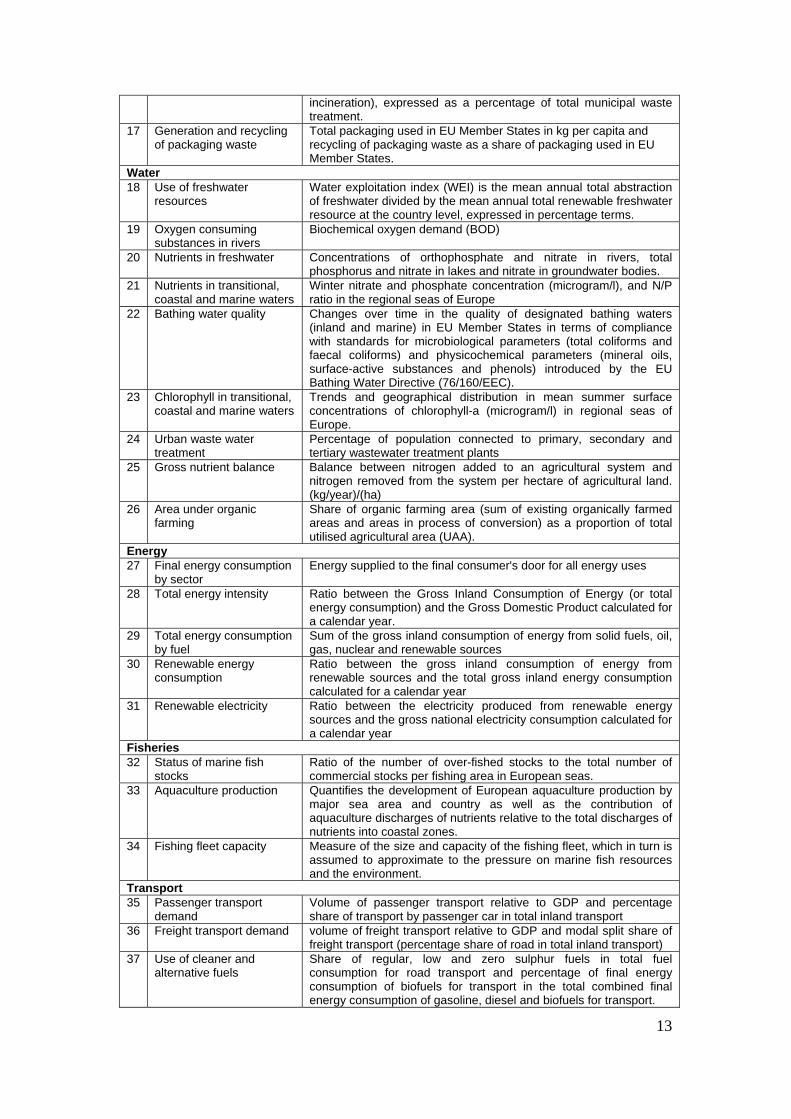
5 European Environment Agency (EEA) Set of Indicators Source: http://themes.eea.europa.eu/indicators/ The European Environment Agency have developed a set of 37 core environmental indicators with the aim of: providing ‘a stable and manageable basis for indicator reporting by the EEA’; prioritising improvements in data quality from countries to European level; and ‘streamlining contributions to other indicator initiatives. 5.1 Core Set of Indicators
Indicator Definition/ Measure Air pollution and ozone depletion 1 Emissions of acidifying
substances Anthropogenic emissions of acidifying substances: nitrogen oxides, ammonia, and sulphur dioxide, weighted by acidifying potential. (ktonnes)
2 Emissions of ozone precursors
Anthropogenic emissions of ozone precursors: nitrogen oxides, carbon monoxide, methane and non methane volatile organic compounds, weighted by tropospheric ozone-forming potential. (ktonnes)
3 Emissions of primary particles and secondary particulate precursors
Emissions of primary particulate matter less than 10 micro m (PM10) and secondary precursors, aggregated according to the particulate formation potential of each precursor considered. (ktonnes)
4 Excedance of air quality limit values in urban areas
Fraction of the urban population that is potentially exposed to ambient air concentrations of pollutants in excess of the EU limit value set for the protection of human health
5 Exposure of ecosystems to acidification, eutrophication and ozone
Ecosystem or crops areas at risk of exposure to harmful effects of acidification, eutrophication and ozone as a consequence of air pollution, and shows the state of change in acidification, eutrophication and ozone levels of the European environment
6 Production and consumption of ozone depleting substances
Production and consumption of ozone-depleting substances (ODS) in Europe
Biodiversity 7 Threatened and protected
species How many species present in Europe and assessed as globally threatened are protected by European instruments
8 Designated areas Proportion of a country designated total area that is protected under either the EC Birds and/or Habitats Directives, or by national instruments, or by both
9 Species diversity Birds: farmland, woodland, park and garden birds- abundance variation trend over years. Arthropods: butterflies- distribution variation trend over 20-25 years
Climate Change 10 Greenhouse gas
emissions and removals Anthropogenic GHG emissions in relation to the EU and Member State targets.
11 Projections of greenhouse gas emissions and removals
Projected trends in anthropogenic greenhouse gas emissions in relation to the EU and Member State targets, using existing policies and measures and/or additional policies and/or use of Kyoto mechanisms.
12 Global and European temperature
Annual average global and European temperature and European winter/ summer temperatures (all compared with the 1961-1990 average).
13 Atmospheric greenhouse gas concentrations
Measured trends and projections of greenhouse gas concentrations
Terrestrial 14 Land take Increase in the amount of agriculture, forest and other semi-natural
and natural land taken by urban and other artificial land development.
15 Progress in management of contaminated sites
Number of sites for which each of the five steps (1) site identification/ preliminary study; 2) preliminary investigation; 3) main site investigation; 4) implementation of remediation measures; 5) measure completed) has been completed as a percentage of the total number of sites to be processed.
Waste 16 Municipal waste
generation Municipal waste generation, expressed in kg per person, and the method of treatment (recycling, composting, landfill and
13
incineration), expressed as a percentage of total municipal waste treatment.
17 Generation and recycling of packaging waste
Total packaging used in EU Member States in kg per capita and recycling of packaging waste as a share of packaging used in EU Member States.
Water 18 Use of freshwater
resources Water exploitation index (WEI) is the mean annual total abstraction of freshwater divided by the mean annual total renewable freshwater resource at the country level, expressed in percentage terms.
19 Oxygen consuming substances in rivers
Biochemical oxygen demand (BOD)
20 Nutrients in freshwater Concentrations of orthophosphate and nitrate in rivers, total phosphorus and nitrate in lakes and nitrate in groundwater bodies.
21 Nutrients in transitional, coastal and marine waters
Winter nitrate and phosphate concentration (microgram/l), and N/P ratio in the regional seas of Europe
22 Bathing water quality Changes over time in the quality of designated bathing waters (inland and marine) in EU Member States in terms of compliance with standards for microbiological parameters (total coliforms and faecal coliforms) and physicochemical parameters (mineral oils, surface-active substances and phenols) introduced by the EU Bathing Water Directive (76/160/EEC).
23 Chlorophyll in transitional, coastal and marine waters
Trends and geographical distribution in mean summer surface concentrations of chlorophyll-a (microgram/l) in regional seas of Europe.
24 Urban waste water treatment
Percentage of population connected to primary, secondary and tertiary wastewater treatment plants
25 Gross nutrient balance Balance between nitrogen added to an agricultural system and nitrogen removed from the system per hectare of agricultural land. (kg/year)/(ha)
26 Area under organic farming
Share of organic farming area (sum of existing organically farmed areas and areas in process of conversion) as a proportion of total utilised agricultural area (UAA).
Energy 27 Final energy consumption
by sector Energy supplied to the final consumer's door for all energy uses
28 Total energy intensity Ratio between the Gross Inland Consumption of Energy (or total energy consumption) and the Gross Domestic Product calculated for a calendar year.
29 Total energy consumption by fuel
Sum of the gross inland consumption of energy from solid fuels, oil, gas, nuclear and renewable sources
30 Renewable energy consumption
Ratio between the gross inland consumption of energy from renewable sources and the total gross inland energy consumption calculated for a calendar year
31 Renewable electricity Ratio between the electricity produced from renewable energy sources and the gross national electricity consumption calculated for a calendar year
Fisheries 32 Status of marine fish
stocks Ratio of the number of over-fished stocks to the total number of commercial stocks per fishing area in European seas.
33 Aquaculture production Quantifies the development of European aquaculture production by major sea area and country as well as the contribution of aquaculture discharges of nutrients relative to the total discharges of nutrients into coastal zones.
34 Fishing fleet capacity Measure of the size and capacity of the fishing fleet, which in turn is assumed to approximate to the pressure on marine fish resources and the environment.
Transport 35 Passenger transport
demand Volume of passenger transport relative to GDP and percentage share of transport by passenger car in total inland transport
36 Freight transport demand volume of freight transport relative to GDP and modal split share of freight transport (percentage share of road in total inland transport)
37 Use of cleaner and alternative fuels
Share of regular, low and zero sulphur fuels in total fuel consumption for road transport and percentage of final energy consumption of biofuels for transport in the total combined final energy consumption of gasoline, diesel and biofuels for transport.
14
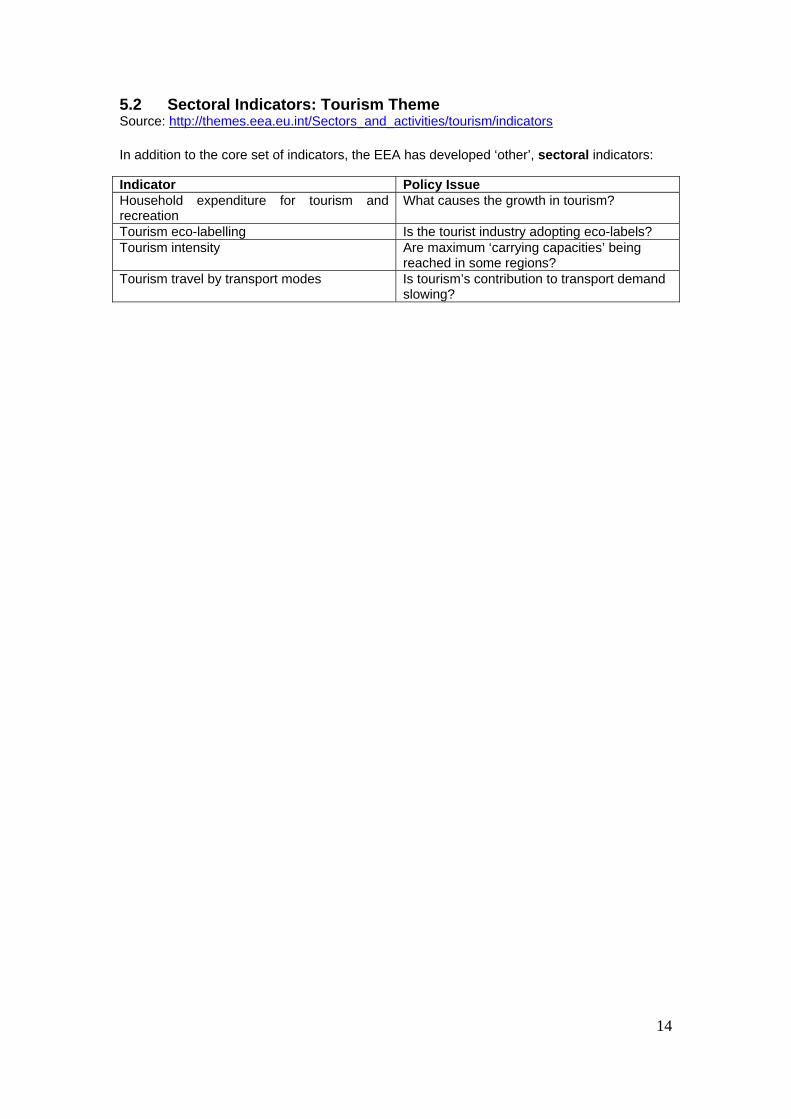
5.2 Sectoral Indicators: Tourism Theme Source: http://themes.eea.eu.int/Sectors_and_activities/tourism/indicators In addition to the core set of indicators, the EEA has developed ‘other’, sectoral indicators: Indicator Policy Issue Household expenditure for tourism and recreation
What causes the growth in tourism?
Tourism eco-labelling Is the tourist industry adopting eco-labels? Tourism intensity Are maximum ‘carrying capacities’ being
reached in some regions? Tourism travel by transport modes Is tourism’s contribution to transport demand
slowing?
15
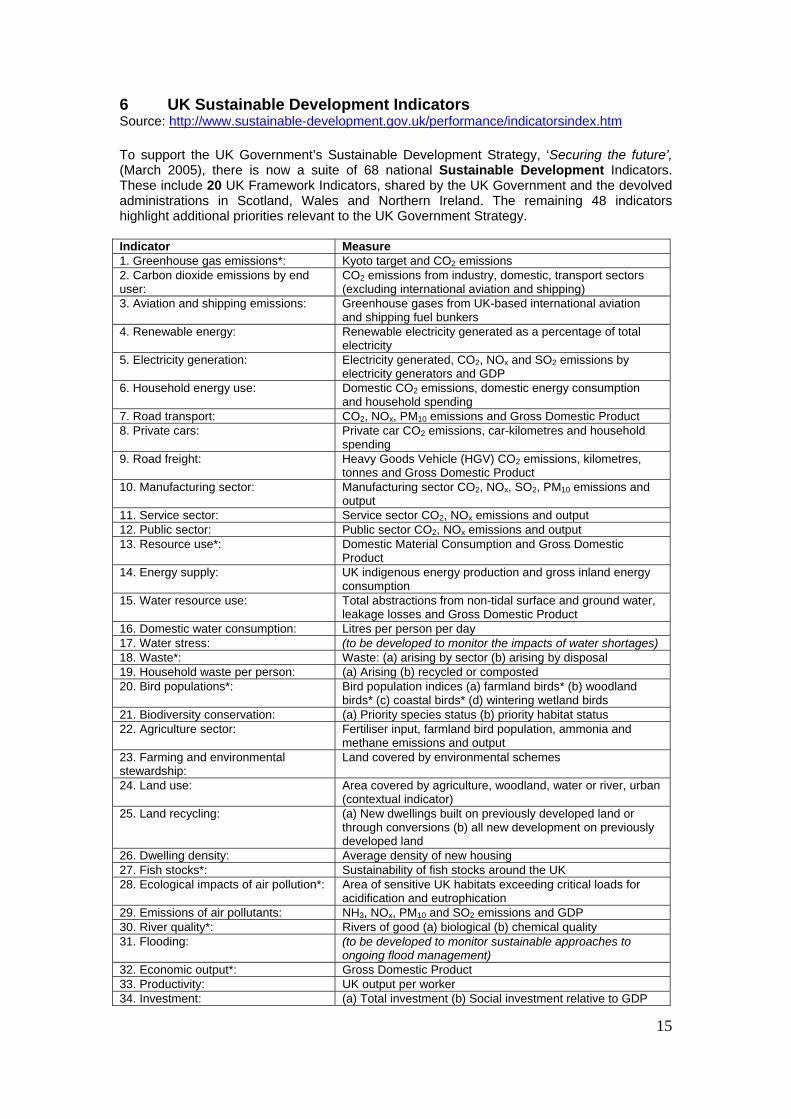
6 UK Sustainable Development Indicators Source: http://www.sustainable-development.gov.uk/performance/indicatorsindex.htm To support the UK Government’s Sustainable Development Strategy, ‘Securing the future’, (March 2005), there is now a suite of 68 national Sustainable Development Indicators. These include 20 UK Framework Indicators, shared by the UK Government and the devolved administrations in Scotland, Wales and Northern Ireland. The remaining 48 indicators highlight additional priorities relevant to the UK Government Strategy. Indicator Measure 1. Greenhouse gas emissions*: Kyoto target and CO2 emissions 2. Carbon dioxide emissions by end user:
CO2 emissions from industry, domestic, transport sectors (excluding international aviation and shipping)
3. Aviation and shipping emissions: Greenhouse gases from UK-based international aviation and shipping fuel bunkers
4. Renewable energy: Renewable electricity generated as a percentage of total electricity
5. Electricity generation: Electricity generated, CO2, NOx and SO2 emissions by electricity generators and GDP
6. Household energy use: Domestic CO2 emissions, domestic energy consumption and household spending
7. Road transport: CO2, NOx, PM10 emissions and Gross Domestic Product 8. Private cars: Private car CO2 emissions, car-kilometres and household
spending 9. Road freight: Heavy Goods Vehicle (HGV) CO2 emissions, kilometres,
tonnes and Gross Domestic Product 10. Manufacturing sector: Manufacturing sector CO2, NOx, SO2, PM10 emissions and
output 11. Service sector: Service sector CO2, NOx emissions and output 12. Public sector: Public sector CO2, NOx emissions and output 13. Resource use*: Domestic Material Consumption and Gross Domestic
Product 14. Energy supply: UK indigenous energy production and gross inland energy
consumption 15. Water resource use: Total abstractions from non-tidal surface and ground water,
leakage losses and Gross Domestic Product 16. Domestic water consumption: Litres per person per day 17. Water stress: (to be developed to monitor the impacts of water shortages) 18. Waste*: Waste: (a) arising by sector (b) arising by disposal 19. Household waste per person: (a) Arising (b) recycled or composted 20. Bird populations*: Bird population indices (a) farmland birds* (b) woodland
birds* (c) coastal birds* (d) wintering wetland birds 21. Biodiversity conservation: (a) Priority species status (b) priority habitat status 22. Agriculture sector: Fertiliser input, farmland bird population, ammonia and
methane emissions and output 23. Farming and environmental stewardship:
Land covered by environmental schemes
24. Land use: Area covered by agriculture, woodland, water or river, urban (contextual indicator)
25. Land recycling: (a) New dwellings built on previously developed land or through conversions (b) all new development on previously developed land
26. Dwelling density: Average density of new housing 27. Fish stocks*: Sustainability of fish stocks around the UK 28. Ecological impacts of air pollution*: Area of sensitive UK habitats exceeding critical loads for
acidification and eutrophication 29. Emissions of air pollutants: NH3, NOx, PM10 and SO2 emissions and GDP 30. River quality*: Rivers of good (a) biological (b) chemical quality 31. Flooding: (to be developed to monitor sustainable approaches to
ongoing flood management) 32. Economic output*: Gross Domestic Product 33. Productivity: UK output per worker 34. Investment: (a) Total investment (b) Social investment relative to GDP
16
35. Demography: Population and population of working age (contextual indicator)
36. Households and dwellings: Households, single person households and dwelling stock (contextual indicator)
37. Active community participation*: Informal and formal volunteering at least once a month in the last 12 months
38. Crime*: Crime survey and recorded crime for (a) vehicles (b) domestic burglary (c) robbery
39. Fear of crime: Fear of crime: (a) car theft (b) burglary (c) physical attack 40. Employment*: People of working age in employment 41. Workless households*: Population living in workless households (a) children (b)
working age 42. Economically inactive: Percentage of people of working age who are economically
inactive 43. Childhood poverty*: Children in relative low-income households (a) before
housing costs (b) after housing costs 44. Young adults: 16-19 year-olds not in employment, education or training 45. Pensioner poverty*: Pensioners in relative low-income households (a) before
housing costs (b) after housing costs 46. Pension provision: Proportion of working age people contributing to a non-state
pension in at least three years out of the last four 47. Education*: 19 year-olds with Level 2 qualifications and above 48. Sustainable development education:
(to be developed to monitor the impact of formal learning on knowledge and awareness of sustainable development)
49. Health inequality*: (a) Infant mortality: differences between socio-economic groups (b) Life expectancy: differences in average life expectancy between local authority areas
50. Healthy life expectancy: Healthy life expectancy (a) men and (b) women 51. Mortality rates: Death rates from (a) circulatory disease and (b) cancer,
below 75 years and for areas with the worst health and deprivation indicators, and (c) suicides
52. Smoking: Prevalence of smoking (a) all adults (b) 'routine and manual' socio-economic groups
53. Childhood obesity: Prevalence of obesity in 2-10 year-olds 54. Diet: Proportion of people consuming (a) five or more portions of
fruit and vegetables per day and (b) in low income households
55. Mobility*: (a) Number of trips per person by mode (b) Distance travelled per person per year by broad trip purpose
56. Getting to school: How children get to school 57. Accessibility: Access to key services 58. Road accidents: Number of people and children killed or seriously injured 59. Social justice*: (social measures to be developed) 60. Environmental equality*: (social measures to be developed) 61. Air quality and health: (a) Annual levels of particles and ozone (b) days when air
pollution is moderate or higher 62. Housing conditions: (a) Social sector homes (b) vulnerable households in the
private sector in homes below the decent homes standard 63. Households living in fuel poverty: Households living in fuel poverty containing (a) pensioners
(b) children (c) disabled/long-term sick 64. Homelessness: (a) Number of rough sleepers (b) number of households in
temporary accommodation (i) total (ii) households with children
65. Local environment quality: Assessment of local environmental quality 66. Satisfaction in local area: Percentage of households satisfied with the quality of the
places in which they live (a) overall (b) in deprived areas 67. UK international assistance: Net Official Development Assistance (a) per cent of Gross
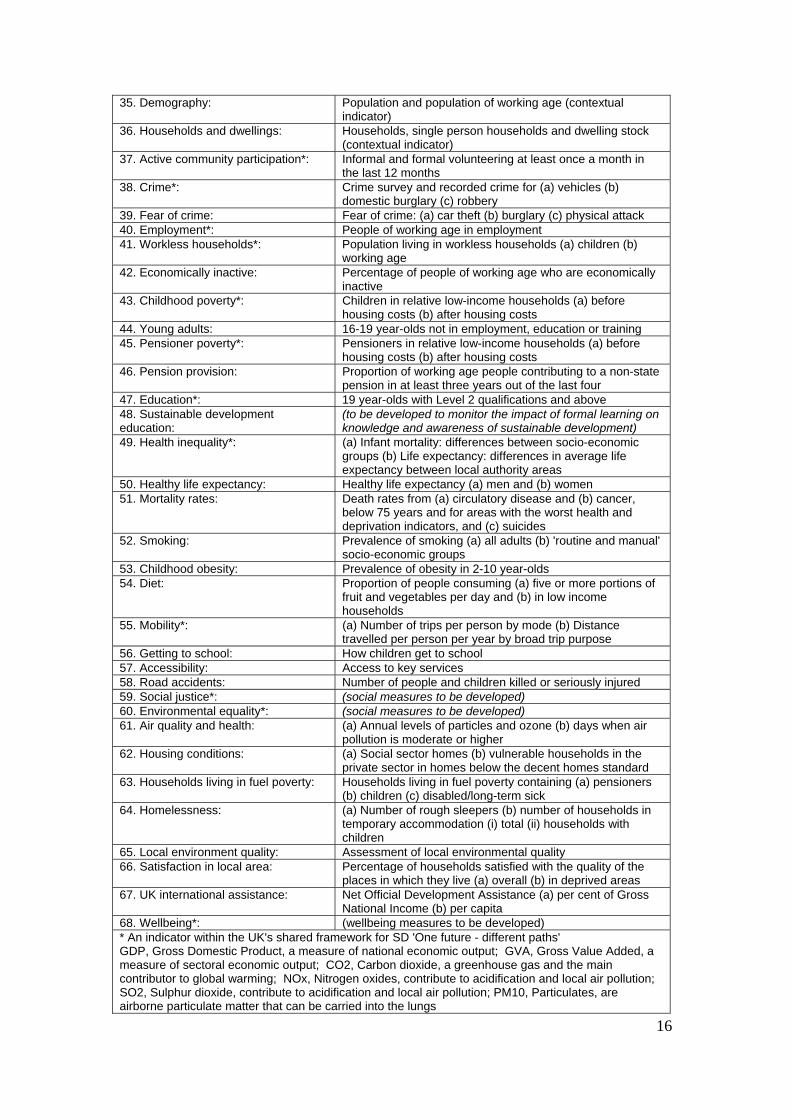
National Income (b) per capita 68. Wellbeing*: (wellbeing measures to be developed) * An indicator within the UK's shared framework for SD 'One future - different paths' GDP, Gross Domestic Product, a measure of national economic output; GVA, Gross Value Added, a measure of sectoral economic output; CO2, Carbon dioxide, a greenhouse gas and the main contributor to global warming; NOx, Nitrogen oxides, contribute to acidification and local air pollution; SO2, Sulphur dioxide, contribute to acidification and local air pollution; PM10, Particulates, are airborne particulate matter that can be carried into the lungs
17
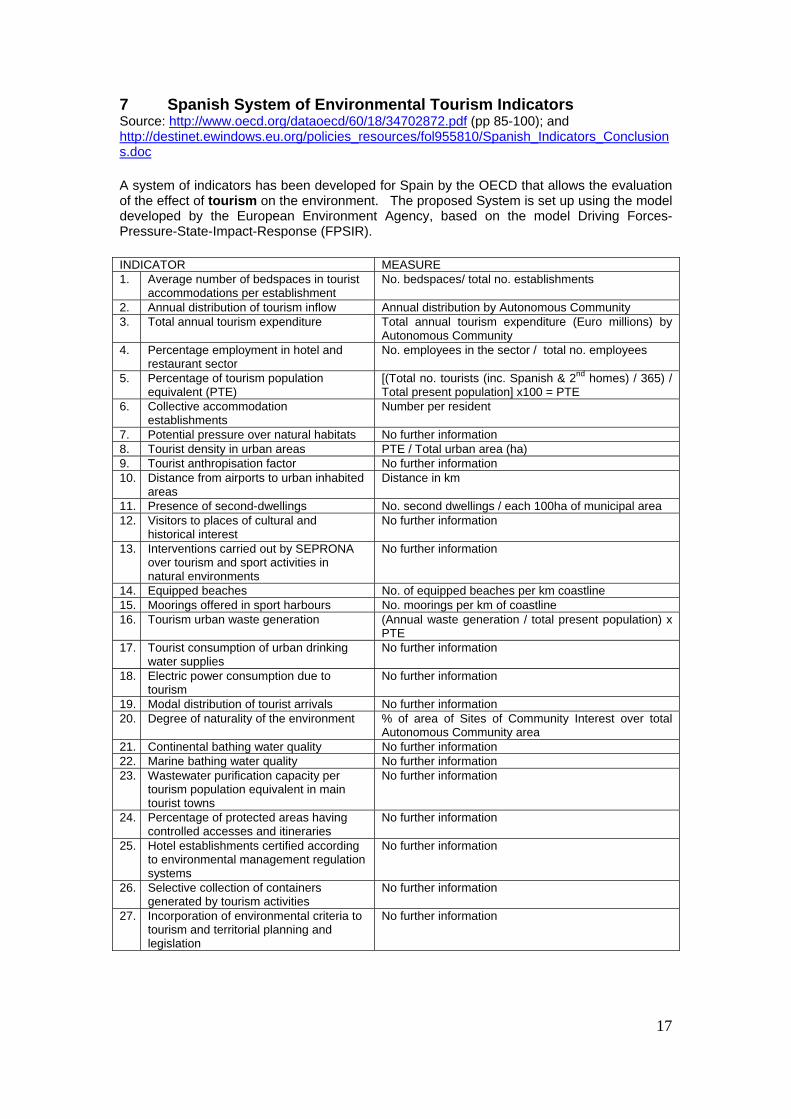
7 Spanish System of Environmental Tourism Indicators Source: http://www.oecd.org/dataoecd/60/18/34702872.pdf (pp 85-100); and http://destinet.ewindows.eu.org/policies_resources/fol955810/Spanish_Indicators_Conclusions.doc A system of indicators has been developed for Spain by the OECD that allows the evaluation of the effect of tourism on the environment. The proposed System is set up using the model developed by the European Environment Agency, based on the model Driving Forces-Pressure-State-Impact-Response (FPSIR). INDICATOR MEASURE 1. Average number of bedspaces in tourist
accommodations per establishment No. bedspaces/ total no. establishments
2. Annual distribution of tourism inflow Annual distribution by Autonomous Community 3. Total annual tourism expenditure Total annual tourism expenditure (Euro millions) by
Autonomous Community 4. Percentage employment in hotel and
restaurant sector No. employees in the sector / total no. employees
5. Percentage of tourism population equivalent (PTE)
[(Total no. tourists (inc. Spanish & 2nd homes) / 365) / Total present population] x100 = PTE
6. Collective accommodation establishments
Number per resident
7. Potential pressure over natural habitats No further information 8. Tourist density in urban areas PTE / Total urban area (ha) 9. Tourist anthropisation factor No further information 10. Distance from airports to urban inhabited
areas Distance in km
11. Presence of second-dwellings No. second dwellings / each 100ha of municipal area 12. Visitors to places of cultural and
historical interest No further information
13. Interventions carried out by SEPRONA over tourism and sport activities in natural environments
No further information
14. Equipped beaches No. of equipped beaches per km coastline 15. Moorings offered in sport harbours No. moorings per km of coastline 16. Tourism urban waste generation (Annual waste generation / total present population) x
PTE 17. Tourist consumption of urban drinking
water supplies No further information
18. Electric power consumption due to tourism
No further information
19. Modal distribution of tourist arrivals No further information 20. Degree of naturality of the environment % of area of Sites of Community Interest over total
Autonomous Community area 21. Continental bathing water quality No further information 22. Marine bathing water quality No further information 23. Wastewater purification capacity per
tourism population equivalent in main tourist towns
No further information
24. Percentage of protected areas having controlled accesses and itineraries
No further information
25. Hotel establishments certified according to environmental management regulation systems
No further information
26. Selective collection of containers generated by tourism activities
No further information
27. Incorporation of environmental criteria to tourism and territorial planning and legislation
No further information
18
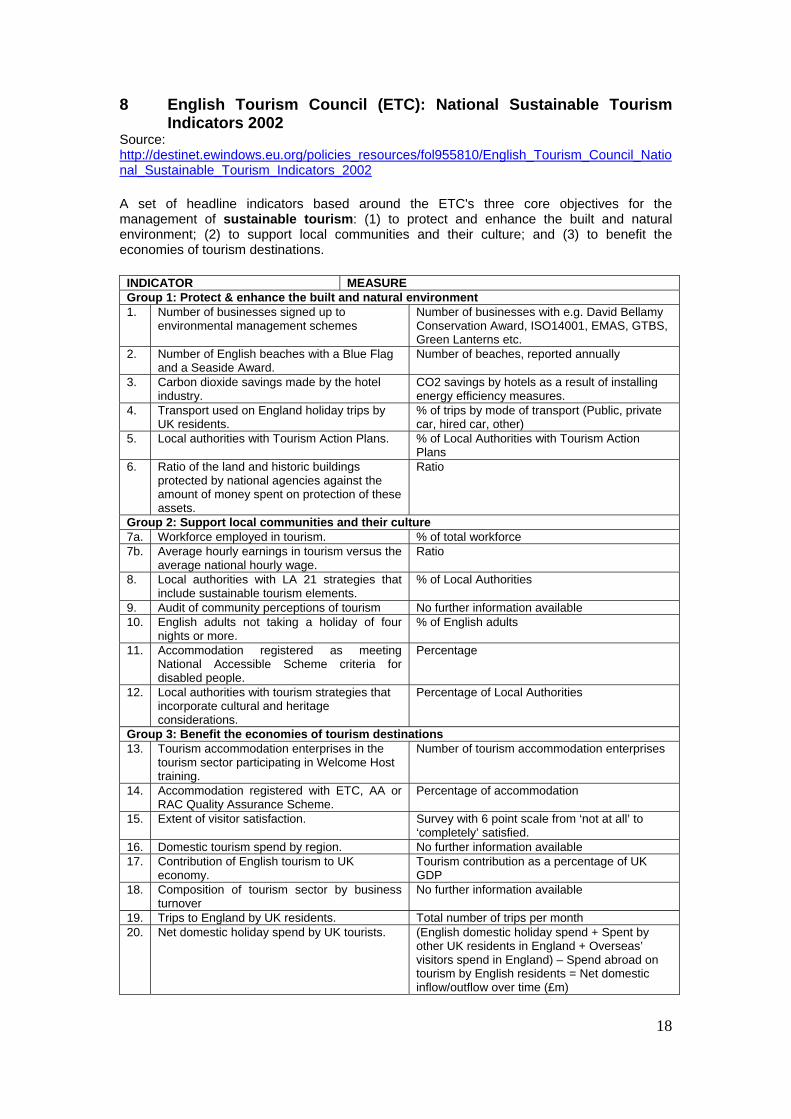
8 English Tourism Council (ETC): National Sustainable Tourism Indicators 2002 Source: http://destinet.ewindows.eu.org/policies_resources/fol955810/English_Tourism_Council_National_Sustainable_Tourism_Indicators_2002 A set of headline indicators based around the ETC's three core objectives for the management of sustainable tourism: (1) to protect and enhance the built and natural environment; (2) to support local communities and their culture; and (3) to benefit the economies of tourism destinations.
INDICATOR MEASURE Group 1: Protect & enhance the built and natural environment 1. Number of businesses signed up to
environmental management schemes Number of businesses with e.g. David Bellamy Conservation Award, ISO14001, EMAS, GTBS, Green Lanterns etc.
2. Number of English beaches with a Blue Flag and a Seaside Award.
Number of beaches, reported annually
3. Carbon dioxide savings made by the hotel industry.
CO2 savings by hotels as a result of installing energy efficiency measures.
4. Transport used on England holiday trips by UK residents.
% of trips by mode of transport (Public, private car, hired car, other)
5. Local authorities with Tourism Action Plans. % of Local Authorities with Tourism Action Plans
6. Ratio of the land and historic buildings protected by national agencies against the amount of money spent on protection of these assets.
Ratio
Group 2: Support local communities and their culture 7a. Workforce employed in tourism. % of total workforce 7b. Average hourly earnings in tourism versus the
average national hourly wage. Ratio
8. Local authorities with LA 21 strategies that include sustainable tourism elements.
% of Local Authorities
9. Audit of community perceptions of tourism No further information available 10. English adults not taking a holiday of four
nights or more. % of English adults
11. Accommodation registered as meeting National Accessible Scheme criteria for disabled people.
Percentage
12. Local authorities with tourism strategies that incorporate cultural and heritage considerations.
Percentage of Local Authorities
Group 3: Benefit the economies of tourism destinations 13. Tourism accommodation enterprises in the
tourism sector participating in Welcome Host training.
Number of tourism accommodation enterprises
14. Accommodation registered with ETC, AA or RAC Quality Assurance Scheme.
Percentage of accommodation
15. Extent of visitor satisfaction. Survey with 6 point scale from ‘not at all’ to ‘completely’ satisfied.
16. Domestic tourism spend by region. No further information available 17. Contribution of English tourism to UK
economy. Tourism contribution as a percentage of UK GDP
18. Composition of tourism sector by business turnover
No further information available
19. Trips to England by UK residents. Total number of trips per month 20. Net domestic holiday spend by UK tourists. (English domestic holiday spend + Spent by
other UK residents in England + Overseas’ visitors spend in England) – Spend abroad on tourism by English residents = Net domestic inflow/outflow over time (£m)

19
9 Scotland: ‘Choosing Our Future’- Measuring Progress on Scotland’s Sustainable Development Strategy Source: http://www.scotland.gov.uk/Topics/SustainableDevelopment/7859 and http://www.scotland.gov.uk/Resource/Doc/921/0033440.pdf The Scottish Executive has recently re-published its set of indicators aimed at measuring progress towards meeting the commitments of Scotland’s sustainable development strategy (‘Choosing our future’), and on sustainable development more generally.
1. Health Inequality: Life expectancy (by area) men/ women
2. Air Quality: Air Quality Management Areas (AQMAs)
3. Economic opportunity: 16-19 year olds who are not in education, training or employment
Well Being
4. Economic opportunity: People of working age in employment
5. Community: (a) Neighbourhood satisfaction (b) volunteering
6. Crime: Recorded crimes for (a) vehicles (b) domestic housebreaking (c) violence (d) anti-social behaviour
Supporting thriving communities
7. Households: (a) Childhood poverty: children in low income households (b) homeless households
8. Waste: Municipal waste arisings (a) total and (b) recycled / composted
9. Biodiversity1: Composite indicator of bird populations
10. Marine: Fish stocks which are within safe biological limits
Protecting Scotland’s natural heritage and resources
11. River Quality2: Kilometers of river identified as "poor" or "seriously polluted"
12. Climate Change: Greenhouse gas emissions: total and net
13. Sustainable Energy: Electricity generated from renewable resources
14. Sustainable Energy: carbon emission indicator3
Scotland’s global contribution
15. Transport4: Total vehicle kilometers
Learning 16. Learning: Eco-schools uptake and number with Green Flag
17. Economy: Economic output: GDP per head Context
18. Demography: Age profile of population
Social justice: new indicator being developed to support UK Framework Environmental Equality: new indicator being developed to support UK Framework Indicators in
Development5 Well-being: well being measures will be developed in support of UK Framework if supported by the evidence
1 Composite indicator on bird populations is in development with SNH, which will include breeding seabirds, wintering water birds, farmland and terrestrial birds. If the data is not available to support this, an indicator based on the UK Biodiversity Action Plans will be included. 2 Under Water Framework Directive, SEPA is developing indicators of the status of water bodies in Scotland. It is expected that these indicators will supersede the current indicator of kilometers of river length of good water quality. 3 Indicator being developed to measure the relative reduction in carbon emissions achieved through measures contained in the Energy Efficiency Strategy. 4 Indicator to be reviewed following National Transport Strategy consultation. 5 Indicators in development will be introduced into the set if applicable at the Scotland level.

20
10 Green Globe 21: The Douglas Shire Community Working Group Experience Source: http://www.greenglobe21.com/Benchmarking_WhatIs.aspx and: Douglas Shire Community Working Group (2001) Douglas Shire Sustainable Futures Draft Strategy. Sherlock, K. (Ed). Douglas Shire Council: Mossman. Green Globe21 is the only global sustainability benchmarking and certification program for travel and tourism operations. Douglas Shire Council, North Queensland, Australia was invited to seek accreditation under Green Globe21 brand. The sustainable tourism indicators they developed, and problems identified, are listed below.
Indicator Suggested Measure Problems Sustainability Policy
Develop policy
Energy consumption
Total energy consumed/equivalent persons
Cities for Climate Change Programme (CCCP) model problematic, lack data; expensive to collect; how measure transport /energy purchased outside
Potable water management
Total water consumed/ equivalent persons
Total water use not measured; how to account for private sources?
Solid waste reduction
Total solid waste to land fill/ equivalent persons
Best estimate as not collected; also in cubic metres has to be converted to tonnes
Environmental investment*
Environmental expenditure/total council expenditure
Once assumptions/definition of ‘environmental investment’ agreed; just analysis of budget codes for Douglas Shire Council (DSC)
Resource conservation*
Use of eco-labels/total product used by lead agency
What to include? Speaks to broader issues regarding ethical or environmental purchasing policies.
Bio-diversity
Habitat conservation area/total area
Not in council control! Remote sensing/mapping data v. expensive. Use voluntary conservation agreements instead? Need to focus on whole landscape not just protected areas
Water quality
Number of tests meeting guidelines/total water tests
Surface, groundwater, coastal waters and effluent – who tests and what does pass/failure mean?
Soil quality Number of sites on contaminated land register
Easy to prove; but does it really tell you much?
Carbon dioxide
Green house gas produced/ equivalent persons (Optional)
Reliant on CCP model and energy outputs
Community Measure
Number of enterprises certified by Nature and Ecotourism Accredited Program / all tours run in the Shire
Difficult to calculate total number of tour operators - does it really tell you much?
Equivalent persons
Total resident population plus visitors
Impossible to calculate permanent, temporary, tourists and day visitors!

21
11 Cairngorms National Park: Draft Park Plan (Proposed) Indicators Source: http://www.cairngorms.co.uk/parkauthority/nationalparkplan/looking.php The draft Park Plan (to be reviewed and finalised by December 2006) includes a set of National Park indicators. These are proposed by the CNPA in order to provide a snapshot of the overall ‘health’ of the Park at any given time and to feed into a review of the cumulative impact of the Plan on the Park. No. Indicator Theme Potential Indicators 1. Landscape Change • Land-use cover change
• Change in field boundary features (hedges and dykes)
2. Affordable Housing • Ratio of houses in priority need to number of annual social rented properties available
• Level of private landlords’ uptake of grants and other forms of assistance to provide affordable rented housing
3. Population Profile • Proportion of population of working age • Proportion of population under 25 years old
4. Seasonal Employment Rates by Sector
• Employment rates by sector (full-time, part-time and seasonal)
5. Agricultural Activity • Total income from farming • Number and area of active farm units
6. Biodiversity • Wild Bird Populations • % of Local Biodiversity Action Plan Species in
favourable condition • % of Local Biodiversity Action Plan Habitats in
favourable condition 7. Water Quality • Ecological condition of river water
• Conservation of hydromorphology 8. Traffic Volumes and Modes • Traffic volumes by modal split on selected routes
• Levels of use of public transport 9. Education and Learning • Number and % uptake of available outdoor
education places • Number of participants in the Land-Based
Business Training Programme • Number of participants in the John Muir Award • Level of qualifications achieved
10. Waste • Total waste arising • % waste recycled • Access to kerbside recycling facilities
11. Visitor Enjoyment of the Park • Visitor numbers • Visitor spend • Duration of visits
12. Cultural Heritage • % of Listed Buildings and Scheduled Ancient Monuments at risk
• Number of community heritage groups/museums • Number of cultural heritage events
13. Business Health • Levels of employment by business type 14. Geographical Availability of
Services • Distance of services from households • Time taken to reach key services
15. Community Vibrancy • Levels of use of community meeting places • Levels of volunteering • Levels of participation in community council
elections
22
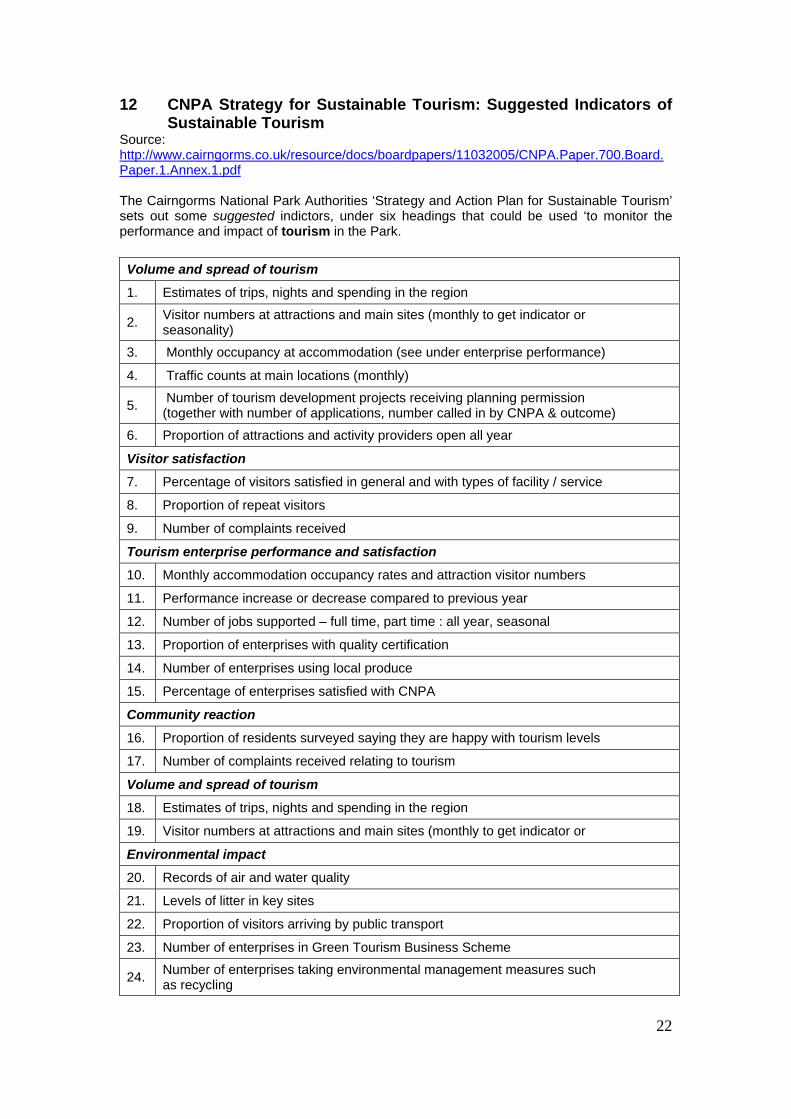
12 CNPA Strategy for Sustainable Tourism: Suggested Indicators of Sustainable Tourism Source: http://www.cairngorms.co.uk/resource/docs/boardpapers/11032005/CNPA.Paper.700.Board.Paper.1.Annex.1.pdf The Cairngorms National Park Authorities ‘Strategy and Action Plan for Sustainable Tourism’ sets out some suggested indictors, under six headings that could be used ‘to monitor the performance and impact of tourism in the Park. Volume and spread of tourism
1. Estimates of trips, nights and spending in the region
2. Visitor numbers at attractions and main sites (monthly to get indicator or seasonality)
3. Monthly occupancy at accommodation (see under enterprise performance)
4. Traffic counts at main locations (monthly)
5. Number of tourism development projects receiving planning permission (together with number of applications, number called in by CNPA & outcome)
6. Proportion of attractions and activity providers open all year
Visitor satisfaction
7. Percentage of visitors satisfied in general and with types of facility / service
8. Proportion of repeat visitors
9. Number of complaints received
Tourism enterprise performance and satisfaction
10. Monthly accommodation occupancy rates and attraction visitor numbers
11. Performance increase or decrease compared to previous year
12. Number of jobs supported – full time, part time : all year, seasonal
13. Proportion of enterprises with quality certification
14. Number of enterprises using local produce
15. Percentage of enterprises satisfied with CNPA
Community reaction
16. Proportion of residents surveyed saying they are happy with tourism levels
17. Number of complaints received relating to tourism
Volume and spread of tourism
18. Estimates of trips, nights and spending in the region
19. Visitor numbers at attractions and main sites (monthly to get indicator or
Environmental impact
20. Records of air and water quality
21. Levels of litter in key sites
22. Proportion of visitors arriving by public transport
23. Number of enterprises in Green Tourism Business Scheme
24. Number of enterprises taking environmental management measures such as recycling
23
13 Conclusion Despite the multiplicity of existing indicator sets, it is important to note that only four of the eleven sets are specifically focused on tourism and only two of those actually target sustainable tourism. As far as the authors are aware, only one of these sets (Greenglobe21) has been implemented and critically reviewed in a tourism destination to date. The other indicator sets relate to sustainability or environmental management and these are likely to feature strongly in the management of tourism within the Cairngorms National Park. Whilst the sets help to illustrate how indicators can be expressed and allows the CNPA and ViSIT forum to build on existing knowledge, it is unlikely that any of these sets can be adopted as they stand. The purpose of the checklist provided in the Framework for Developing Indicators of Sustainable Tourism report is to allow a structured and transparent appraisal of existing indicators to ensure that those adopted are appropriate, cost-effective and will help to deliver truly sustainable tourism.