Embed Size (px)
Citation preview
INDICATORS FOR SUSTAINABLE ENERGY DEVELOPMENT
Natasa MarkovskaSenior Scientific Collaborator
Research Center for Energy, Informatics and MaterialsMacedonian Academy of Sciences and Arts
ICEIM-MANU
French-Serbian European Summer University:Renewable Energy Sources and Environment – Multidisciplinary AspectVrnjacka Banja, 17-24 October
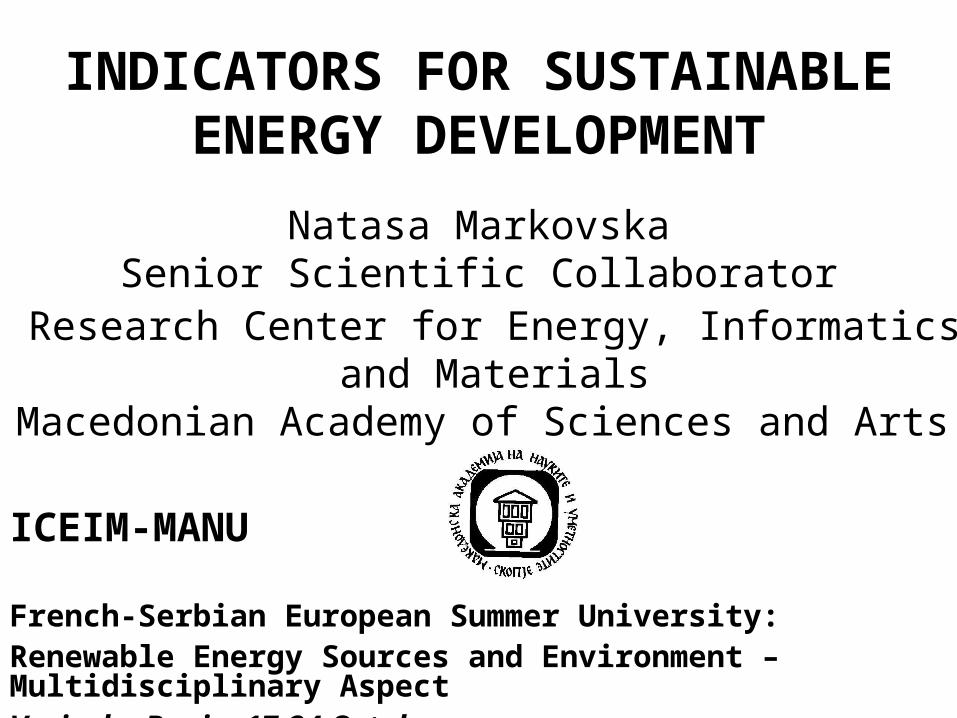
Contents1. Introduction
2. Indicators for Sustainable Energy Development2.1. Present Sets
2.2. Risk-Related ISED
3. Proposed Improvements
4. Mind ISED4.1. Cognitive
4.2. Emotional
4.3. Moral
5. Greenhouse Gases Indicator in Macedonian Conditions5.1. Pressure
5.2. Response: Mitigation Measures
6. Conclusions
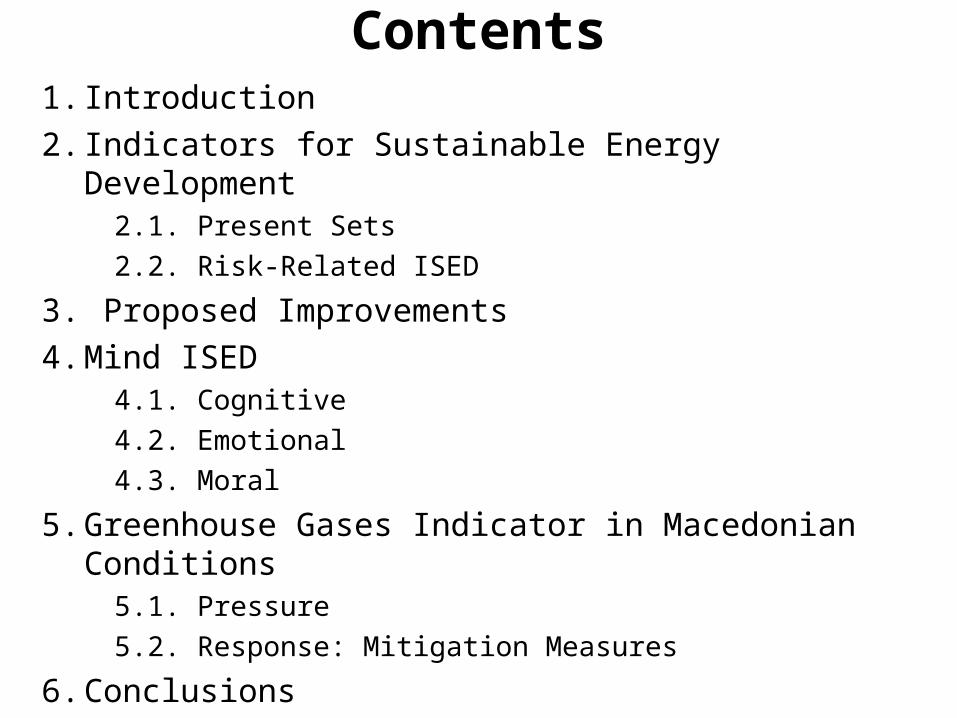
1. Introduction: Basic energy-related principle for sustainability
• Supplying enough energy to meet the needs, while minimizing the negative impact on the environment which is associated not only to the energy production but also to the energy use.
This means • economic management of the existing depletive energy
resources, which simultaneously are the most intensive polluters
• progressive breakthrough of the inherently sustainable renewable energy sources (RES) as “clean technologies” in this sector, intertwined with the energy efficiency practices and technologies.

EU Sustainable Development Strategy, June 2006
First key challenge: Climate Change and Clean Energy
Overall Objective: To limit climate change and its costs and negative effects to society and the environment Operational objectives and targets • Kyoto Protocol commitments of the EU-15 and most EU-25 to targets for reducing GHG by 2008 – 2012, whereby the EU-15 target is for an 8% reduction in emissions compared to 1990 levels. Aiming for a global surface average temperature not to rise by more than 2.C compared to the pre-industrial level. • Energy policy should be consistent with the objectives of security of supply, competitiveness and environmental sustainability, in the spirit of the Energy Policy for Europe launched in March 2006 by the European Council. Energy policy is crucial when tackling the challenge of climate change.
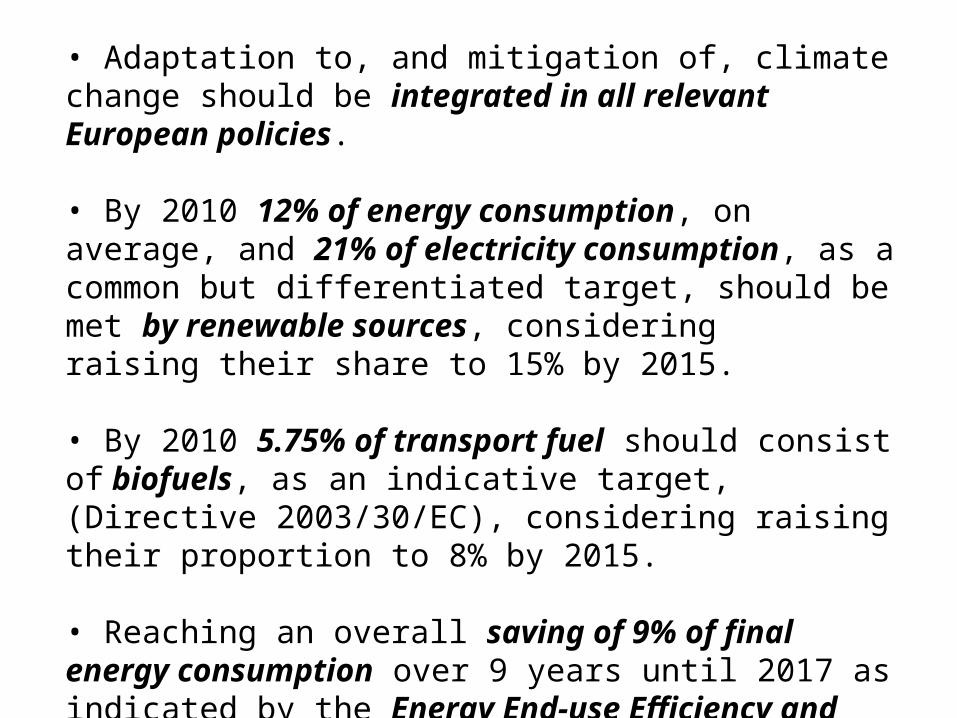
• Adaptation to, and mitigation of, climate change should be integrated in all relevant European policies.
• By 2010 12% of energy consumption, on average, and 21% of electricity consumption, as a common but differentiated target, should be met by renewable sources, considering raising their share to 15% by 2015.
• By 2010 5.75% of transport fuel should consist of biofuels, as an indicative target, (Directive 2003/30/EC), considering raising their proportion to 8% by 2015.
• Reaching an overall saving of 9% of final energy consumption over 9 years until 2017 as indicated by the Energy End-use Efficiency and Energy Services Directive.
2. Indicators for Sustainable Energy Development
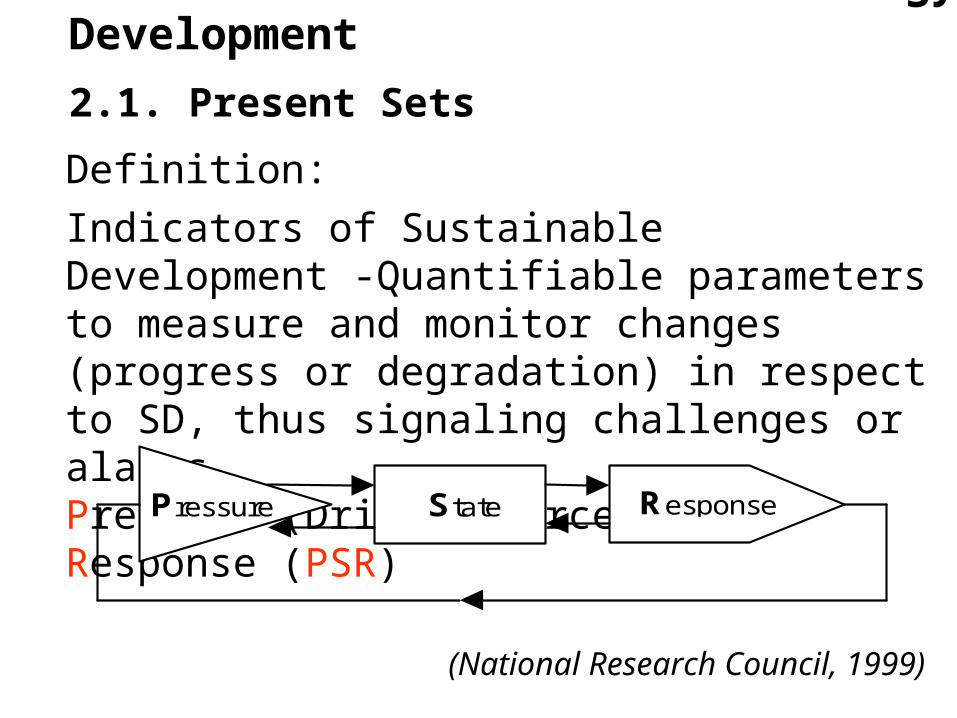
2.1. Present Sets
Definition:
Indicators of Sustainable Development -Quantifiable parameters to measure and monitor changes (progress or degradation) in respect to SD, thus signaling challenges or alarms.Pressure (Driving Force)–State–Response (PSR)
Pressure State Response
(National Research Council, 1999)
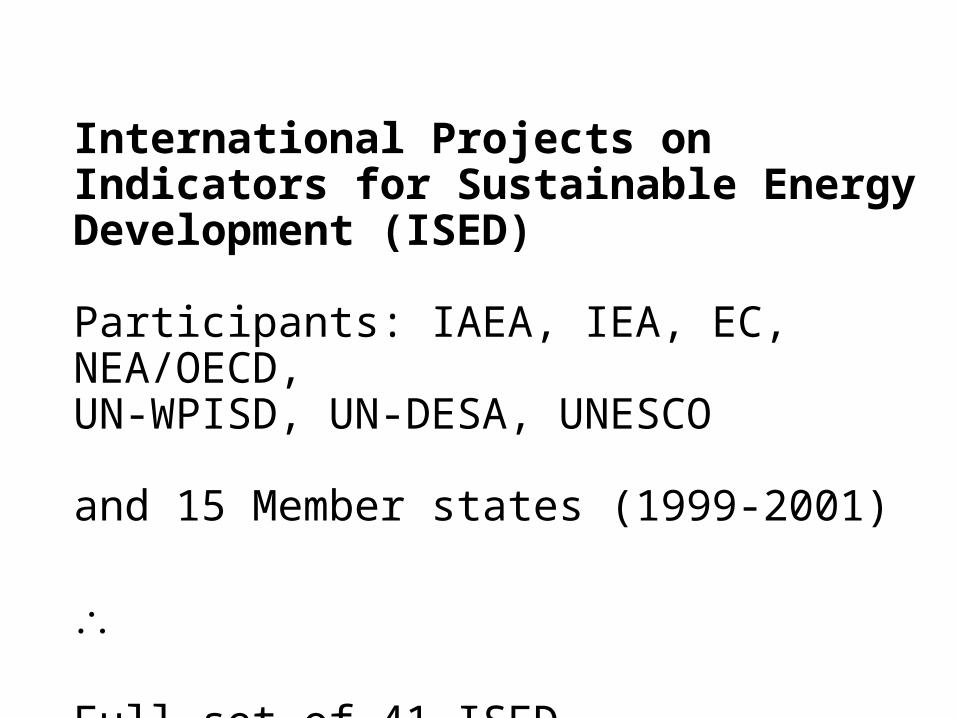
International Projects on Indicators for Sustainable Energy Development (ISED)
Participants: IAEA, IEA, EC, NEA/OECD, UN-WPISD, UN-DESA, UNESCO and 15 Member states (1999-2001)
Full set of 41 ISEDCore set of 23 ISED

Core ISED distilled by IAEA-IEA (2001)1. End-use energy prices with and without
tax/subsidy
2. Energy intensity: manufacturing, transporta-tion, agriculture, commercial and publicservices, residential sector
3. Energy mix: final energy, electricitygeneration, primary energy supply
4. Energy supply efficiency: fossil fuelefficiency for electricity generation
5. Energy use per unit of GDP
6. Expenditure on energy sector: total invest-ments, environmental control, hydrocarbonexploration and development, RD&D, netenergy import expenses
7. Energy consumption per capita
8. Indigenous energy production
9. Net energy import dependence
10. Fraction of disposable income/privateconsumption spent on fuel and electricity by:average population; group of 20% poorestpopulation
11. Fraction of households: heavily dependent onnon-commercial energy; without electricity
12. Quantities of air pollutant emissions (SO2;NOx particulates, CO2, VOC)
13. Ambient concentration of pollutants in urbanareas: SO2, NOX, suspended particulates,ozone
14. Quantities of greenhouse gas emissions
15. Generation of solid waste
16. Accumulated quantity of solid wastes to bemanaged
17. Generation of radioactive waste
18. Accumulated quantity of radioactive wastesawaiting disposal
19. Land area taken up by energy facilities andinfrastructure
20. Fatalities due to accidents with breakdown byfuel chains
21. Fraction of technically exploitable capability ofhydropower currently in use
22. Proven recoverable fossil fuel reserves
23. Intensity of use of forest resources as fuelwood
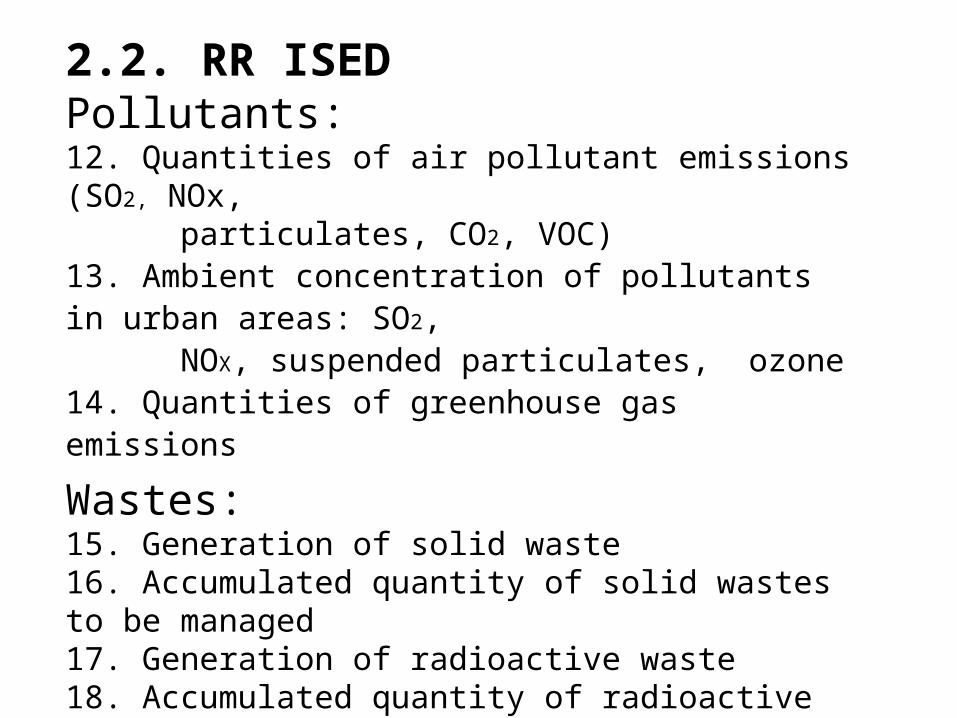
2.2. RR ISED
Pollutants:12. Quantities of air pollutant emissions (SO2, NOx, particulates, CO2, VOC)13. Ambient concentration of pollutants in urban areas: SO2, NOX, suspended particulates, ozone 14. Quantities of greenhouse gas emissions
Wastes: 15. Generation of solid waste16. Accumulated quantity of solid wastes to be managed17. Generation of radioactive waste 18. Accumulated quantity of radioactive wastes awaiting disposal
Fatalities:20. Fatalities due to accidents with breakdown by fuel chains

Missing RR ISED
(a) Fatalities (i.e. man-days lost) due to normal operation of the plant
Standard health risk values for different energy systems(I-Inhaber, P-Pop-Jordanov, B-Brikhofer, K-Kollas and Papazoglow)
(Pop-Jordanova and Pop-Jordanov, 1996)
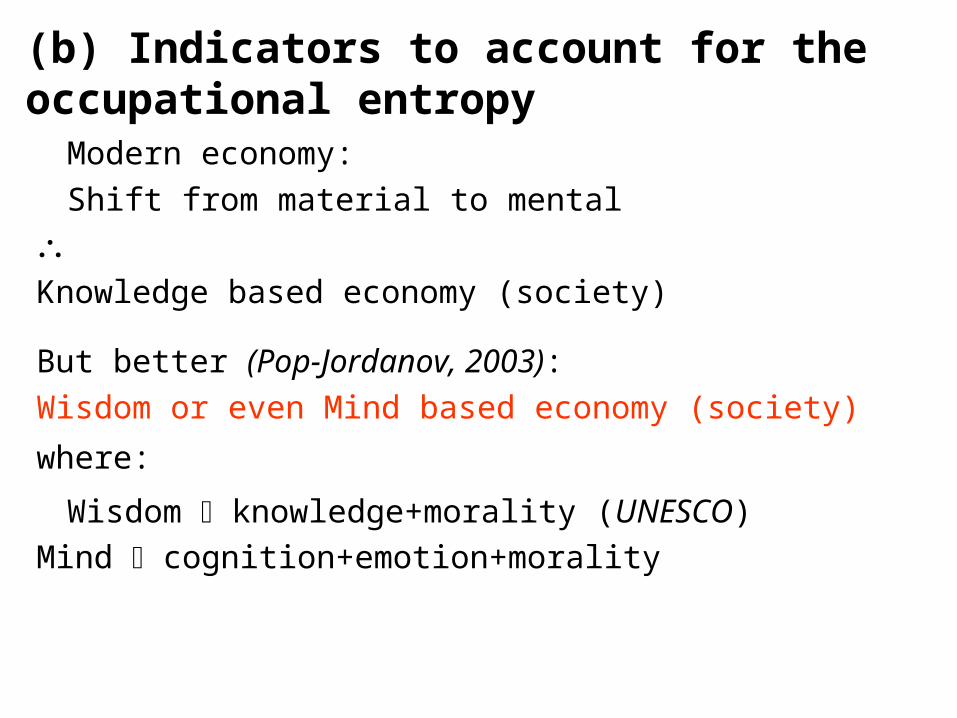
(b) Indicators to account for the occupational entropy
Modern economy:
Shift from material to mental
Knowledge based economy (society)
But better (Pop-Jordanov, 2003):
Wisdom or even Mind based economy (society)
where:
Wisdom knowledge+morality (UNESCO)
Mind cognition+emotion+morality
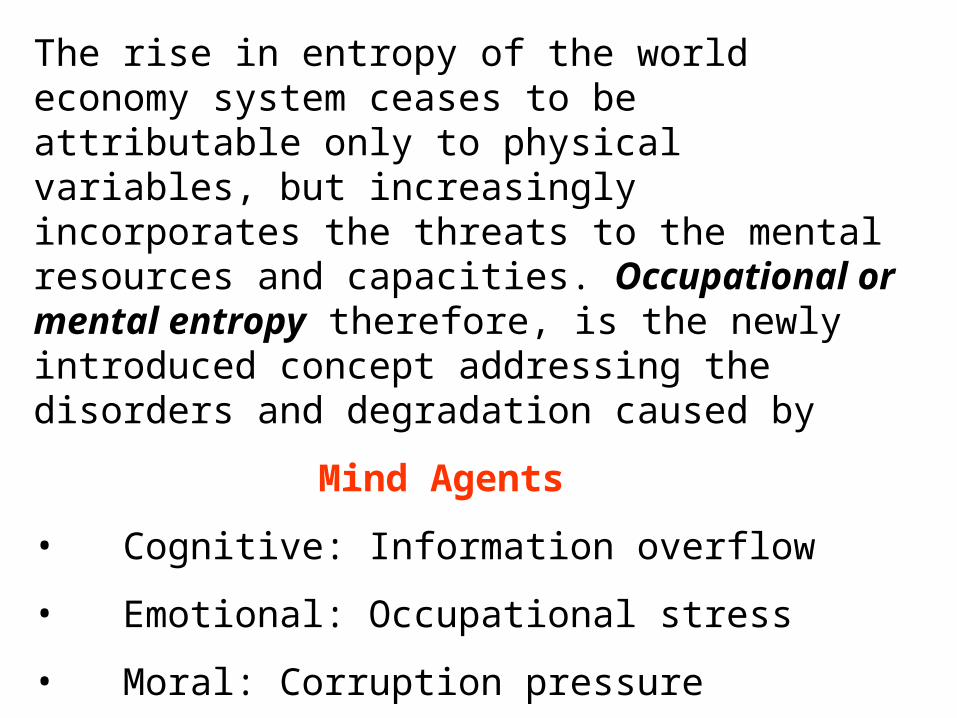
The rise in entropy of the world economy system ceases to be attributable only to physical variables, but increasingly incorporates the threats to the mental resources and capacities. Occupational or mental entropy therefore, is the newly introduced concept addressing the disorders and degradation caused by
Mind Agents
• Cognitive: Information overflow
• Emotional: Occupational stress
• Moral: Corruption pressure
(Pop-Jordanov, Markovska et al, 2004)
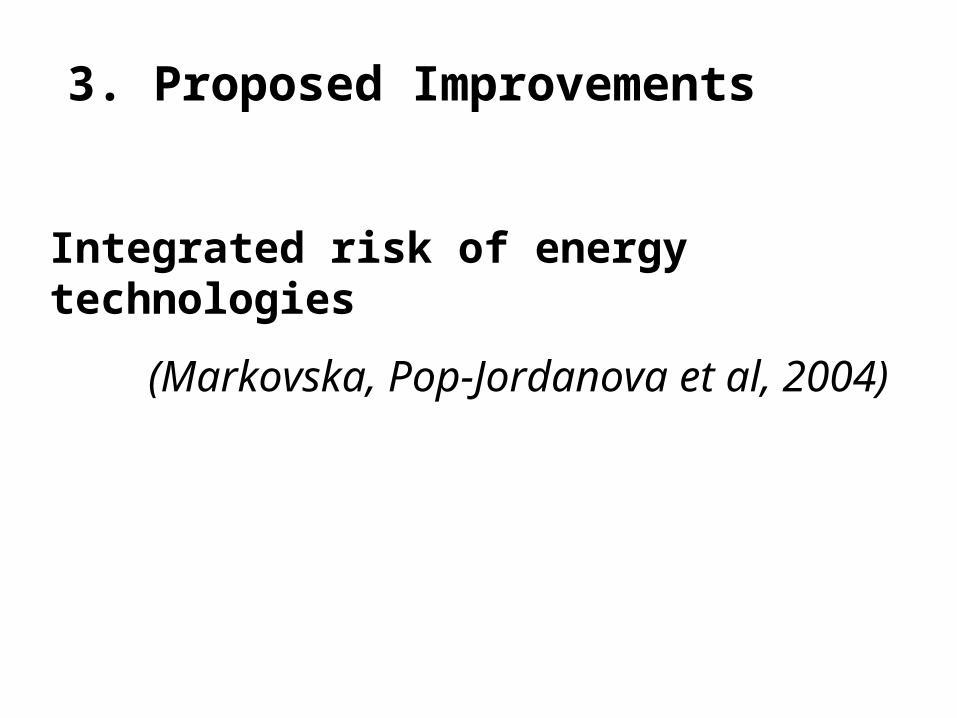
Integrated risk of energy technologies
(Markovska, Pop-Jordanova et al, 2004)
3. Proposed Improvements
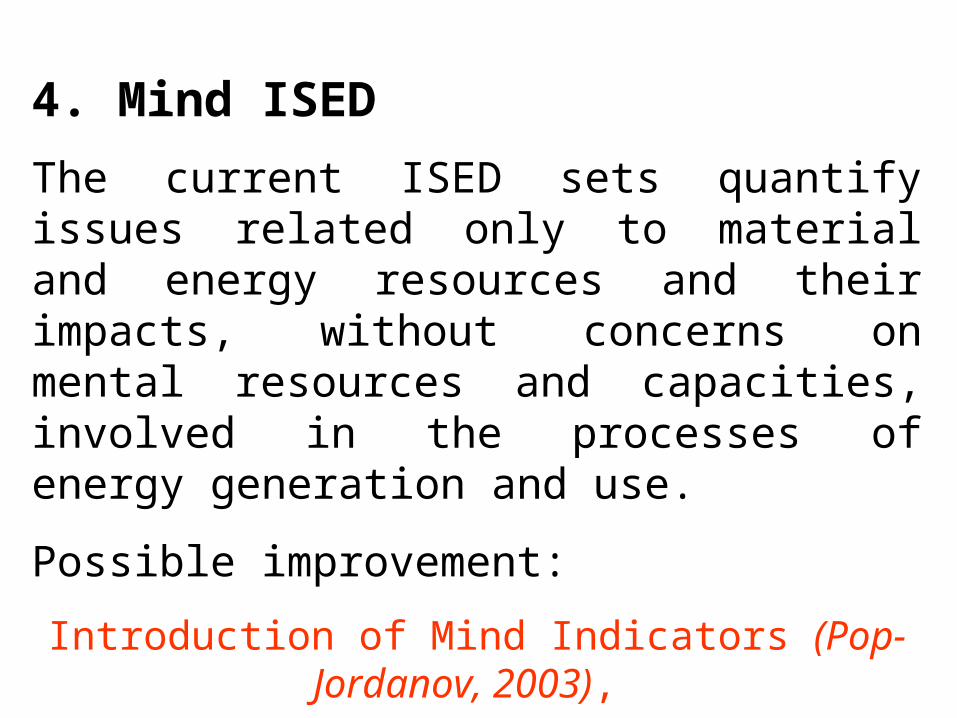
4. Mind ISED
The current ISED sets quantify issues related only to material and energy resources and their impacts, without concerns on mental resources and capacities, involved in the processes of energy generation and use.
Possible improvement:
Introduction of Mind Indicators (Pop-Jordanov, 2003),
as additional RR ISED
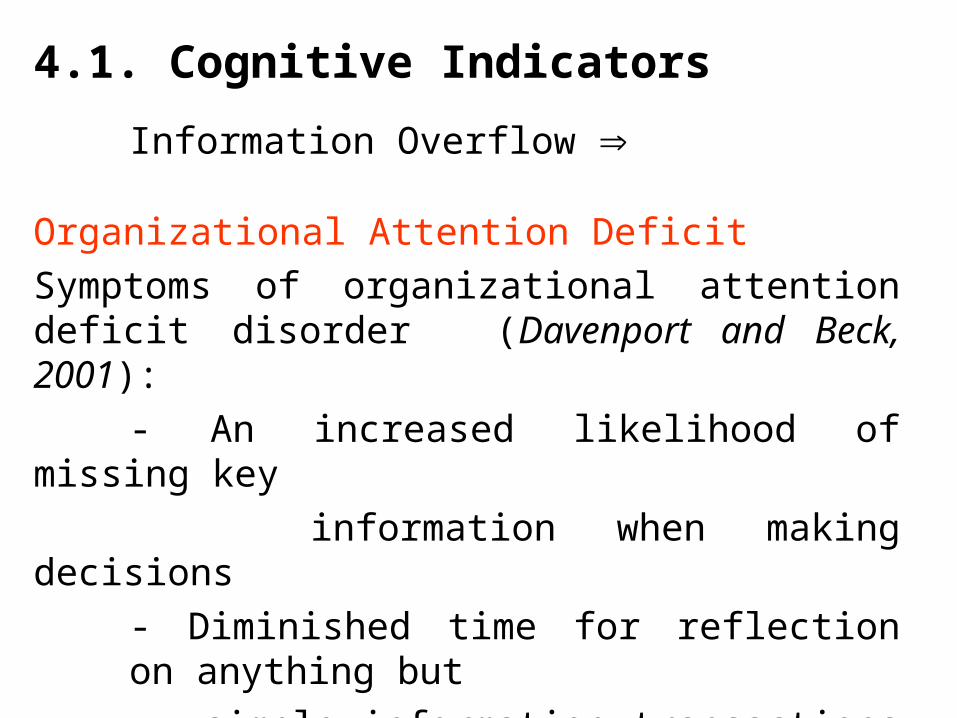
4.1. Cognitive Indicators
Information Overflow Organizational Attention Deficit
Symptoms of organizational attention deficit disorder (Davenport and Beck, 2001):
- An increased likelihood of missing key
information when making decisions
- Diminished time for reflection on anything but
simple information transactions such as e-mail
and voice mail
- Difficulty in holding others attention
- Decreased ability to focus when necessary
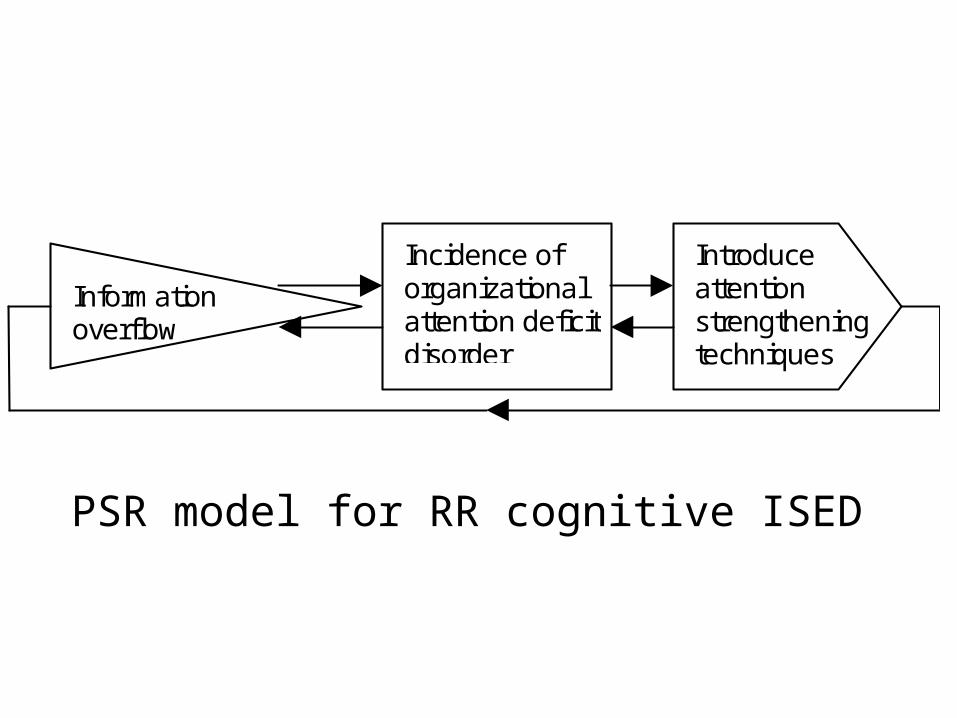
Informationoverflow
Incidence oforganizationalattention deficitdisorder
Introduceattentionstrengtheningtechniques
PSR model for RR cognitive ISED
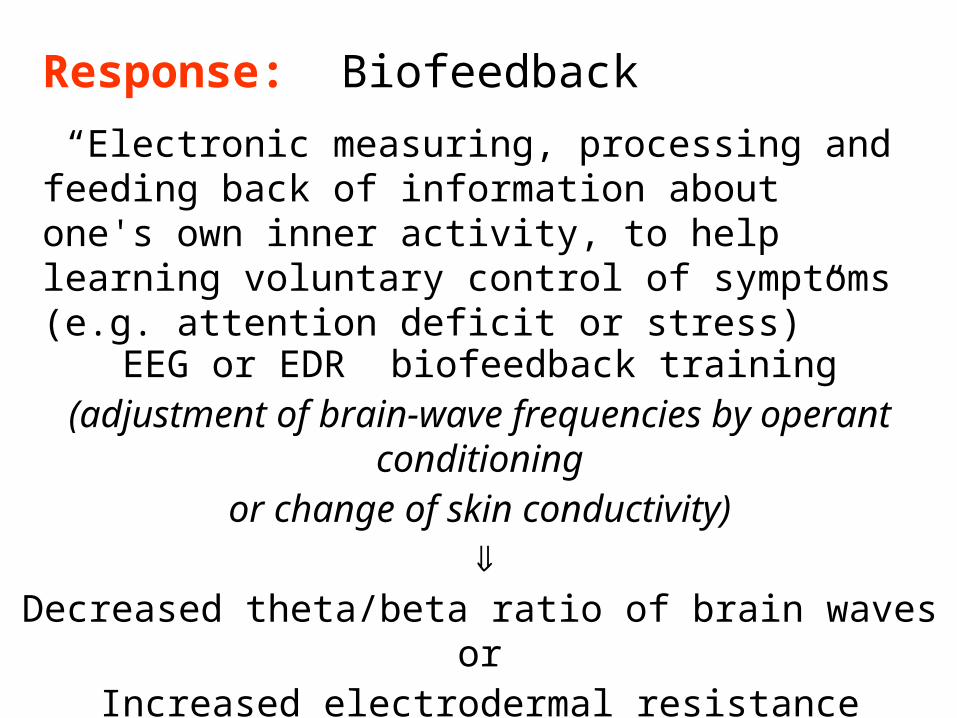
Response: Biofeedback
“Electronic measuring, processing and feeding back of information about one's own inner activity, to help learning voluntary control of symptoms (e.g. attention deficit or stress)”
EEG or EDR biofeedback training(adjustment of brain-wave frequencies by operant conditioning
or change of skin conductivity)
Decreased theta/beta ratio of brain waves orIncreased electrodermal resistance
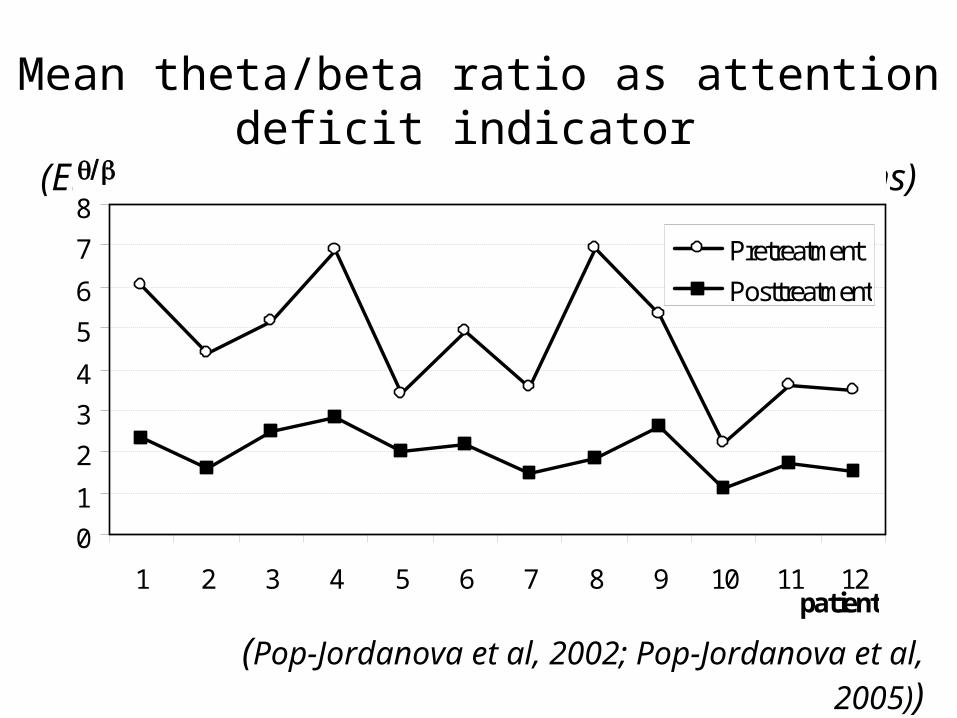
Mean theta/beta ratio as attention deficit indicator (EEG biofeedback treatment, 12 patients, 40 sessions)
0
1
2
3
4
5
6
7
8
1 2 3 4 5 6 7 8 9 10 11 12patient
Pretreatment
Posttreatment
(Pop-Jordanova et al, 2002; Pop-Jordanova et al, 2005))
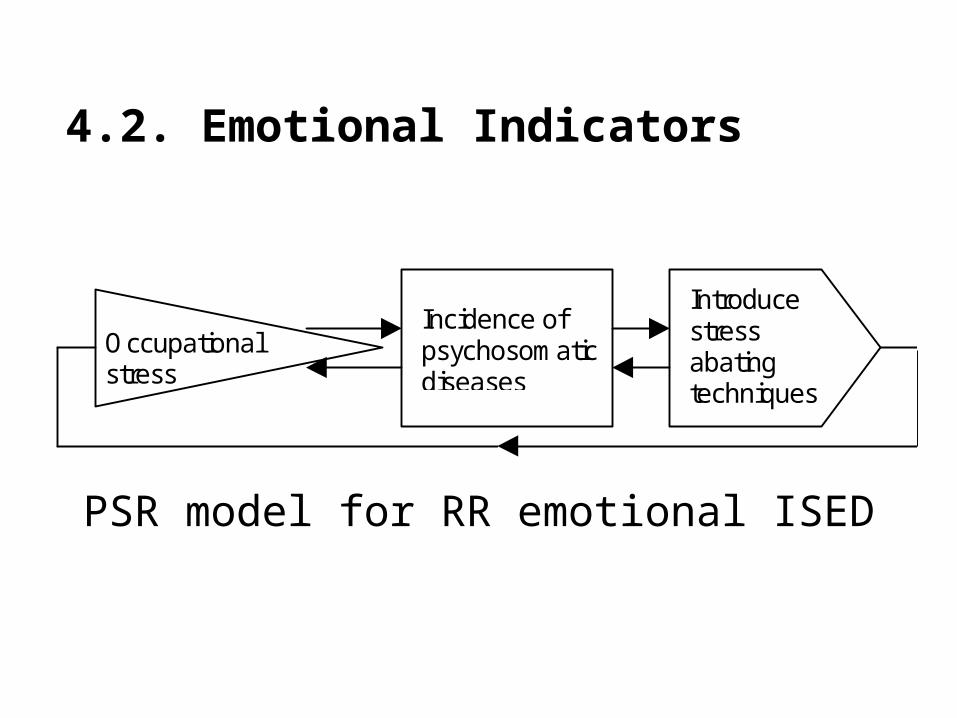
Occupationalstress
Incidence ofpsychosomaticdiseases
Introducestressabatingtechniques
PSR model for RR emotional ISED
4.2. Emotional Indicators

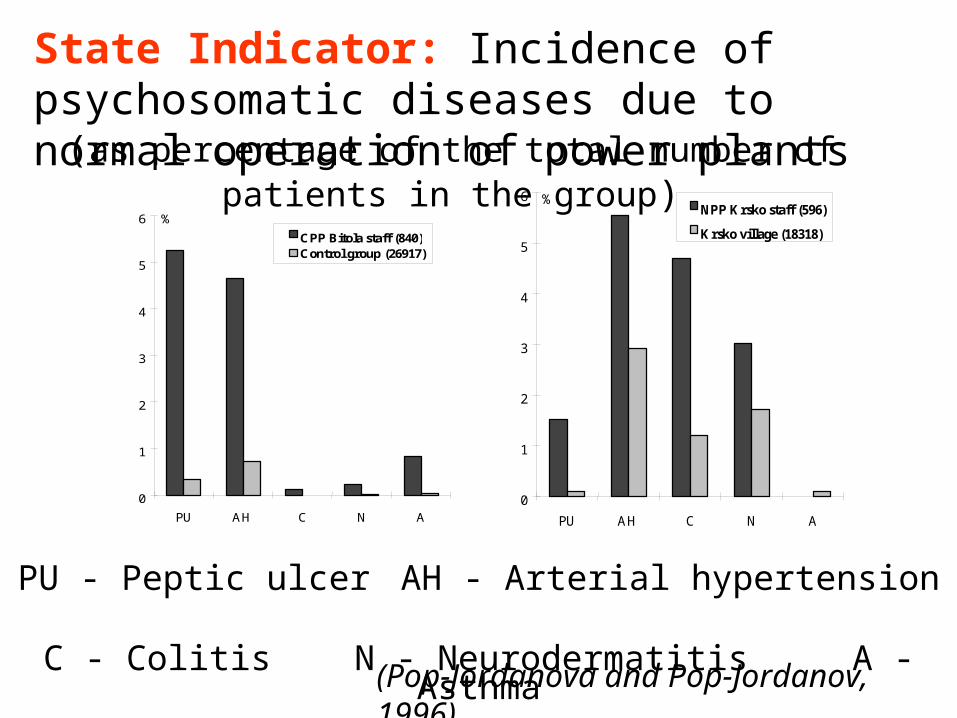
Pressure Indicator: Occupational stress
Inverse causality model in risk assessment
Internal (psychological) agent → functional disorder
→ material or tissue harm
0
1
2
3
4
5
6
PU AH C N A
CPP Bitola staff (840)Control group (26917)
%
PU - Peptic ulcer AH - Arterial hypertensionC - Colitis N - Neurodermatitis A - Asthma
0
1
2
3
4
5
6
PU AH C N A
NPP Krsko staff (596)
Krsko village (18318)
%
State Indicator: Incidence of psychosomatic diseases due to normal operation of power plants
(Pop-Jordanova and Pop-Jordanov, 1996)
(as percentage of the total number of patients in the group)
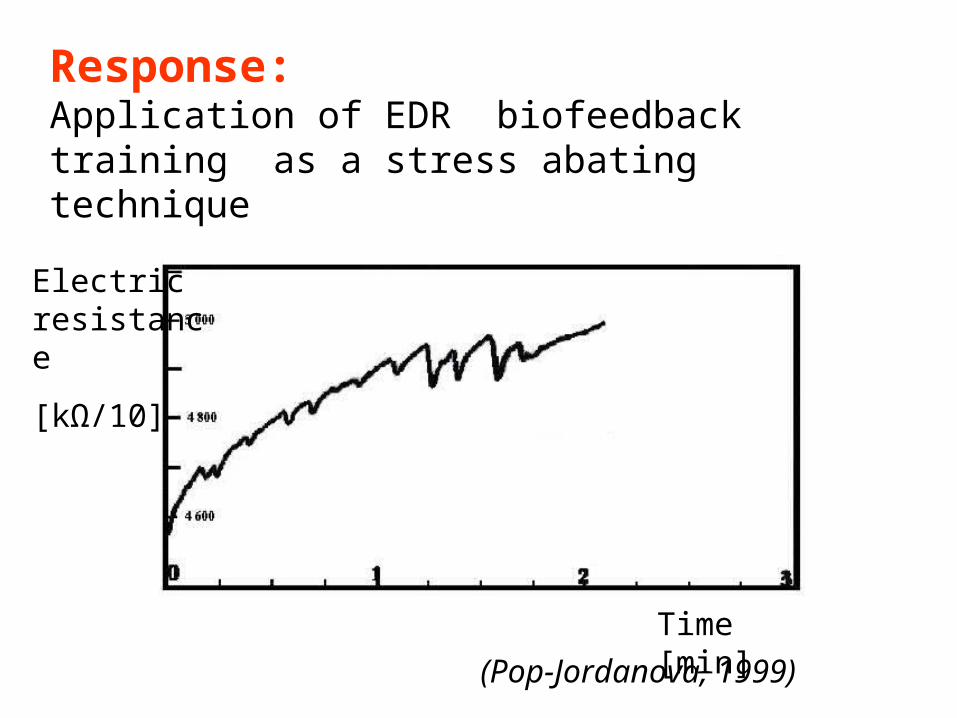
Response:Application of EDR biofeedback training as a stress abating technique
Electric resistance
[kΩ/10]
(Pop-Jordanova, 1999)
Time [min]

4.3. Moral Indicators
Corruptionpressure
Detrimental contracts
Improper employment
Introducecorruptiondepressurizingmechanisms
PSR model for RR moral ISED
Lost of human capital
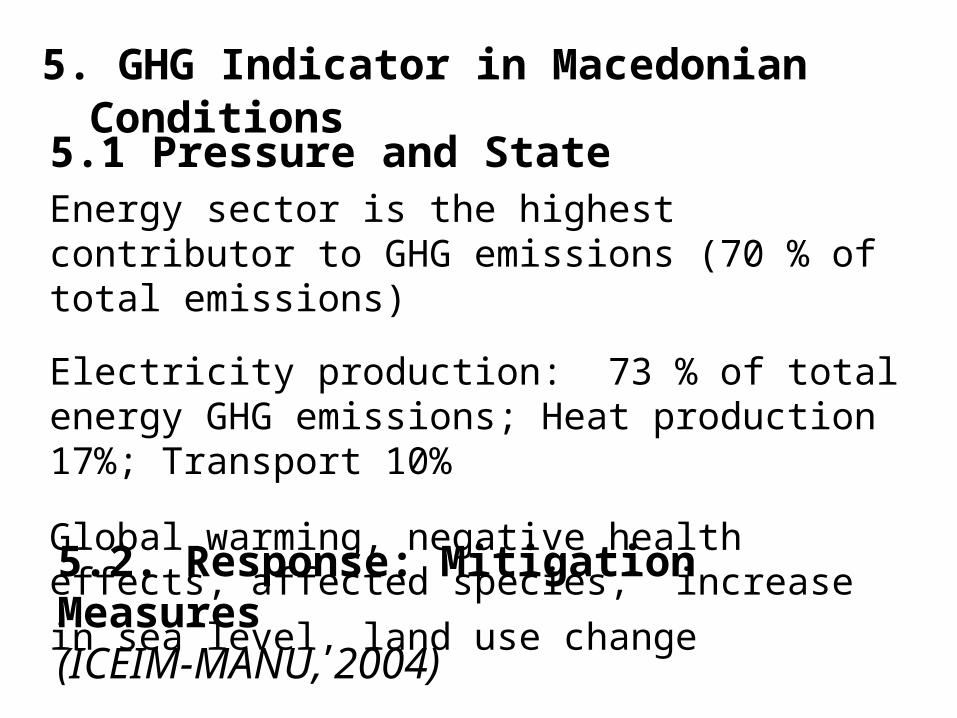
5. GHG Indicator in Macedonian Conditions
5.1 Pressure and StateEnergy sector is the highest contributor to GHG emissions (70 % of total emissions)
Electricity production: 73 % of total energy GHG emissions; Heat production 17%; Transport 10%
Global warming, negative health effects, affected
species, increase in sea level, land use change
5.2. Response: Mitigation Measures(ICEIM-MANU, 2004)
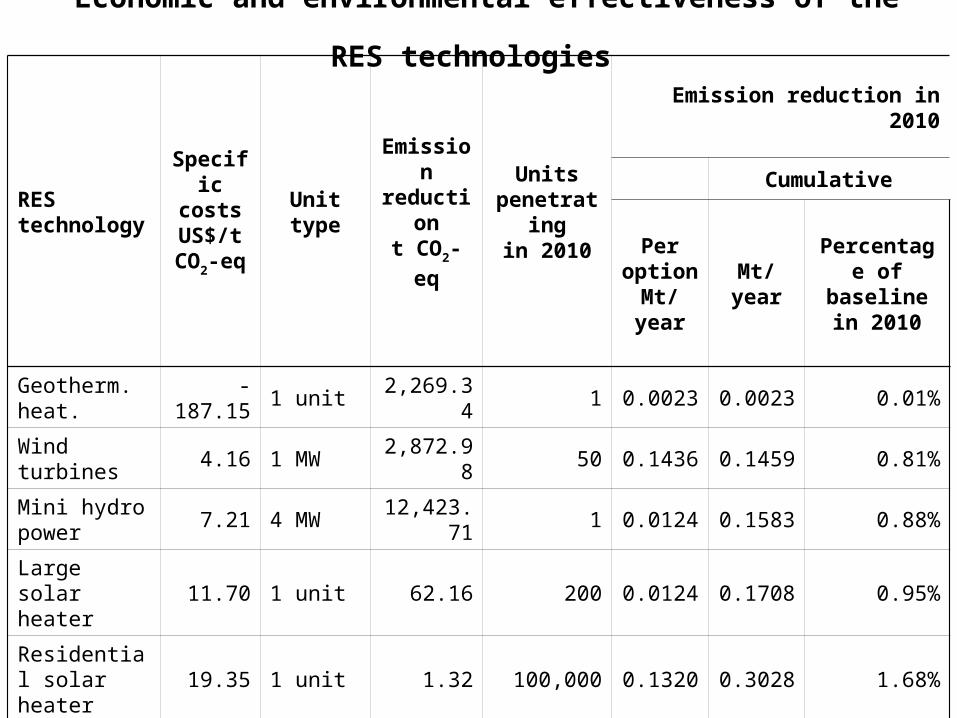
Economic and environmental effectiveness of the RES technologies
RES technology
Specific costsUS$/t
CO2-eq
Unit typeEmissionreductiont CO2-eq
Unitspenetrating
in 2010
Emission reduction in 2010
Cumulative
Per option
Mt/yearMt/year
Percentage of baseline in
2010
Geotherm. heat.
-187.15 1 unit 2,269.34 1 0.0023 0.0023 0.01%
Wind turbines 4.16 1 MW 2,872.98 50 0.1436 0.1459 0.81%
Mini hydro power
7.21 4 MW 12,423.71 1 0.0124 0.1583 0.88%
Large solar heater
11.70 1 unit 62.16 200 0.0124 0.1708 0.95%
Residential solar heater
19.35 1 unit 1.32 100,000 0.1320 0.3028 1.68%
Biogas from agro-ind. sewage water
43.21 1 digester 11,699.89 3 0.0351 0.3379 1.88%
Grid connected PVs
398.22 1 kW 1.10 500 0.0006 0.3384 1.88%
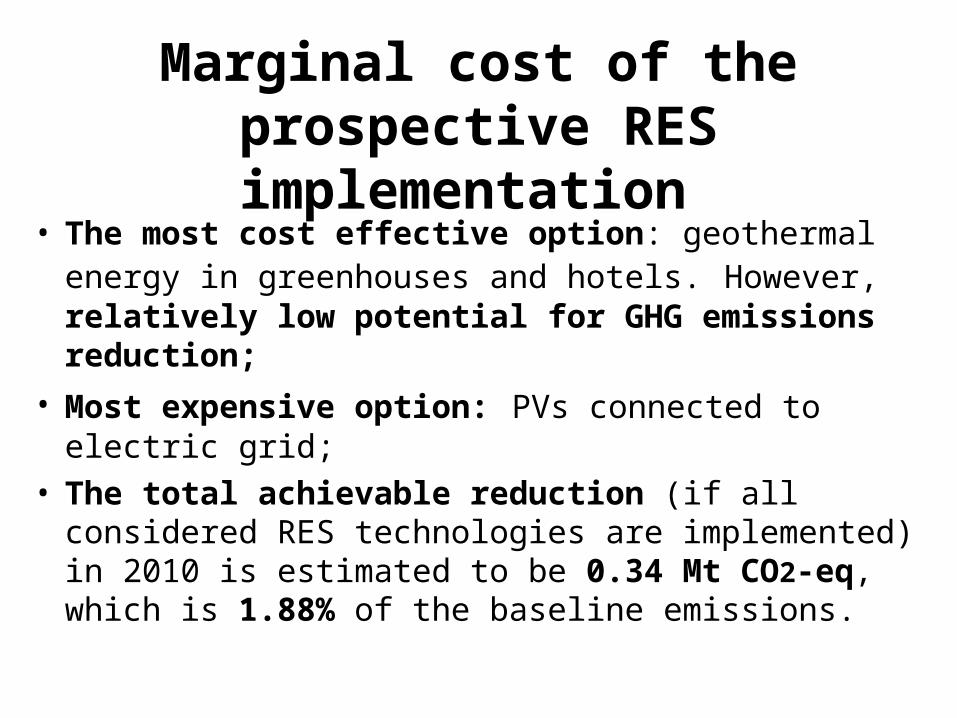
Marginal cost of the prospective RES implementation
• The most cost effective option: geothermal energy in greenhouses and hotels. However, relatively low potential for GHG emissions reduction;
• Most expensive option: PVs connected to electric grid;
• The total achievable reduction (if all considered RES technologies are implemented) in 2010 is estimated to be 0.34 Mt CO2-eq, which is 1.88% of the baseline emissions.
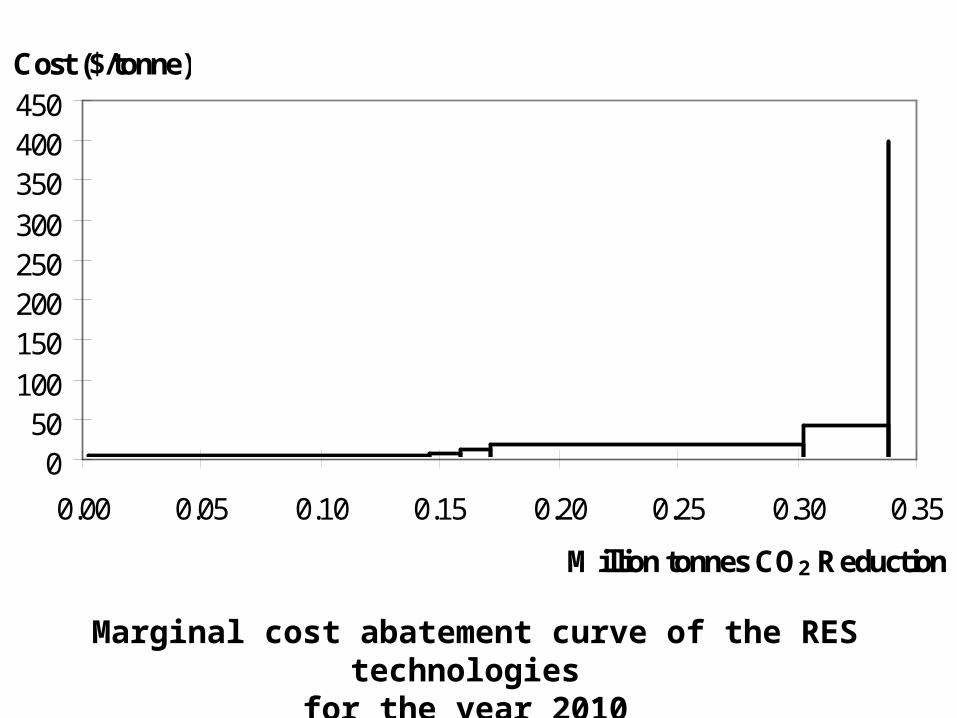
Marginal cost abatement curve of the RES technologies for the year 2010
050
100150200250300350400450
0.00 0.05 0.10 0.15 0.20 0.25 0.30 0.35
Million tonnes CO2 Reduction
Cost ($/tonne)
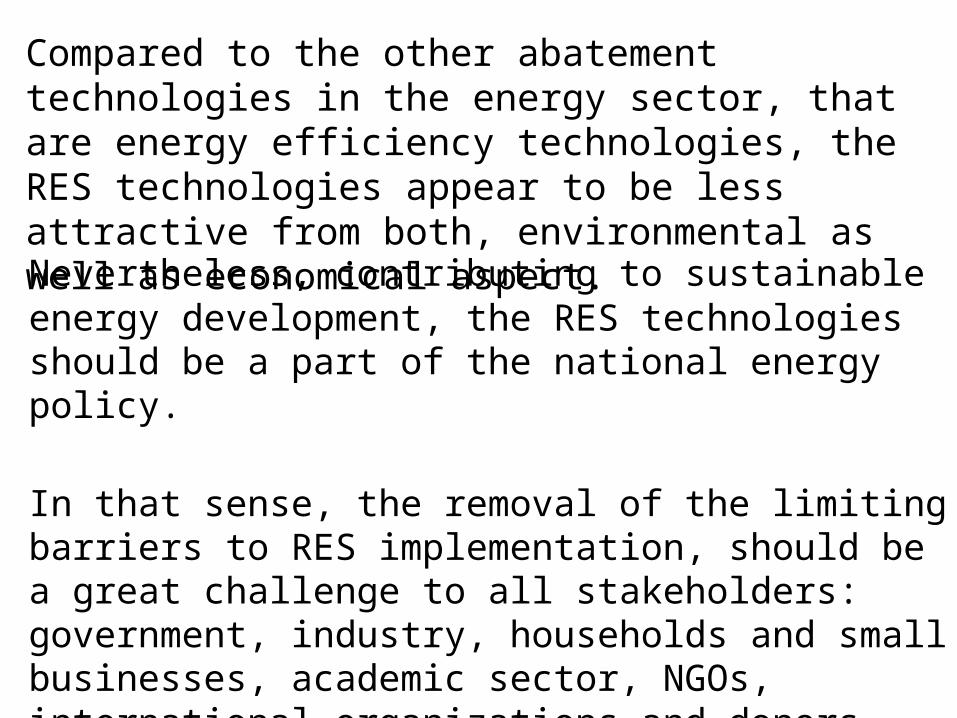
Compared to the other abatement technologies in the energy sector, that are energy efficiency technologies, the RES technologies appear to be less attractive from both, environmental as well as economical aspect.
Nevertheless, contributing to sustainable energy development, the RES technologies should be a part of the national energy policy.
In that sense, the removal of the limiting barriers to RES implementation, should be a great challenge to all stakeholders: government, industry, households and small businesses, academic sector, NGOs, international organizations and donors.
6. Conclusions
• The introduced occupational entropy and
the related risks represent a potential new
theme within the social dimension of
sustainable energy development.
• There is a gap in the existing lists of
indicators, as a result of overlooking the
negentropic effects of modern economy
shift towards non-material resources and
capacities.
• The concept of integrated risks comprising mind indicators (cognitive, emotional and moral) help filling this gap.
• The proposed risk-related indicators and the corresponding response measures are shown to be of particular importance for efficient assessment and management of risks related to various energy technologies.
• As to the application of the ISED in Macedonian conditions, the GHG indicator is a good example of conforming the national anlyses with the internationally adopted PSR concept. More or less, similar analyses are needed for the rest of the ISED.
REFERENCES
Davenport, H.T. and Beck, C. J. (2001), The Attention Economy, Harvard Business School Press, Boston, Massachusetts.
IAEA-IEA (2001), Indicators for Sustainable Energy Development, Joint IAEA and IEA Contribution to CSD-9, New York.
ICEIM-MANU (2004), Technology Needs Assessment in the Energy Sector, UNDP-GEF/Ministry of Environment and Physical Planning, Skopje
Markovska, N., Pop-Jordanova, N., Pop-Jordanov, J. (2004), Energy Technologies and Integrated Risks, “Energy and Culture”, (Ed. B. Dooley) pp. 300-320
National Research Council, (1999), Our Common Journey, National Academy Press, Washington, D.C.
Pop-Jordanov, J. (2003), Indicators for Sustainable Energy Development from a Negentropic Perspective, Original Paper, Clean Techn. Environ. Policy 5, pp. 273-278; Published also in (2004): Technological Choices for Sustainability, (Sikdar, S.K., Glavic, P., Jain, R., Editors), Springer, pp. 305-316.
Pop-Jordanov, J., Markovska, N., Pop-Jordanova, N., Simoska, S. (2004), Occupational Entropy and Mind Indicators for Sustainable Energy Development, International Journal of Green Energy, Vol.1, No.3, pp. 1-9.
Pop-Jordanova, N. (1999), Electrodermal Response Based Biofeedback in Pediatric Patients, Paediatria Croatica, 3, pp. 117-121.

Pop-Jordanova, N. and Pop-Jordanov, J. (1996), Psychosomatic and Substitution Effects: Comparative Health Risks from Electricity Generation, Electricity, Health and Environment, IAEA, Vienna, pp.177-187.
Pop-Jordanova, N. and Pop-Jordanov, J. (2002), Psychophysiological Comorbidity and Computerized Biofeedback, Artificial Organs, 25, 5, pp. 429-433
Pop-Jordanova, N., Zorcec, T., Markovska-Simoska S. (2005), Neurofeedback Treatment of Children with Attention Deficit Hyperactivity Disorder, MASA Contributions, Sec. Biol. Med. Sci., XXVI 1, pp. 71-80.