Embed Size (px)
Citation preview

Mires and Peat, Volume 19 (2017), Article 15, 1–21, http://www.mires-and-peat.net/, ISSN 1819-754X
© 2017 International Mire Conservation Group and International Peatland Society, DOI: 10.19189/MaP.2016.OMB.255
1
Indicative effects of climate change on groundwater levels
in Estonian raised bogs over 50 years
E. Lode1,2, M. Küttim1,3 and I.-K. Kiivit3
1Institute of Ecology, School of Natural Sciences and Health, Tallinn University, Estonia
2Soil & Environment Dept., Faculty of Forest Science, Swedish University of Agricultural Sciences, Uppsala, Sweden 3School of Natural Sciences and Health, Tallinn University, Estonia
_______________________________________________________________________________________
SUMMARY
Analyses of 50-year (1962–2011) monthly air temperature and precipitation data indicated substantial climate
change in the locations of two raised bogs (Linnusaare and Männikjärve) in central-east Estonia. During recent
years the cross-year winter air temperature increased by 1.7 ºC, while the cold-season precipitation increased
by 4 mm. The fluctuation amplitude of temperature and precipitation values decreased. Snow depth proved to
be the most sensitive variable to winter warming, followed by groundwater levels together with mean and
maximum soil frosts. Long-term groundwater levels on the domes of the bogs and in the forested/treed lagg
areas were 0.3−0.4 m and 0.4−0.8 m below the soil surface, respectively. Warming caused changes in
groundwater level amplitude of 3−22 cm in the bog domes and 3−14 cm in the forested lagg zones. The lowest
groundwater levels in ridge-pool ecotopes at Männikjärve rose by 6−10 cm (i.e. these ecotopes became wetter);
but the incidence of low groundwater levels increased in most ecotopes, indicating a more general trend
towards drier conditions in the bog.
KEY WORDS: mire water level, peat frost, peatland, snow cover, winter warming
_______________________________________________________________________________________
INTRODUCTION
Groundwater level and its oscillations in patterned
bogs (Lode & Leivits 2011) are determined by
surface relief and microform types (Mikhaylov et al.
2007). The lowest groundwater levels generally
occur in tree-colonised parts of the bog, and the
highest water levels in treeless open parts (ibid.). The
groundwater level indicates the water storage
capacity in the zone of active groundwater level
fluctuation (Bay 1968), and in mires this is an
indicator for ecosystem health (Labadz et al. 2010).
Primary factors influencing groundwater
fluctuations in a bog are precipitation, vegetation,
local hydrogeology and type of peat material (Boelter
1964, Bay 1968).
In natural conditions, the general pattern of
groundwater level dynamics is rather stable
throughout the year. However, any long-term
lowering of the groundwater level causes compaction
of the overall peat volume, resulting in a subsided
bog surface level, which may maintain the
groundwater level close to the surface despite the
reduced total volume of water stored in the bog
massif (Strack et al. 2008).
In an undisturbed peat body, the zone of active
groundwater level fluctuation has a rapidly changing
vertical profile of moisture and aeration conditions,
caused by a relatively rapid downward increase in its
degree of decomposition (Ivanov 1953, Romanov
1968, Ingram 1978). A transition occurs from high
hydraulic conductivity (105 m d-1 or greater) near the
bog surface towards considerably lower values
(1–10 m d-1) at a depth of some decimetres below the
surface. Thus, the change in hydraulic conductivity
in the acrotelm/catotelm boundary layer may be
several orders of magnitude (Van der Schaaf 2004).
In spite of its shallowness, the upper part of the peat
body, i.e. the acrotelm, is the only aquifer in the bog.
The thickness of this aquifer is indicated by the
lowest water levels (e.g. Ivanov 1981) and it acts as
a regulating system for the bog outflow in response
to storm water inputs (e.g. Verry et al. 1988, Van der
Schaaf 1999 cit. Van der Schaaf 2004, Daniels et al.
2008).
Acidic and nutrient-poor bogs with patterning
formed by pools, hummocks and lawns provide a
microform range of groundwater level dynamics that
are suitable for specialised plant assemblages
dominated by Sphagnum mosses (Morgan-Jones et
al. 2005). Each of the Sphagnum species is most
successful within a specific range of heights relative
to the groundwater level, so that in combination they
build microforms where the plant cover shows
vertical zonation, at the centimetre scale, of both
moss and vascular plant species (Bragg 2002).

E. Lode et al. GROUNDWATER LEVELS IN ESTONIAN RAISED BOGS OVER 50 YEARS
Mires and Peat, Volume 19 (2017), Article 15, 1–21, http://www.mires-and-peat.net/, ISSN 1819-754X
© 2017 International Mire Conservation Group and International Peatland Society, DOI: 10.19189/MaP.2016.OMB.255
2
Moreover, the different types of microforms
composing microtopes have different spatial
arrangements and at a larger scale they are a
functional part of the hydrological system of the
entire mire (Ivanov 1981, Ingram 1987). This results
in sensitivity of the bog surface to small changes in
wetness, which causes the formation of hummocks
and hollows and their associated vegetation, and thus
causes the character of microtopes to vary over a
long-term time schedule (Bragg 2002).
The groundwater level regime (e.g. Mikhaylov et
al. 2007) in a patterned bog is the most important
driving force of biogeochemical processes in the bog,
including carbon cycling and carbon dioxide
absorption capacity (Wu & Roulet 2014), which
govern dissolved organic carbon (DOC) production
and loss in the bog (Fenner et al. 2009). Temperature
plays a key role in controlling the decomposition rate
of peat and is consequently the driver of DOC
concentration (ibid.). In the short term, lowering of
the groundwater level can lead to increased
decomposition of the peat matrix, i.e. aerobic DOC
production. In the longer term, a lower groundwater
level will promote growth of vascular plants over
Sphagnum spp., leading to a number of
biogeochemical changes associated with higher DOC
production and corresponding methane and nitrogen
gas fluxes (Freeman et al. 2001, Toet et al. 2006,
Fenner et al. 2009, Smiljanić et al. 2014).
Predicted future changes in annual air temperature
and precipitation are likely to cause warmer and
wetter winters and springs (Wu & Roulet 2014).
Winter is the season that is most affected by climate
change at high latitudes, where higher air
temperatures can be expected to result in more rain
and decreased snow cover (IPCC 2007). The snow-
free period in pan-arctic regions has already extended
by 3–5 days per decade on average, due to earlier
spring melt (Tedesco et al. 2009). According to
predictions, this will result in 40–80 % fewer days of
snow cover in Europe by the end of the 21st century
(Jylhä et al. 2008). Without the insulation of snow,
the ground is exposed to freezing and soil frost is able
to progress deeper, a phenomenon often referred to as
“colder soils in a warmer world” (Groffman et al.
2001). This is especially problematic for mire
ecosystems, which are considered to be among the
most threatened freshwater ecosystems worldwide
(IPCC 2014), and particularly for European mires
near the southern limit of peat formation (Robroek et
al. 2013). Therefore, changes in the air temperature
regime and other climatological factors may result in
shifts in mire ecosystem carbon fluxes (Joosten &
Clarke 2002, Aurela et al. 2004), infiltration and
surface runoff (Quinton et al. 2008, Nagare et al.
2012) and may also lead to changes in vegetation and
microbial community structure (Kreyling & Henry
2011, Templer 2012, Jassey et al. 2013).
In this study we had access to 50-year monthly
hydrometeorological data from two neighbouring
hemi-boreal raised bogs (Linnusaare and
Männikjärve). Our research questions were: 1) can
we detect any trends that indicate climate change in
monitoring data for air temperature, precipitation,
soil frost (f), snow depth (S) and groundwater level
(GWL) gathered over a period of 50 years? and 2)
how do relationships between ground-level variables
(i.e. f, S and GWL) on the scale of ecotopes and
microforms change through time as a response to
changes in climate?
STUDY AREA
In meteorological terms, Estonia is located on the
west–east climate gradient (CICERO 2000).
Contemporary winter warming is characterised by
lowered air pressure and increased cyclonic activity
(Jaagus et al. 1998, Sepp et al. 2005). During the
second half of the 20th century, mean annual air
temperature in Estonia increased by 1.0–1.7 ºC and
precipitation by around 10 % (Jaagus 2006).
The Linnusaare and Männikjärve patterned bogs
form part of the 26,600 ha Endla Mire Complex,
located in the southernmost part of the Pandivere
upland in central-east Estonia (Figure 1). Linnusaare
Bog is the largest mire massif (1,250 ha) in the Endla
area and since 1997 has been part of the 889 ha
Linnusaare Nature Reserve (EELIS 2015).
Männikjärve Bog (208 ha) is located to the east of
Linnusaare Bog (Kont et al. 2007). This eccentric
bog developed behind the Tooma moraine hillock in
the east and is currently part of the Special
Management Zone (EELIS 2015). Both bogs are of
limnogeneous origin and contemporary ecotopes
contain elongated ridges, pools and hollow
microforms up to several metres long.
The Endla area has a long history of drainage. The
northern part of Linnusaare Bog was intensively
drained in 1935. The lake level in Männikjärve Bog
was lowered in 1820–1890 and drainage of the
southern and northern surroundings of the bog for
forestry occurred in 1910–1914 and 1963–1964. A
deep channel was excavated to the south of the bog
in 1912. Minor manual peat cutting took place in the
eastern part of Männikjärve Bog in the early 20th
century (Ilomets et al. 2007). Some surface levelling
was performed in 1962 and indicated a surface drop
of approximately 1 m around the deep channel
(EELIS 2015). The main problem for future
E. Lode et al. GROUNDWATER LEVELS IN ESTONIAN RAISED BOGS OVER 50 YEARS
Mires and Peat, Volume 19 (2017), Article 15, 1–21, http://www.mires-and-peat.net/, ISSN 1819-754X
© 2017 International Mire Conservation Group and International Peatland Society, DOI: 10.19189/MaP.2016.OMB.255
3
Figure 1. Location of study sites on the digital elevation model of Linnusaare (Li) and Männikjärve (Mä)
Bogs (central-east Estonia). The legend lists groundwater (GW) well numbers from west to east. The GW
wells are grouped by ecotope type: a) ridge-pool, b) ridge-hollow, c) forested/treed. The digital elevation
model was created from LiDAR data scanned by the Estonian Land Board.
development and preservation of the open bog
habitats is the intrusion and dispersal of bog pines
towards the centres of the bogs which has occurred
during the last half-century (e.g. Aaviksoo et al. 2008).
METHODS
Field observations
There are currently two (south–north and east–west
orientated) hydrological monitoring transects on
Männikjärve Bog, which were installed in 1950
within the Tooma Mire Station establishment
(Figures 1 and 2). The east–west transect was
extended onto Linnusaare Bog at the end of 1970
(Materialy 1973). The mean peat thickness along
transects is around 6 m in central parts of the bogs,
and 3–4 m in forested laggs. There is an underlying
gyttja layer of thickness 1.5–2 m in the laggs, but it
does not continue beneath the central parts of the
bogs (Materialy 1971). The surroundings of hollows
on the eastern part of the dome of Männikjärve Bog
have a relatively sparse tree layer and Sphagnum has
mostly out-competed vascular plants. Calluna
vulgaris and Empetrum nigrum cover the hummocks,
while Scheuzeria palustris is found in the hollows. In
the centre of the bog, Pinus sylvestris trees are
relatively tall (up to 4–5 m, with crown cover = 0.2)
and are abundant on ridges between the pools
(Figure 3). Sedges dominate the ground layer.
Marginal areas of both bogs are overgrown by
15–20 m high Pinus sylvestris resulting from
drainage by the ditch network connecting with the
Mustjõgi (a natural stream running between the two
bog massifs, see Figure 1), and the ground layer is
dominated by dwarf shrubs (Vaccinium myrtillus,
Rubus chamaemorus, Empetrum nigrum and
Andromeda polifolia). Moving towards the centre of
Linnusaare Bog, Sphagnum-dominated open bog
succeeds the tree-covered marginal area, but in the
area of ridge-pool ecotopes Pinus sylvestris shows
denser and higher growth on the ridges between the
pools than in Männikjärve Bog (e.g. Ilomets 1988).
Observations of variables used in this study were
based on guidelines for mire stations published in
1972 (Nastavljenie 1972). Meteorological observations,
i.e. air temperature and precipitation, were conducted
at the bog meteorological (meteo) station in the
centre of Männikjärve Bog and at a station on mineral
soil located 1 km east-south-east of the meteo station
on the bog (Materialy 1980). The observations at the
mineral soil meteo station were done year-round,

E. Lode et al. GROUNDWATER LEVELS IN ESTONIAN RAISED BOGS OVER 50 YEARS
Mires and Peat, Volume 19 (2017), Article 15, 1–21, http://www.mires-and-peat.net/, ISSN 1819-754X
© 2017 International Mire Conservation Group and International Peatland Society, DOI: 10.19189/MaP.2016.OMB.255
4
Figure 2. Ridge-pool ecotope (GW well sites Mä213 and Mä211) at Männikjärve Bog, crossed by the
wooden trail of the east–west hydrological transect of Tooma Mire Station, November 2013.
Photo: L. Küttim.
Figure 3. North–south oriented and sparsely wooded ridge-pool ecotope on Männikjärve Bog (GW well site
Mä211), March 2012. Photo: E. Lode.

E. Lode et al. GROUNDWATER LEVELS IN ESTONIAN RAISED BOGS OVER 50 YEARS
Mires and Peat, Volume 19 (2017), Article 15, 1–21, http://www.mires-and-peat.net/, ISSN 1819-754X
© 2017 International Mire Conservation Group and International Peatland Society, DOI: 10.19189/MaP.2016.OMB.255
5
while observations in the bog meteo station were
limited to May–October. In both stations, air
temperature was recorded hourly by thermographs
and the amount of precipitation was collected once a
day in Tretjakov precipitation buckets.
Ten wooden groundwater (GW) wells were used
to measure groundwater levels in Männikjärve and
Linnusaare Bogs. The wells were situated in ridge-
pool, ridge-hollow, treed/forested ecotopes
(Materialy 1966, 1980). Water levels were measured
manually every third day all year round.
Soil frost (f) and snow depth (S) were measured
only in Männikjärve Bog. These measurements were
carried out in depression (D) and hummock (H)
microforms of treed, ridge-pool and ridge-hollow
ecotopes. One set of f and S data for the ridge-pool
ecotope belonged to the bog pool measurements
(hereafter referred to as D_pool). Frost depth in the
peat body was determined using PVC gauges with
smaller rubber tubes inside, filled with distilled water
and capped with a rubber bung. Snow depth was
measured manually with a stick close to the soil frost
measuring sites (Materialy 1966). Measurements of
frost and snow depths were made at least three times
per month, i.e. every ten days, and every five days at
the onset and end of winter.
Data handling
The 50-year monthly data (January 1962 to
December 2011) used in this study were recorded at
the Tooma Mire Station (Estonian Environmental
Agency (KAUR)). Digital data were available from
1998. We digitised older data from hydrological
yearbooks and observation diaries of the mire station.
Data were compiled for the following variables: a) air
temperature (Tair (°C)) and precipitation (P (mm)), b)
soil frost (fmean and fmax (cm below bog soil surface
(BSS)) and snow depth (Smean (cm)), c) GWL (cm
BSS).
In order to address our research questions we
performed: a) 50-year trend analyses and compilations
of the corresponding annual and seasonal statistics
with probability and frequency analyses; and b)
multiple clustering and regression analyses.
We divided each calendar year into two seasons
on the basis of the Tair data. The warm season had
mean monthly Tair ≥ 5 °C, i.e. it included months
without soil frost and snow on the bog monitoring
sites. The remaining months of the year were defined
as the cold season. There were 26 years (i.e. 54 %)
with six warm months (starting in May) and 14 years
with five warm months (starting in May). The longest
warm seasons (seven months) were recorded in 1989
and 2007 (starting in April), while the shortest (four
months) were in 1971, 1975 and 1988 (starting in
June). In 1964, 1965 and 1966, the warm season also
started in June but lasted for five months.
Since the Tair and P observations on the bog were
made for only a limited period during each year, we
used the Tair and P data from the Tooma mineral soil
meteo-square. Our earlier analyses showed a high
correlation of Tair and P data between the two meteo
stations (r = 0.98 and 0.99; Lode & Endjärv 2003).
Simple linear trend analysis was applied for all
data, while 12-month moving averages were used for
Tair, P and GWL data to smooth out seasonal
variations in the datasets. The coefficient of variation
relating to the long-term mean, kx, for the smoothed
data was calculated as follows:
kx = xj /xo [1]
where xj represents a single value in the dataset and
xo is the mean of the whole dataset.
We distinguished two observation periods to
simplify the climatological effects study: Period I
(1962–1988) and Period II (1989–2011). These
periods were temporally separated at the trend line
crossing point kT = 1.0 of the Tair data.
Due to the seasonal and cross-year character of f
and S events, the trends and statistical analyses for
these variables were applied to the winter season
1962/1963–2010/2011. Comparative statistics were
also calculated for corresponding average winter
season periods I (62/1963–87/1988) and II (88/1989–
10/2011). All digitised f and S data were converted to
mean monthly levels.
The JMP Pro 12.0.1 software modules (SAS
Institute Inc., Cary, NC, USA) were used for
statistical and frequency analyses, visualisation of
corresponding probability curves, constellation plots
and multiple regression maps.
RESULTS
Air temperature and precipitation
The 50-year monthly means of Tair and P recorded at
Tooma Mire Station were 4.9 °C and 57 mm,
respectively (Table 1, Figure 4). Comparing Period II
with Period I, Tair increased by 1.3 °C and P increased
by only 1 mm. The rise in Tair for the cold season was
1.1 °C, and for the warm season it was 0.4 °C. The
cold-season P increased by 4 mm and the warm-
season P decreased by 4 mm. The associated cold-
season warming was considerable, with 17 %
decrease in Tair variation, while Tair variation
increased by 8 % in the warm season. No change in
the variation of cold-season P was encountered, but P
increased by 11 % in the warm season (Table 1).

E. Lode et al. GROUNDWATER LEVELS IN ESTONIAN RAISED BOGS OVER 50 YEARS
Mires and Peat, Volume 19 (2017), Article 15, 1–21, http://www.mires-and-peat.net/, ISSN 1819-754X
© 2017 International Mire Conservation Group and International Peatland Society, DOI: 10.19189/MaP.2016.OMB.255
6
Table 1. Statistics of long-term monthly air temperature (Tair) and precipitation (P) data recorded at the Tooma
mineral soil meteo station together with corresponding Period I and Period II statistics. In this Table and later:
*Std.Dev. = standard deviation, **n = length of the data range, ***Max, Min = maximum and minimum,
respectively.
Moments Annual Cold season Warm season
Tair (°C) P (mm) Tair (°C) P (mm) Tair (°C) P (mm)
Mean (1962-2011) 4.9 57 -1.9 44 12.7 71
*Std.Dev. 8.6 34 5.1 23 3.9 38
**n 599 600 313 314 280 280
***Max 22.2 225 12.8 124 22.2 225
Median 4.9 51 -1.7 42 13.6 67
***Min -16.4 0 -16.4 0 1.1 0
I mean (1962–1988) 4.3 56 -2.4 42 12.5 73
II mean (1989–2011) 5.6 57 -1.3 46 12.9 69
±differences +1.3 +1 +1.1 +4 +0.4 -4
I Std.Dev. 8.8 33 5.4 23 3.7 36
II Std.Dev. 8.3 34 4.5 23 4.0 40
Figure 4. Linear trends in the variation coefficients of air temperature and precipitation (kT and kP,
respectively) for 12-month moving average (Mov.Avg.) periods during the 50-year study period (see
Equation 1). In this Figure and later, r = the regression value.

E. Lode et al. GROUNDWATER LEVELS IN ESTONIAN RAISED BOGS OVER 50 YEARS
Mires and Peat, Volume 19 (2017), Article 15, 1–21, http://www.mires-and-peat.net/, ISSN 1819-754X
© 2017 International Mire Conservation Group and International Peatland Society, DOI: 10.19189/MaP.2016.OMB.255
7
Probability plots (PBPs) of Period II Tair showed
a significant cold-season Tair rise within the 0.0–0.6
quantile interval and a slight Tair decline within the
0.6–1.0 interval. No substantial changes in the warm-
season Tair PBPs occurred (Figure 5). At the same
time, the PBP of the cold-season P data was slightly
elevated above that for almost the whole of Period I,
while the warm-season P increased remarkably
within the 0.9–1.0 quantile interval and was lowered
within the 0.0–0.6 quantile interval. The difference
between the warm-season and cold-season P data
showed a steady increase toward higher quantiles,
with the difference amounting to approximately
100 mm.
The frequency analyses showed that the highest
cold-season Tair frequency of both periods occurred
within the (-5)–0 °C Tair interval (Period I and II
frequencies = 36 % and 45 %, respectively). In the
warm season the frequency within the 10–15 °C
interval was 41–42 %. During Period II, the cold-
season Tair frequency within the (-5)–0 °C interval
increased by 25 % with a simultaneous Tair frequency
reduction in the lower or colder (-20)–(-5) °C
interval. The warm-period Tair frequency within the
5–15 °C interval decreased by 2–13 % with a
simultaneous increment within the warmer 15–25 °C
interval (Figure A1, Appendix). The highest cold-
and warm-season P frequencies of Period I occurred
within the 30–60 mm P interval (frequencies = 47 %
and 33%, respectively). During Period II, the cold-
season P frequency amplitude shortened by extreme
values of 120–150 mm P interval although there were
no changes relating to the prevailing 30–60 mm P
frequency interval at the same time. The warm-
season P frequency decreased by 6 % within the
prevailing P interval together with a simultaneous P
frequency amplitude enlargement to 0–240 mm
(Figure A1, Table 1).
Soil frost and snow depth
The 50-year soil frost means (fmean, fmax) over the
average winter months were 14 and 25 cm BSS
(Table 2). During the same period the average
monthly air temperature was -2.9 °C, the mean for
the coldest month was -8.3 °C, and snow depth was
16 cm. The reductions in fmean and fmax during
Period II were, correspondingly, 1 cm and 3 cm,
while the increases in Tair mean and Tair min were 1.7 and
2.4 °C, respectively.
The 50-year snow depth values (Smean) showed 10-
year, 18-year and 21-year cyclical patterns
(Figure 6). However, the overall trendline of Smean is
almost horizontal, mainly due to high values at the
end of the study period. Therefore, the Smean in
Period II was only 3 cm lower than in Period I
(Table 2).
The 50-year PBPs of fmean and fmax values for D
and H microforms of different ecotopes showed
continuously higher values (i.e. thicker frost layer) in
the H microform of the ridge-hollow ecotope against
the smaller values (i.e. thinner frost layer) in the D
microform of the treed ecotope (Figure 7). The long-
term PBPs of the ice thickness on frozen pools were
the lowest, i.e. the frost layer was the thickest. The
thinner frost layer in the forest D microform was
accompanied by the lowest snow depths on the same
microform. Herewith, the plots of fmax values formed
the most dispersed graph pattern, and plots of Smean
values the most convergent.
As a rule, Period II plots showed diminished fmean
and Smean values for both H and D microforms of
different ecotopes, except for the H microform in the
ridge-hollow ecotope, which had continuously
increasing fmean values (i.e. fall within the 0.0–0.7
quantile interval). Smean values of Period II decreased
more strongly in treed microforms, followed by the
ridge-hollow and ridge-pool microforms (Figure 8).
Figure 5. Probability plots of air temperature (Tair) and precipitation (P) for the warm and cold seasons of
Periods I and II.

E. Lode et al. GROUNDWATER LEVELS IN ESTONIAN RAISED BOGS OVER 50 YEARS
Mires and Peat, Volume 19 (2017), Article 15, 1–21, http://www.mires-and-peat.net/, ISSN 1819-754X
© 2017 International Mire Conservation Group and International Peatland Society, DOI: 10.19189/MaP.2016.OMB.255
8
Table 2. Statistics of long-term monthly mean and maximum of soil frost (fmean and fmax, respectively), snow
depth (Smean), air temperature (Tair mean) and mean of the coldest month (Tair min) for average winter seasons
(Periods I and II, respectively).
Moments
Variables
*f (cm) Smean (cm)
Tair (°C)
fmean fmax Tair mean Tair min
Period I
Mean (63/1964-10/2011) -14 -25 16 -2.9 -8.3
Std.Dev. 5.3 7.8 8.0 2.1 3.7
n 50 50 50 47 48
Max -26 -51 42 -8.9 -16.4
Median -15 -24 15 -2.7 -8.3
Min -4 -9 3 4.3 -1.5
Period II
I mean (63/1964-87/1988) -15 -26 17 -3.7 -9.5
II mean (88/1989-10/2011) -14 -23 14 -2.0 -7.1
± differences +1 +3 -3 +1.7 +2.4
I Std.Dev. 4.6 7.6 7.2 1.9 3.6
II Std.Dev. 6.0 8.1 9.0 2.0 3.4
*f values below the surface, in this table and later, indicated by “-”.
Figure 6. Linear trends of soil frost (fmean, fmax), snow depth (Smean) and air temperature (Tmean, Tmin) for the
average winter months.

E. Lode et al. GROUNDWATER LEVELS IN ESTONIAN RAISED BOGS OVER 50 YEARS
Mires and Peat, Volume 19 (2017), Article 15, 1–21, http://www.mires-and-peat.net/, ISSN 1819-754X
© 2017 International Mire Conservation Group and International Peatland Society, DOI: 10.19189/MaP.2016.OMB.255
9
Figure 7. PBPs of the 50-year soil frost (fmean, fmax) and snow depth (Smean) values recorded at hummock (H)
and depression (D) microforms of the Männikjärve treed, ridge-pool and ridge-hollow ecotopes.
Figure 8. PBPs of the Period I (Per.I) and Period II (Per.II) soil frost (fmean) and snow depth (Smean) values
recorded at hummock (H) and depression (D) microforms of the Männikjärve treed, ridge-pool and ridge-
hollow ecotopes.

E. Lode et al. GROUNDWATER LEVELS IN ESTONIAN RAISED BOGS OVER 50 YEARS
Mires and Peat, Volume 19 (2017), Article 15, 1–21, http://www.mires-and-peat.net/, ISSN 1819-754X
© 2017 International Mire Conservation Group and International Peatland Society, DOI: 10.19189/MaP.2016.OMB.255
10
Groundwater levels
The 50-year monthly means of the ridge-pool and
ridge-hollow GWLs varied between 26 and 38 cm
BSS in both bogs (Table A1). On average, they were
3 cm higher during the cold season and 4 cm lower
during the warm season. The means for the lagg forests
were considerably lower, at 49 and 80 cm BSS on
Linnusaare and Männikjärve Bogs, respectively. The
mean for the treed Männikjärve marginal slope was
39 cm BSS. In all forested/treed ecotopes, GWLs
were 4–5 cm higher than the mean during the cold
season and 4–6 cm lower during the warm season.
The 50-year linear trends of the GWLs were very
low for more than half of the analysed data ranges
(0.10 < r < 0.23), except for the ridge-pool and treed
ecotopes of Männikjärve Bog (r = 0.66, 0.53 and
0.42, respectively) (Figure 9). The Period II GWLs
showed a comparatively large (5–7 cm) rise in
Männikjärve ridge-pool ecotopes and a 0–3 cm fall in
the rest of the bog dome ecotopes (Table A2). The
GWL rose by 5 cm in Männikjärve lagg forest and
fell by 6 cm and 2 cm in treed Männikjärve marginal
slope and Linnusaare lagg forest, respectively.
In comparison with Period I, the PBPs of Period II
GWLs in the ridge-pool ecotopes of both bogs
showed identical shape changes within the same bog
area. The Linnusaare Bog GWLs showed a rise of
both max. and min. values, but all Li222 values were
around 10 cm lower. The PBPs for the ridge-pool
ecotopes of Männikjärve Bog were elevated by
1−2 cm (Figure A2). The ridge-hollow ecotopes
across both bogs had identical plot shape changes
during Period II, i.e. the PBPs had a constantly
lowered plot form from max. towards min. values,
with a sharp inclination down to 80 cm BSS within
0.2 to 0.0 quantiles. The PBPs of the forested/treed
GWLs differed both within and between the bogs, i.e.
changes were rather similar in the Linnusaare lagg
forest and the treed Männikjärve marginal slope, with
constantly lower GWL values down to 75−85 cm
BSS. At the same time, PBP of the Männikjärve
marginal forest rose from 0.2 to 1.0 quantile, and
inclined down to 120 cm BSS within 0.0 to 0.1
quantiles.
The dominating frequency of the Period I GWLs
on ridge-pool and ridge-hollow ecotopes of both bogs
belonged to the 15−30 cm BSS interval (frequency =
59−74 %). The Li222 and Li220 GWLs were
exceptions, with dominating frequency within the
BSS interval 30−45 cm (frequency = 76 % and 53 %,
respectively) (Figure A3). In general for these
ecotopes, the entire oscillation amplitude of Period II
GWLs increased towards lower values, with varying
frequency changes in dominating GWL intervals.
Exceptions were the Männikjärve ridge-pool
ecotopes, where the frequency decreased in the lower
GWL values and increased by 10 % within the upper
0−15 cm BSS interval. In both Linnusaare lagg forest
and treed Männikjärve marginal slope, the
dominating frequency of Period I GWLs belonged to
the 30−45 cm BSS interval (frequency = 50 % and
49 %, respectively); in Männikjärve lagg forest it
belonged to the 75−90 cm BSS interval (frequency =
38 %). During Period II in forested/treed ecotopes the
prevailing frequency interval remained the same. At
the same time the entire GWL oscillation amplitude
(0−60 cm BSS) of the treed Männikjärve marginal
slope shifted downward by 15 cm, while the
amplitude for Männikjärve lagg forest (45−120 cm
BSS) was enlarged upward by 15 cm, and that for the
Linnusaare lagg forest remained the same (30−90 cm
BSS) (Figure A2).
Figure 9. Linear trends of variation coefficients of groundwater levels (kMä, and kLi, respectively) for
12-month moving average (Mov.Avg.) periods over the 50 years of observations (see Equation 1).
Mä211…Li222 = ridge-pool ecotopes on the Linnusaare (Li) and Männikjärve (Mä) Bogs; Mä218…Li219
= forested/treed ecotopes.

E. Lode et al. GROUNDWATER LEVELS IN ESTONIAN RAISED BOGS OVER 50 YEARS
Mires and Peat, Volume 19 (2017), Article 15, 1–21, http://www.mires-and-peat.net/, ISSN 1819-754X
© 2017 International Mire Conservation Group and International Peatland Society, DOI: 10.19189/MaP.2016.OMB.255
11
There were three clusters in distance-scaled
constellation plots of the hierarchical clustering,
formed by GWLs of both bog ecotopes (Figure 10).
The two largest GWL clusters of Period I were
segregated by the ecotopes from the same bog area,
while the Männikjärve forest ecotope stood alone
(Mä218). The Period II clustering increased the
consolidation of cluster pairs (increase of r = 3 %),
whereas forested/treed ecotopes of both bogs formed
a new forested/treed cluster of the pair Li219 &
Mä217 and excluded the Mä218 ecotope.
Multiple relations of the average winter data
The constellation plots of average winter data
(Periods I and II) show three well-distinguished
Männikjärve clusters according to the type of
ground-level variable that was used (Figure 11). For
both periods the most stable cluster was formed by
the snow data. The Period II clustering increased
consolidation between cluster pairs formed by D and
H microforms from the same type of ecotope. The
largest cluster was formed by the GWLs of different
ecotopes together with varying combinations of mean
and maximum soil frost data from both D and H
microforms. The Period II clustering increased the
consolidation between GWLs of the same ecotope
type (i.e. GWL pairs of Mä211 & Mä213 and Mä232
& Mä322 ridge-pool and ridge-hollow ecotopes,
respectively) by varying combination with other
cluster variables. The third cluster was formed
mainly by the mean soil frost data from both D and H
microforms, but with varying cluster pairs and
structure over both periods.
The Period II cluster segregation is accompanied
by increased regressions within the variable type
used (Figure 12). During Period II the strongest
regressions were found within the snow variables,
followed by groundwater levels and soil frost. The
Period II correlation mean (r) within the snow
variable reached 0.94 (increase = 0.13; the highest
r = 0.97 between treed D & H microforms), within
groundwater levels it reached 0.78 (increase = 0.11;
the highest r = 0.93 between Mä322 & Mä323),
within mean soil frost it was 0.75 (increase = 0.23;
the highest r = 0.92 between H microforms of treed
& pool ecotopes), and within maximum soil frost it
was 0.73 (increase = 0.14; the highest r = 0.97
between treed D & H microforms).
DISCUSSION
Changes in air temperature and precipitation
According to Estonian Weather Service (2017), the
Estonian climate normal air temperature (Tair) for the
period 1981−2010 is 6.0 °C and the annual
precipitation is 673 mm. The length and means of the
climate normal period fit rather well with the results
for Period II (1989−2011) obtained in the present
study (Table 1). Thus, the increase of central-east
Figure 10. Constellation plots of distance-scaled dendrograms of Period I and II groundwater levels of
different Linnusaare (Li) and Männikjärve (Mä) bog ecotopes. In these graphs and later: circled dot = the
endpoint of hierarchically clustered data matrix (Ward method), Y and X = the endpoint co-ordinates of
clustered variables. Abbreviations for variables as in Table A1).

E. Lode et al. GROUNDWATER LEVELS IN ESTONIAN RAISED BOGS OVER 50 YEARS
Mires and Peat, Volume 19 (2017), Article 15, 1–21, http://www.mires-and-peat.net/, ISSN 1819-754X
© 2017 International Mire Conservation Group and International Peatland Society, DOI: 10.19189/MaP.2016.OMB.255
12
Figure 11. Constellation plots of distance-scaled dendrograms of Männikjärve Bog (Mä) ground-level
variables for average winter seasons (Periods I and II). The variables used are: mean (fm) and maximum
(fmx) soil frost depths; and mean snow depths (Sm) in depressions (D) and hummocks (H) of treed, ridge-
hollow and ridge-pool ecotopes. Abbreviations for the ecotope groundwater levels are: Mä217 = treed;
Mä322 & Mä323 = ridge-hollow; and Mä211 & Mä213 = ridge-pool. For the graph settings, see Figure 10.
Figure 12. Multiple regressions maps (r-I, r-II) of Männikjärve Bog (Mä) ground-level variables for average
winter seasons (Periods I and II). The variables used are: mean (fm) and maximum (fmx) soil frost depths;
and mean snow depths (Sm) in depressions (D) and hummocks (H) of treed, ridge-hollow and ridge-pool
ecotopes. Abbreviations for the ecotope groundwater levels are: Mä217 = treed, Mä322 & Mä323 = ridge-
hollow, and Mä211 & Mä213 = ridge-pool ecotopes.

E. Lode et al. GROUNDWATER LEVELS IN ESTONIAN RAISED BOGS OVER 50 YEARS
Mires and Peat, Volume 19 (2017), Article 15, 1–21, http://www.mires-and-peat.net/, ISSN 1819-754X
© 2017 International Mire Conservation Group and International Peatland Society, DOI: 10.19189/MaP.2016.OMB.255
13
Estonian monthly Tair of 30 %, and especially the
46 % Tair increase of the average winter season,
confirm the previous claims about winter warming in
Estonia (e.g. Jaagus 2006). The increase in average
winter air temperature was 1.7 °C, while warming for
the coldest month was 2.4 °C.
From our results we conclude that during
ecohydrologically comparable periods (1962–1988
& 1989–2011) there were almost no changes in the
annual monthly precipitation amounts in our study
area. The increase was ~ 2 %. However, precipitation
during the cold season increased by 10 %, mainly due
to a shift from smaller precipitation events towards
larger (60−90 mm) ones. Precipitation during the
warm season decreased by 5 % but the precipitation
amplitude increased, sometimes to values of up to
240 mm per month.
In summary, the precipitation on the bogs
increased during winter, but slightly decreased
during summer.
Changes in snow cover and frost depth
Viru (2017) studied the duration of permanent snow
cover in Estonia during 1951–2015 and showed that
the duration of snow cover over the whole Estonia
had decreased, on average, by 1–4 days for each ten
years. On this basis we calculated that, in our study
area, it had shortened by around 18 days. Our study
also showed that the average winter soil frost (fmean)
on the bog decreased by 7 % , the maximum soil frost
(fmax) decreased by 12 % and the snow depth (S)
decreased by 18 %. Apart from that, the average
winter warming caused a distinct increase in S and f
depth variations in the bog (by 25 % and 30 %,
respectively).
From our results it can be concluded that winter
warming has caused a clear decrease in snow depth
on the bog and has also reduced ice thickness in the
bog pools. The decrease in frost depth may vary
depending on the bog surface microtopography, plant
cover and wetness conditions (Figure 8). In ridge-
hollow ecotopes on open bog, smaller snow depth
may cause slightly deeper frosts in the ‘higher and
drier’ hummocks than in hollows; whereas in treed
ecotopes (which are more sheltered), the relatively
high groundwater levels during winter cause smaller
frost depths in both hummocks and depressions.
Also, it should be stressed that our results do not
support the “colder soils in a warmer world”
hypothesis of Groffman et al. (2001), since the air
temperature rise during Period II was associated with
a slight increase in precipitation. It could be
speculated that increased cyclonic activity in Estonia
(Sepp et al. 2005) reduced the duration of frost
periods between sequential precipitation events and,
thus, we rather agree with the prediction of “warmer
and wetter winters” due to changed climate
conditions (Wu & Roulet 2014).
Changes in groundwater levels
Our analyses of monitored groundwater levels
(GWLs) show that the long-term GWLs in the domes
of our bogs were on average 0.3−0.4 m below soil
surface (BSS), which is in good agreement with
values reported from intact raised bogs in Europe
(Van der Schaaf 2002). The 50-year GWLs had rather
stable oscillation dynamics around their long-term
averages (slightly less variation and a few cm higher
during the cold season, and vice versa during the
warm season), both on the bog dome and in the
marginal lagg area. However, there were different
ecotope-based GWL responses between 1989 and
2011 (Table A2). The most remarkable was a
20−30 % rise in GWL in Männikjärve ridge-pool
ecotopes. This phenomenon could perhaps be
explained by subsiding bog surfaces (Strack et al.
2008, Kont et al. 2007). However, the relationship
between peat surface oscillation (“Mooratmung”),
peat body subsidence and GWL changes expressed as
absolute heights (e.g. Fritz et al. 2008) needs further
investigation.
Our research supports the suggestion of Van der
Schaaf (2002) that both mean GWL depth and the
amplitude of GWL fluctuations increase from the
centre of a bog towards the margins. The lower
GWLs observed in our bogs are obviously related to
the forested/treed ecotopes at the marginal slope and
lagg areas (i.e. 0.4–0.8 m BSS). The surface slope
seemed to have minor effect on GWL in the marginal
treed Mä217 ecotope (a phenomenon also observed
by Van der Schaaf 2002). But, in the case of
Männikjärve Bog, it is probably related more to the
groundwater well location (too close to the
transitional zone between treed marginal slope and
the bog dome; Figure 1).
The Männikjärve lagg forest seemed to represent
the “classical” ecotope formed on the floodplain of
the small stream, being the bog lagg at the same time.
Warmer winters during the period 1989–2011 raised
the cold-season forest GWL by 9 %, presumably as a
result of water discharge from both the bog slope and
the stream floodplain (see also Howie & Van
Meerveld 2013). This is also consistent with wetter
conditions on the bog during the cold season.
However, a small increase of the warm-season air
temperature and a decrease in precipitation during the
period 1989–2011 was reflected in a downward
increment of the GWL oscillation amplitude, both on
the bog domes (3−22 cm) and in the forested lagg
areas (3−14 cm) (Figure A3).

E. Lode et al. GROUNDWATER LEVELS IN ESTONIAN RAISED BOGS OVER 50 YEARS
Mires and Peat, Volume 19 (2017), Article 15, 1–21, http://www.mires-and-peat.net/, ISSN 1819-754X
© 2017 International Mire Conservation Group and International Peatland Society, DOI: 10.19189/MaP.2016.OMB.255
14
As a whole, the bogs that we studied in the Endla
Mire Complex still represent centre wet bog
landscapes (Rydin et al. 2006) with treed margins
and partly wooded ridges between pools in the centre.
However, the slight long-term increase of
groundwater levels at lower positions within most
ecotopes over the second part of the study period is a
sign of small changes towards dryer conditions. This
is reflected in corresponding modifications of the
plant cover (e.g. increase of tree growth) and,
presumably, geophysical and biogeochemical
changes in the upper layer of the peat massif at the
same time (e.g. Ivanov 1981, Bragg 2002, Wu &
Roulet 2014). Numerically it is reflected in increased
consolidation between the groundwater data for
forested/treed ecotopes over the two bogs and
similarly for the bog dome ecotopes during Period II
of our study (Figure 10).
Changes in multiple relations of the average
winter data
Changes in multiple relations within the data for
ground-level variables of the average winter season
(Figures 11 and 12) show that snow depth is the most
“sensitive” to winter warming, whereas changes in
soil frosts depend on the bog wetness conditions
created by the microtopography, plant cover and
hydrophysical properties of the acrotelm or by the
groundwater level dynamics. However, it seems that
the use of monthly data is not fully suited to the
investigation of “cause-and-effect” in winter
warming conditions on the bogs due to processes
related to scale differences (e.g. groundwater level
and soil frost relationships) since, for example, the
formation of soil frost in mires starts, as a rule, after
ten days with stable air temperature below 0 oC and
the subsequent increase in frost depth continues until
at least 5−10 cm of snow has accumulated (e.g.
Davõdov et al. 1973). But how these variables react
in winter seasons with more rapidly changing frost-
thaw conditions, and how it is reflected in the spatial
distribution of bog soil temperature, wetness
conditions etc., needs further study.
ACKNOWLEDGEMENTS
This study was supported by the Estonian Science
Foundation through Grant 9070. The authors would
like to express their deepest gratitude to the Estonian
Land Board for LiDAR data; SLU for providing
desktop analysis facilities and working hours; and the
Hydrological Department and Tooma Mire Station at
KAUR for providing all monitoring data. We would
also like to thank colleagues from the Institute of
Ecology and the School of Natural Sciences and
Health of Tallinn University, two anonymous
reviewers, the language reviser and the article editor
Professor Ab Grootjans for helpful comments on the
manuscript.
REFERENCES
Aaviksoo, K., Leivits, A. & Leivits, M. (2008) Kaug-
ja linnuseire Nigula rabas (Remote sensing and
monitoring of birds in Nigula Bog). In: Väljataga,
K. & Kaukver, K. (eds.) Kaugseire Eestis.
Artiklikogumik (Remote Sensing in Estonia.
Collection of Articles), Keskkonnaministeeriumi
Info- ja Tehnokeskus, Tallinn, 106–122. (in
Estonian, documentation page in English).
Aurela, M., Laurila, T. & Tuovinen, J.-P. (2004) The
timing of snow melt controls the annual CO2
balance in a subarctic fen. Geophysical Research
Letters, 31, L16619.
Bay, R.R. (1968) The hydrology of several peat
deposits in northern Minnesota, U.S.A. In:
Proceedings of the Third International Peat
Congress, Quebec, Canada, 18–23 August, 1968.
National Research Council of Canada, 212–218.
Boelter, D.H. (1964) Water storage characteristics of
several peats in situ. Soil Science Society of
America Proceedings, 28, 433–435.
Bragg, O.M. (2002) Hydrology of peat-forming
wetlands in Scotland. Science of the Total
Environment, 294, 111–129.
CICERO (2000) Estonia. In: O´Brien, K. (ed.)
Developing Strategies for Climate Change: The
UNEP Country Studies on Climate Change
Impacts and Adaptations Assessment. Report
2000:2, University of Oslo, 71–105.
Daniels, S.M, Agnew, C.T., Allott, T.E.H. & Evans,
M.G. (2008) Water table variability and runoff
generation in an eroded peatland, South Pennines,
UK. Journal of Hydrology, 361, 214–226.
Davõdov, L.K., Dmitrieva, A.A. & Konkina, N.G.
(1973) Obtchaja Gidrologija (General
Hydrology). Gidrometizdat, Leningrad, 454 pp.
(in Russian).
EELIS (2015) Eesti Looduse Infosüsteem -
Keskkonnaregister (Estonian Nature Information
System - Environment Records). Online at:
http://loodus.keskkonnainfo.ee/eelis/, accessed
May 2015.
Estonian Weather Service (2017) Climate normals.
Online at: http://www.ilmateenistus.ee/kliima/
kliimanormid/ohutemperatuur/?lang=en,
accessed March 2017.
Fenner, N., Freeman, C. & Worrall, F. (2009)

E. Lode et al. GROUNDWATER LEVELS IN ESTONIAN RAISED BOGS OVER 50 YEARS
Mires and Peat, Volume 19 (2017), Article 15, 1–21, http://www.mires-and-peat.net/, ISSN 1819-754X
© 2017 International Mire Conservation Group and International Peatland Society, DOI: 10.19189/MaP.2016.OMB.255
15
Hydrological controls on dissolved organic
carbon production and release from UK peatlands.
In: Baird, A.J., Belyea, L.R., Comas, X., Reeve,
A.S. & Slater, L.D. (eds.) Carbon Cycling in
Northern Peatlands, Geophysical Monograph
184, American Geophysical Union, Washington
DC, 237–249. doi:10.1029/2008GM000823
Freeman, C., Evans, C.D., Monteith, D.T., Reynolds,
B. & Fenner, N. (2001) Export of organic carbon
from peat soils. Nature, 412(6849), 785. doi:
10.1038/35090628
Fritz, C., Campbell, D.I. & Schipper, L.A. (2008)
Oscillating peat surface levels in a restiad
peatland, New Zealand—magnitude and
spatiotemporal variability. Hydrological
Processes, 22(17), 3264–3274. doi: 10.1002/
hyp.6912
Groffman, P.M., Driscoll, C.T., Fahey, T.J., Hardy,
J.P., Fitzhugh, R.D. & Tierney, G.L. (2001)
Colder soils in a warmer world: a snow
manipulation study in a northern hardwood forest
ecosystem. Biogeochemistry, 56, 135–150.
Howie, S.A. & Van Meerveld, H.J. (2013) Regional
and local patterns in depth to water table,
hydrochemistry and peat properties of bogs and
their laggs in coastal British Columbia. Hydrology
and Earth System Sciences, 17, 3421–3435. doi:
10.5194/hess-17-3421-2013
Ilomets, M. (1988) Vertical distribution and spatial
pattern of Sphagnum communities of two
Estonian treeless bogs. In: Zobel, M. (ed.)
Dynamics and Ecology of Wetlands and Lakes in
Estonia. Academy of Sciences of the Estonian
SSR, Tallinn, 24–39.
Ilomets, M., Kimmel, K., Sten, C.-G. & Korhonen,
R. (2007) Sood Eestis ja Lõuna-Soomes (Mires in
Estonia and Southern Finland). MTÜ GEOGuide
Baltiscandia, Tallinn, 36 pp. (in Estonian).
Ingram, H.A.P. (1978) Soil layers in mires: function
and terminology. Journal of Soil Science, 29(2),
224–227.
Ingram, H.A.P. (1987) Ecohydrology of Scottish
peatlands. Transactions of the Royal Society of
Edinburgh, 78, 287–296.
IPCC (2007) Climate Change 2007: The Physical
Science Basis. Contribution of Working Group I
to the Fourth Assessment Report of the
Intergovernmental Panel on Climate Change
[Solomon, S., Qin, D., Manning, M., Chen, Z.,
Marquis, M., Averyt, K., Tignor, M.M.B. &
Miller, H.L. (eds.)]. Cambridge University Press,
Cambridge, United Kingdom and New York, NY,
USA, 996 pp.
IPCC (2014) Climate Change 2014: Synthesis
Report. Contribution of Working Groups I, II and
III to the Fifth Assessment Report of the
Intergovernmental Panel on Climate Change
[Core Writing Team, Pachauri, R.K. & Meyer,
L.A. (eds.)]. IPCC, Geneva, Switzerland, 151 pp.
Ivanov, K.E. (1953) Gidrologiya Bolot (Hydrology of
Mires). Gidrometeoizdat, Leningrad, 300 pp. (in
Russian).
Ivanov, K.E. (1981) Water Movement in Mirelands.
Academic Press, London, xxviii + 278 pp.
Jaagus, J. (2006) Climatic changes in Estonia during
the second half of the 20th century in relationship
with changes in large-scale atmospheric
circulation. Theoretical and Applied Climatology,
83, 77–88. doi: 10.1007/s00704-005-0161-0
Jaagus, J., Järvet, A. & Roosaare, J. (1998)
Modelling the climate impact on river runoff in
Estonia. In: Kallaste, T. & Kuldna, P. (eds.)
Climate Change Studies in Estonia. Stockholm
Environment Institute Tallinn Centre, Tallinn,
177–126.
Jassey, V.E.J., Chiapusio, G., Binet, P., Buttler, A.,
Laggoun-Défarge, F., Delarue, F., Bernard, N.,
Mitchell, E.A.D., Toussaint, M.-L., Francez, A.-J.
& Gilbert, D. (2013) Above- and belowground
linkages in Sphagnum peatland: climate warming
affects plant-microbial interactions. Global
Change Biology, 19, 811–823.
Joosten, H. & Clarke, D. (2002) Wise Use of Mires
and Peatlands - Background and Principles
Including a Framework for Decision-making.
International Mire Conservation Group and
International Peat Society, Saarijärvi, Finland,
304 pp.
Jylhä, K., Fronzek, S., Tuomenvirta, H., Carter, T.R.
& Ruosteenoja, K. (2008) Changes in frost, snow
and Baltic sea ice by the end of the twenty-first
century based on climate model projections for
Europe. Climate Change, 86, 441–462.
Kont, A., Endjärv, E., Jaagus, J., Lode, E., Orviku,
K., Ratas, U., Rivis, R., Suursaar, Ü. & Tõnisson,
H. (2007) Impact of climate change on Estonian
coastal and inland wetlands - a summary with new
results. Boreal Environment Research, 12, 653–
761.
Kreyling, J. & Henry, H.A.L. (2011) Vanishing
winters in Germany: soil frost dynamics and snow
cover trends, and ecological implications. Climate
Research, 46, 269–276.
Labadz, J., Allott, T., Evans, M., Butcher, D., Billett,
M., Stainer, S., Yallop, A., Jones, P., Innerdale,
M., Harmon, N., Maher, K., Bradbury, R., Mount,
D., O’Brien, H. & Har, R. (2010) Peatland
Hydrology. Draft Scientific Review, IUCN UK
Peatland Programme, 56 pp. Online at:
http://www.uplandhydrology.org.uk/wp-content/

E. Lode et al. GROUNDWATER LEVELS IN ESTONIAN RAISED BOGS OVER 50 YEARS
Mires and Peat, Volume 19 (2017), Article 15, 1–21, http://www.mires-and-peat.net/, ISSN 1819-754X
© 2017 International Mire Conservation Group and International Peatland Society, DOI: 10.19189/MaP.2016.OMB.255
16
uploads/2013/12/Review-6-Peatland-Hydrology_
0.pdf, accessed July 2017.
Lode, E. & Endjärv, E. (2003) Mire microclimate in
the context of regional climate. In: Järvet, A. &
Lode, E. (eds.) Ecohydrological Processes in
Northern Wetlands: Selected Papers of
International Conference & Educational
Workshop, Institute of Ecology at Tallinn
Pedagogical University, Estonia in association
with Sheffield Wetlands Research Centre,
University of Sheffield, UK, Tallinn-Tartu, 125–
131.
Lode, E. & Leivits, M. (2011) The LiDAR-based
topo-hydrological modelling of the Nigula mire,
SW Estonia. Estonian Journal of Earth Sciences,
60(4), 232–248.
Materialy (1966) Materialy Nabljudeniy Bolotnyh
Stanziy za 1949–1955 g.g. (Survey Results of Mire
Stations for the Years 1949–1955), Vypusk
(Issue) II, Tom (Vol.) I. Gosudarstvennõi Ordena
Trudovogo Krasnogo Znameni Gidrologitšeskiy
Institut, Leningrad, 7–17 (in Russian).
Materialy (1971, 1973, 1980) Materialy Nabljudeniy
Bolotnoi Stantsiy Tooma. In: Materialy
Nabljudeniy Bolotnyh Stanziy za 1970, 1973,
1980 g. (Survey Results of Mire Stations for the
Years 1970, 1973 1980), Vypusk (Issue) 2.
Upravlenie Gidrometeorologitšeskoi Službõ
Estonskoi SSSR, Tallinskaja Gidrometeor-
ologitšeskaja Observatoria, Tallinn-Obninsk, 3–
150 in each issue (in Russian).
Mikhaylov, V.N., Dobrovolskij, A.D. &
Dobroljubov, S.A. (2007) Gidrologiya
(Hydrology). Vyshaja Shkola, Moscow, 463 pp.
(in Russian).
Morgan-Jones, W., Poole, J.S. & Goodall, R. (2005)
Characterisation of Hydrological Protection
Zones at the Margins of Designated Lowland
Raised Peat Bog Sites. Report No. 365, Joint
Nature Conservation Committee (JNCC),
Peterborough, 87 pp.
Nagare, R.M., Schincariol, R.A., Quinton, W.L. &
Hayashi, M. (2012) Effects of freezing on soil
temperature, freezing front propagation and
moisture redistribution in peat: laboratory
investigations. Hydrology and Earth System
Sciences, 16, 501–515.
Nastavljenie (1972) Nastavljenie Gidrometeor-
Ologitcheskim Stantsijam i Postam (Instructions
to Hydrometeorological Stations and Posts).
Võpusk (Issue) 8, Gidrometeorologitcheskie
Nabljudenija na Bolotah (Hydrometeorological
Survey on Mires), Gidrometeoizdat. Leningrad,
296 pp. (in Russian).
Quinton, W.L. & Hayashi, M. (2008) Recent
advances toward physically-based runoff
modeling of the wetland-dominated central
Mackenzie River basin. In: Woo, M. (ed.) Cold
Region Atmospheric and Hydrologic Studies, The
Mackenzie GEWEX Experience, Volume 2:
Hydrologic Processes. Springer, Berlin, 257–279.
Robroek, B.J.M., Heijboer, A., Jassey, V.E.J.,
Hefting, M.M., Rouwenhorst, T.G., Buttler, A. &
Bragazza, L. (2013) Snow cover manipulation
effects on microbial community structure and soil
chemistry in a mountain bog. Plant and Soil, 369,
151–164.
Romanov, V.V. (1968) Hydrophysics of Bogs. Israel
Program of Scientific Translations, Jerusalem,
299 pp.
Rydin, H. & Jeglum, J. (2006) The Biology of
Peatlands. Oxford University Press, 343 pp.
Sepp, M., Post, P. & Jaagus, J. (2005) Long-term
changes in the frequency of cyclones and their
trajectories in Central and Northern Europe.
Nordic Hydrology, 36, 297–309.
Smiljanić, M., Seo, J.-W., Läänelaid, A., van der
Maaten-Theunissen, M., Stajić, B. & Wilmkinga,
M. (2014) Peatland pines as a proxy for water
table fluctuations: Disentangling tree growth,
hydrology and possible human influence. Science
of the Total Environment, 500–501, 52–63.
Strack, M., Waddington, J.M., Turetsky, M., Roulet,
N.T. & Byrne, K.A. (2008) Chapter 2: Northern
peatlands, greenhouse gas exchange and climate
change. In: Strack, M. (ed.) Peatlands and
Climate Change. International Peat Society,
Jyvӓskylӓ, Finland, 44–69.
Tedesco, M., Brodzik, M., Armstrong, R., Savoie, M.
& Ramage, J. (2009) Pan arctic terrestrial snow
melt trends (1979–2008) from spaceborne passive
microwave data and correlation with the Arctic
Oscillation. Geophysical Research Letters, 36,
L21402.
Templer, P.H. (2012) Changes in winter climate: soil
frost, root injury, and fungal communities. Plant
and Soil, 353(1–2), 15–17.
Toet, S., Cornelissen, J.H.C., Aerts, R., Van
Logtestijn, R.S.P., De Beus, M. & Stoevelaar, R.
(2006) Moss responses to elevated CO2 and
variation in hydrology in a temperate lowland
peatland. Plant Ecology, 182, 27–40.
Van der Schaaf, S. (1999) Analysis of the Hydrology
of Raised Bogs in the Irish Midlands. A Case
Study of Raheenmore Bog and Clara Bog. PhD
thesis, Wageningen University, 375 pp.
Van der Schaaf, S. (2002) Bog hydrology. In:
Schouten, M.G.C. (ed.) Conservation and
Restoration of Raised Bogs; Geological,
Hydrological and Ecological Studies, The

E. Lode et al. GROUNDWATER LEVELS IN ESTONIAN RAISED BOGS OVER 50 YEARS
Mires and Peat, Volume 19 (2017), Article 15, 1–21, http://www.mires-and-peat.net/, ISSN 1819-754X
© 2017 International Mire Conservation Group and International Peatland Society, DOI: 10.19189/MaP.2016.OMB.255
17
Government Stationery Office, Dublin, 54–60.
Van der Schaaf, S. (2004) A single well pumping and
recovery test to measure in situ acrotelm
transmissivity in raised bogs. Journal of
Hydrology, 290, 152–160.
Verry, E.S., Brooks, K.N. & Barten, P.K. (1988)
Streamflow response from an ombrotrophic mire.
In: Proceedings of the International Symposium
on the Hydrology of Wetlands in Temperate and
Cold Regions, 6-8 June, Joensuu, Finland,
International Peat Society/The Academy of
Finland, Helsinki, 52–59.
Viru, B. (2017) Long-term changes in snow regime
in Estonia during 1951–2015. In: Järvet, A. (ed.)
Yearbook of the Estonian Geographical Society,
42, Estonian Geographical Society, Tallinn, 104–
118.
Wu, J. & Roulet, N.T. (2014) Climate change reduces
the capacity of northern peatlands to absorb the
atmospheric carbon dioxide: The different
responses of bogs and fens. Global
Biogeochemical Cycles, 27, 1005–1024.
doi:10.1002/2014GB004845.
Submitted 17 Aug 2016, final revision 26 Jly 2017
Editor: Ab Grootjans
_______________________________________________________________________________________
Author for correspondence:
Dr Elve Lode, Institute of Ecology, School of Natural Sciences and Health, Tallinn University, Estonia.
E-mail: [email protected]

E. Lode et al. GROUNDWATER LEVELS IN ESTONIAN RAISED BOGS OVER 50 YEARS
Mires and Peat, Volume 19 (2017), Article 15, 1–21, http://www.mires-and-peat.net/, ISSN 1819-754X
© 2017 International Mire Conservation Group and International Peatland Society, DOI: 10.19189/MaP.2016.OMB.255
18
Appendix
Figure A1. Frequency distribution (%) of the cold-season and warm-season Tair and P values during the
whole 50-year study period (L-term), Period II (Per.II) and Period I (Per.I). Distribution intervals used: for
Tair = 5 °C, for P = 30 mm.

E. Lode et al. GROUNDWATER LEVELS IN ESTONIAN RAISED BOGS OVER 50 YEARS
Mires and Peat, Volume 19 (2017), Article 15, 1–21, http://www.mires-and-peat.net/, ISSN 1819-754X
© 2017 International Mire Conservation Group and International Peatland Society, DOI: 10.19189/MaP.2016.OMB.255
19
Figure A2. Probability plots of groundwater level (GWL) for Periods I and II (Per.I, Per.II) in different
Linnusaare (Li) and Männikjärve (Mä) bog ecotopes.
Figure A3. Frequency distribution (%) of the Period I and II groundwater levels (GWL) in different ecotopes
of Linnusaare (Li) and Männikjärve (Mä) Bogs (see also Tables A1 and A2). A step of 15 cm depth is used
for the GWL distribution interval.
E. Lode et al. GROUNDWATER LEVELS IN ESTONIAN RAISED BOGS OVER 50 YEARS
Mires and Peat, Volume 19 (2017), Article 15, 1–21, http://www.mires-and-peat.net/, ISSN 1819-754X
© 2017 International Mire Conservation Group and International Peatland Society, DOI: 10.19189/MaP.2016.OMB.255
20
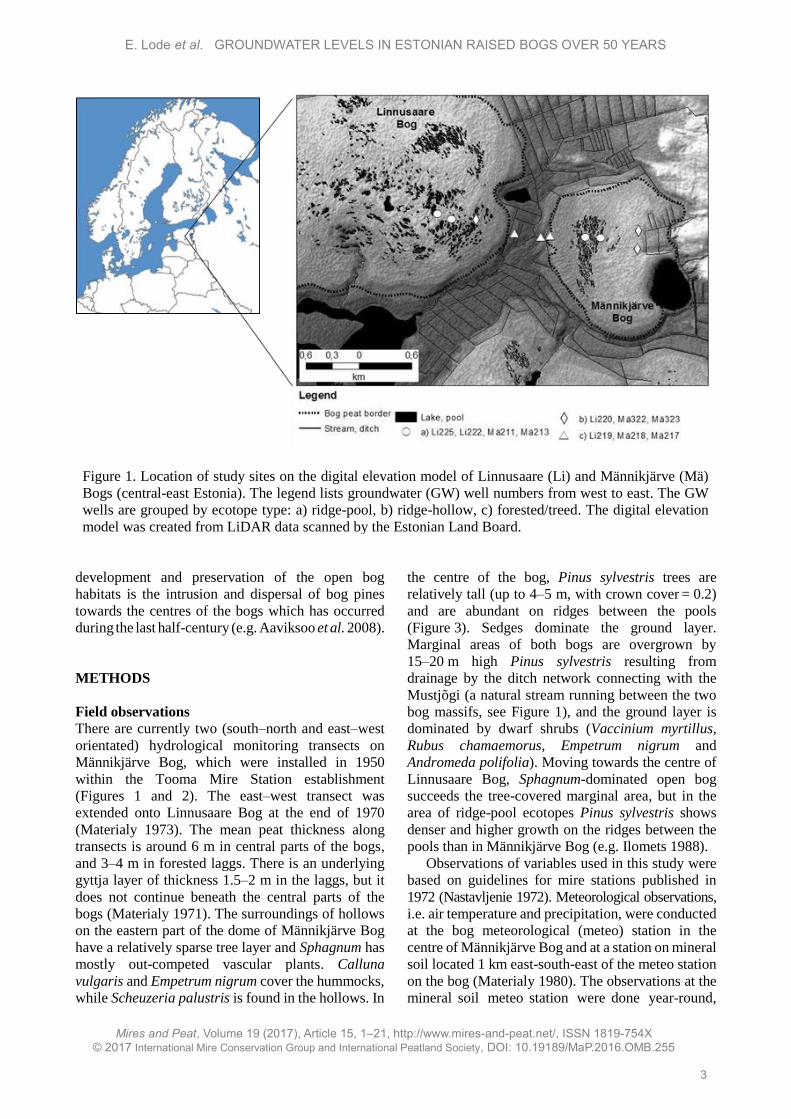
Table A1. Statistics for 50-year monthly GWLs (cm) in different ecotopes of Linnusaare (Li) and Männikjärve (Mä) Bogs. In this Table and elsewhere, GWLs below
the soil surface are indicated by “-”.
Linnusaare Bog Männikjärve Bog
Ecotope Ridge-pool Ridge-hollow Forested Treed Ridge-pool Ridge-hollow
GW well Li225 Li222 Li220 Li219 Mä218 Mä217 Mä213 Mä211 Mä323 Mä322
Annual
Mean -26 -38 -35 -49 -80 -39 -26 -25 -27 -31
Std.Dev. 9 8 8 11 15 11 8 7 9 9
n 492 492 480 480 564 576 576 576 576 576
Max -8 -21 -14 -31 -39 -10 -11 -11 -11 -16
Median -25 -36 -33 -46 -80 -37 -25 -24 -25 -29
Min -61 -73 -73 -87 -122 -75 -50 -52 -64 -70
Cold
season
Mean -23 -35 -31 -45 -76 -34 -23 -22 -23 -27
Std.Dev. 6 5 5 8 14 8 6 5 5 5
n 262 262 255 255 302 309 309 309 309 309
Max -8 -21 -14 -31 -39 -10 -11 -11 -11 -16
Median -22 -34 -31 -44 -77 -34 -22 -21 -22 -27
Min -52 -60 -57 -80 -113 -64 -44 -42 -45 -49
Warm
season
Mean -31 -42 -39 -53 -84 -44 -30 -28 -32 -36
Std.Dev. 9 9 9 12 15 11 8 8 10 10
n 230 230 225 225 262 267 267 267 267 267
Max -12 -27 -24 -33 -44 -20 -14 -14 -13 -19
Median -29 -40 -37 -50 -84 -42 -29 -27 -31 -33
Min -61 -73 -73 -87 -122 -75 -50 -52 -64 -70

E. Lode et al. GROUNDWATER LEVELS IN ESTONIAN RAISED BOGS OVER 50 YEARS
Mires and Peat, Volume 19 (2017), Article 15, 1–21, http://www.mires-and-peat.net/, ISSN 1819-754X
© 2017 International Mire Conservation Group and International Peatland Society, DOI: 10.19189/MaP.2016.OMB.255
21
Table A2. Statistics for Period I and Period II monthly GWLs (cm) in different ecotopes of Linnusaare (Li) and Männikjärve (Mä) Bogs.
Linnusaare Bog Männikjärve Bog
Ecotope Ridge-pool Ridge-hollow Forested Treed Ridge-pool Ridge-hollow
GW well Li225 Li222 Li220 Li219 Mä218 Mä217 Mä213 Mä211 Mä323 Mä322
Annual
I GWL mean -26 -38 -33 -48 -82 -36 -29 -27 -26 -31
II GWL mean -27 -38 -36 -50 -77 -42 -22 -22 -28 -32
±differences -1 0 -3 -2 +5 -6 +7 +5 -2 -1
I Std.Dev. 7 7 7 11 14 10 7 7 8 8
II Std.Dev. 9 9 9 11 16 11 6 6 9 9
Cold
season
I GWL mean -23 -35 -30 -46 -79 -32 -26 -24 -22 -27
II GWL mean -22 -34 -32 -45 -72 -37 -19 -19 -24 -28
±differences +1 +1 -2 +1 +7 -5 +7 +5 -2 -1
I Std.Dev. 5 5 5 9 13 8 5 5 5 5
II Std.Dev. 6 5 6 8 15 6 3 3 6 5
Warm
season
I GWL mean -29 -42 -36 -50 -85 -40 -33 -31 -31 -35
II GWL mean -32 -43 -41 -55 -84 -47 -26 -25 -33 -37
±differences -3 -1 -5 -5 +1 -7 +7 +6 -2 -2
I Std.Dev. 8 8 8 12 15 10 7 8 9 9
II Std.Dev. 9 10 10 12 16 11 7 7 10 10