Embed Size (px)
Citation preview
Indicative CBA Model for Earthquake prone
building reviewSummary of methodology and results
Final report -
September 2012
PURPOSE AND OUTPUTSCBA Model
2
CBA Model: Purpose and Outputs
The purpose of the Model is to calculate the impact (costs and benefits) of possible changes to the earthquake prone building policy related to the target %NBS to be applied and the timing of compliance. The model measures the incremental difference between a “status quo”
position (assuming existing timeframes for compliance and the current 33% NBS target) and three Policy Options:
l
A 33% NBS target but a shortening of the timeframe to comply
l
A 67% NBS target –
with or without a reset to the timeframe to comply, and
l
A 100% NBS target –
with or without a reset to the timeframe to comply.
For the status quo and each of the Policy Options, the model calculates costs and benefits for each Territorial Authority (TA) and sums the results to provide a total Cost/Benefit result for New Zealand.In addition, the difference between the current policy and timing and a “no strengthening”
option is also measured.
Costs that are modelled
l
Building strengthening costs l
An option to include or exclude additional costs including Fire Safety and Disabled Access improvements
Benefits from strengthening that are modelled (i.e. reduced costs in the event of an earthquake)
l
Reduced building damagel
Reduced loss of lifel
Reduced injury
Outputs produced
l
A present value net cost/benefit for each policy option –
based on a 75 year modelling period and a range of earthquake sizes with specific probabilities for each earthquake in each TA.
l
A cost/benefit result, as above, but measured for a single event annual earthquake and a single average probability factor.
l
A “per event”
cost/benefit for each policy option –
assuming an earthquake actually occurs at set dates (eg at years 10, 15, 20, 30).3

CBA Model: Purpose and Outputs
l
As the CBA Model measures the NPV of costs and benefits, total benefits decline each year after the end of strengthening due to annual discounting of the impacts. For example, the “benefits”
accruing from an earthquake that occurs in year 25 have a greater present value than an earthquake of similar size that occurs in year 50.
Costs and Benefits are incremental.
l
The CBA Model measures the annual differences
between the current strengthening and timetable and the policy strengthening and timetables.
Why a 75 year model?
l
75 Years is seen as a conservative estimate of the remaining useful life of the current earthquake prone building stock. It is possible that building lives will be shorter, but using 75 years makes it more likely that all potential benefits are captured.
The CBA (cost-benefit analysis) provides just one piece of the information to be considered in developing the overall EPB policy. The results of the CBA should be used alongside all other policy factors and considerations. 4
CBA Model: Economic & social costs
Economic and social costsThe CBA Model has not included an estimate of benefits that might accrue, after an earthquake event, from lower overall economic or social costs as a result of having strengthened earthquake prone buildings (EPBs). The basis for excluding such costs is as follows:
l
Our assumption is that only very large earthquakes will cause economic or social costs (e.g. Christchurch was a 1 in 2,500 year earthquake). The probability of very large earthquakes is so low that any probability based benefits from strengthening buildings are small. Also, with very large earthquakes, the positive impact of a few strengthened EPBs is likely to be dwarfed by more significant impacts on infrastructure and residential dwellings. We would not expect to attribute much (if any) economic or social impacts to the demise or otherwise of EPBs.
l
Similarly, in a large earthquake the damage to non-
EPBs is likely to be large, and the damage to strengthened EPBs will also still be a major factor. These impacts may also dwarf whatever improvements may have been made by strengthening a small number of older buildings.
l
If EPBs perform to design then in a large earthquake they should ensure that the occupants will survive. However, as evidenced in Christchurch, the buildings may still need to be demolished after the earthquake. It is this subsequent demolition that could cause an economic loss -
and strengthening for the purpose of preserving life may do little to prevent this.
l
There is likely to be a very narrow envelope of earthquake strengths where a strengthened EPB would remain standing and be useable after the event, but where it would not have survived if it hadn’t been strengthened. This lowers the probability of there being a material reduction in impact on economic and social outcomes from strengthened EPBs compared to other impacts (such as infrastructure damage).
l
A material impact (on a New Zealand scale) on economic and social outcomes after an earthquake is only likely to occur in cities/towns where there is a relatively high probability of a large earthquake and where there is a large commercial/industrial area. This is only the case in Wellington, Hutt City, Christchurch and Palmerston North.
5
NEW ZEALAND’S BUILDING STOCK
CBA Model
6
Total building stock
Total New Zealand building stockAn estimate of the total building stock by location and age for commercial, industrial and other non-
residential buildings, and high-rise residential buildings, was obtained from Quotable Value (QV).
l
The data received from QV for numbers of buildings was higher than expected. It appeared that the data might include, in some cases, the numbers of units for multi-unit properties.
l
QV were unable to easily separate out the actual building numbers from their database.
l
As a result, building numbers have been reported as “buildings/units”
in all model outputs and reports to take account of this possible issue with the QV data.
l
Importantly, however, the CBA model bases the key calculations on the building area (rather than number) so the CBA Model is not affected by the recording of the number of buildings/units
l
Note: 41% of buildings had age “unknown”
because it was either not recorded or because the building was made up of several parts with different ages. These were allocated pro-rata in the model.
l
The following charts show the make-up of the base data for all New Zealand buildings:7

Total building stock
8
The building stock is relatively concentrated, with 50% of the total building area for New Zealand in the top 7 TAs and 80% in the top 25. (There are 74 TAs in the QV database as it includes seven separate Auckland areas and the Chatham Islands). Total area for all buildings in New Zealand is
171,000,000m2.

Total building stockl
According to the QV database, the total number of buildings/units in New Zealand is 194,000. 11% were built pre 1935 and 31% were built between 1935 and 1976:
9
l
The average area per building/unit is 884m2, but this differs depending on the age of the building. Newer buildings are on average larger than older buildings, with post 1976 buildings being on average almost twice as large as pre 1935 buildings.
Earthquake prone building stock (EPBs)
Existing data on the numbers of EPBs in New Zealand is scarce. Several rough estimates have been made (e.g. Jason Ingham, David Hopkins) but all have recognised the serious lack of data and have caveated their results accordingly. The estimates for the CBA Model are no different. The work has considered and interpreted the available data, including the previous studies, but at best the numbers are only indicative. To take account of this uncertainty around the make-
up of the building stock the CBA Model applies a robust sensitivity analysis across all the results. The estimates for EPBs were developed as follows:
lIn March 2012, DBH carried out a survey of all TAs across New Zealand asking for details of EPBs (among other things). Unfortunately, this survey provided very little data on EPBs with most councils either just starting to gather data on their EPBs or not yet having started. The exception was Wellington City Council which had made significant progress in identifying the city’s at-risk buildings.
l
Survey results are shown on the following page:
10
Earthquake prone building stock (EPBs)Summary of initial TA survey response. Incomplete data from all
TAs with some useful data from Wellington and Whanganui. (The green boxes show the QV volumes. The bar charts for each TA show data provided in the survey. For data for a TA to be useful, the red, orange and
green bars should be close to the green box)
11
0
1,000
2,000
3,000
4,000
5,000
6,000
Auck
land
Well
ingto
n City
Chris
tchu
rch C
ityDu
nedin
City
Lowe
r Hut
t City
Ham
ilton C
ityW
hang
arei
Dist
rict
Inve
rcar
gill C
ityNe
w Pl
ymou
th Di
strict
Tota
l Bui
ldin
gs / U
nits
(Larger Scale)
Auckland :Total QV Buildings/Units 19,050Total TA data 17,096
0
200
400
600
800
1,000
1,200
1,400
Roto
rua D
istric
tFa
r Nor
th D
istric
tSo
uthla
nd D
istric
tPa
lmer
ston
Nor
th Ci
tyTi
mar
u Dist
rict
Hast
ings D
istric
tNa
pier C
itySo
uth T
aran
aki D
istric
tW
anga
nui D
istric
tTa
uran
ga C
ityGi
sbor
ne D
istric
tM
arlbo
roug
h Dist
rict
Ashb
urto
n Dist
rict
Mat
amat
a-Pi
ako D
istric
tW
aikat
o Dist
rict
Wait
aki D
istric
tTa
sman
Dist
rict
Sout
h Waik
ato D
istric
tNe
lson C
ityHo
rowh
enua
Dist
rict
Waip
a Dist
rict
Tham
es-C
orom
ande
l Dist
rict
Clut
ha D
istric
tW
haka
tane
Dist
rict
Tara
rua D
istric
tRa
ngitik
ei Di
strict
Porir
ua C
ityM
aste
rton D
istric
tTa
upo D
istric
tM
anaw
atu D
istric
tCe
ntra
l Ota
go D
istric
tGr
ey D
istric
tRu
apeh
u Dist
rict
Gore
Dist
rict
Kaipa
ra D
istric
tSe
lwyn
Dist
rict
Uppe
r Hut
t City
Waim
akar
iri Di
strict
Kapit
i Coa
st D
istric
tHa
urak
i Dist
rict
Wair
oa D
istric
tBu
ller D
istric
tSt
ratfo
rd D
istric
tCe
ntra
l Haw
ke's
Bay D
istric
tSo
uth W
airar
apa D
istric
tW
aitom
o Dist
rict
Huru
nui D
istric
tW
este
rn B
ay of
Plen
ty Di
strict
Wes
tland
Dist
rict
Quee
nsto
wn-L
akes
Dist
rict
Opot
iki D
istric
tCa
rterto
n Dist
rict
Otor
ohan
ga D
istric
tW
aimat
e Dist
rict
Mac
kenz
ie Di
strict
Kaiko
ura D
istric
tKa
wera
u Dist
rict
Chat
ham
Islan
ds Te
rritor
y
QV and TA-provided Information on Building Stock (pre-1976)
<33% NBS 33-67% NBS >67% NBS Not Assessed Total QV Pre 1976 Buildings/Units
Earthquake prone building stock (EPBs)
l
Following the poor response from the survey, in July 2012, councils of ten of the major cities and towns in New Zealand were contacted directly by phone and the latest EPB data was requested. Data was obtained between 9 July and 19 July 2012.
l
Dunedin and Rotorua had no current data. Christchurch was not approached and Hamilton had a limited amount of data.
l
As a result, this approach provided useable data and estimates from seven councils -
on buildings <33%NBS as well as on buildings between 33% and 67%NBS. This group of councils were: Auckland, Wellington, Hastings, Nelson, Whangarei, Whanganui, and Whakatane.
l
The data collected related only to pre-1976 building stock. This is because it is most likely that buildings <33% NBS will have been built before a building code change in that year –
and buildings below 33% have been the focus of the councils to date.
12
Earthquake prone building stock (EPBs)
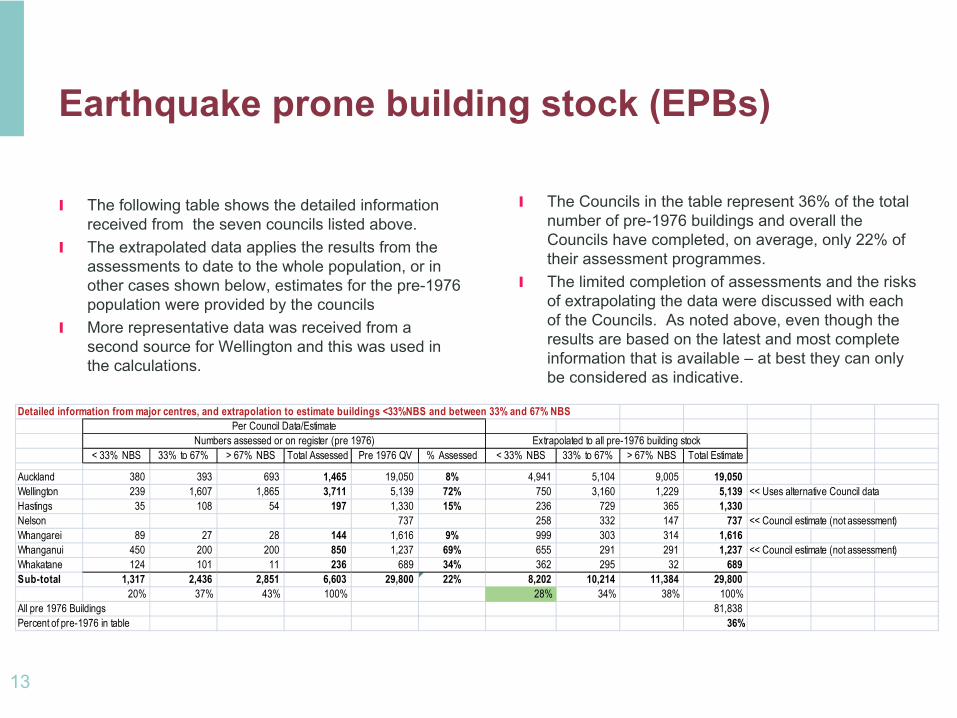
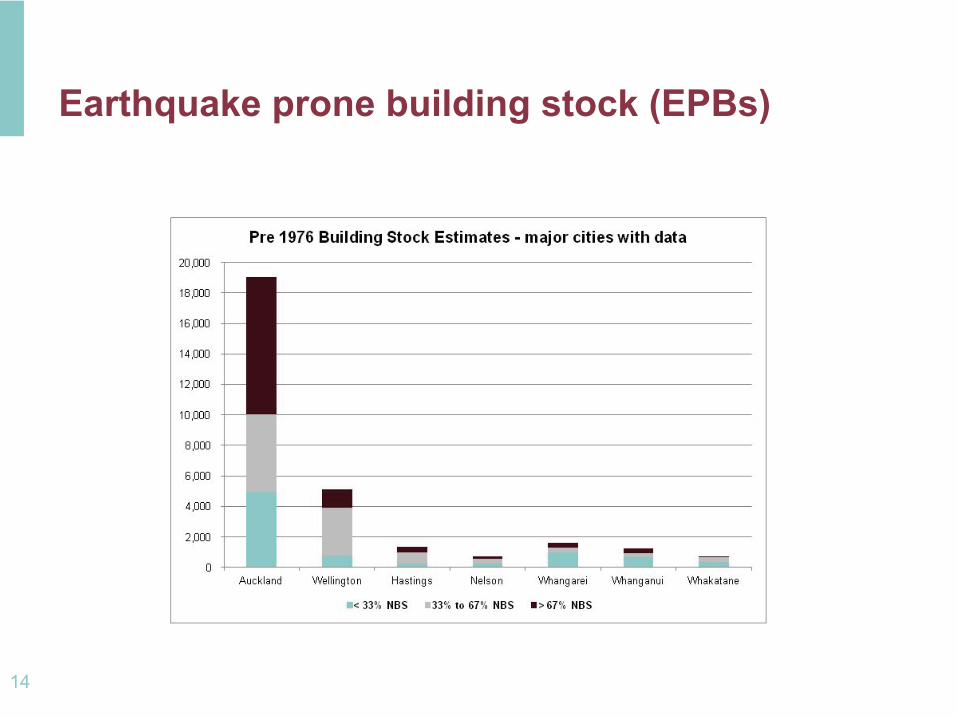
l
The following table shows the detailed information received from the seven councils listed above.
l
The extrapolated data applies the results from the assessments to date to the whole population, or in other cases shown below, estimates for the pre-1976 population were provided by the councils
l
More representative data was received from a second source for Wellington and this was used in the calculations.
13
Detailed information from major centres, and extrapolation to estimate buildings <33%NBS and between 33% and 67% NBS
< 33% NBS 33% to 67% > 67% NBS Total Assessed Pre 1976 QV % Assessed < 33% NBS 33% to 67% > 67% NBS Total Estimate
Auckland 380 393 693 1,465 19,050 8% 4,941 5,104 9,005 19,050 Wellington 239 1,607 1,865 3,711 5,139 72% 750 3,160 1,229 5,139 << Uses alternative Council dataHastings 35 108 54 197 1,330 15% 236 729 365 1,330 Nelson 737 258 332 147 737 << Council estimate (not assessment)Whangarei 89 27 28 144 1,616 9% 999 303 314 1,616 Whanganui 450 200 200 850 1,237 69% 655 291 291 1,237 << Council estimate (not assessment)Whakatane 124 101 11 236 689 34% 362 295 32 689 Sub-total 1,317 2,436 2,851 6,603 29,800 22% 8,202 10,214 11,384 29,800
20% 37% 43% 100% 28% 34% 38% 100%All pre 1976 Buildings 81,838 Percent of pre-1976 in table 36%
Extrapolated to all pre-1976 building stockNumbers assessed or on register (pre 1976)Per Council Data/Estimate
l
The Councils in the table represent 36% of the total number of pre-1976 buildings and overall the Councils have completed, on average, only 22% of their assessment programmes.
l
The limited completion of assessments and the risks of extrapolating the data were discussed with each of the Councils. As noted above, even though the results are based on the latest and most complete information that is available –
at best they can only be considered as indicative.
Earthquake prone building stock (EPBs)
14
Earthquake prone building stock (EPBs)
l
From this data, the ratio of buildings that are 33-67% NBS compared to the buildings that are <33% NBS is 1.2. (This was based on an average of the TA ratios, excluding Wellington. Wellington was excluded because it appeared to be an outlier compared to the other TA results).
l
This ratio is applied to all other TAs to estimate the number of buildings between 33% and 67% NBS, based on the recorded or calculated data for buildings below 33%.
Additional data sourcesl
In addition to the direct contact made with major councils, an internet search was carried out for any further information about EPBs across New Zealand. This produced additional information on buildings below 33% NBS from Council lists of EPBs, as well as from press reports. (Searches were made by DBH, the Ministry of Culture and Heritage and MartinJenkins).
l
Additional data was sourced from 16 TAs: Tauranga, Lower Hutt, Manawatu (Fielding), Palmerston North, Central Otago, Opotiki, Selwyn, Hamilton, SouthTaranaki, Tararua, Masterton, Marlborough, Hurunui, Waimakariri, Clutha, and Westland.
l
This data was of low quality, comprising estimates that included either most of the pre-1976 building stock, or were from partially completed assessment programmes.
l
The combined data from all the 23 councils with usable information provided the overall indicative estimate of the EPB stock. This data suggested that, across New Zealand, 24% of all pre-1976 buildings could be below 33% NBS.
l
In comparison, the average percentage for the seven councils with higher quality data was 28%.
l
An indicative estimate of the EPB status of the New Zealand building stock is shown in the chart on the following page
l
Note: buildings built after 1976 have not been assessed, but it would be fair to assume that a significant number of such buildings will be between 33% and 67% NBS.
15
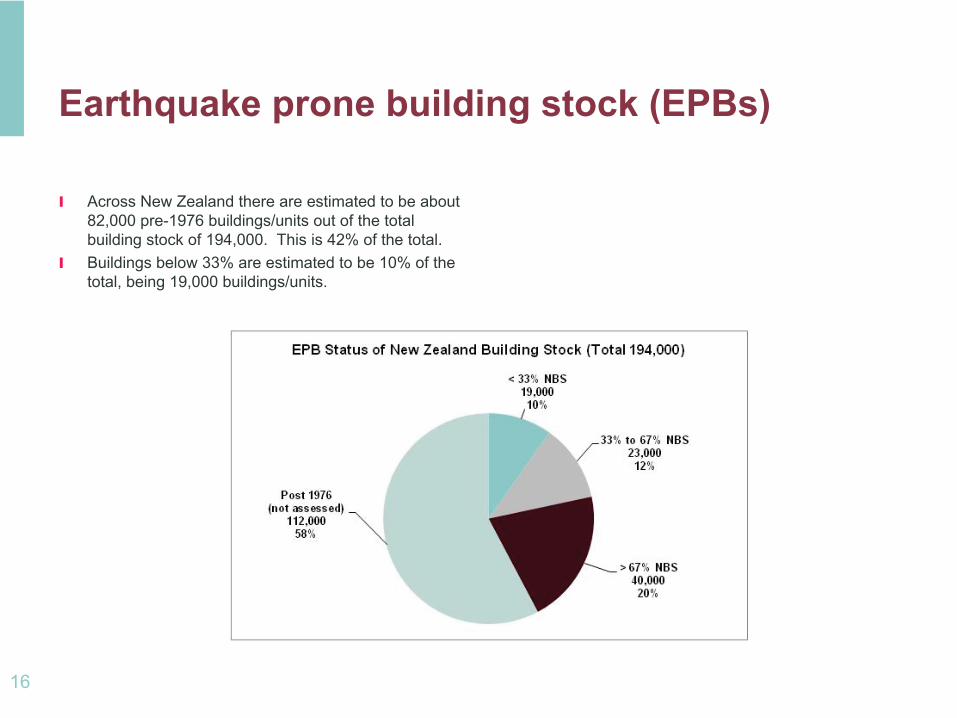
Earthquake prone building stock (EPBs)
l
Across New Zealand there are estimated to be about 82,000 pre-1976 buildings/units out of the total building stock of 194,000. This is 42% of the total.
l
Buildings below 33% are estimated to be 10% of the total, being 19,000 buildings/units.
16
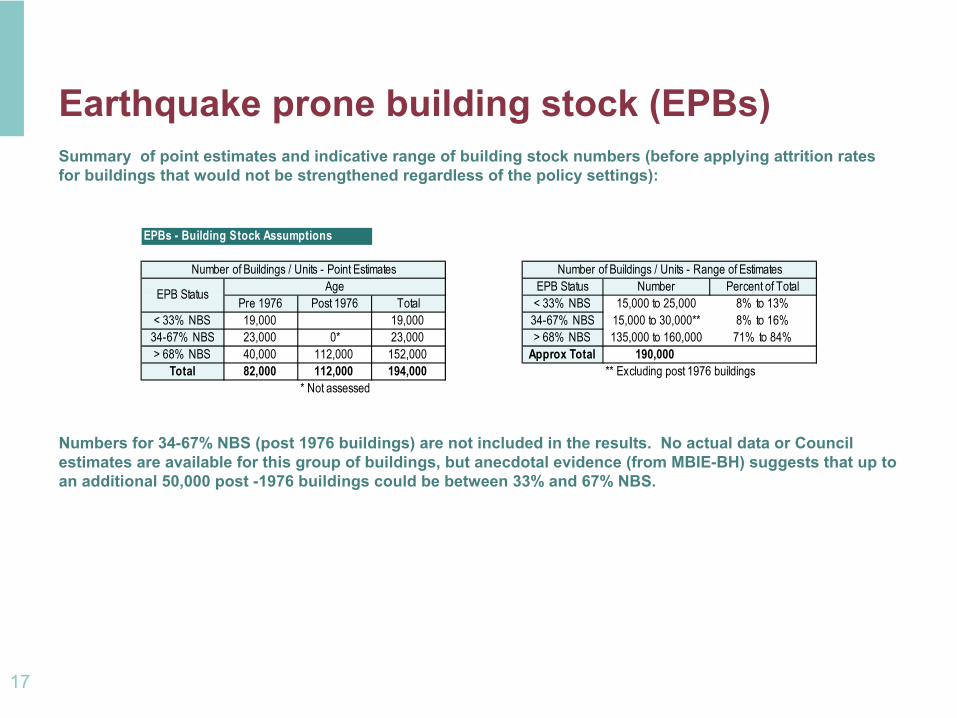
Earthquake prone building stock (EPBs)Summary of point estimates and indicative range of building stock numbers (before applying attrition rates for buildings that would not be strengthened regardless of the policy settings):
Numbers for 34-67% NBS (post 1976 buildings) are not included in the results. No actual data or Council estimates are available for this group of buildings, but anecdotal evidence (from MBIE-BH) suggests that up to an additional 50,000 post -1976 buildings could be between 33% and 67% NBS.
17
EPBs - Building Stock Assumptions
EPB Status Number Percent of TotalPre 1976 Post 1976 Total < 33% NBS 15,000 to 25,000 8% to 13%
< 33% NBS 19,000 19,000 34-67% NBS 15,000 to 30,000** 8% to 16%34-67% NBS 23,000 0* 23,000 > 68% NBS 135,000 to 160,000 71% to 84%> 68% NBS 40,000 112,000 152,000 Approx Total 190,000
Total 82,000 112,000 194,000 ** Excluding post 1976 buildings* Not assessed
Number of Buildings / Units - Point Estimates
EPB Status AgeNumber of Buildings / Units - Range of Estimates

Earthquake prone building stock in CBA model
CBA Model -
use of building stockl
The building stock used in the CBA model is reduced by an “attrition rate”
of 10% for <33% NBS buildings and 5% for 33%-67% NBS buildings to take account of buildings not expected to be strengthened regardless of the future policy.
l
These rates are judgement-based, and the lower rate for 33%-67% NBS reflects that these buildings are more likely to be newer (and therefore more likely to be strengthened) than the <33% NBS buildings.
l
As noted above, the large uncertainty around the actual make-up of the building stock is managed in the CBA Model by applying a robust sensitivity analysis across all the results.
18
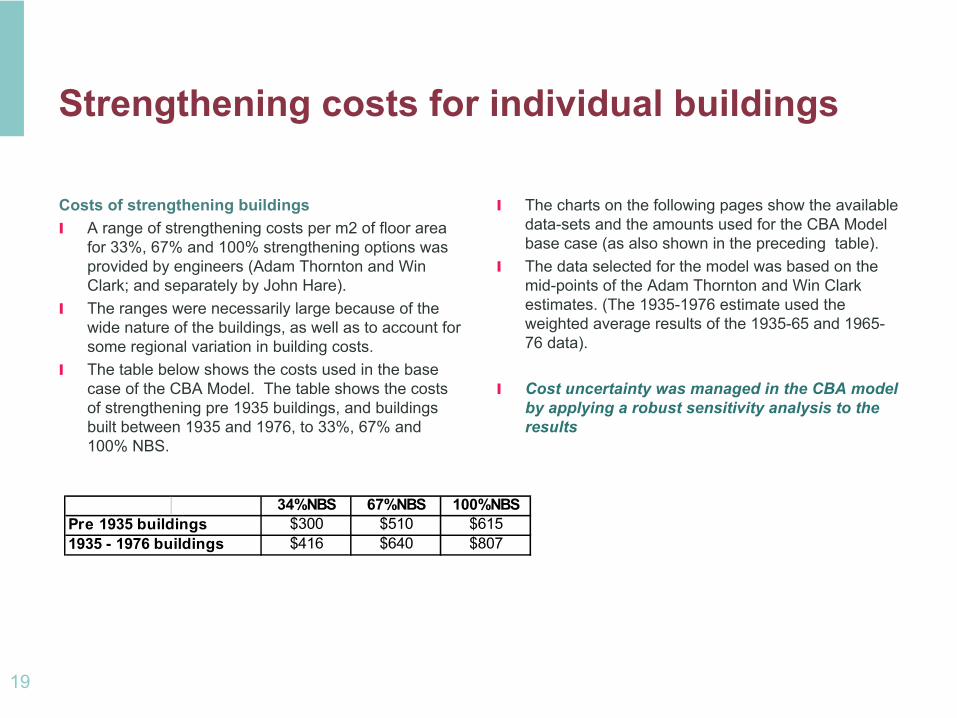
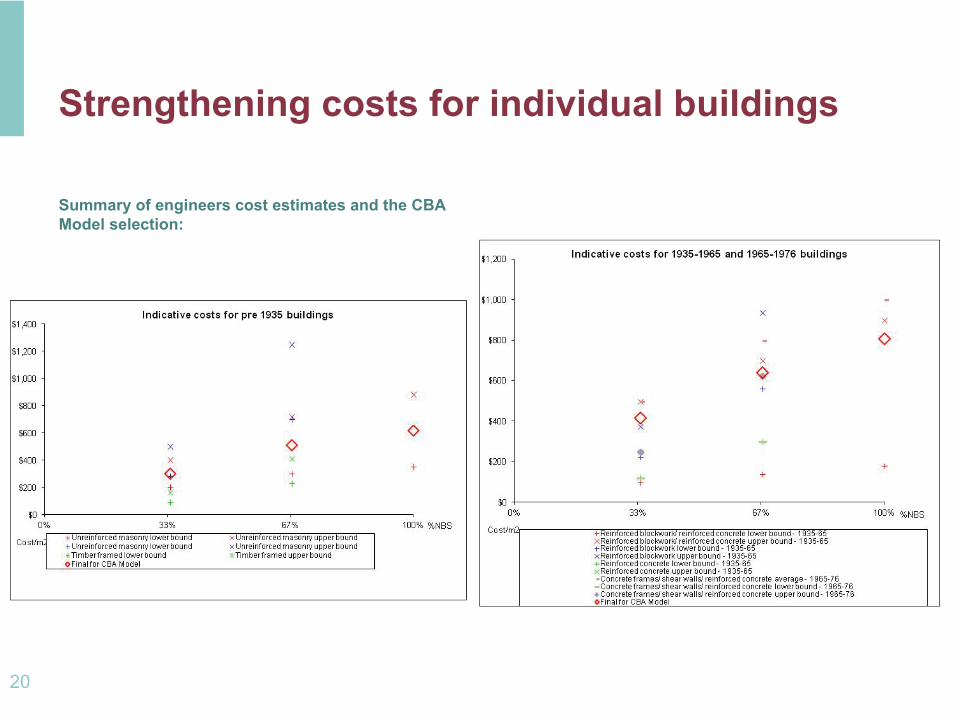
Strengthening costs for individual buildings
Costs of strengthening buildingsl
A range of strengthening costs per m2 of floor area for 33%, 67% and 100% strengthening options was provided by engineers (Adam Thornton and Win Clark; and separately by John Hare).
l
The ranges were necessarily large because of the wide nature of the buildings, as well as to account for some regional variation in building costs.
l
The table below shows the costs used in the base case of the CBA Model. The table shows the costs of strengthening pre 1935 buildings, and buildings built between 1935 and 1976, to 33%, 67% and 100% NBS.
l
The charts on the following pages show the available data-sets and the amounts used for the CBA Model base case (as also shown in the preceding table).
l
The data selected for the model was based on the mid-points of the Adam Thornton and Win Clark estimates. (The 1935-1976 estimate used the weighted average results of the 1935-65 and 1965-
76 data).
l
Cost uncertainty was managed in the CBA model by applying a robust sensitivity analysis to the results
19
34%NBS 67%NBS 100%NBSPre 1935 buildings $300 $510 $6151935 - 1976 buildings $416 $640 $807
Strengthening costs for individual buildings
20
Summary of engineers cost estimates and the CBA Model selection:
Costs of strengthening buildings -
and timing to complete
Additional costs
l
Costs of fire and disabled access upgrades are able to be included in the CBA model, but were set at zero for the base case.
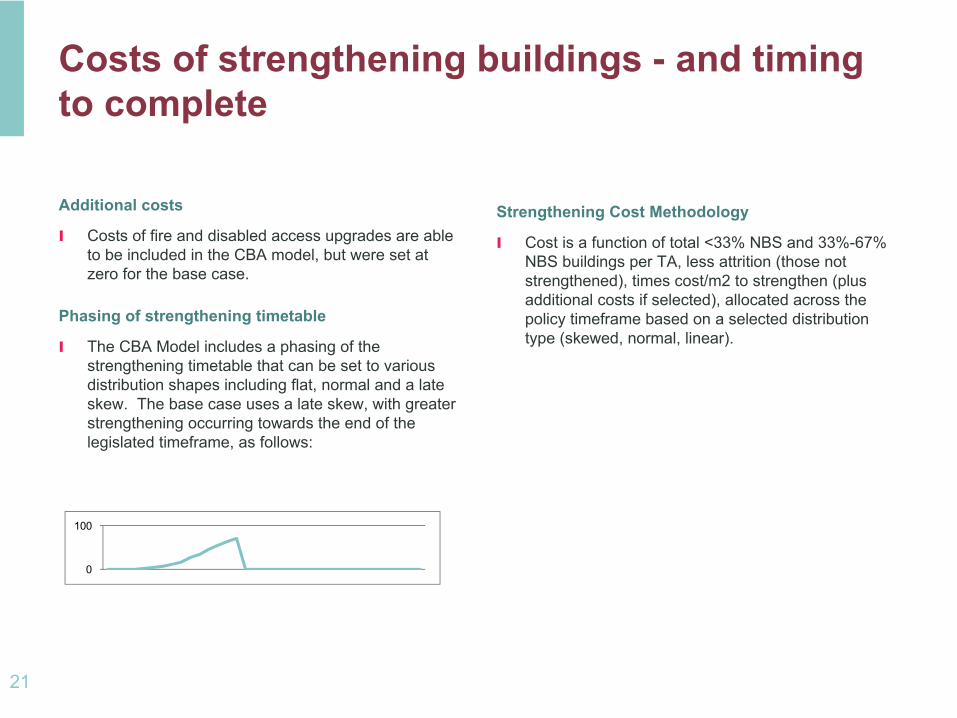
Phasing of strengthening timetable
l
The CBA Model includes a phasing of the strengthening timetable that can be set to various distribution shapes including flat, normal and a late skew. The base case uses a late skew, with greater strengthening occurring towards the end of the legislated timeframe, as follows:
Strengthening Cost Methodology
l
Cost is a function of total <33% NBS and 33%-67% NBS buildings per TA, less attrition (those not strengthened), times cost/m2 to strengthen (plus additional costs if selected), allocated across the policy timeframe based on a selected distribution type (skewed, normal, linear).
21
0
100
TOTAL COSTS OF STRENGTHENING
CBA Model
22
Summary of CBA Model Strengthening Costs
Three “base case”
options were modelled:(1)33% strengthening with shortening of the timeframe from the current average period of 28 years to a maximum timeframe of 15 years(2)67% strengthening with a timeframe of 15 years(3)100% strengthening with a timeframe of 15 years
As noted earlier, the status quo assumes that the current standard of 33% is implemented according to existing timeframes. This is an average of 28 years.
The three options above are compared to the status quo (current 33% case) to provide an estimate of incremental costs.
The following page summarises the base case modelled results:
23
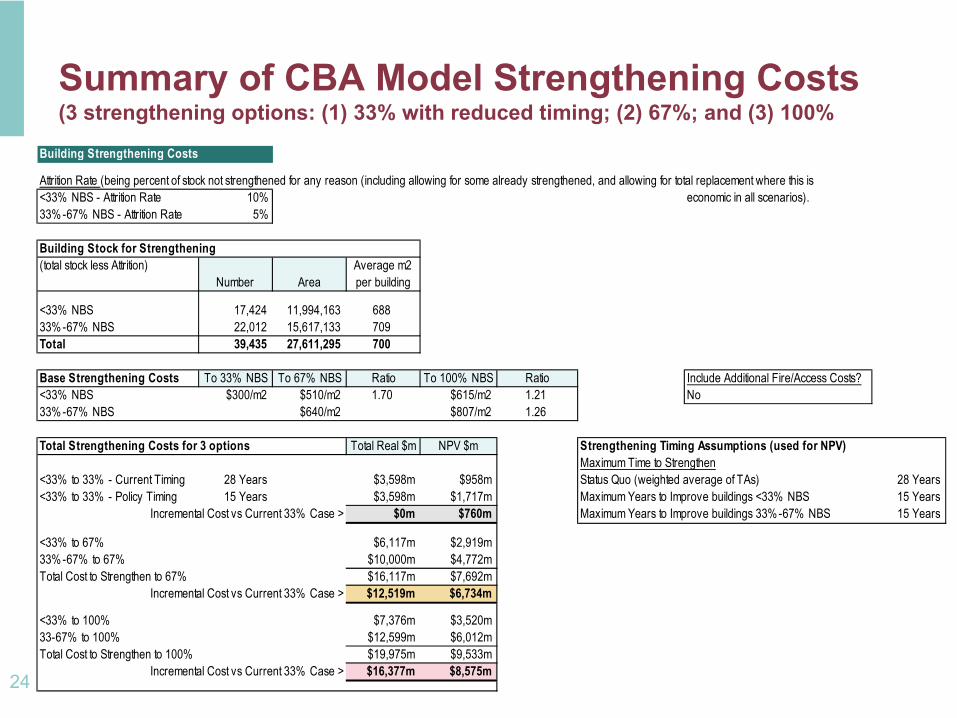
Summary of CBA Model Strengthening Costs (3 strengthening options: (1) 33% with reduced timing; (2) 67%; and (3) 100%
24
Building Strengthening Costs
Attrition Rate (being percent of stock not strengthened for any reason (including allowing for some already strengthened, and allowing for total replacement where this is<33% NBS - Attrition Rate 10% economic in all scenarios).33%-67% NBS - Attrition Rate 5%
Building Stock for Strengthening(total stock less Attrition)
Number AreaAverage m2 per building
<33% NBS 17,424 11,994,163 688 33%-67% NBS 22,012 15,617,133 709 Total 39,435 27,611,295 700
Base Strengthening Costs To 33% NBS To 67% NBS Ratio To 100% NBS Ratio Include Additional Fire/Access Costs?<33% NBS $300/m2 $510/m2 1.70 $615/m2 1.21 No33%-67% NBS $640/m2 $807/m2 1.26
Total Strengthening Costs for 3 options Total Real $m NPV $m Strengthening Timing Assumptions (used for NPV)Maximum Time to Strengthen
<33% to 33% - Current Timing 28 Years $3,598m $958m Status Quo (weighted average of TAs) 28 Years <33% to 33% - Policy Timing 15 Years $3,598m $1,717m Maximum Years to Improve buildings <33% NBS 15 Years
Incremental Cost vs Current 33% Case > $0m $760m Maximum Years to Improve buildings 33%-67% NBS 15 Years
<33% to 67% $6,117m $2,919m 33%-67% to 67% $10,000m $4,772m Total Cost to Strengthen to 67% $16,117m $7,692m
Incremental Cost vs Current 33% Case > $12,519m $6,734m
<33% to 100% $7,376m $3,520m 33-67% to 100% $12,599m $6,012m Total Cost to Strengthen to 100% $19,975m $9,533m
Incremental Cost vs Current 33% Case > $16,377m $8,575m
BENEFITSCBA Model
25
Benefit Inputs and Calculations
Benefit Inputs and CalculationsInformation on the benefits arising from earthquakes is limited and difficult to estimate. GNS has provided all the base information for the CBA Model and have run a number of specific models to provide the required inputs.The CBA Model takes the GNS results and extrapolates and modifies these for all the TAs using, where relevant, population, building areas, geography, seismicity or earthquake probabilities.
l
Three representative high seismicity cities/towns (Wellington, Hastings, Greytown) were modelled for earthquakes by GNS, producing estimates of expected workday deaths and injuries, non-workday deaths and injuries and damage costs.
l
The models also estimated impacts on the public outside of buildings, on the city/town streets.
l
These centres were selected by GNS due to the data and models that were available at the time.
l
They were also selected as they gave a fair representation of three difference sizes of New Zealand centres: large city, medium centre, small town.
l
The three models were expanded by GNS to six models by tweaking the inputs to produce low seismicity equivalents. The models are:
Wellington –
HIGH
Population: 179,000
Wellington –
LOW
Hastings –
HIGH
Population: 62,000
Hastings –
LOW
Greytown –
HIGH
Population: 2,000
Greytown –
LOW
l
For example, the LOW seismicity Wellington model is designed to represent the impacts in a city such as Auckland. (Wgtn Z-factor 0.40; Auckland Z-factor 0.13).
l
The six GNS model results were scaled and applied to other cities/towns across NZ based on relative populations for major towns and cities in each TA as well as seismicity. An alternative allocation using relative building areas in each TA was also calculated but this did not produce a material difference so the population allocation driver was retained.
26
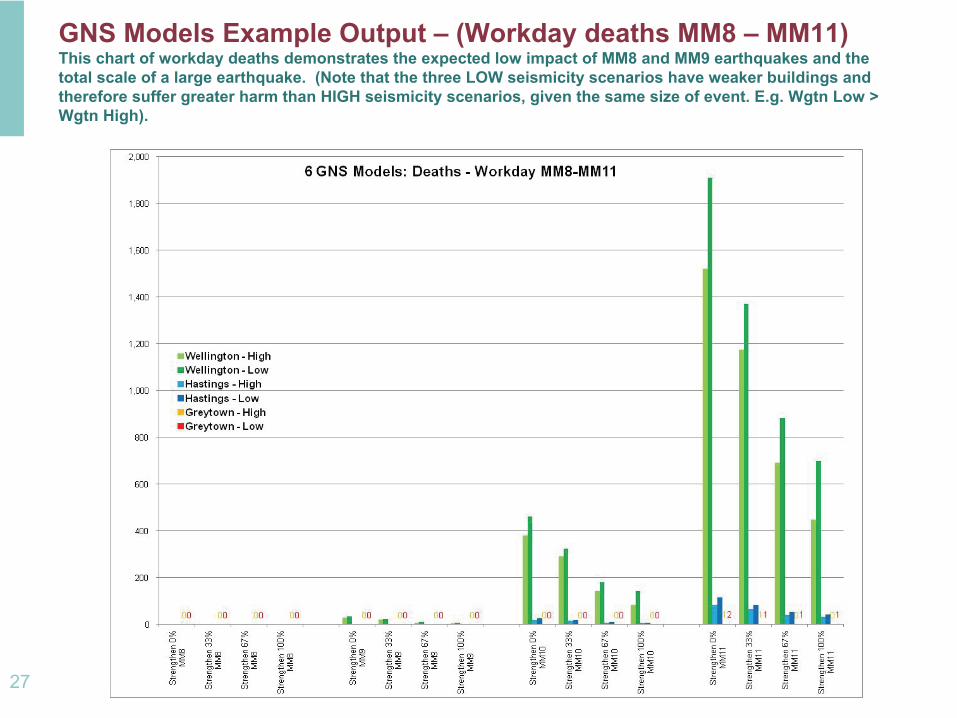
GNS Models Example Output –
(Workday deaths MM8 –
MM11) This chart of workday deaths demonstrates the expected low impact of MM8 and MM9 earthquakes and the
total scale of a large earthquake. (Note that the three LOW seismicity scenarios have weaker buildings and therefore suffer greater harm than HIGH seismicity scenarios, given the same size of event. E.g. Wgtn Low > Wgtn High).
27
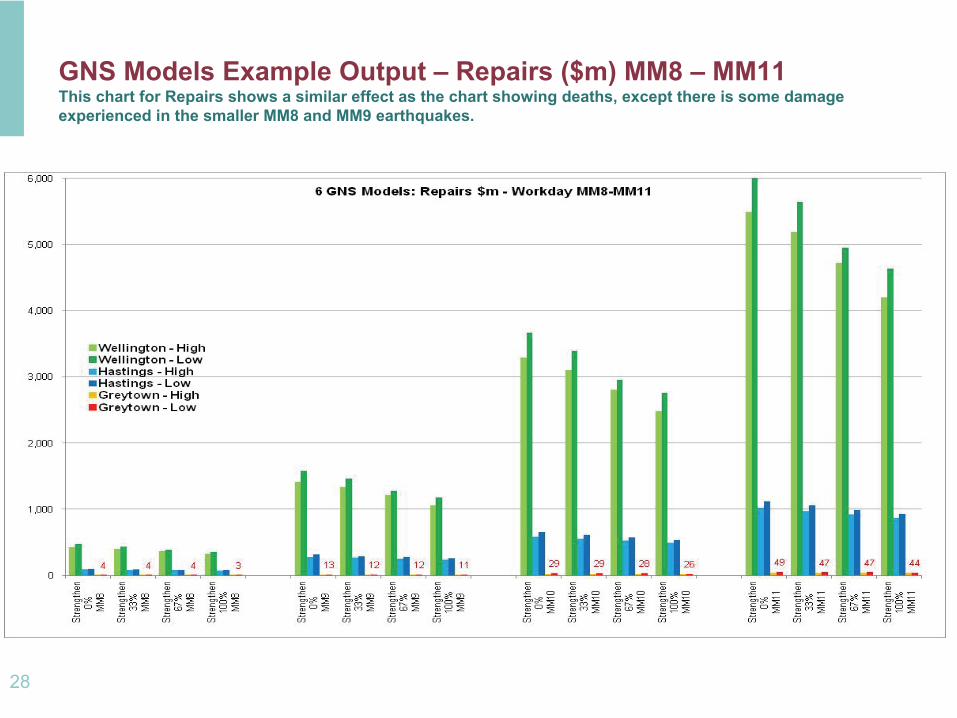
GNS Models Example Output –
Repairs ($m) MM8 –
MM11 This chart for Repairs shows a similar effect as the chart showing deaths, except there is some damage
experienced in the smaller MM8 and MM9 earthquakes.
28
Benefit Inputs and Calculations (cont)
Allocation of GNS models to TAs
l
The six models were assigned to TAs as follows:
Wellington uses Wellington High, Hastings uses Hastings High, Greytown uses Greytown High
Z-factors for these centres are 0.40, 0.39 and 0.42 respectively
If a Z-factor for a TA is less than 0.20 it uses a LOW model, otherwise it uses a HIGH model
If total population of a TA is greater than 75,000 it uses a Wellington model, if average town population
in a TA is below 5,000 it uses a Greytown model, otherwise it uses a Hastings model
The Z-factor and population steps were varied as part of the sensitivity analysis
l
Each of the 6 models provided by GNS included results (number of deaths/injuries in a workday/non-
workday and costs of damage) under earthquake strengths from MM8 to MM11*.
l
This band was selected because:
MM12 earthquakes (the maximum) have a huge impact but are not predicted to occur in New Zealand’s towns or cities
Earthquakes lower than MM8 have a higher probability of occurrence but are not expected to cause material damage for the purposes of the CBA analysis
l
* The MM scale is the Modified Mercalli Index.
The size of an earthquake is often described using magnitude, which is the amount of energy released during an earthquake. However, not all of the energy released in an earthquake will necessarily be felt at the surface, depending on the earthquake's depth.
In New Zealand, where earthquakes occur from near the surface right down to a depth of over 600 km, the Modified Mercalli intensity scale is a better indicator of an earthquake's effects on people and their environment
The MM scale is described in summary form on the following page:
29
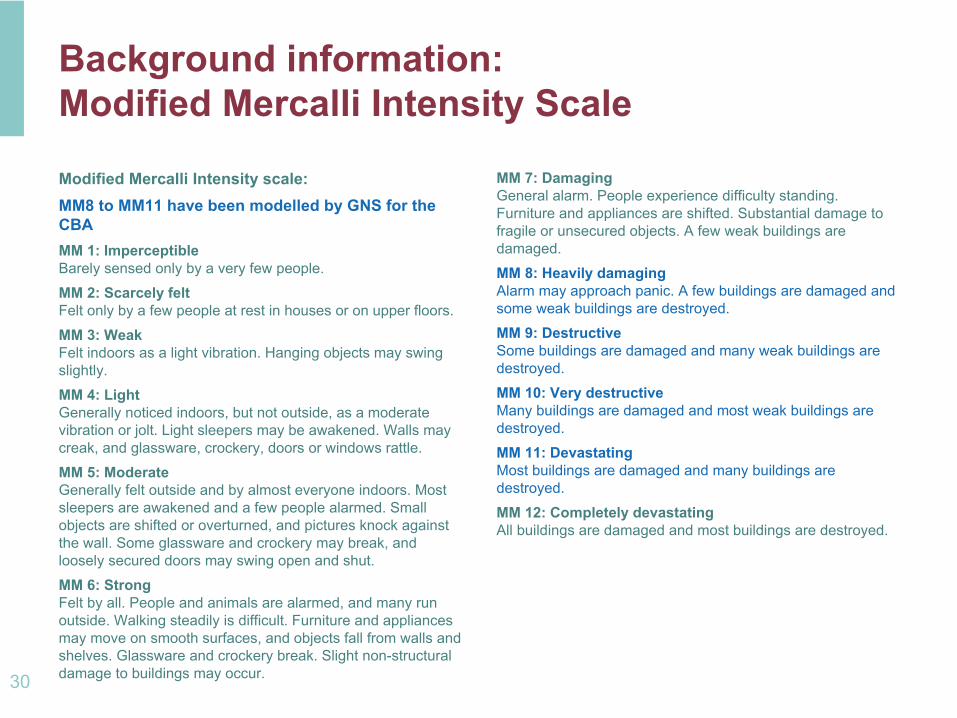
Background information: Modified Mercalli Intensity Scale
Modified Mercalli Intensity scale:MM8 to MM11 have been modelled by GNS for the CBAMM 1: Imperceptible Barely sensed only by a very few people.
MM 2: Scarcely felt Felt only by a few people at rest in houses or on upper floors.
MM 3: Weak Felt indoors as a light vibration. Hanging objects may swing slightly.
MM 4: Light Generally noticed indoors, but not outside, as a moderate vibration or jolt. Light sleepers may be awakened. Walls may creak, and glassware, crockery, doors or windows rattle.
MM 5: Moderate Generally felt outside and by almost everyone indoors. Most sleepers are awakened and a few people alarmed. Small objects are shifted or overturned, and pictures knock against the wall. Some glassware and crockery may break, and loosely secured doors may swing open and shut.
MM 6: Strong Felt by all. People and animals are alarmed, and many run outside. Walking steadily is difficult. Furniture and appliances
may move on smooth surfaces, and objects fall from walls and shelves. Glassware and crockery break. Slight non-structural damage to buildings may occur.
MM 7: Damaging
General alarm. People experience difficulty standing. Furniture and appliances are shifted. Substantial damage to fragile or unsecured objects. A few weak buildings are damaged.
MM 8: Heavily damaging Alarm may approach panic. A few buildings are damaged and some weak buildings are destroyed.
MM 9: Destructive Some buildings are damaged and many weak buildings are destroyed.
MM 10: Very destructive Many buildings are damaged and most weak buildings are destroyed.
MM 11: Devastating Most buildings are damaged and many buildings are destroyed.
MM 12: Completely devastating All buildings are damaged and most buildings are destroyed.
30
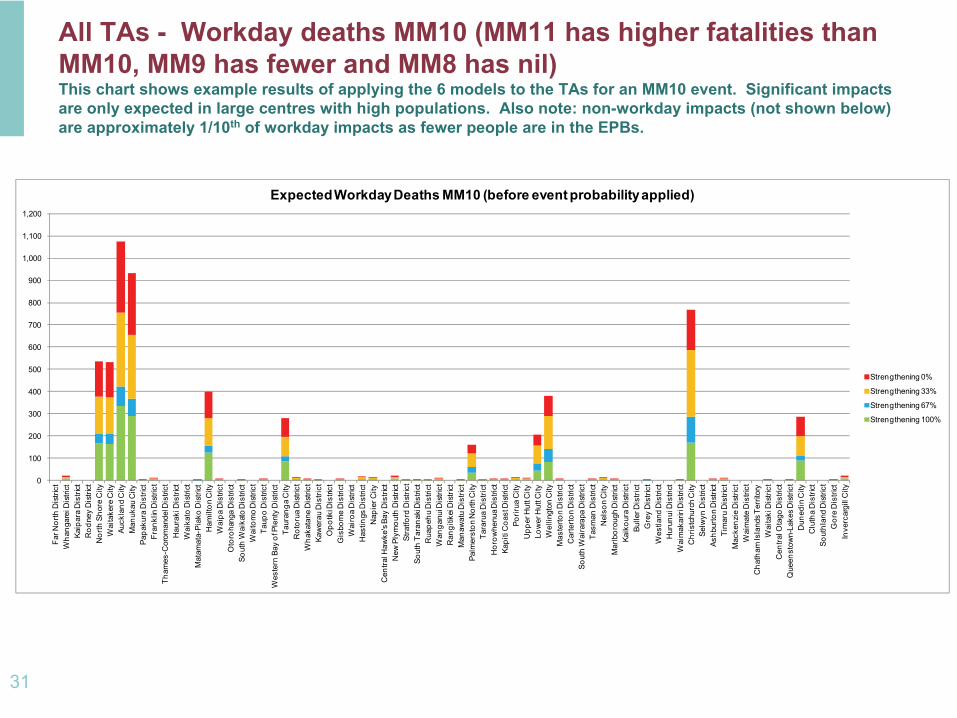
All TAs -
Workday deaths MM10 (MM11 has higher fatalities than MM10, MM9 has fewer and MM8 has nil)
This chart shows example results of applying the 6 models to the
TAs for an MM10 event. Significant impacts are only expected in large centres with high populations. Also note: non-workday impacts (not shown below) are approximately 1/10th
of workday impacts as fewer people are in the EPBs.
0
100
200
300
400
500
600
700
800
900
1,000
1,100
1,200
Far N
orth
Dis
trict
Wha
ngar
ei D
istri
ctKa
ipar
a D
istri
ctR
odne
y D
istri
ctN
orth
Sho
re C
ityW
aita
kere
City
Auck
land
City
Man
ukau
City
Papa
kura
Dis
trict
Fran
klin
Dis
trict
Tham
es-C
orom
ande
l Dis
trict
Hau
raki
Dis
trict
Wai
kato
Dis
trict
Mat
amat
a-Pi
ako
Dis
trict
Ham
ilton
City
Wai
pa D
istri
ctO
toro
hang
a D
istri
ctSo
uth
Wai
kato
Dis
trict
Wai
tom
o D
istri
ctTa
upo
Dis
trict
Wes
tern
Bay
of P
lent
y D
istri
ctTa
uran
ga C
ityR
otor
ua D
istri
ctW
haka
tane
Dis
trict
Kaw
erau
Dis
trict
Opo
tiki D
istri
ctG
isbo
rne
Dis
trict
Wai
roa
Dis
trict
Has
tings
Dis
trict
Nap
ier C
ityC
entra
l Haw
ke's
Bay
Dis
trict
New
Ply
mou
th D
istri
ctSt
ratfo
rd D
istri
ctSo
uth
Tara
naki
Dis
trict
Rua
pehu
Dis
trict
Wan
ganu
i Dis
trict
Ran
gitik
ei D
istri
ctM
anaw
atu
Dis
trict
Palm
erst
on N
orth
City
Tara
rua
Dis
trict
Hor
owhe
nua D
istri
ctKa
piti
Coa
st D
istri
ctPo
rirua
City
Upp
er H
utt C
ityLo
wer
Hut
t City
Wel
lingt
on C
ityM
aste
rton
Dis
trict
Car
terto
n D
istri
ctSo
uth
Wai
rara
pa D
istri
ctTa
sman
Dis
trict
Nel
son
City
Mar
lbor
ough
Dis
trict
Kaik
oura
Dis
trict
Bulle
r Dis
trict
Gre
y D
istri
ctW
estla
nd D
istri
ctH
urun
ui D
istri
ctW
aim
akar
iri D
istri
ctC
hris
tchu
rch
City
Selw
yn D
istri
ctAs
hbur
ton
Dis
trict
Tim
aru
Dis
trict
Mac
kenz
ie D
istri
ctW
aim
ate
Dis
trict
Cha
tham
Isla
nds T
errit
ory
Wai
taki
Dis
trict
Cen
tral O
tago
Dis
trict
Que
enst
own-
Lake
s Dis
trict
Dun
edin
City
Clu
tha
Dis
trict
Sout
hlan
d D
istri
ctG
ore
Dis
trict
Inve
rcar
gill C
ity
Expected Workday Deaths MM10 (before event probability applied)
Strengthening 0%
Strengthening 33%
Strengthening 67%
Strengthening 100%
31
Benefit Inputs and Calculations (cont)
Earthquake probability modelling
l
Once a model was assigned to each TA, and scaled up or down according to relative populations, an earthquake probability specific to the TA was applied to each of the MM8 to MM11 results.
l
The data for the earthquake probabilities for MM8 to MM11 was provided by GNS. This was for the 30 major towns/cities of New Zealand (and updated earlier work provided for a report by David Hopkins in 2002).
l
Data for each of the 30 towns/cities was matched to the relevant TA. For TAs not covered in the list, probabilities were applied to each TA based on the nearest listed data -
taking into account both geography & seismicity.
l
Where any judgement was required between two options the higher probability factor was applied.
l
This is a conservative approach for the CBA Model, reflecting the preliminary results that showed very low benefits compared to costs.
l
This conservative approach was adopted throughout the analysis in order to provide greater comfort over the calculations -
and greater confidence around the relationship between estimated costs and estimated benefits.
l
For each TA, the CBA model sums all the impacts of the major earthquakes (MM8-MM11) taking into account their respective probabilities. This produces average annual workday and non-workday deaths/injuries and average damage per TA for all major earthquakes.
l
The probability based results of the earthquake modelling are combined into a total probability factor for each TA, together with outputs for weighted average workday and non-workday deaths/injuries and average costs of damage. These are used as inputs into the main part of the CBA Model .
32
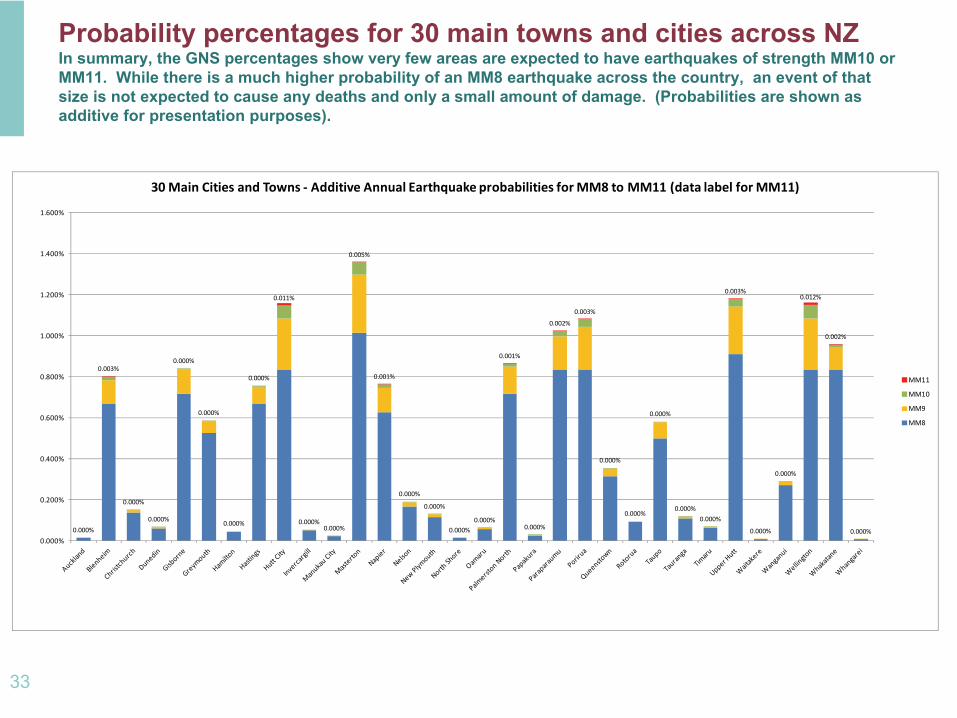
Probability percentages for 30 main towns and cities across NZ In summary, the GNS percentages show very few areas are expected
to have earthquakes of strength MM10 or MM11. While there is a much higher probability of an MM8 earthquake across the country, an event of that size is not expected to cause any deaths and only a small amount
of damage. (Probabilities are shown as additive for presentation purposes).
33
0.000%
0.003%
0.000%
0.000%
0.000%
0.000%
0.000%
0.000%
0.011%
0.000%0.000%
0.005%
0.001%
0.000%
0.000%
0.000%0.000%
0.001%
0.000%
0.002%
0.003%
0.000%
0.000%
0.000%
0.000%
0.000%
0.003%
0.000%
0.000%
0.012%
0.002%
0.000%0.000%
0.200%
0.400%
0.600%
0.800%
1.000%
1.200%
1.400%
1.600%
30 Main Cities and Towns ‐ Additive Annual Earthquake probabilities for MM8 to MM11 (data label for MM11)
MM11
MM10
MM9
MM8
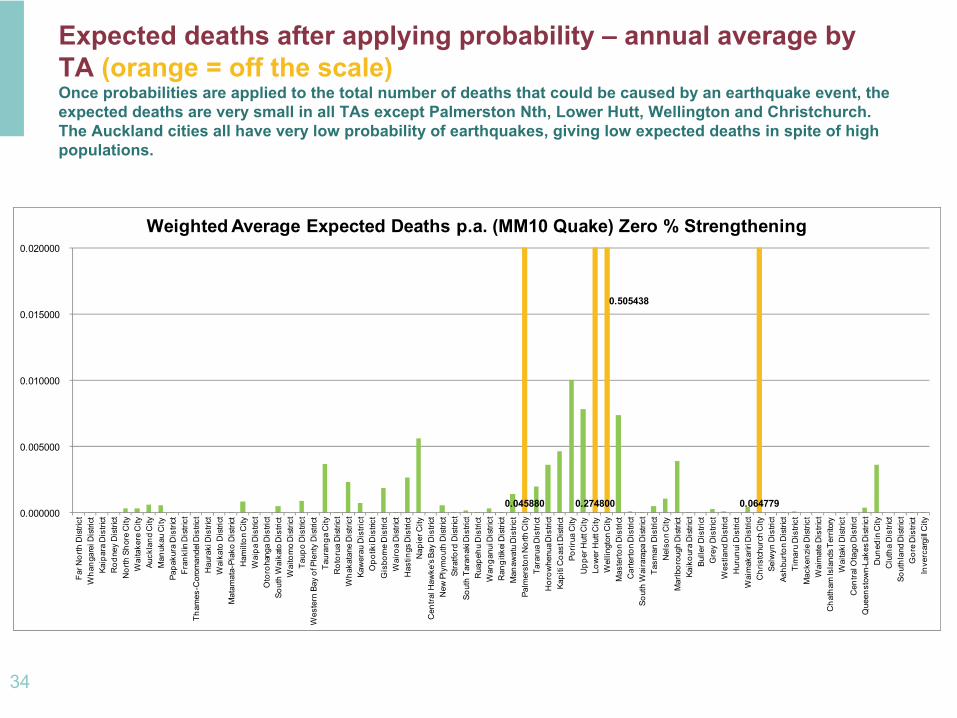
Expected deaths after applying probability –
annual average by TA (orange = off the scale)
Once probabilities are applied to the total number of deaths that could be caused by an earthquake event, the expected deaths are very small in all TAs except Palmerston Nth,
Lower Hutt, Wellington and Christchurch. The Auckland cities all have very low probability of earthquakes, giving low expected deaths in spite of high populations.
0.045880 0.274800 0.064779 0.000000
0.005000
0.010000
0.015000
0.020000
Far N
orth
Dis
trict
Wha
ngar
ei D
istri
ctKa
ipar
a D
istri
ctR
odne
y D
istri
ctN
orth
Sho
re C
ityW
aita
kere
City
Auck
land
City
Man
ukau
City
Papa
kura
Dis
trict
Fran
klin
Dis
trict
Tham
es-C
orom
ande
l Dis
trict
Hau
raki
Dis
trict
Wai
kato
Dis
trict
Mat
amat
a-Pi
ako
Dis
trict
Ham
ilton
City
Wai
pa D
istri
ctO
toro
hang
a D
istri
ctSo
uth
Wai
kato
Dis
trict
Wai
tom
o D
istri
ctTa
upo
Dis
trict
Wes
tern
Bay
of P
lent
y D
istri
ctTa
uran
ga C
ityR
otor
ua D
istri
ctW
haka
tane
Dis
trict
Kaw
erau
Dis
trict
Opo
tiki D
istri
ctG
isbo
rne
Dis
trict
Wai
roa
Dis
trict
Has
tings
Dis
trict
Nap
ier C
ityC
entra
l Haw
ke's
Bay
Dis
trict
New
Ply
mou
th D
istri
ctSt
ratfo
rd D
istri
ctSo
uth
Tara
naki
Dis
trict
Rua
pehu
Dis
trict
Wan
ganu
i Dis
trict
Ran
gitik
ei D
istri
ctM
anaw
atu
Dis
trict
Palm
erst
on N
orth
City
Tara
rua
Dis
trict
Hor
owhe
nua D
istri
ctKa
piti
Coa
st D
istri
ctPo
rirua
City
Upp
er H
utt C
ityLo
wer
Hut
t City
Wel
lingt
on C
ityM
aste
rton
Dis
trict
Car
terto
n D
istri
ctSo
uth
Wai
rara
pa D
istri
ctTa
sman
Dis
trict
Nel
son
City
Mar
lbor
ough
Dis
trict
Kaik
oura
Dis
trict
Bulle
r Dis
trict
Gre
y D
istri
ctW
estla
nd D
istri
ctH
urun
ui D
istri
ctW
aim
akar
iri D
istri
ctC
hris
tchu
rch
City
Selw
yn D
istri
ctAs
hbur
ton
Dis
trict
Tim
aru
Dis
trict
Mac
kenz
ie D
istri
ctW
aim
ate
Dis
trict
Cha
tham
Isla
nds T
errit
ory
Wai
taki
Dis
trict
Cen
tral O
tago
Dis
trict
Que
enst
own-
Lake
s Dis
trict
Dun
edin
City
Clu
tha
Dis
trict
Sout
hlan
d D
istri
ctG
ore
Dis
trict
Inve
rcar
gill C
ity
Weighted Average Expected Deaths p.a. (MM10 Quake) Zero % Strengthening
0.505438
34
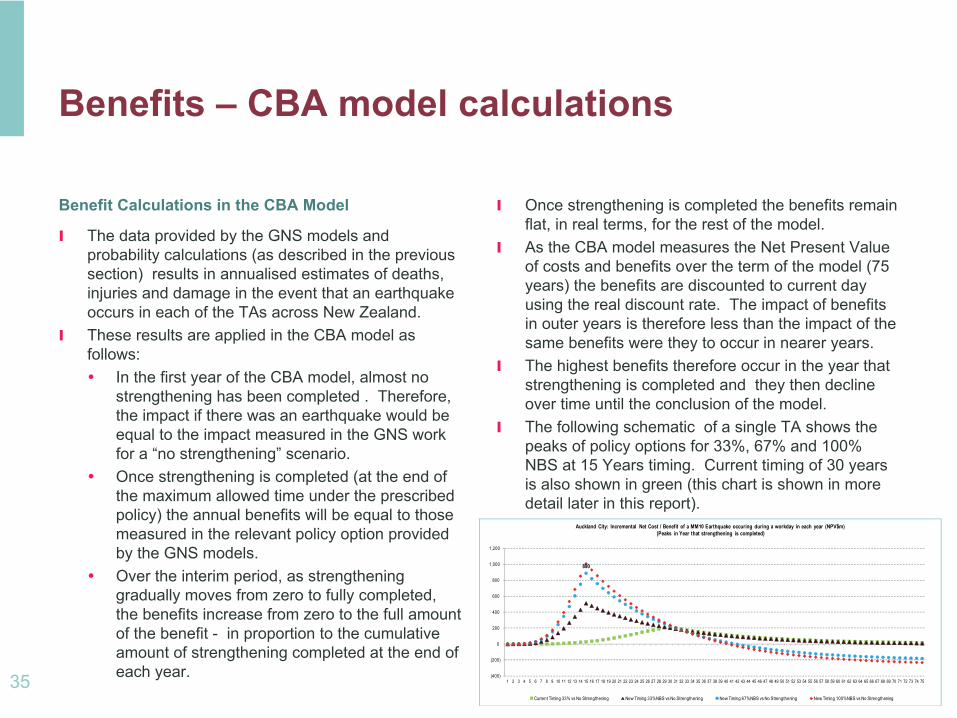
Benefits –
CBA model calculations
Benefit Calculations in the CBA Model
l
The data provided by the GNS models and probability calculations (as described in the previous section) results in annualised estimates of deaths, injuries and damage in the event that an earthquake occurs in each of the TAs across New Zealand.
l
These results are applied in the CBA model as follows:
In the first year of the CBA model, almost no strengthening has been completed . Therefore, the impact if there was an earthquake would be equal to the impact measured in the GNS work for a “no strengthening”
scenario.
Once strengthening is completed (at the end of the maximum allowed time under the prescribed policy) the annual benefits will be equal to those measured in the relevant policy option provided by the GNS models.
Over the interim period, as strengthening gradually moves from zero to fully completed, the benefits increase from zero to the full amount of the benefit -
in proportion to the cumulative amount of strengthening completed at the end of each year.
l
Once strengthening is completed the benefits remain flat, in real terms, for the rest of the model.
l
As the CBA model measures the Net Present Value of costs and benefits over the term of the model (75 years) the benefits are discounted to current day using the real discount rate. The impact of benefits in outer years is therefore less than the impact of the same benefits were they to occur in nearer years.
l
The highest benefits therefore occur in the year that strengthening is completed and they then decline over time until the conclusion of the model.
l
The following schematic of a single TA shows the peaks of policy options for 33%, 67% and 100% NBS at 15 Years timing. Current timing of 30 years is also shown in green (this chart is shown in more detail later in this report).
35
890
(400)
(200)
0
200
400
600
800
1,000
1,200
1 2 3 4 5 6 7 8 9 10 11 12 13 14 15 16 17 18 19 20 21 22 23 24 25 26 27 28 29 30 31 32 33 34 35 36 37 38 39 40 41 42 43 44 45 46 47 48 49 50 51 52 53 54 55 56 57 58 59 60 61 62 63 64 65 66 67 68 69 70 71 72 73 74 75
Auckland City: Incremental Net Cost / Benefit of a MM10 Earthquake occuring during a workday in each year (NPV$m)(Peaks in Year that strengthening is completed)
Current Timing 33% vs No Strengthening New Timing 33%NBS vs No Strengthening New Timing 67%NBS vs No Strengthening New Timing 100%NBS vs No Strengthening
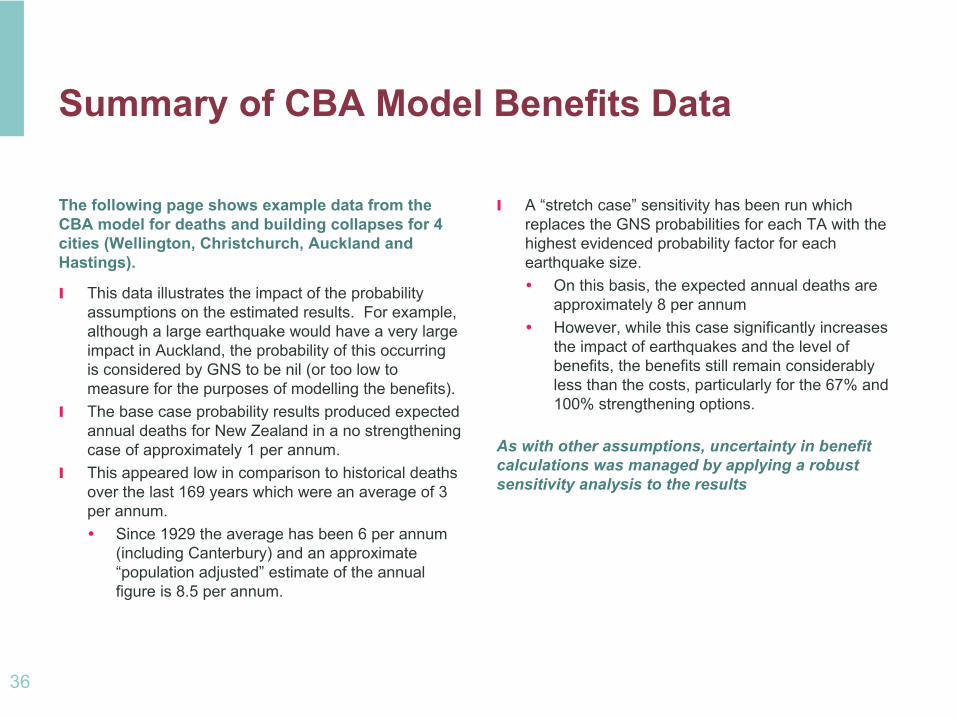
Summary of CBA Model Benefits Data
The following page shows example data from the CBA model for deaths and building collapses for 4 cities (Wellington, Christchurch, Auckland and Hastings).
l
This data illustrates the impact of the probability assumptions on the estimated results. For example, although a large earthquake would have a very large impact in Auckland, the probability of this occurring is considered by GNS to be nil (or too low to measure for the purposes of modelling the benefits).
l
The base case probability results produced expected annual deaths for New Zealand in a no strengthening case of approximately 1 per annum.
l
This appeared low in comparison to historical deaths over the last 169 years which were an average of 3 per annum.
Since 1929 the average has been 6 per annum (including Canterbury) and an approximate “population adjusted”
estimate of the annual figure is 8.5 per annum.
l
A “stretch case”
sensitivity has been run which replaces the GNS probabilities for each TA with the highest evidenced probability factor for each earthquake size.
On this basis, the expected annual deaths are approximately 8 per annum
However, while this case significantly increases the impact of earthquakes and the level of benefits, the benefits still remain considerably less than the costs, particularly for the 67% and 100% strengthening options.
As with other assumptions, uncertainty in benefit calculations was managed by applying a robust sensitivity analysis to the results
36
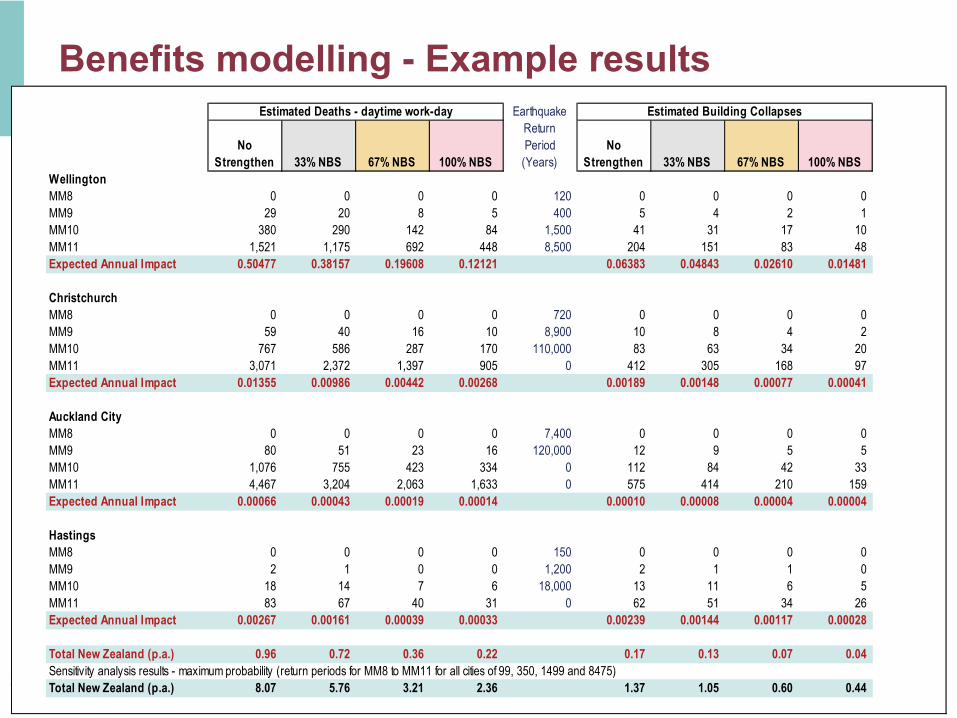
Benefits modelling -
Example results
37
Earthquake
No Strengthen 33% NBS 67% NBS 100% NBS
ReturnPeriod
(Years)No
Strengthen 33% NBS 67% NBS 100% NBSWellingtonMM8 0 0 0 0 120 0 0 0 0 MM9 29 20 8 5 400 5 4 2 1 MM10 380 290 142 84 1,500 41 31 17 10 MM11 1,521 1,175 692 448 8,500 204 151 83 48 Expected Annual Impact 0.50477 0.38157 0.19608 0.12121 0.06383 0.04843 0.02610 0.01481
ChristchurchMM8 0 0 0 0 720 0 0 0 0 MM9 59 40 16 10 8,900 10 8 4 2 MM10 767 586 287 170 110,000 83 63 34 20 MM11 3,071 2,372 1,397 905 0 412 305 168 97 Expected Annual Impact 0.01355 0.00986 0.00442 0.00268 0.00189 0.00148 0.00077 0.00041
Auckland CityMM8 0 0 0 0 7,400 0 0 0 0 MM9 80 51 23 16 120,000 12 9 5 5 MM10 1,076 755 423 334 0 112 84 42 33 MM11 4,467 3,204 2,063 1,633 0 575 414 210 159 Expected Annual Impact 0.00066 0.00043 0.00019 0.00014 0.00010 0.00008 0.00004 0.00004
HastingsMM8 0 0 0 0 150 0 0 0 0 MM9 2 1 0 0 1,200 2 1 1 0 MM10 18 14 7 6 18,000 13 11 6 5 MM11 83 67 40 31 0 62 51 34 26 Expected Annual Impact 0.00267 0.00161 0.00039 0.00033 0.00239 0.00144 0.00117 0.00028
Total New Zealand (p.a.) 0.96 0.72 0.36 0.22 0.17 0.13 0.07 0.04 Sensitivity analysis results - maximum probability (return periods for MM8 to MM11 for all cities of 99, 350, 1499 and 8475)Total New Zealand (p.a.) 8.07 5.76 3.21 2.36 1.37 1.05 0.60 0.44
Estimated Deaths - daytime work-day Estimated Building Collapses

Benefits modelling –
results assuming 15 year strengthening timetable
38
33% New Timing vs
Current Policy
67% New Timing vs
Current Policy
100% New Timing vs
Current PolicyBenefits from MM8 earthquakes $3m $13m $25m Benefits from MM9 earthquakes $2m $9m $18m Benefits from MM10 earthquakes $1m $6m $10m Benefits from MM11 earthquakes $0m $2m $3m Total Benefits all earthquakes $6m $30m $56m
Total benefits for New Zealand and contribution from each earthquake band for MM8 to MM11
$6m
$30m
$56m
$0m
$10m
$20m
$30m
$40m
$50m
$60m
$70m
33% New Timing vs Current Policy
67% New Timing vs Current Policy
100% New Timing vs Current Policy
Benefits by Earthquake size MM8 to MM11
Benefits from MM11 earthquakes
Benefits from MM10 earthquakes
Benefits from MM9 earthquakes
Benefits from MM8 earthquakes
Much greater benefits are realised from lower intensity earthquakes because, even though they cause less damage and deaths, they have a much higher probability of occurring.
COST / BENEFIT RESULTSCBA Model
39
Cost / Benefit Calculations in the CBA Model
Calculation of net cost/benefit results in the CBA Model
l
The final step in the CBA model calculations is to combine the annual costs and benefits and to calculate the Net Present Value of the expected results for the 75 years of the model.
l
The following table sets out the total costs and benefits for the base case, assuming a 15 year maximum timeframe for strengthening. It also shows net costs and benefits assuming 10 year and 5 year maximums.
40
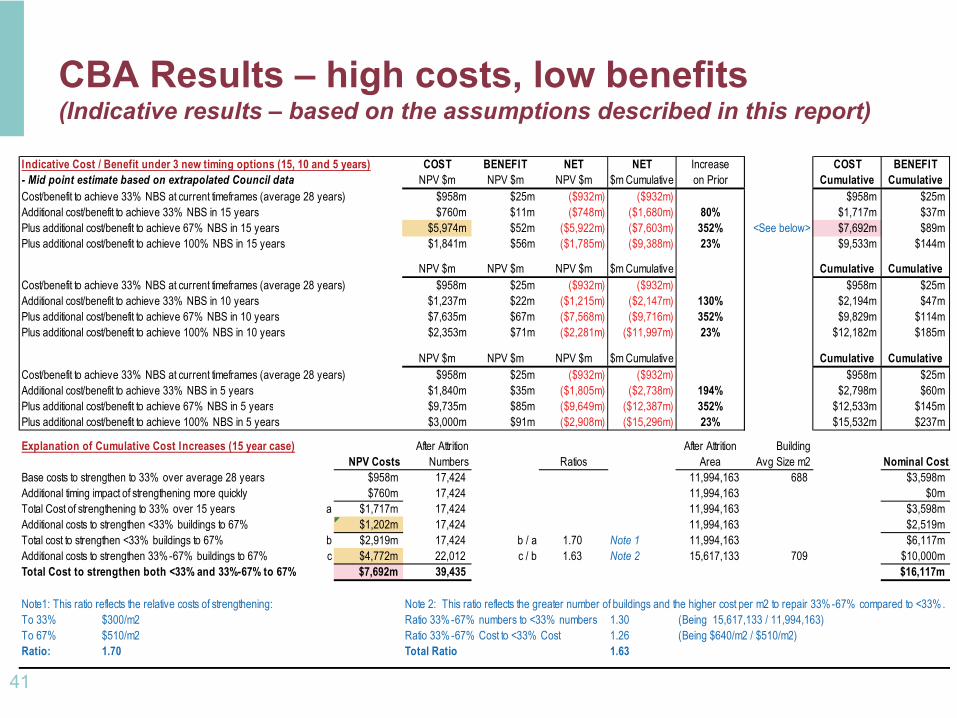
CBA Results –
high costs, low benefits (Indicative results –
based on the assumptions described in this report)
41
Indicative Cost / Benefit under 3 new timing options (15, 10 and 5 years) COST BENEFIT NET NET Increase COST BENEFIT- Mid point estimate based on extrapolated Council data NPV $m NPV $m NPV $m $m Cumulative on Prior Cumulative CumulativeCost/benefit to achieve 33% NBS at current timeframes (average 28 years) $958m $25m ($932m) ($932m) $958m $25m Additional cost/benefit to achieve 33% NBS in 15 years $760m $11m ($748m) ($1,680m) 80% $1,717m $37m Plus additional cost/benefit to achieve 67% NBS in 15 years $5,974m $52m ($5,922m) ($7,603m) 352% <See below> $7,692m $89m Plus additional cost/benefit to achieve 100% NBS in 15 years $1,841m $56m ($1,785m) ($9,388m) 23% $9,533m $144m
NPV $m NPV $m NPV $m $m Cumulative Cumulative CumulativeCost/benefit to achieve 33% NBS at current timeframes (average 28 years) $958m $25m ($932m) ($932m) $958m $25m Additional cost/benefit to achieve 33% NBS in 10 years $1,237m $22m ($1,215m) ($2,147m) 130% $2,194m $47m Plus additional cost/benefit to achieve 67% NBS in 10 years $7,635m $67m ($7,568m) ($9,716m) 352% $9,829m $114m Plus additional cost/benefit to achieve 100% NBS in 10 years $2,353m $71m ($2,281m) ($11,997m) 23% $12,182m $185m
NPV $m NPV $m NPV $m $m Cumulative Cumulative CumulativeCost/benefit to achieve 33% NBS at current timeframes (average 28 years) $958m $25m ($932m) ($932m) $958m $25m Additional cost/benefit to achieve 33% NBS in 5 years $1,840m $35m ($1,805m) ($2,738m) 194% $2,798m $60m Plus additional cost/benefit to achieve 67% NBS in 5 years $9,735m $85m ($9,649m) ($12,387m) 352% $12,533m $145m Plus additional cost/benefit to achieve 100% NBS in 5 years $3,000m $91m ($2,908m) ($15,296m) 23% $15,532m $237m
Explanation of Cumulative Cost Increases (15 year case) After Attrition After Attrition BuildingNPV Costs Numbers Ratios Area Avg Size m2 Nominal Cost
Base costs to strengthen to 33% over average 28 years $958m 17,424 11,994,163 688 $3,598m Additional timing impact of strengthening more quickly $760m 17,424 11,994,163 $0m Total Cost of strengthening to 33% over 15 years a $1,717m 17,424 11,994,163 $3,598m Additional costs to strengthen <33% buildings to 67% $1,202m 17,424 11,994,163 $2,519m Total cost to strengthen <33% buildings to 67% b $2,919m 17,424 b / a 1.70 Note 1 11,994,163 $6,117m Additional costs to strengthen 33%-67% buildings to 67% c $4,772m 22,012 c / b 1.63 Note 2 15,617,133 709 $10,000m Total Cost to strengthen both <33% and 33%-67% to 67% $7,692m 39,435 $16,117m
Note1: This ratio reflects the relative costs of strengthening: Note 2: This ratio reflects the greater number of buildings and the higher cost per m2 to repair 33%-67% compared to <33%.To 33% $300/m2 Ratio 33%-67% numbers to <33% numbers 1.30 (Being 15,617,133 / 11,994,163)To 67% $510/m2 Ratio 33%-67% Cost to <33% Cost 1.26 (Being $640/m2 / $510/m2)Ratio: 1.70 Total Ratio 1.63
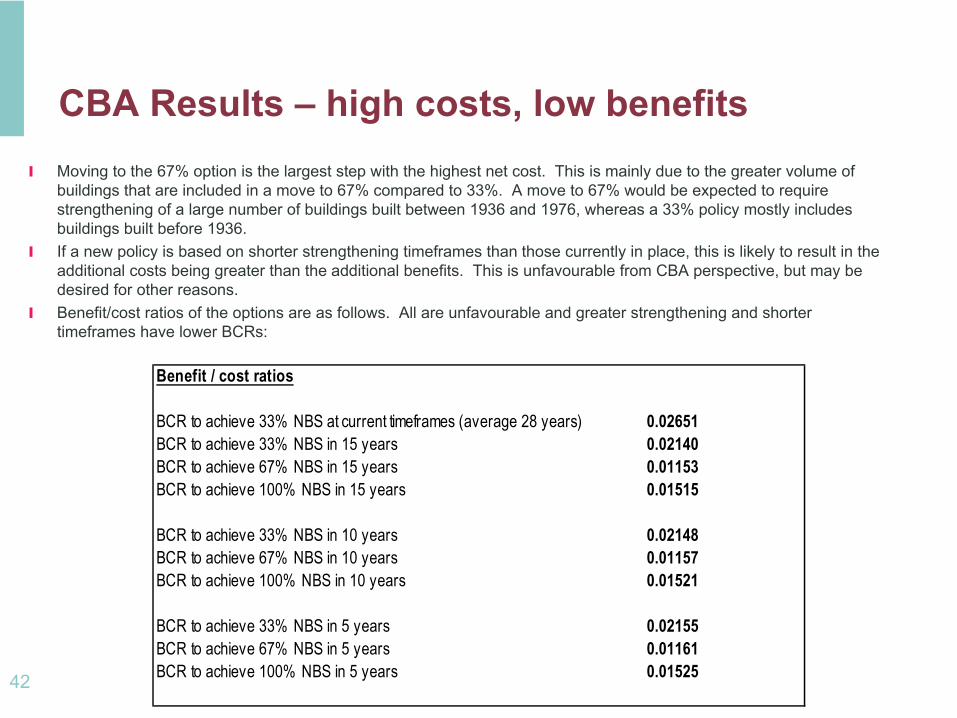
CBA Results –
high costs, low benefits
42
l
Moving to the 67% option is the largest step with the highest net cost. This is mainly due to the greater volume of buildings that are included in a move to 67% compared to 33%. A
move to 67% would be expected to require strengthening of a large number of buildings built between 1936 and 1976, whereas a 33% policy mostly includes buildings built before 1936.
l
If a new policy is based on shorter strengthening timeframes than those currently in place, this is likely to result in the additional costs being greater than the additional benefits. This is unfavourable from CBA perspective, but may be desired for other reasons.
l
Benefit/cost ratios of the options are as follows. All are unfavourable and greater strengthening and shorter timeframes have lower BCRs:
Benefit / cost ratios
BCR to achieve 33% NBS at current timeframes (average 28 years) 0.02651 BCR to achieve 33% NBS in 15 years 0.02140 BCR to achieve 67% NBS in 15 years 0.01153 BCR to achieve 100% NBS in 15 years 0.01515
BCR to achieve 33% NBS in 10 years 0.02148 BCR to achieve 67% NBS in 10 years 0.01157 BCR to achieve 100% NBS in 10 years 0.01521
BCR to achieve 33% NBS in 5 years 0.02155 BCR to achieve 67% NBS in 5 years 0.01161 BCR to achieve 100% NBS in 5 years 0.01525
43
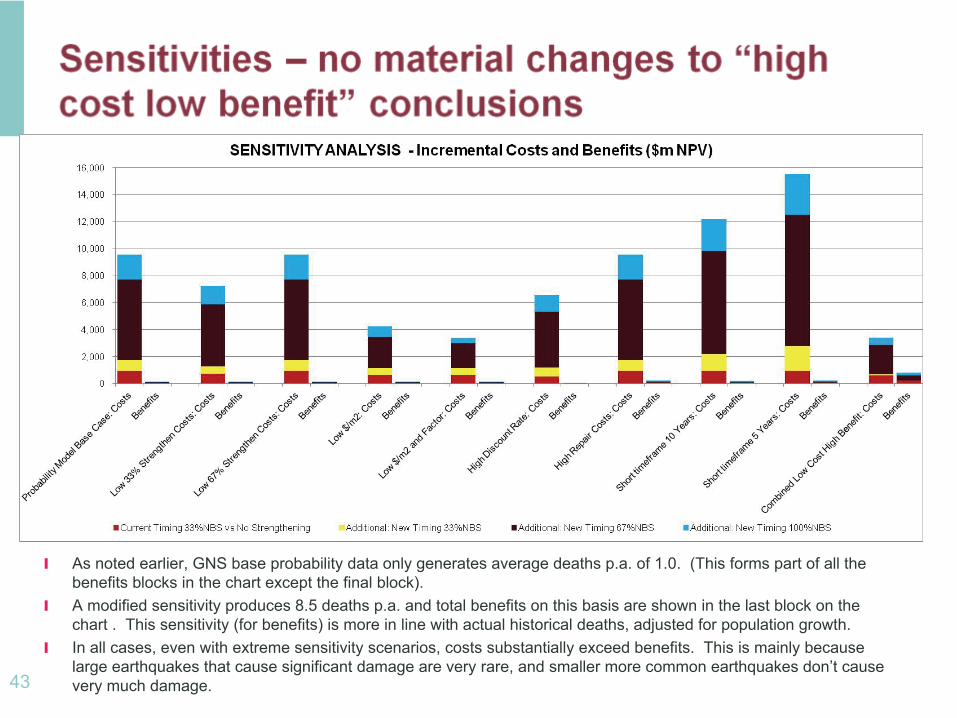
l
As noted earlier, GNS base probability data only generates average deaths p.a. of 1.0. (This forms part of all the benefits blocks in the chart except the final block).
l
A modified sensitivity produces 8.5 deaths p.a. and total benefits on this basis are shown in the last block on the chart . This sensitivity (for benefits) is more in line with actual historical deaths, adjusted for population growth.
l
In all cases, even with extreme sensitivity scenarios, costs substantially exceed benefits. This is mainly because large earthquakes that cause significant damage are very rare, and smaller more common earthquakes don’t cause very much damage.
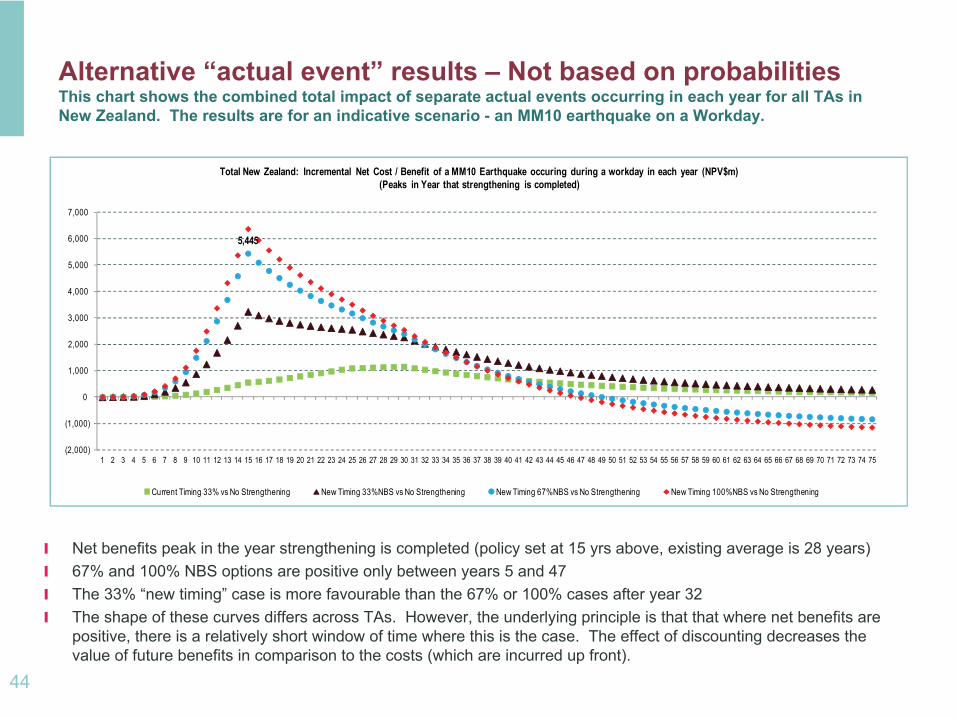
Alternative “actual event”
results –
Not based on probabilities This chart shows the combined total impact of separate actual events occurring in each year for all TAs in
New Zealand. The results are for an indicative scenario -
an MM10 earthquake on a Workday.
5,445
(2,000)
(1,000)
0
1,000
2,000
3,000
4,000
5,000
6,000
7,000
1 2 3 4 5 6 7 8 9 10 11 12 13 14 15 16 17 18 19 20 21 22 23 24 25 26 27 28 29 30 31 32 33 34 35 36 37 38 39 40 41 42 43 44 45 46 47 48 49 50 51 52 53 54 55 56 57 58 59 60 61 62 63 64 65 66 67 68 69 70 71 72 73 74 75
Total New Zealand: Incremental Net Cost / Benefit of a MM10 Earthquake occuring during a workday in each year (NPV$m)(Peaks in Year that strengthening is completed)
Current Timing 33% vs No Strengthening New Timing 33%NBS vs No Strengthening New Timing 67%NBS vs No Strengthening New Timing 100%NBS vs No Strengthening
44
l
Net benefits peak in the year strengthening is completed (policy
set at 15 yrs above, existing average is 28 years)l
67% and 100% NBS options are positive only between years 5 and 47l
The 33% “new timing”
case is more favourable than the 67% or 100% cases after year 32l
The shape of these curves differs across TAs. However, the underlying principle is that that where net benefits are positive, there is a relatively short window of time where this is the case. The effect of discounting decreases the value of future benefits in comparison to the costs (which are incurred up front).
Conclusions of CBA modelling
There are significant data limitations ...
l
The TAs currently have very poor records of both their total building stock and in particular the number of earthquake prone or earthquake risk buildings.
l
Based on survey returns, Wellington City is the only TA where reasonable data on %NBS of buildings has been collected to date. However, even in Wellington the process is only partially completed.
l
The costs of strengthening buildings is difficult to estimate on a general “all of New Zealand”
basis. This is because of the wide range of building types that need to be strengthened and the limited amount of data that is publically
available on costs of completed work.
l
There is currently no New Zealand-wide model that measures the impact of earthquakes, although GNS is in the process of expanding RiskScape
. The CBA model has had to be constructed using available data from the limited modelling work already undertaken by GNS.
... But calculations are possible -
and sensitivity analysis provides comfort around conclusions
l
On a probability
basis, costs are well in excess of benefits
l
Even under extreme sensitivities, this relationship does not change
l
On an actual event basis, there is only a small time window where higher strengthening options show net benefits. This window will shrink and may disappear if higher assumptions were used for building stock numbers.
l
The CBA alone does not support higher levels of strengthening -
or shorter timeframes.
The CBA model base case has been developed on a conservative basis to provide increased robustness over the model outputs and greater comfort over the conclusions above.
45