Embed Size (px)
Citation preview
Gergócs et al.: Indication strength of coenological similarity patterns based on genus-level taxon lists - 63 -
APPLIED ECOLOGY AND ENVIRONMENTAL RESEARCH 8(1): 63-76. http://www.ecology.uni-corvinus.hu ● ISSN 1589 1623 (Print) ● ISSN 1785 0037 (Online)
2010, ALÖKI Kft., Budapest, Hungary
INDICATION STRENGTH OF COENOLOGICAL SIMILARITY
PATTERNS BASED ON GENUS-LEVEL TAXON LISTS
GERGÓCS, V.1 – GARAMVÖLGYI, Á.2 – HUFNAGEL, L.3*
1Department of Plant Taxonomy and Ecology, Eötvös Loránd University, Faculty of Science
H-1117 Budapest, Pázmány Péter sétány 1/C, Hungary
(phone: +36-1-381-2187; fax: +36-1-381-2188)
2Department of Mathematics and Informatics, Corvinus University of Budapest, Faculty of
Horticulture, H-1118 Budapest, Villányi út 29-43., Hungary
(phone: +36-1-482-6261; fax: +36-1-466-9273)
3„Adaptation to Climate Change” Research Group of the Hungarian Academy of Sciences
H-1118 Budapest, Villányi út 29-43., Hungary
(phone: +36-1-482-6261; fax: +36-1-466-9273)
*Corresponding author
e-mail: [email protected]
(Received 23rd January 2010; accepted 28th April 2010)
Abstract. Several methods and indicators can be used to evaluate the coenological state of a given habitat, the ones which can be created simply, quickly, standardizably and reliably can be of outstanding practical importance in environmental biology. One possible method is listing the genera which can be found in a given habitat in great abundance and have little number of species and various ecological characteristics. For this purpose one of the most appropriate groups is that of ground-dwelling oribatid mites. In our research the indication strength of genus-level taxon lists and the effects of the main pattern-generating factors creating similarity patterns were analysed with the help of data series on oribatid mites collected by us and originating from literature. Our aim was to develop a method with the help of which the difference expressed with distance functions between two oribatid mite genus lists originating from any sources can correspond to spatial and temporal scales. With the help of this base of comparison changes in disturbed or transformed habitats can be expressed by means of oribatid mite communities, with spatial and temporal distances. Keywords: oribatid mite, genus list, family list, distance function, indication, pattern generation
Introduction
Nowadays there are several methods to describe the natural state of a habitat; the focus is mainly on the measuring of biodiversity. However, uncertainty can arise when measuring biodiversity, as several questions can be raised already as to the explanation of the term, starting from which level it should be considered on (genetic, taxon, ecological diversity), to – if the taxon level has been chosen – the decision on which taxon the focus should be.
The main goal of this study is to set up a comparison scale based on genus-level presence-absence lists of oribatid mite communities (Acari: Oribatida) of habitats examined on different spatial and temporal scales. The secondary goal – and this time the precondition as well – is to get a reliable picture of the indication strength of the distances to be used, i.e. the information content included.
The indication suitability of the order of oribatid mites for describing the state of their habitat is justified by the special characteristics of the group. Oribatid mites can be
Gergócs et al.: Indication strength of coenological similarity patterns based on genus-level taxon lists - 64 -
APPLIED ECOLOGY AND ENVIRONMENTAL RESEARCH 8(1): 63-76. http://www.ecology.uni-corvinus.hu ● ISSN 1589 1623 (Print) ● ISSN 1785 0037 (Online)
2010, ALÖKI Kft., Budapest, Hungary
found in almost all kinds of habitats: on land and in water; first of all in soil layers containing organic matter as well, however, they have penetrated into different other microhabitats, too (e.g. lichens, moss, bark etc.), which is mainly due to their indeed various food sources (e.g. organic debris, fungi, other mites etc.). Besides the diversity of habitats, their high adaptation ability is shown by their enormous abundance and species richness as well. The above characteristics can be mainly used in the case of coenological methods (Lebrun and van Straalen, 1995; Behan-Pelletier, 1999; Gulvik, 2007; Gergócs and Hufnagel, 2009).
The choice of the genus level can be explained by different aspects. In the analysis by Caruso and Migliorini (2006) it was shown that there were not any significant changes in data examining anthropogenic disturbance on oribatid mites when switching from species level to genus level. Our study has a similar goal as we would like to show potential habitat changes with our method. Podani (1989) had a similar observation in case of plants, according to which switching to genus level does not mean a significant change when comparing the examined habitats. Osler and Beattie (1999) carried out a meta-analysis similar to ours, which confirmed their expectation that taxonomic levels above species are more suitable for comparing habitats. This research showed further that habitats can be chosen on family level in case of oribatid mites, therefore our study covers besides the genus level the family level as well. There were also some other arguments for our decision, namely that the number of databases used could be considerably extended in this way, in addition, taxonomical processing became faster and more reliable in our field studies as well. Genus-level identification of oribatid mites is solved on the basis of the work by Balogh and Balogh (1992) on a global scale, too. However, species-level identification is only possible in case of some zoogeographical regions and only some taxa on a global scale as the related literature is not properly synthesized yet (e.g. Balogh and Mahunka, 1983; Olsanowski, 1996). Main goals
By setting up the spatial and temporal scales, we expected that the order based on the genus lists and the family lists developed from them later should correspond to the real spatial and temporal scales, i.e. the farther and qualitatively the more different habitats our lists originate from, the greater difference there should be among similarities inside the given categories. However, if data originate from the same site, the difference among the examined samples should be greater in case of the lists which are farther in time from each other.
The main goals of the present study are the following: 1. Revealing the effect of the taxon level on data series based on species-, genus- and family-level lists. 2. Developing a spatial and temporal scales reference based on the genus- and family-level taxon lists with the help of similarity functions. 3. Examining the degree of distances in the similarity order used for indication.
Review of literature – suitability of oribatid mites as indicators
Research into oribatid mites goes back to the 1880s, the work of A. Berlese, who invented the Berlese funnel and made it possible to extract and examine soil mesofauna more precisely. His lifework was carried on by several renowned taxonomists, such as Grandjean, Hammer, Beck, Aoki, Wallwork, Engelbrecht, Corpus-Raros, Lee, Pérez-
Gergócs et al.: Indication strength of coenological similarity patterns based on genus-level taxon lists - 65 -
APPLIED ECOLOGY AND ENVIRONMENTAL RESEARCH 8(1): 63-76. http://www.ecology.uni-corvinus.hu ● ISSN 1589 1623 (Print) ● ISSN 1785 0037 (Online)
2010, ALÖKI Kft., Budapest, Hungary
Inigo, Baggio, Bhattacharia and Haq (Balogh et al., 2008) with taxonomical descriptions of oribatid mites covering the bigger part of terrestrial habitats. Due to the above researches, nowadays it has become possible to examine oribatid mites from different indication aspects on community level.
One part of the studies on indication possibilities compares natural habitats. In these studies the goal is to reveal spatial and temporal pattern generation characteristics of habitats. Temporal change is examined in few studies (e.g. Irmler, 2006) and in case of spatial examinations different approaches are used: on substrate level (e.g. Fagan et al., 2006; Lindo and Winchster, 2006), examining altitudinal zonation of mountains (e.g. Migliorini and Bernini, 1999; Reynolds et al., 2003; Jing et al., 2005) and only seldom on the level of habitat types (e.g. Balogh et al., 2008). These studies do not always yield consistent results, however, the examinations prove that patterns exist.
Materials and methods
Examination of the suitability of the genus level
Our analysis related to the notion that the genus level does not mean great data loss compared to the species level was carried out based on the databases by Marie Hammer. The work of Hammer was chosen due to the homogeneity and very extensive geographical cover of the databases. The series originate from two different sites of six different countries accordingly (Hammer, 1952, 1958, 1961, 1962, 1966, 1972). Besides the species and genus level the family level was analyzed as well, according to the taxonomical classification in the work by Balogh and Balogh (1992).
Categories of the genus lists
In order to be able to determine to which spatial and temporal distance the oribatid mite genus lists of two samples/sites examined by us correspond, different categories had to be defined. The categories were set up considering which combination of the given spatial and temporal scales the examined genus list pairs originate from. Regarding the time (Ti), we differentiated between 0, 2, 12, 24 and 52 weeks and due to a study (Melamud et al., 2006) we were able to consider six years i.e. 312 weeks, too. In space the smallest distinguishable unit was the different substrate (S), then the different types of habitats/sites (H), the different topographicums (T) follow, and finally the largest unit was the zoogeographic kingdom (K). Substrate is the lowest vegetation level such as soil, förna, leaf litter, moss, bark etc. Site means habitat types such as rainforest, mossy forest, páramo etc. Topographicum is practically a country such as Papua New Guinea or Chile. When differentiating between zoogeographic kingdoms, six kingdoms found in the work by Balogh and Balogh (1992) were considered: Holarktis, Neotropis, Aethiopis, Orientalis, Australis (there Notogea) and Archinotis (there Antarctis), which is the modified version of Müller’s system (1980). Sources of the genus lists
Genus lists of the different categories were collected from various sources. The first category means the similarity between genus lists of samples collected from the same zoogeographic kingdom (SaK), the same topographicum (SaT), the same type of site (SaH), the same substrate (SaS) and at the same time (Ti-0) (SaK/SaT/SaH/SaS/Ti-0). One part of these genus lists was obtained from our own research. From the soil of a dry
Gergócs et al.: Indication strength of coenological similarity patterns based on genus-level taxon lists - 66 -
APPLIED ECOLOGY AND ENVIRONMENTAL RESEARCH 8(1): 63-76. http://www.ecology.uni-corvinus.hu ● ISSN 1589 1623 (Print) ● ISSN 1785 0037 (Online)
2010, ALÖKI Kft., Budapest, Hungary
oak forest in Törökbálint (Hungary), 9×300 cm3 förna sample was collected and the mesofauna was extracted from it, the oribatid mites were sorted out and identified to genus level according to the works by Balogh (1965); Balogh and Balogh (1972, 1992); Balogh and Mahunka (1980, 1983) and Olsanowski (1996). Further data for this category were collected by studying the scientific legacy of the late János Balogh, member of the Hungarian Academy of Sciences.
Data for the following four categories were also collected from our research. Samples were collected in 2005 and 2006 in a given quadrat of 100 m2 in a dry oak forest in Törökbálint, Hungary (N 47°25’38” E 18°54’16”) and they were surveyed every two weeks. Every time samples were obtained from three types of substrates: from 500 cm3 leaf litter, 300 cm3 förna (from under the leaf litter) and 0.5 dm2 hypnum moss (Hypnum cupressiforme) living on tree trunks. Oribatid mites were extracted with the help of a Berlese-Tullgren funnel (Coleman et al., 2004) and identified on genus level. This examination made it possible to set up categories on pattern levels meaning a distance of two, 12, 24 and 52 weeks, in which substrate (S), site (H), topographicum (T) and zoogeographic kingdom (K) were the same (Sa). Abbreviations of these categories are: SaK/SaT/SaH/SaS/Ti-2, SaK/SaT/SaH/SaS/Ti-12, SaK/SaT/SaH/SaS/Ti-24 and SaK/SaT/SaH/SaS/Ti-52. A study by Melamud et al. (2007) was implied as well, in which samples were collected at different altitudes of Mount Carmel in Israel from the same sites with a difference of six years (312 weeks) (SaK/SaT/SaH/SaS/Ti-312).
Regarding spatial differences, the smallest change in scale is the difference in the substrate: SaK/SaT/SaH/DS/Ti-0, i.e. the substrate is different (D), however, there is no change in time (Ti-0). Genus lists belonging to this category originate from our own database and the above mentioned manuscripts by Balogh. Databases of three further studies were used as well (Behan-Pelletier and Winchester, 1998; Fagan et al., 2006; Lindo and Winchester, 2006).
In case of the following seven categories, only spatial scales “above” substrate change, substrate and time are not differentiated any more so they are marked “X”. Abbreviation of the same type of sites which can be found in the same zoogeographic kingdom and in the same topography is SaK/SaT/SaH/XS/Ti-X. Genus lists belonging to this category were obtained from the manuscripts by János Balogh, the study by Migliorini et al. (2005) and the studies by Hammer (1958, 1961, 1962, 1966). Abbreviation of the category of different sites is SaK/SaT/DH/XS/Ti-X. Sources of the series belonging to this category are: studies by Noti et al. (1996); Migliorini et al. (2002); Osler and Murphy (2005); Skubala and Gulvik (2005); Arroyo and Iturrondobeitia (2006); Osler et al. (2006), manuscripts by János Balogh, published series by János Balogh (Balogh et al., 2008) and studies by Hammer (1958, 1961, 1962, 1966). A series belonging here originates from samples collected by Levente Hufnagel in Australia (2006, Australia: QLD, Cairns).
In case of genus lists originating from different topographicums, we considered the point if they originate from the same (SaK/DT/SaH/XS/Ti-X) or different sites (SaK/DT/DH/XS/Ti-X) and if the two topographicums can be found in the same or different zoogeographic kingdoms (DK/DT/SaH/XS/Ti-X, DK/DT/DH/XS/Ti-X). These series come from studies by János Balogh and Marie Hammer.
In the last category only the zoogeographic kingdom can be interpreted as the complete genus lists of the six zoogeographic kingdoms were compared in it according to the work by Balogh and Balogh (1992) (DK/XT/XH/XS/Ti-X).
Gergócs et al.: Indication strength of coenological similarity patterns based on genus-level taxon lists - 67 -
APPLIED ECOLOGY AND ENVIRONMENTAL RESEARCH 8(1): 63-76. http://www.ecology.uni-corvinus.hu ● ISSN 1589 1623 (Print) ● ISSN 1785 0037 (Online)
2010, ALÖKI Kft., Budapest, Hungary
Data processing methods
The lists created from the Hammer-databases were analysed with Ochiai, Jaccard and Sørensen distance functions and non-metric ordination using the software Syn-tax 2000 (Podani, 2001).
From the other databases we did not consider all possible list combinations which fit the category, only the ones having at least nine genera. After our complete genus list database was set up, the number of genera of the two lists and the number of the common genera were determined considering the genus list pairs in each category. As we had only presence-absence data and the value “d” of the contingency table was not considered in case of the genus list pairs, the Ochiai and Jaccard functions were used as distance functions (Podani, 1997). The similarity data of each category was calculated from the means of the values of the distance functions for the genus list pairs.
As our data were not always independent within a category, it was determined with a complex method to what extent the means of the categories differ from each other. We had several distance function values within each category as we. We had 106 genus list pairs within one category on average. From among the distance function values of each category fifteen values were chosen randomly with the help of a random number generator in the Excel software. It was carried out ten times in case of each category. In this way we got 10 series containing 15 values for each category. Series of the data table containing 10×15 values in case of each of the 14 categories were now independent and since normal distribution could not be observed within each category, the data were analysed with the Kruskal-Wallis statistical test. Each of the 14 series were analysed with the Mann-Whitney post hoc test as well, so we got ten tables containing 14×14 post hoc test results. One table was made out of these ten, which shows 95% confidence interval of the appropriate values of the ten tables. Based on this we were able to decide which categories differ from each other significantly. These statistical tests were carried out using PAST software (Hammer et al., 2001).
The above analyses were carried out on family level as well.
Results and discussion
Controlling the suitability of the genus level
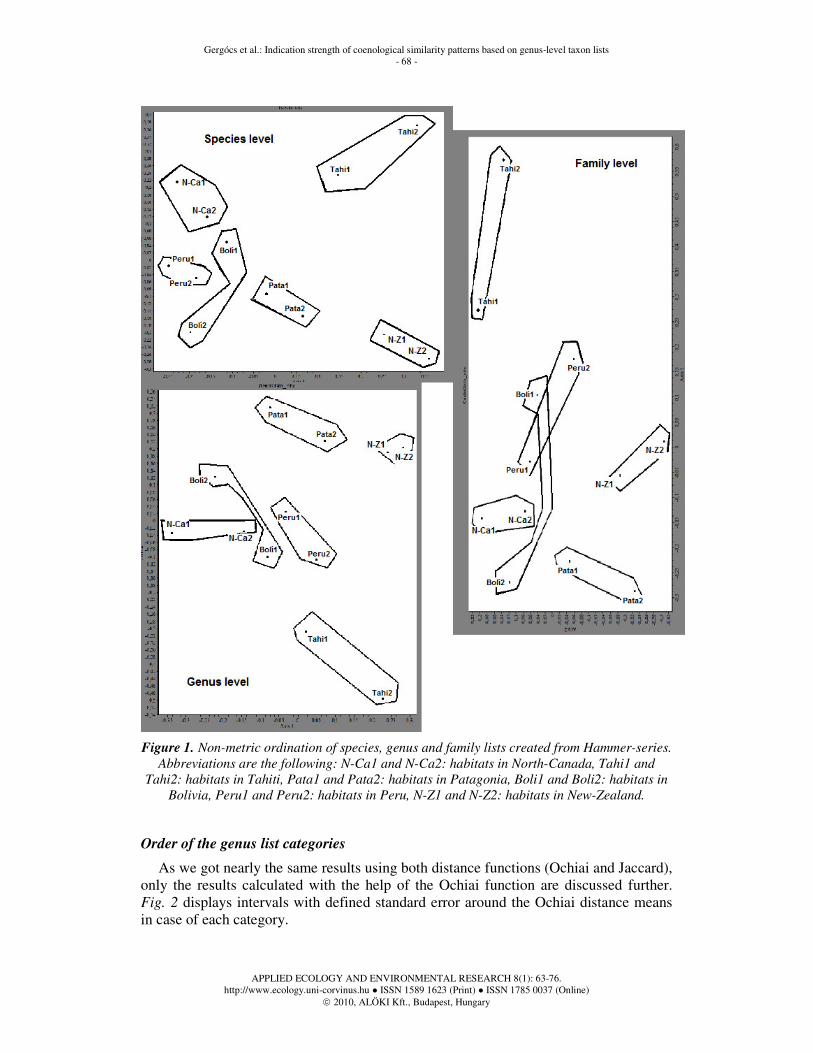
Results of the ordinations carried out for the chosen sites are displayed in Fig. 1. For our examination comparisons on genus level are sufficient as switching from species level to genus level did not cause a significant change regarding the distance and position of habitats according to the results of the ordinations. On family level inconsistency is caused by losing information. Using species-level data would be impractical due to taxonomical uncertainty on the one hand and lack of reliable databases on the other hand, and thirdly, due to unjustified increase in distance caused by genera with large number of species.
Gergócs et al.: Indication strength of coenological similarity patterns based on genus-level taxon lists - 68 -
APPLIED ECOLOGY AND ENVIRONMENTAL RESEARCH 8(1): 63-76. http://www.ecology.uni-corvinus.hu ● ISSN 1589 1623 (Print) ● ISSN 1785 0037 (Online)
2010, ALÖKI Kft., Budapest, Hungary
Figure 1. Non-metric ordination of species, genus and family lists created from Hammer-series.
Abbreviations are the following: N-Ca1 and N-Ca2: habitats in North-Canada, Tahi1 and
Tahi2: habitats in Tahiti, Pata1 and Pata2: habitats in Patagonia, Boli1 and Boli2: habitats in
Bolivia, Peru1 and Peru2: habitats in Peru, N-Z1 and N-Z2: habitats in New-Zealand.
Order of the genus list categories
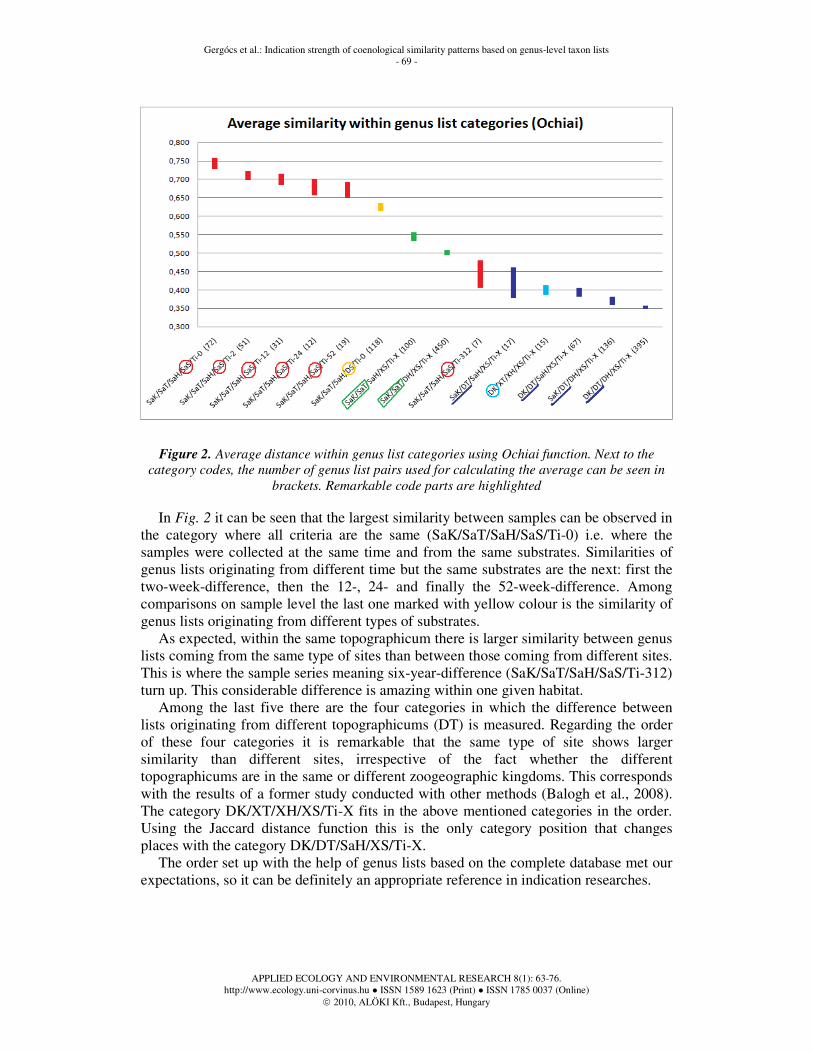
As we got nearly the same results using both distance functions (Ochiai and Jaccard), only the results calculated with the help of the Ochiai function are discussed further. Fig. 2 displays intervals with defined standard error around the Ochiai distance means in case of each category.
Gergócs et al.: Indication strength of coenological similarity patterns based on genus-level taxon lists - 69 -
APPLIED ECOLOGY AND ENVIRONMENTAL RESEARCH 8(1): 63-76. http://www.ecology.uni-corvinus.hu ● ISSN 1589 1623 (Print) ● ISSN 1785 0037 (Online)
2010, ALÖKI Kft., Budapest, Hungary
Figure 2. Average distance within genus list categories using Ochiai function. Next to the
category codes, the number of genus list pairs used for calculating the average can be seen in
brackets. Remarkable code parts are highlighted
In Fig. 2 it can be seen that the largest similarity between samples can be observed in
the category where all criteria are the same (SaK/SaT/SaH/SaS/Ti-0) i.e. where the samples were collected at the same time and from the same substrates. Similarities of genus lists originating from different time but the same substrates are the next: first the two-week-difference, then the 12-, 24- and finally the 52-week-difference. Among comparisons on sample level the last one marked with yellow colour is the similarity of genus lists originating from different types of substrates.
As expected, within the same topographicum there is larger similarity between genus lists coming from the same type of sites than between those coming from different sites. This is where the sample series meaning six-year-difference (SaK/SaT/SaH/SaS/Ti-312) turn up. This considerable difference is amazing within one given habitat.
Among the last five there are the four categories in which the difference between lists originating from different topographicums (DT) is measured. Regarding the order of these four categories it is remarkable that the same type of site shows larger similarity than different sites, irrespective of the fact whether the different topographicums are in the same or different zoogeographic kingdoms. This corresponds with the results of a former study conducted with other methods (Balogh et al., 2008). The category DK/XT/XH/XS/Ti-X fits in the above mentioned categories in the order. Using the Jaccard distance function this is the only category position that changes places with the category DK/DT/SaH/XS/Ti-X.
The order set up with the help of genus lists based on the complete database met our expectations, so it can be definitely an appropriate reference in indication researches.
Gergócs et al.: Indication strength of coenological similarity patterns based on genus-level taxon lists - 70 -
APPLIED ECOLOGY AND ENVIRONMENTAL RESEARCH 8(1): 63-76. http://www.ecology.uni-corvinus.hu ● ISSN 1589 1623 (Print) ● ISSN 1785 0037 (Online)
2010, ALÖKI Kft., Budapest, Hungary
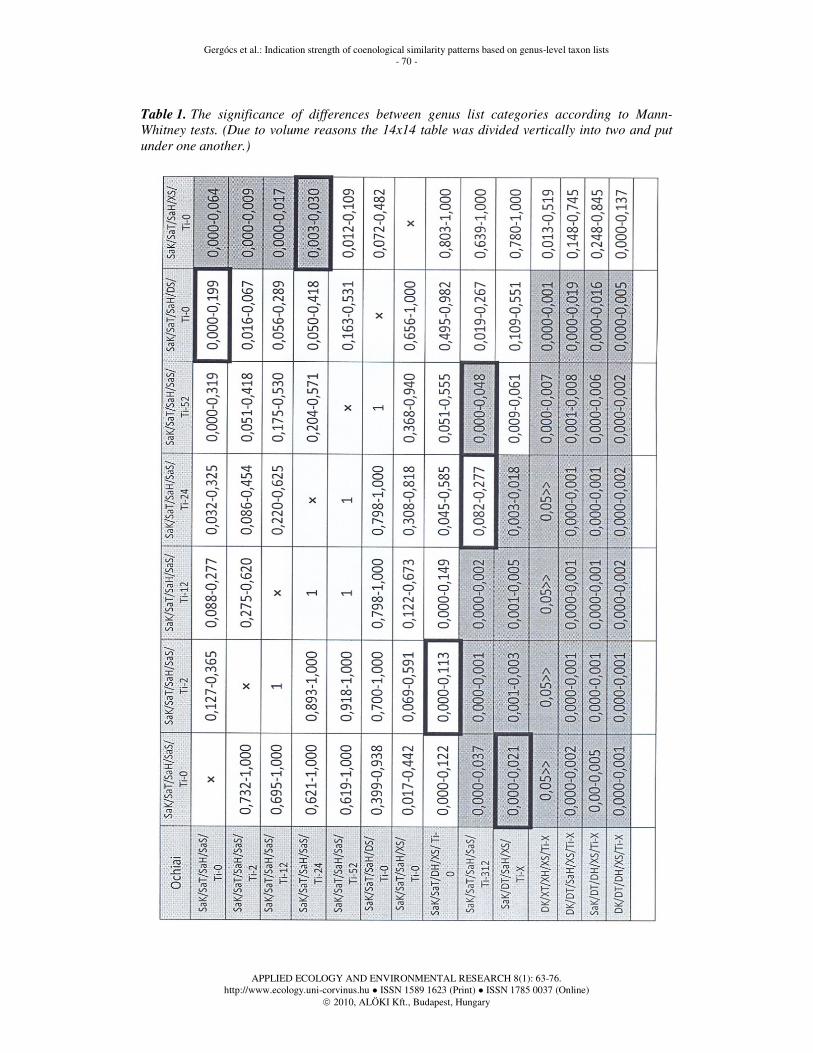
Table 1. The significance of differences between genus list categories according to Mann-
Whitney tests. (Due to volume reasons the 14x14 table was divided vertically into two and put
under one another.)
Gergócs et al.: Indication strength of coenological similarity patterns based on genus-level taxon lists - 71 -
APPLIED ECOLOGY AND ENVIRONMENTAL RESEARCH 8(1): 63-76. http://www.ecology.uni-corvinus.hu ● ISSN 1589 1623 (Print) ● ISSN 1785 0037 (Online)
2010, ALÖKI Kft., Budapest, Hungary
Table 1. cont.
Gergócs et al.: Indication strength of coenological similarity patterns based on genus-level taxon lists - 72 -
APPLIED ECOLOGY AND ENVIRONMENTAL RESEARCH 8(1): 63-76. http://www.ecology.uni-corvinus.hu ● ISSN 1589 1623 (Print) ● ISSN 1785 0037 (Online)
2010, ALÖKI Kft., Budapest, Hungary
Significance of distances between genus list categories
In Table 1 the 95% confidence intervals of the Mann-Whitney post hoc tests are shown. Cells marked with grey colour show significant difference between the two given categories. The heavy black frame means deviation from the values of the tables set up using Jaccard functions, regarding the existence of significance.
Our first remarkable result is that the average distances between genus lists originating from the same substrate but from different dates within a year does not differ from each other significantly. According to our former assumptions time difference could have been detected regarding a one-year-difference, however, it could not be detected from the substrates of the temperate dry oak forest studied. Consequently, if genus lists of the complete habitat type were examined with time lags less than a year, no change could be detected on site level, either. Irmler (2006) had a similar result on species level in a long-term European study.
The difference between oribatid mite communities originating from different substrates (DS/Ti-0) can be significantly larger in case of certain distance functions than the difference between communities coming from the same type of substrate (SaS/Ti-0). Besides, there is no large difference between samples collected within a year from a given type of substrate. It follows from these two statements that if genus lists originate from different types of substrates, there is larger difference between them than if samples are collected within a year from the same type of substrate. Consequently, the quality of substrate in a given habitat type is a more important factor in the composition of the oribatid mite community than time changes within a year.
Similarity between oribatid mite genus lists of the same types of sites (SaK/SaT/SaH/XS/Ti-0) differs significantly from the similarity between genus lists originating from the same type of substrate (SaK/SaT/SaH/SaS) if samples were collected with a time lag of maximum 24 weeks in the latter case. At the same time, the distance between genus lists coming from different types of substrates is similar to the distance between oribatid mite genus lists of the same or different habitats in a given topographicum, i.e. the type of substrates plays a similarly important role in the quality of the oribatid mite community as habitat types in a given topographicum.
The distance between genus lists originating from the same or different types of substrate is much smaller than the distance between genus lists of different topographicums (XK/DT/...), independently of the fact if sites in the same or different zoogeographic kingdoms are compared. More remarkable is the fact that the similarity of genus lists coming from the same sites in the same topographicums does not differ significantly from the similarity of genus lists originating from the same sites in different topographicums. It means that oribatid mite communities of the same types of habitats resemble each other nearly in the same way no matter if they originate from the same or different topographicums.
Order of the family list categories and similarity between zoogeographic kingdoms
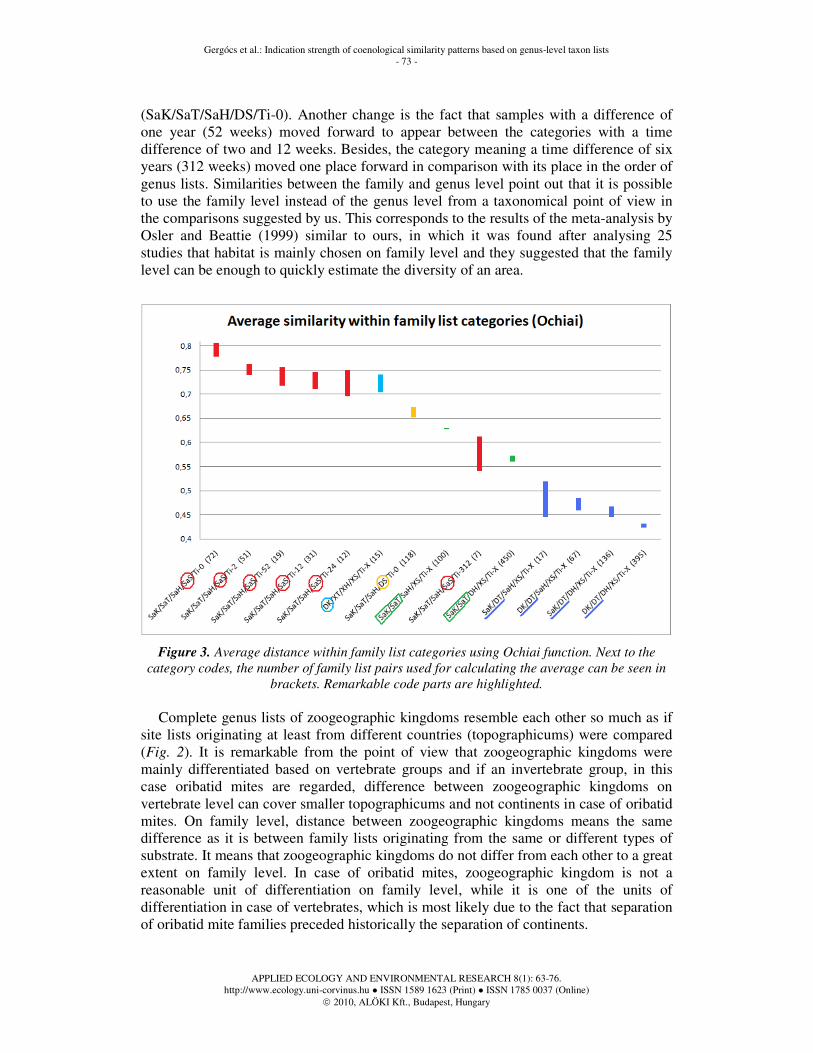
Analysis on family level does not differ much from that on genus level. Results are displayed in Fig. 3. Results of the analyses carried out with both distance functions coincided completely here, therefore only results calculated with the help of Ochiai function are discussed. The most remarkable difference is the increase in similarity between lists of the zoogeographic kingdoms, i.e. the category DK/XT/XH/XS/Ti-X came before the category in which there is a difference only in substrates
Gergócs et al.: Indication strength of coenological similarity patterns based on genus-level taxon lists - 73 -
APPLIED ECOLOGY AND ENVIRONMENTAL RESEARCH 8(1): 63-76. http://www.ecology.uni-corvinus.hu ● ISSN 1589 1623 (Print) ● ISSN 1785 0037 (Online)
2010, ALÖKI Kft., Budapest, Hungary
(SaK/SaT/SaH/DS/Ti-0). Another change is the fact that samples with a difference of one year (52 weeks) moved forward to appear between the categories with a time difference of two and 12 weeks. Besides, the category meaning a time difference of six years (312 weeks) moved one place forward in comparison with its place in the order of genus lists. Similarities between the family and genus level point out that it is possible to use the family level instead of the genus level from a taxonomical point of view in the comparisons suggested by us. This corresponds to the results of the meta-analysis by Osler and Beattie (1999) similar to ours, in which it was found after analysing 25 studies that habitat is mainly chosen on family level and they suggested that the family level can be enough to quickly estimate the diversity of an area.
Figure 3. Average distance within family list categories using Ochiai function. Next to the
category codes, the number of family list pairs used for calculating the average can be seen in
brackets. Remarkable code parts are highlighted.
Complete genus lists of zoogeographic kingdoms resemble each other so much as if
site lists originating at least from different countries (topographicums) were compared (Fig. 2). It is remarkable from the point of view that zoogeographic kingdoms were mainly differentiated based on vertebrate groups and if an invertebrate group, in this case oribatid mites are regarded, difference between zoogeographic kingdoms on vertebrate level can cover smaller topographicums and not continents in case of oribatid mites. On family level, distance between zoogeographic kingdoms means the same difference as it is between family lists originating from the same or different types of substrate. It means that zoogeographic kingdoms do not differ from each other to a great extent on family level. In case of oribatid mites, zoogeographic kingdom is not a reasonable unit of differentiation on family level, while it is one of the units of differentiation in case of vertebrates, which is most likely due to the fact that separation of oribatid mite families preceded historically the separation of continents.
Gergócs et al.: Indication strength of coenological similarity patterns based on genus-level taxon lists - 74 -
APPLIED ECOLOGY AND ENVIRONMENTAL RESEARCH 8(1): 63-76. http://www.ecology.uni-corvinus.hu ● ISSN 1589 1623 (Print) ● ISSN 1785 0037 (Online)
2010, ALÖKI Kft., Budapest, Hungary
Conclusions
Category orders as results of the analyses mostly met our expectations, first of all in case of genus lists, i.e. larger distances between genus lists correspond to larger spatial scales. However, time difference within a year could not be pointed out to a considerable extent either on genus or on family level. The most important differences in the orders are the followings:
1. the difference between samples originating from the same and different types of substrate;
2. the difference between the distance of lists coming from the same type of substrate in a given site and the distance of genus lists originating from the same topographicum but from different or the same types of site;
3. the difference between the distance of lists coming from the same or different types of substrate in a given site and the distance of lists originating from different topographicums;
4. the difference between the distance of lists coming from the same types of sites in a given topographicum and the distance of lists originating from different topographicums.
The analysis on family level differs from that on genus level that much that family lists of the zoogeographic kingdoms resemble each other as much as family lists originating from the same types of substrate.
Thus we compiled a reference list with the help of which it can be expressed to what spatial distances the similarity – shown with distance functions – of the genus or family lists of two oribatid mite communities originating from samples of unknown quality corresponds. Disturbed and transformed habitats can be compared with the help of oribatid mite communities based on an existing reference list.
Acknowledgements. We have to thank Prof. János Podani for his kind methodological help, Dr. Péter Balogh for his valuable professional help with the research of oribatid mites and for making the manuscripts from the Balogh-legacy available. We thank the “Adaptation to Climate Change” Research Group of the Hungarian Academy of Sciences and particularly the late Zsolt Harnos, who ensured the professional prerequisites of the research. Our research was supported by Ányos Jedlik Project No. NKFP-0079/2005 (National Office for Research and Technology), the Research Assistant Fellowship Support (Corvinus University of Budapest) and the “Bolyai János” Research Fellowship (Hungarian Academy of Sciences, Council of Doctors). This work was supported by the research project of the National Development Agency TÁMOP 4.2.1.B-09/1/KMR-2010-0005.
REFERENCES
[1] Arroyo, J., Iturrondobeitia, J.C. (2006): Differences in the diversity of oribatid mite communities in forests and agrosystems lands. – European Journal of Soil Biology 42: 259-269.
[2] Balogh, J. (1965): A synopsis of the World Oribatid (Acari) Genera. – Acta Zoologica Academiae Scientiarum Hungaricae 9(1-2): 5-99.
[3] Balogh, J. (1972): The Oribatid Genera of the World. – Akadémiai Kiadó, Budapest. [4] Balogh, J., Balogh, P. (1992): The Oribatid Mites Genera of the World. – The Hungarian
National Museum Press, Budapest. [5] Balogh, J., Mahunka, S. (1980): ATKÁK XV - ACARI XV. – Magyarország Állatvilága,
Fauna Hungariae, XVIII.(19).
Gergócs et al.: Indication strength of coenological similarity patterns based on genus-level taxon lists - 75 -
APPLIED ECOLOGY AND ENVIRONMENTAL RESEARCH 8(1): 63-76. http://www.ecology.uni-corvinus.hu ● ISSN 1589 1623 (Print) ● ISSN 1785 0037 (Online)
2010, ALÖKI Kft., Budapest, Hungary
[6] Balogh, J., Mahunka, S. (1983): Primitive Oribatids of the Palaearctic Region. – Akadémiai Kiadó, Budapest.
[7] Balogh, P., Gergócs, V., Farkas, E., Farkas, P., Kocsis, M., Hufnagel, L. (2008): Oribatid assemblies of tropical high mountains on some points of the „Gondwana-bridge” – a case study. – Applied Ecology and Environmental Research 6(3): 127-158.
[8] Behan-Pelletier, V.M. (1999): Oribatid mite biodiversity in agroecosystems: role for bioindication. – Agriculture, Ecosystems and Environment 74: 411-423.
[9] Behan-Pelletier, V., Winchester, N. (1998): Arboreal oribatid mite diversity: Colonizing the canopy. – Applied Soil Ecology 9: 45-51.
[10] Caruso, T., Migliorini, M. (2006): Micro-arthropod communities under human disturbance: is taxonomic aggregation a valuable tool for detecting multivariate change? Evidence from Mediterranean soil oribatid coenoses. – Acta Eocologica 30: 46-53.
[11] Coleman, D.C, Crossley, Jr, D.A., Hendrix, P.F. (2004): Fundamentals of Soil Ecology. – Elsevier Academic Press.
[12] Fagan, L.L., Didham, R.K., Winchester, N., Behan-Pelletier, V., Clayton, M., Lindquist, E., Ring, R.A. (2006): An experimental assessment of biodiversity and species turnover in terrestrial vs. canopy leaf litter. – Eocologia 147: 335-347.
[13] Gergócs, V., Hufnagel, L. (2009): Application of Oribatid Mites as Indicators. – Applied Ecology and Environmental Research 7(1): 79-98.
[14] Gulvik, M.E. (2007): Mites (Acari) As Indicators of Soil Biodiversity and Land Use Monitoring: a Review. – Polish Journal of Ecology 55(3): 415-440.
[15] Hammer, M. (1952): Investigation On The Microfauna Of Nothern Canada, Part I, Oribatidae. – Acta Arctica.
[16] Hammer, M. (1958): Investigation On The Oribatid Fauna Of The Andes Mountains, I. Argentine and Bolivia.
[17] Hammer, M. (1961): Investigations On The Oribatid Fauna Of The Andes Mountains, II. Peru.
[18] Hammer, M. (1962): Investigations On The Oribatid Fauna Of The Andes Mountains, III. Chile.
[19] Hammer, M. (1962): Investigations On The Oribatid Fauna Of The Andes Mountains, IV. Patagonia.
[20] Hammer, M. (1966): Investigations On The Oribatid Fauna Of New Zealand, Part I-III. [21] Hammer, M. (1972): Investigations On The Oribatid Fauna Of Tahiti And On Some
Oribatids Found On The Atoll Rangiroa. [22] Hammer, Ř., Harper, D.A.T., Ryan, P.D. (2001): PAST: Paleontological Statistics
Software Package for Education and Data Analysis. – Palaeontologia Electronica 4(1): 9. http://palaeo-electronica.org/2001_1/past/issue1_01.htm
[23] Irmler, U. (2006): Climatic and litter fall effects on collembolan and oribatid mite species and communities in a beech wood based on a 7 years investigation. – European Journal of Soil Biology 42: 1-62.
[24] Jing, S., Solhoy, T., Wang, H.F., Vollan, T.I., Xu, R.M. (2005): Differences in soil arthropod communities along a high altitude gradient at Shergyla Mountain, Tibet, China. – Arctic, Antarctic and Alpine Research 37(2): 261-266.
[25] Lebrun, Ph., van Straalen, N.M. (1995): Oribatid mites: prospects for their use in ecotoxicology. – Experimental & Applied Acarology 19: 361-379.
[26] Lindo, Z., Winchester, N. (2006): A comparison of microarthropod assemblages with emphasis on oribatid mite in canopy suspended soils and forest floors associated with ancient western redcedar trees. – Pedobiologia 50: 31-41.
[27] Melamud, V., Beharav, A., Pavlicek, T., Nevo, E. (2007): Biodiversity interslope divergence of Oribatid Mites at „Evolution Canyon”, Mount Carmel, Israel. – Acta Zoologica Academiae Scientiarum Hungaricae 53(4): 381-396.
[28] Migliorini, M., Bernini, F. (1999): Oribatid mite coenoses in the Nebrodi Mountains (Northern Sicily). – Pedobiologia 43(4): 372-383.
Gergócs et al.: Indication strength of coenological similarity patterns based on genus-level taxon lists - 76 -
APPLIED ECOLOGY AND ENVIRONMENTAL RESEARCH 8(1): 63-76. http://www.ecology.uni-corvinus.hu ● ISSN 1589 1623 (Print) ● ISSN 1785 0037 (Online)
2010, ALÖKI Kft., Budapest, Hungary
[29] Migliorini, M., Petrioli, A., Bernini, F. (2002): Comparative analysis of two edaphic zoocoenoses (Oribatid mites and Carabid beetles) in five habitats of the ‘Pietraporciana’ and ‘Lucciolabella’ Nature Reserves (Orcia Valley, central Italy). – Acta Eocologica 23: 361-374.
[30] Migliorini, M., Pigino, G., Caruso, T., Fanciulli, P.P., Leonzio, C., Bernini, F. (2005): Soil communities (Acari Oribatida; Hexapoda Collembola) in a clay pigeon shooting range. – Pedobiologia 49: 1-13.
[31] Müller, P. (1980): Arealsysteme und Biogeographie. – Ulmer, Stuttgart. [32] Noti, M., André, H.M., Dufrene, M. (1996): Soil oribatid mite communities (Acari:
Oribatida) from high Shaba (Zäire) in relation to vegetation. – Applied Soil Ecology 5: 81-96.
[33] Olsanowski, Z. (1996): A monograph of the Nothridae and Camisiidae of Poland (Acari: Oribatida: Crotonoidea). – Genus International Journal of Invertebrate Taxonomy (Supplement).
[34] Osler, G.H.R., Beattie, A.J., (1999): Taxonomic and structural similarities in soil oribatid communities. – Ecography 22: 567-574.
[35] Osler, G.H.R., Murphy, D.V. (2005): Oribatid mite species richness and soil organic matter fractions in agricultural and native vegetation soils in Western Australia. – Applied Soil Ecology 29: 93-98.
[36] Osler, G.H.R., Korycinska, A., Cole, L. (2006): Differences in litter mass change mite assemblage structure on a deciduous forest floor. – Ecography 29: 811-818.
[37] Podani, J. (1989): Comparison of ordinations and classifications of vegetation data. – Vegetatio 83: 111-128.
[38] Podani, J. (1997): Bevezetés a többváltozós biológiai adatfeltárás rejtelmeibe. – Scientia Kiadó, Budapest.
[39] Podani, J. (2001): SYN-TAX 2000 user’s manual. – Scientia Kiadó, Budapest. [40] Reynolds, B.C., Crossley, D.A., Hunter, M.D. (2003): Response of soil invertebrates to
forest canopy inputs along a productivity gradient. – Pedobiologia 47: 127-139. [41] Skubala, P., Gulvik, M. (2005): Pioneer Oribatid Mite Communities (Acari, Oribatida) in
Newly Exposed Natural (Glacier Foreland) and Anthropogenic (Post-Industrial Dump) Habitats. – Polish Journal of Ecology 53(3): 395-407.


![User profile correlation-based similarity (UPCSim) algorithm ......collaborative ltering similarity [29], the Triangle Multiplying Jaccard (TMJ) similarity [30], and the similarity](https://img.pdfslide.us/doc/110x75/6147013af4263007b1358a2c/user-profile-correlation-based-similarity-upcsim-algorithm-collaborative.jpg)