Embed Size (px)
Citation preview
1
India’s Largest Integrated Temperature Controlled Logistics Service Providers
With An Ability To Service Customers On A Pan India Basis
SAFE HARBOR STATEMENT
In this presentation and other statements - written and oral - that the Company periodically
makes contain forward-looking statements that set out anticipated results based on the
management’s plans and assumptions. The Company has tried wherever possible to identify
such statements by using words such as ‘anticipates’, ‘estimates’, ‘expects’, ‘projects’,
‘intends’, ‘plans’, ‘believes’, and words of similar substance in connection with any discussion
of future performance. The Company cannot guarantee that these forward looking
statements will be realized, although we believe we have been prudent in assumptions. The
achievement of results is subject to risks, uncertainties and even inaccurate assumptions.
Should known or unknown risks or uncertainties materialize, or should underlying assumptions
prove inaccurate, actual results could vary materially from those anticipated, estimated or
projected. Readers should bear this in mind. The Company undertakes no obligation to
publicly update any forward-looking statements, whether as a result of new information, future
events or otherwise to reflect the events or circumstances after the date hereof. The
Company accepts no liability whatsoever for any loss howsoever arising from any information
presented or contained in the presentations.

TABLE OF CONTENT
COMPANY OVERVIEW
OUR NETWORK
MISSION & VISION
BOARD OF DIRECTORS
Q1 FY17: QUARTER SUMMARY
Q1 PERFORMANCE COMPARISON
BALANCE SHEET
NOTE TO ACCOUNTS
IMPACT OF IND AS
FINANCIAL TRENDS
OPERATIONAL TRENDS
SEGMENT-WISE REVENUE
UPDATES
DIRECTORS STATEMENT
STRATEGY
CONTACT US
1.
2.
3.
4.
5.
6.
7.
8.
9.
10.
11.
12.
13.
14.
15.
16.
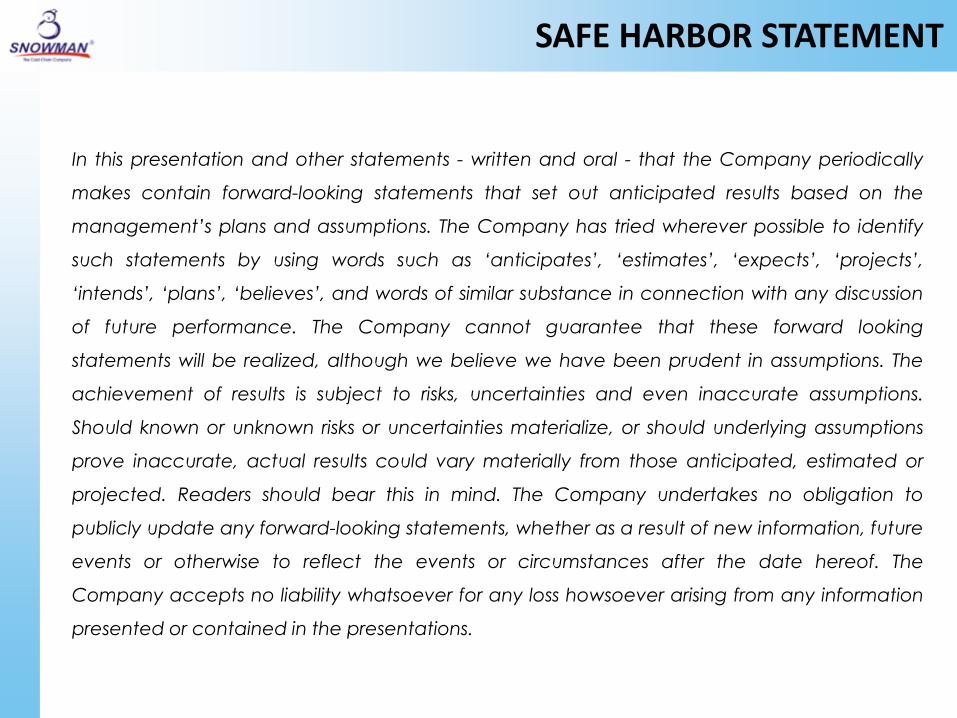
COMPANY OVERVIEW
One Point Solution
Primary Distribution
(First Mile)
Warehousing
Secondary Distribution (Last Mile)
PAN India Integrated
solutions
98,500 pallet capacity - 30 Warehouses
across 15 locations
5 variant temperature zones (-25⁰C
to 20⁰C)
Fleet size of 293 vehicle
covering 400+ cities &
towns
Efficient Business Strategy
Customized business offerings
Diversified segment mix
Diversified clientele
Quality Assurance
ISO 14001 & 22000
certification
FSSAI certification
EU certification
State of the art IT
Infrastructure
WMS
Full traceability
Customized reports
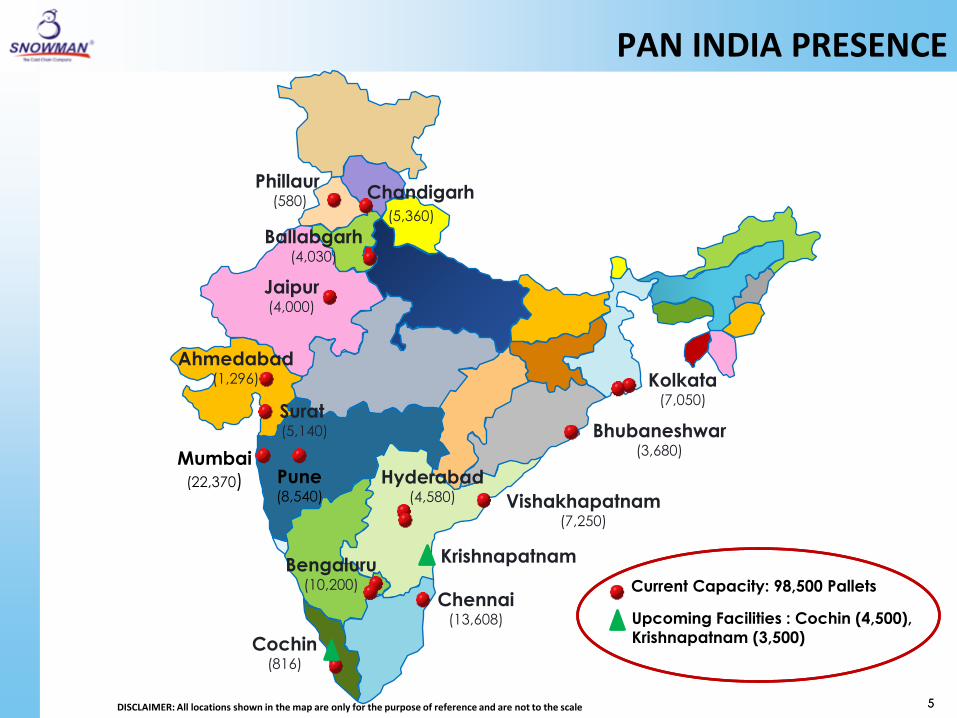
5
Current Capacity: 98,500 Pallets
Upcoming Facilities : Cochin (4,500),
Krishnapatnam (3,500)
Mumbai (22,370)
Ahmedabad (1,296)
Chennai (13,608)
Bengaluru (10,200)
Ballabgarh (4,030)
Cochin (816)
Kolkata (7,050)
Hyderabad (4,580)
Pune (8,540) Vishakhapatnam
(7,250)
Chandigarh (5,360)
Jaipur (4,000)
Bhubaneshwar (3,680)
Surat (5,140)
DISCLAIMER: All locations shown in the map are only for the purpose of reference and are not to the scale
PAN INDIA PRESENCE
5
Krishnapatnam
Phillaur (580)
MISSION & VISION
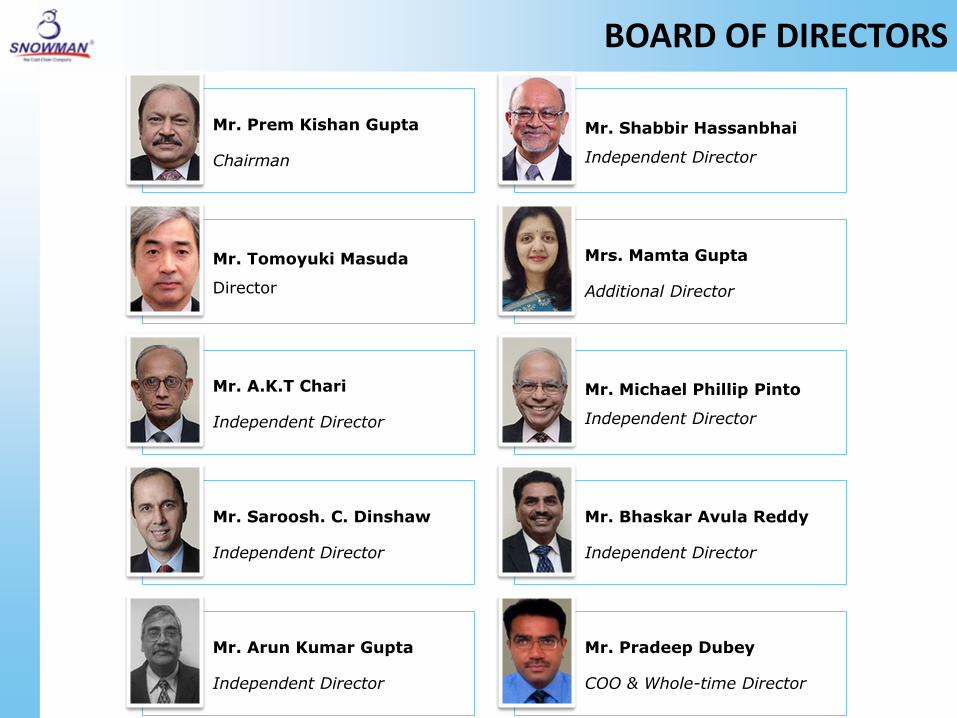
BOARD OF DIRECTORS
Mr. Prem Kishan Gupta
Chairman
Mr. Shabbir Hassanbhai
Independent Director
Mr. Tomoyuki Masuda
Director
Mrs. Mamta Gupta
Additional Director
Mr. A.K.T Chari
Independent Director
Mr. Michael Phillip Pinto
Independent Director
Mr. Saroosh. C. Dinshaw
Independent Director
Mr. Bhaskar Avula Reddy
Independent Director
Mr. Arun Kumar Gupta
Independent Director
Mr. Pradeep Dubey
COO & Whole-time Director

Q1 FY17: QUARTER SUMMARY
1. During Q1FY17 SLL reported:
Revenue dropped by 16% to INR49.66 Cr. from INR59.20 Cr in Q1FY16.
EBITDA increase of 20% to INR14.75 Cr. from INR12.25 Cr in Q1FY16.
PAT decreased by 67% from INR1.79 Cr. to INR5.46 Cr in Q1FY16.
2. Cash and cash equivalents as on June 30, 2016 of INR15.40 Cr.
3. With total debt of INR147.69 Cr. SLL has maintained D/E ratio of 0.34
4. With total pallet capacity of 98,500, capacity utilization was 74% as
against 73% in Q1FY16.
5. SLL now owns its complete fleet of 293 refrigerated trucks.
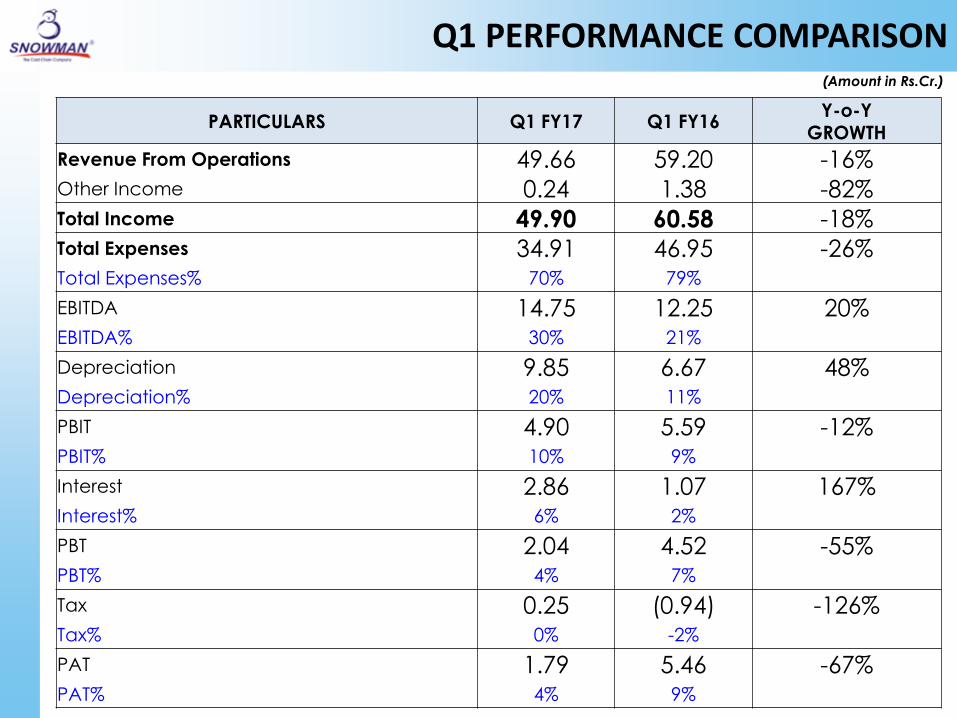
Q1 PERFORMANCE COMPARISON (Amount in Rs.Cr.)
PARTICULARS Q1 FY17 Q1 FY16 Y-o-Y
GROWTH
Revenue From Operations 49.66 59.20 -16% Other Income 0.24 1.38 -82% Total Income 49.90 60.58 -18% Total Expenses 34.91 46.95 -26% Total Expenses% 70% 79% EBITDA 14.75 12.25 20% EBITDA% 30% 21% Depreciation 9.85 6.67 48% Depreciation% 20% 11% PBIT 4.90 5.59 -12% PBIT% 10% 9% Interest 2.86 1.07 167% Interest% 6% 2% PBT 2.04 4.52 -55% PBT% 4% 7% Tax 0.25 (0.94) -126% Tax% 0% -2% PAT 1.79 5.46 -67% PAT% 4% 9%
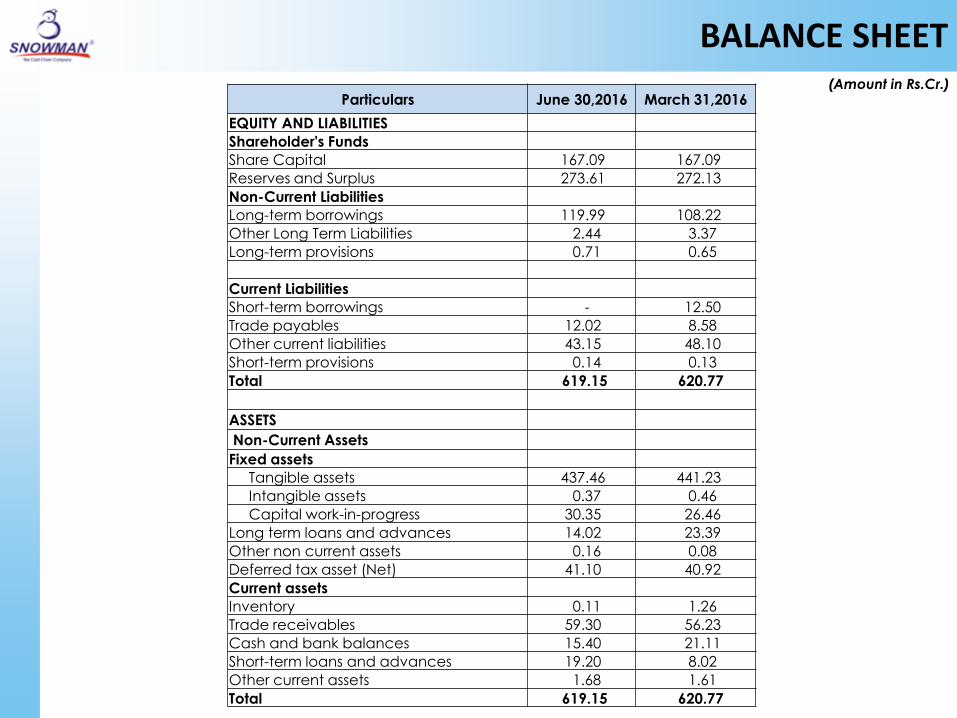
BALANCE SHEET (Amount in Rs.Cr.)
Particulars June 30,2016 March 31,2016
EQUITY AND LIABILITIES
Shareholder's Funds
Share Capital 167.09 167.09
Reserves and Surplus 273.61 272.13
Non-Current Liabilities
Long-term borrowings 119.99 108.22
Other Long Term Liabilities 2.44 3.37
Long-term provisions 0.71 0.65
Current Liabilities
Short-term borrowings - 12.50
Trade payables 12.02 8.58
Other current liabilities 43.15 48.10
Short-term provisions 0.14 0.13
Total 619.15 620.77
ASSETS
Non-Current Assets Fixed assets
Tangible assets 437.46 441.23
Intangible assets 0.37 0.46
Capital work-in-progress 30.35 26.46
Long term loans and advances 14.02 23.39
Other non current assets 0.16 0.08
Deferred tax asset (Net) 41.10 40.92
Current assets
Inventory 0.11 1.26
Trade receivables 59.30 56.23
Cash and bank balances 15.40 21.11
Short-term loans and advances 19.20 8.02
Other current assets 1.68 1.61
Total 619.15 620.77

NOTE TO ACCOUNTS
Ind AS Compliant Financials
• The Company has adopted Ind AS for the financial year commencing
from April 1, 2016, and accordingly, the Results for the quarter and
corresponding previous quarter have been prepared by the
Management in compliance with Ind AS.

IMPACT OF IND AS
12
Description 3 months ended
30/06/2016
Corresponding 3 months ended in the
previous year 30/06/2015
Net profit or loss as per Previous GAAP (Indian GAAP) 185.95 553.31
Less: Impact on account of fair valuation of financial assets
(Operating expense) 16.07 16.13
Add: Income (Interest) on unwinding of the present value on
quarterly basis (Other Income) 9.42 8.87
Net profit or loss as per Ind AS 179.30 546.05
Other comprehensive income, net of income tax - -
Total comprehensive income for the period 179.30 546.05
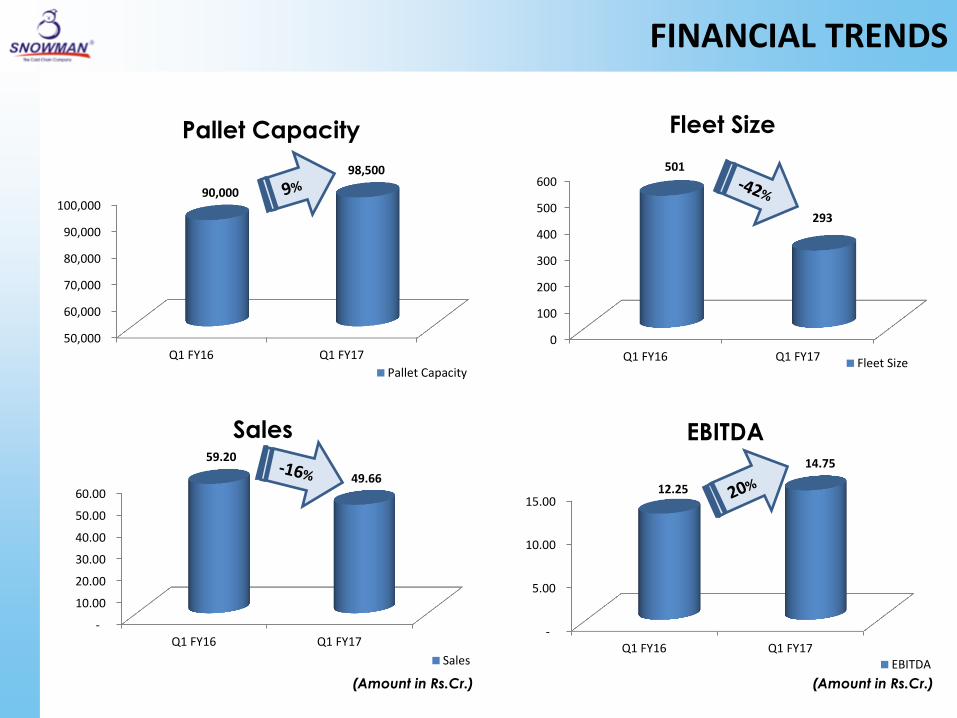
FINANCIAL TRENDS
50,000
60,000
70,000
80,000
90,000
100,000
Q1 FY16 Q1 FY17
90,000
98,500
Pallet Capacity
Pallet Capacity
-
5.00
10.00
15.00
Q1 FY16 Q1 FY17
12.25
14.75
EBITDA
EBITDA
(Amount in Rs.Cr.) (Amount in Rs.Cr.)
0
100
200
300
400
500
600
Q1 FY16 Q1 FY17
501
293
Fleet Size
Fleet Size
-
10.00
20.00
30.00
40.00
50.00
60.00
Q1 FY16 Q1 FY17
59.20
49.66
Sales
Sales
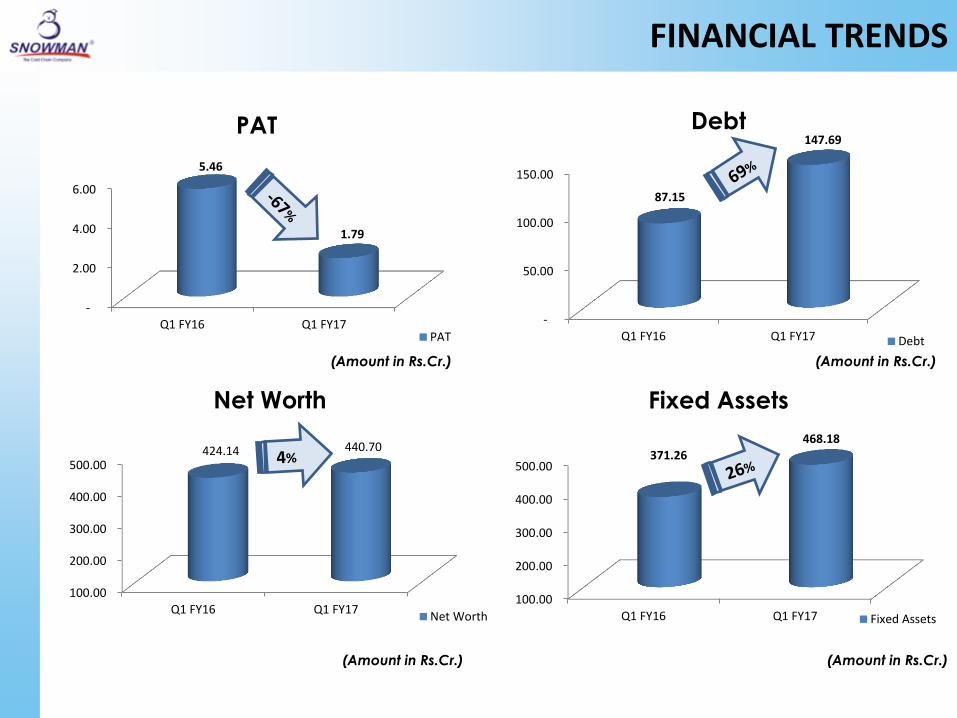
FINANCIAL TRENDS
-
2.00
4.00
6.00
Q1 FY16 Q1 FY17
5.46
1.79
PAT
PAT
(Amount in Rs.Cr.) (Amount in Rs.Cr.)
(Amount in Rs.Cr.) (Amount in Rs.Cr.)
-
50.00
100.00
150.00
Q1 FY16 Q1 FY17
87.15
147.69 Debt
Debt
100.00
200.00
300.00
400.00
500.00
Q1 FY16 Q1 FY17
424.14 440.70
Net Worth
Net Worth
100.00
200.00
300.00
400.00
500.00
Q1 FY16 Q1 FY17
371.26 468.18
Fixed Assets
Fixed Assets
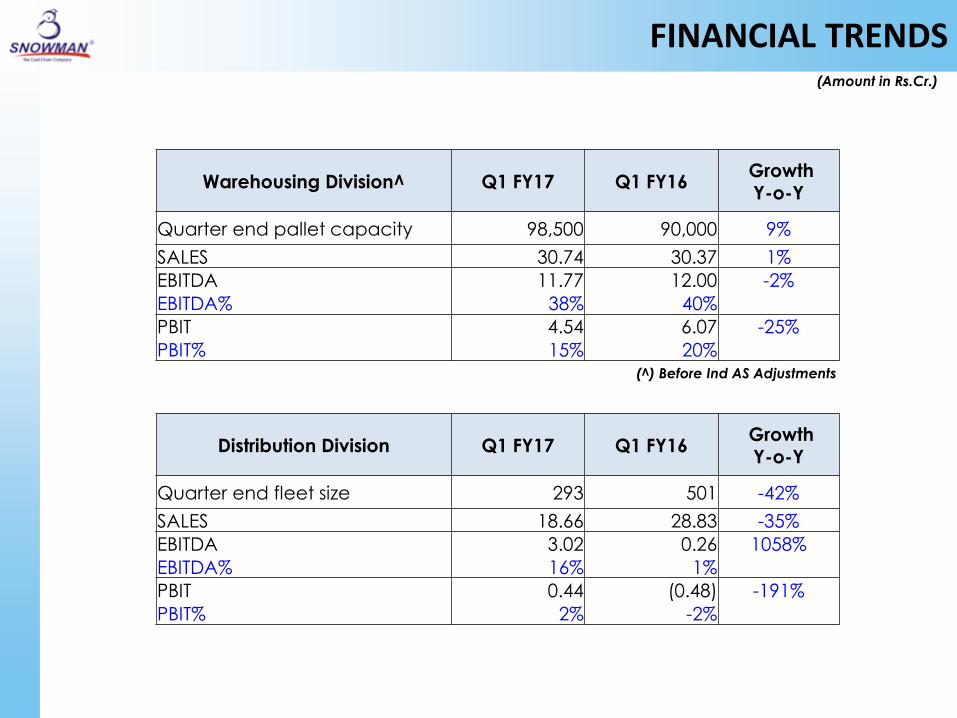
FINANCIAL TRENDS (Amount in Rs.Cr.)
Warehousing Division^ Q1 FY17 Q1 FY16 Growth Y-o-Y
Quarter end pallet capacity 98,500 90,000 9%
SALES 30.74 30.37 1%
EBITDA 11.77 12.00 -2%
EBITDA% 38% 40%
PBIT 4.54 6.07 -25%
PBIT% 15% 20%
Distribution Division Q1 FY17 Q1 FY16 Growth
Y-o-Y
Quarter end fleet size 293 501 -42%
SALES 18.66 28.83 -35%
EBITDA 3.02 0.26 1058%
EBITDA% 16% 1%
PBIT 0.44 (0.48) -191%
PBIT% 2% -2%
(^) Before Ind AS Adjustments
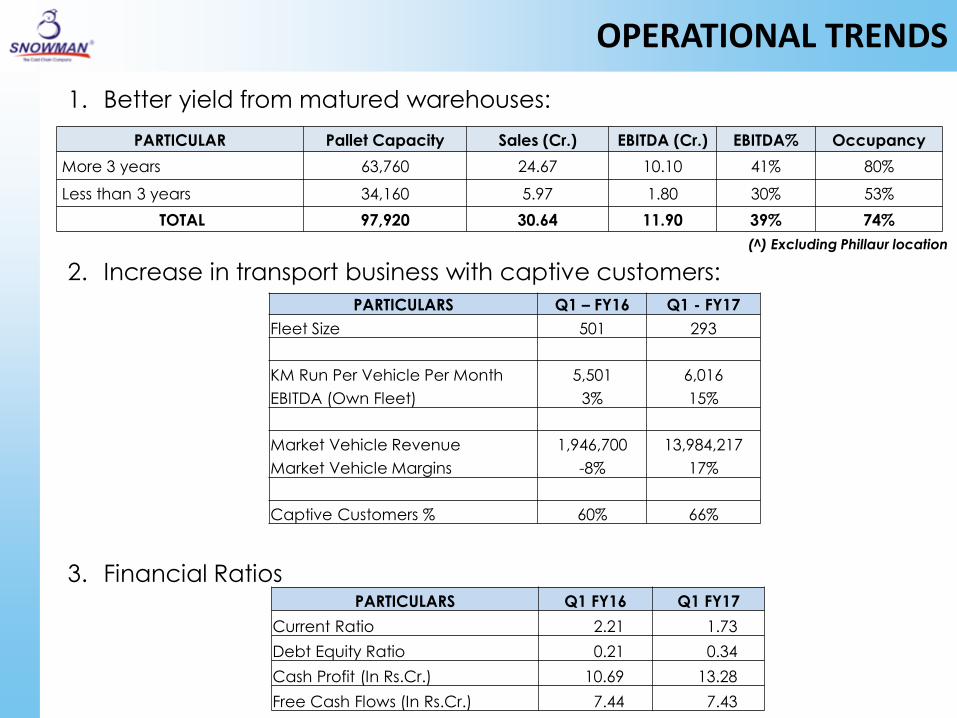
OPERATIONAL TRENDS
1. Better yield from matured warehouses:
2. Increase in transport business with captive customers:
3. Financial Ratios
(^) Excluding Phillaur location
PARTICULAR Pallet Capacity Sales (Cr.) EBITDA (Cr.) EBITDA% Occupancy
More 3 years 63,760 24.67 10.10 41% 80%
Less than 3 years 34,160 5.97 1.80 30% 53%
TOTAL 97,920 30.64 11.90 39% 74%
PARTICULARS Q1 – FY16 Q1 - FY17
Fleet Size 501 293
KM Run Per Vehicle Per Month 5,501 6,016
EBITDA (Own Fleet) 3% 15%
Market Vehicle Revenue 1,946,700 13,984,217
Market Vehicle Margins -8% 17%
Captive Customers % 60% 66%
PARTICULARS Q1 FY16 Q1 FY17
Current Ratio 2.21 1.73
Debt Equity Ratio 0.21 0.34
Cash Profit (In Rs.Cr.) 10.69 13.28
Free Cash Flows (In Rs.Cr.) 7.44 7.43

SEGMENT WISE DISTRIBUTION OF REVENUE
17
Poultry, 7%
Meat, 10%
Ice cream,
11%
Dairy
Products,
13% Agro Food/
F&V/
Fruit pulp &
concentrates
, 16%
Sea Food,
10%
QSR, 9%
Confectionery
, 10%
Health care/
Pharma, 3%
Ready To
Cook, 4%
Industrial
Products, 3%
Food
Services, 3% Other, 2%
Segment Wise Revenue Breakup-
FY17 (Upto Q1)
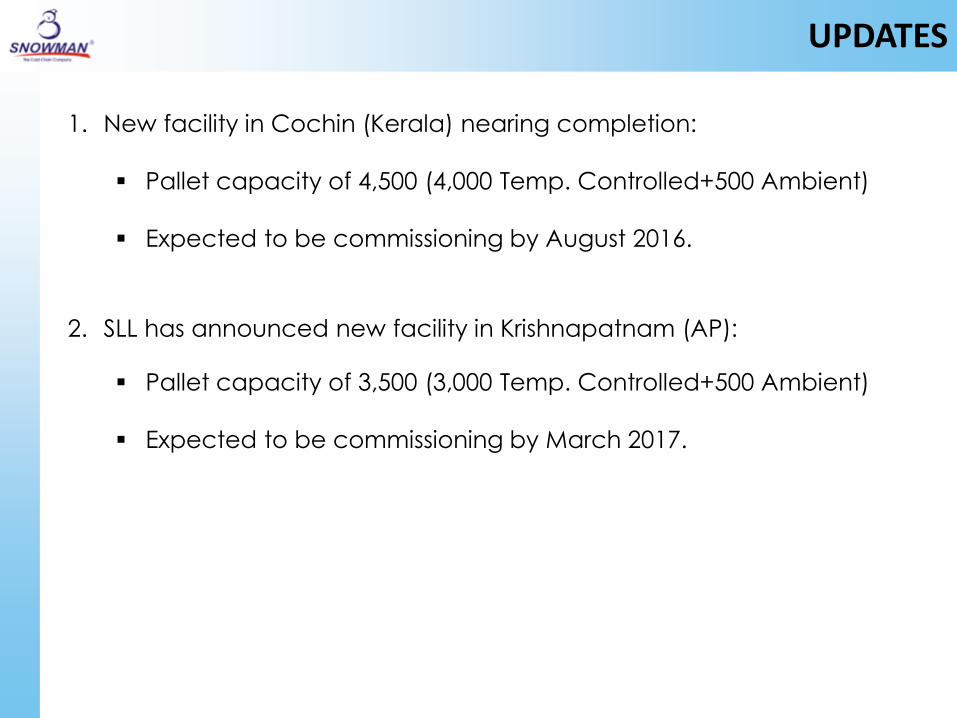
UPDATES
1. New facility in Cochin (Kerala) nearing completion:
Pallet capacity of 4,500 (4,000 Temp. Controlled+500 Ambient)
Expected to be commissioning by August 2016.
2. SLL has announced new facility in Krishnapatnam (AP):
Pallet capacity of 3,500 (3,000 Temp. Controlled+500 Ambient)
Expected to be commissioning by March 2017.
DIRECTORS’ STATEMENT
Commenting on the results the Chairman, Mr. Prem Kishan Gupta said “Snowman
continues to be the leader in the temperature controlled logistics business with the
installed capacity nearing the 1 lakh pallet mark. The near term focus of the
company would be to consolidate its position by improving occupancy with
higher yield products. However, the Company will not lose sight of its growth plans.
The Kochi warehouse of 4,500 pallets is nearing completion and work on the
Krishnapatnam warehouse of 3,500 pallets has commenced. The company will
continue to explore opportunities to set up new warehouses especially in tier 2 and
tier 3 cities, which currently have a very low penetration of high quality
warehouses.”
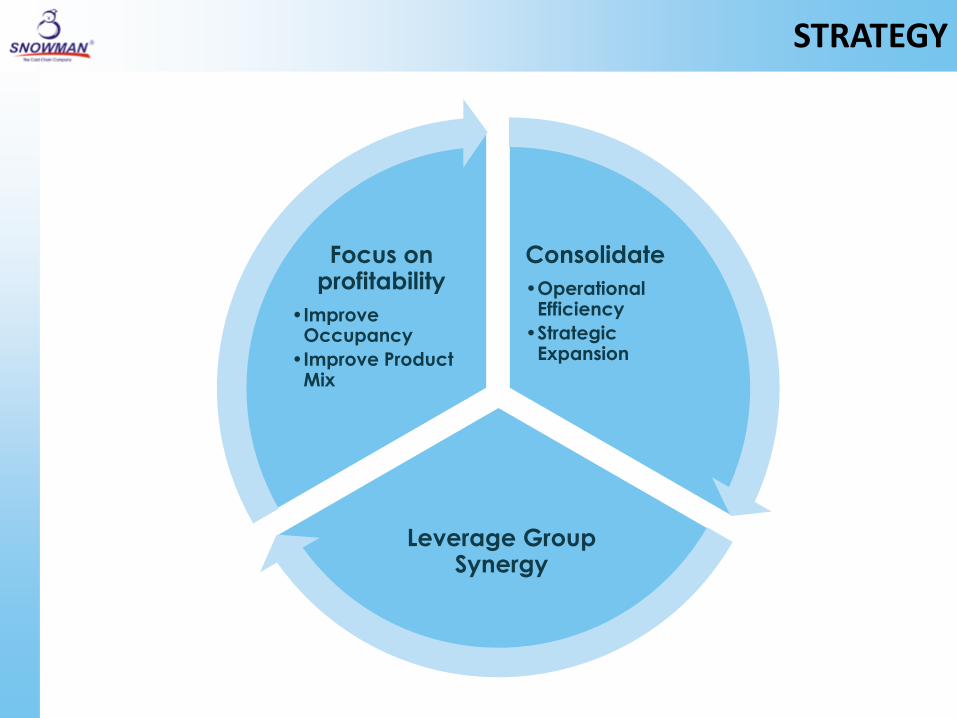
STRATEGY
Consolidate
•Operational Efficiency
•Strategic Expansion
Leverage Group Synergy
Focus on profitability
•Improve Occupancy
•Improve Product Mix
CONTACT US
Snowman Logistics Limited Sy. No. 36/1, Virgonagar, Old Madras Road,
Bandapura Village, Bidarehalli Hobli,
Bengaluru - 560 049,
Karnataka, India
T : +91 80 3993 9500 / +91 80 67693700
F : +91 80 3993 9500