Embed Size (px)
Citation preview

Centre for Sustainable Employmentcse.azimpremjiuniversity.edu.in
India’s Employment Crisis: Rising EducationLevels and Falling Non-agricultural Job Growth
Santosh Mehrotra and Jajati K. Parida
October 2019
CSE Working Paper#23

1
India’s Employment Crisis:
Rising Education Levels and Falling Non-agricultural Job Growth
Santosh Mehrotra
Centre for Informal Sector and Labour Studies,
Jawaharlal Nehru University, New Delhi
Jajati K. Parida
Department of Economic Studies,
Central University Punjab, Bathinda
Abstract
Falling total employment is an unprecedented trend seen from 2011-12 to 2017-18. Due to a
decline of employment in agriculture and manufacturing and slow growth of construction jobs, the
process of structural transformation, which had gained momentum post-2004-5, has stalled since
2012. Mounting educated youth unemployment, and lack of quality non-farm jobs have resulted in
an increase of the disheartened labour force. Though the share of regular and formal employment
increased marginally due to growth of formal jobs in the private sectors, the share of informal
jobs within government/public sector increased. A dominant share of jobs is still generated by
micro and small units of the unorganized sectors without any formal or written job contract. In
both government and private sectors the number of contract jobs (with less than a year’s contract)
is on the rise post 2011-12. Not surprisingly, real wages have not increased in either rural or
urban areas.
1. Introduction
The Indian economy is passing through an important phase of structural transformation, in which,
the share and number of workers in agriculture has been declining with corresponding rise in
employment in non-farm sectors since 2004-05 (Mehrotra et al., 2014). However, most recent data
shows that only the service sector is driving the growth of jobs in the non-farm sectors, while

2
employment growth in construction has decelerated along with a fall in manufacturing
employment during 2011-12 and 2017-18. While the job market is showing sluggish demand
conditions, on the supply side the increasing influx of youth, who recently have completed
education and training, has resulted in a massive rise in the number of open unemployed and
disheartened1 labour force.
Despite several government initiatives to formalize the economy, still about 90.7 percent (83.5
percent within non-farm sector) of total employment is informal, an insignificant reduction from
93 per cent. Moreover, the share of organized sector employment in non-farm sectors declined
from about 34.5 percent to 29.5 percent during post 2011-12. Despite the skill development
initiatives of the government, we investigate why the open unemployment rate among higher
educated, technically and vocationally trained youth has risen to an unprecedented rate.
This paper is based on both the recent “Employment and Unemployment” and “Unincorporated
Non‐Agricultural Enterprise” survey data of the National Sample Survey (NSS). The unit data
collected during 2004-05 and 2011-12 employment and unemployment rounds and the annual
Periodic Labour Force Survey (PLFS), 2017-18 are used for obtaining various labour market
indicators: the Labour force, workforce, unemployment and Not in Labour force Education and
Training (NLET). These figures are estimated considering both principal and subsidiary
employment status of the individuals. Moreover, the sectoral employment, organized-unorganized
and formal-informal employment etc., are computed using other information like National
Industrial Classification (NIC) codes, enterprise type, number of workers in the enterprise, types
of job contract, availability of social security benefits. All these NSS estimates are adjusted to the
projected census population to obtain absolute numbers2. The enterprise survey conducted during
2010-11 and 2015-16 are used to estimate the number of registered and un-registered enterprises.
Moreover, we would like to note that both NSS quinquennial rounds and PLFS employment data
could be compared without any doubt and distrust. This is because both the surveys used a similar
interview schedule (to collected employment and unemployment, and other socio-economic and
demographic information) and covered equally large number of households across the states and
1 It includes those, who neither actively searching for jobs nor they attending further education and training. 2 Absolute number of workers, unemployed and NLET population are estimated by multiplying the NSS/PLFS estimates with the Census Adjustment Multiplier (CAM). CAM is just the ratio of Census Projected Population and NSS/PLFS estimated population. The Census projected population for each round of NSS is computed using monthly exponential growth rates. For example: We have projected the Census Population for the month of December (in a specific year) for the NSS/PLFS round which has stretched between July (previous year) and June (Current year).

3
Union Territories (UTs) of India. Furthermore, both these surveys followed the same multi-stage
stratified random sampling method and collected information in four distinct phases (sub-samples)
during a year to address the seasonality issues. Although in the PLFS, second stage stratification
is based on education (the number of household members having secondary and above level of
education) criterion instead of the monthly per capita spending of the households, the selection of
first stage units (villages and urban wards) and the hamlet groups (sub-blocks of large FSUs) in
both these surveys are based on same population size criteria. This is why the overall composition
of the sample are still similar (Annexure 1), and hence comparable.3
This paper is organized as follows. Section two describes the sectoral employment trends and its
structure by states and the unemployment scenario in India. Section three explores the subsectors
which contributed to the rise and fall of non-farm jobs. Section four provides a discussion on the
quality of jobs created in three main non-farm sectors. Section five concludes the paper.
2. Labour force and unemployment trends in India, 2005-2018
2.1 Falling total employment is an unprecedented trend
A demographic dividend, that India is undergoing, is characterized by a rise in the share of the
working age population in total population. Those looking for work (Labour Force) is a subset of
the working age population. The Indian economy is passing through an unprecedented phase in its
employment history, in which total employment (Workforce) is declining, and open unemployed
and disheartened Not-in-Labour Force-Education-Training” (NLET) youth (a reserve army) are
rising massively. Slowing total employment growth from about 12 million pa to about 2 million
pa during 2000-2005 and 2005-2012 was a matter of great debate in India during the first half of
this decade. The 12 mn pa workforce growth in the first half of the last decade was the outcome
of a baby boom up until the mid-1980s, while the sharp drop to 2 mn pa resulted from falling
employment in agriculture (Himanshu, 2012; Mehrotra et al., 2014), and rising enrollment (both
boys and girls) at secondary and higher education (also Rangarajan et al., 2011; Thomas, 2012;
Kannan and Raveendran, 2012; Mehrotra and Parida, 2017).
However, due to sharp increases in enrollment at every level of education over the noughties, it
was expected that post-2012 total employment would increase, particularly in the non-farm
3 We note from Annexure 1 that the share of households with a growing share of better educated members is consistently rising from 2004-5 to 2017-18, indicating that not only is there comparability of the samples across NSS Rounds, but this phenomenon is consistent with educational enrolment data available from NIEPA (UDISE).

4
sectors. This would have sustained the structural transformation process which began after 2004-
05. But unfortunately, total employment during 2011-12 and 2017-18 declined by 9 million (Table
1). This happened for the first time in India’s history.
The agriculture sector continued to register decline of employment at the rate of 4.5 million pa
(about 27 million in total) during 2011-12 and 2017-18. The share of employment in agriculture
and allied sector also declined from 49 percent to about 44 percent (Table 1). During this period
manufacturing also recorded a 3.5 million decline in jobs, which resulted in a fall in its share of
employment from 12.6 to 12.1 percent. Falling manufacturing jobs is the opposite of the goal of
‘Make in India’, and the opposite of what is desirable if the process of structural transformation is
to be sustained.
The non-manufacturing sector (mostly construction ) which was creating about 4 million jobs pa
during 2004-05 and 2011-12, created only about 0.6 million pa during 2011-12 and 2017-18 (Table
1). Slow growth of construction jobs has negative implications for low skilled employment, real
wages and the incidence of poverty. Since real wages remained flat during 2011-12 and 2017-18,
particularly in rural areas (Figure 1), it could be argued that the incidence of poverty may not have
declined unlike what was anticipated by some optimists (e.g. Bhalla, 2019).
The only sector which sustained growth of jobs (3 million pa) is services, although the quality of
jobs in this sector are mostly poor (outside of modern services). We will explore the subsectors
which contributed to services jobs later in the next section. But first we turn to state-wise
employment trends.
Table 1: Sectoral employment, labour force and unemployment trends in India, 2005-2018 Sectors Absolute Numbers (million)
Overall Population Youths (15 to 29 years) 2004-05 2011-12 2017-18 2004-05 2011-12 2017-18
Agriculture 268.7 231.9 205.3 85.7 60.7 41.8 Manufacturing 53.9 59.8 56.4 22.4 22.1 18.5 Non-manufacturing 29.4 55.3 58.9 11.6 19.4 17.8 Service 107.3 127.3 144.4 34.5 35.7 37.6 Total employment 459.4 474.2 465.1 154.2 138.0 115.7 Labour force 470.2 484.8 495.1 163.1 147.0 140.7 Participating in Education 56.8 99 127 WPR (%) 42 38.6 34.7 53.3 41.9 31.4 LFPR (%) 43 39.5 36.9 56.4 44.6 38.3 UR (%) as per usual status 2.3 2.2 6.1 5.4 6.1 17.8 UR (%) as per weekly status 3.4 3.0 8.8 6.4 6.8 21.4
Source: Authors’ estimation based on NSS and PLFS unit level data.

5
Figure 1: Trends of real wage rates in rural and urban India, 2005-2018
Panel A: For Regular salaried Workers
Panel B: For Casual Labour
Source: Authors Estimation based on NSS and PLFS unit data. Note: The real wages for rural and urban areas are computed after adjusting the Consumer Price Indices (CPI) for Industrial worker (IW) and Agricultural labour (AL) respectively.
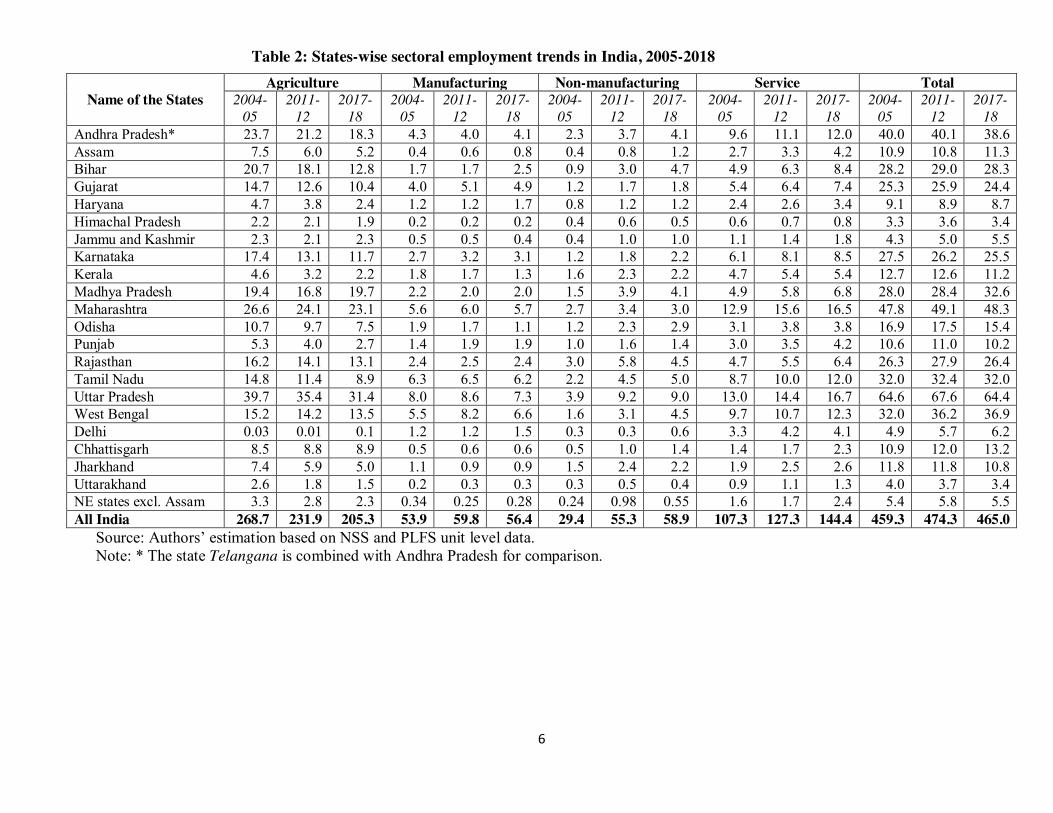
2.2 Falling agriculture and manufacturing employment across the states in India
Falling employment in agriculture and manufacturing sectors is noticed across the states of India
during 2011-12 and 2017-18 (Table 2). Although service sector employment grew in most states,
non-manufacturing sector jobs did not grow much to compensate the employment fall in both
agriculture and manufacturing. As a result, total employment fell in most of states.
The states which ranked top by employment loss numbers during 2011-12 and 2017-18 include:
Uttar Pradesh (3.2 million decline), Odisha (2.1 million), Gujarat (1.5 million), Andhra Pradesh
(1.5 million), Rajasthan (1.5 million), Kerala (1.4 million ), Jharkhand (1 million ), Maharashtra
(0.8 million) and Punjab (0.8 million).
A similar falling trends is observed in youth employment in agriculture, manufacturing and non-
manufacturing sectors across the states. However, most states have registered positive growth of
youth employment in services.
While falling total and youth employment in agriculture is good news from the structural
transformation point of view, falling manufacturing employment and decelerating construction
employment growth are bad news for the economy, which moved up to lower middle income
status just over a decade ago. To sustain the growth of income, improve standard of living, and to
reduce poverty, employment opportunities in manufacturing and construction (although a
transitory sector) is necessary. Because this would not only sustain the structural transformation
process, it would also help sustain growth of GDP over the long run.
42.1 47.8 47.4
183.1
225.9204.9
0.0
50.0
100.0
150.0
200.0
250.0
2 0 0 4 - 0 5 2 0 1 1 - 1 2 2 0 1 7 - 1 8
Rural Urban
15.522.4 23.8
66.0
86.492.6
0.0
20.0
40.0
60.0
80.0
100.0
2 0 0 4 - 0 5 2 0 1 1 - 1 2 2 0 1 7 - 1 8
Rural Urban
6
Table 2: States-wise sectoral employment trends in India, 2005-2018
Name of the States Agriculture Manufacturing Non-manufacturing Service Total
2004-05
2011-12
2017-18
2004-05
2011-12
2017-18
2004-05
2011-12
2017-18
2004-05
2011-12
2017-18
2004-05
2011-12
2017-18
Andhra Pradesh* 23.7 21.2 18.3 4.3 4.0 4.1 2.3 3.7 4.1 9.6 11.1 12.0 40.0 40.1 38.6 Assam 7.5 6.0 5.2 0.4 0.6 0.8 0.4 0.8 1.2 2.7 3.3 4.2 10.9 10.8 11.3 Bihar 20.7 18.1 12.8 1.7 1.7 2.5 0.9 3.0 4.7 4.9 6.3 8.4 28.2 29.0 28.3 Gujarat 14.7 12.6 10.4 4.0 5.1 4.9 1.2 1.7 1.8 5.4 6.4 7.4 25.3 25.9 24.4 Haryana 4.7 3.8 2.4 1.2 1.2 1.7 0.8 1.2 1.2 2.4 2.6 3.4 9.1 8.9 8.7 Himachal Pradesh 2.2 2.1 1.9 0.2 0.2 0.2 0.4 0.6 0.5 0.6 0.7 0.8 3.3 3.6 3.4 Jammu and Kashmir 2.3 2.1 2.3 0.5 0.5 0.4 0.4 1.0 1.0 1.1 1.4 1.8 4.3 5.0 5.5 Karnataka 17.4 13.1 11.7 2.7 3.2 3.1 1.2 1.8 2.2 6.1 8.1 8.5 27.5 26.2 25.5 Kerala 4.6 3.2 2.2 1.8 1.7 1.3 1.6 2.3 2.2 4.7 5.4 5.4 12.7 12.6 11.2 Madhya Pradesh 19.4 16.8 19.7 2.2 2.0 2.0 1.5 3.9 4.1 4.9 5.8 6.8 28.0 28.4 32.6 Maharashtra 26.6 24.1 23.1 5.6 6.0 5.7 2.7 3.4 3.0 12.9 15.6 16.5 47.8 49.1 48.3 Odisha 10.7 9.7 7.5 1.9 1.7 1.1 1.2 2.3 2.9 3.1 3.8 3.8 16.9 17.5 15.4 Punjab 5.3 4.0 2.7 1.4 1.9 1.9 1.0 1.6 1.4 3.0 3.5 4.2 10.6 11.0 10.2 Rajasthan 16.2 14.1 13.1 2.4 2.5 2.4 3.0 5.8 4.5 4.7 5.5 6.4 26.3 27.9 26.4 Tamil Nadu 14.8 11.4 8.9 6.3 6.5 6.2 2.2 4.5 5.0 8.7 10.0 12.0 32.0 32.4 32.0 Uttar Pradesh 39.7 35.4 31.4 8.0 8.6 7.3 3.9 9.2 9.0 13.0 14.4 16.7 64.6 67.6 64.4 West Bengal 15.2 14.2 13.5 5.5 8.2 6.6 1.6 3.1 4.5 9.7 10.7 12.3 32.0 36.2 36.9 Delhi 0.03 0.01 0.1 1.2 1.2 1.5 0.3 0.3 0.6 3.3 4.2 4.1 4.9 5.7 6.2 Chhattisgarh 8.5 8.8 8.9 0.5 0.6 0.6 0.5 1.0 1.4 1.4 1.7 2.3 10.9 12.0 13.2 Jharkhand 7.4 5.9 5.0 1.1 0.9 0.9 1.5 2.4 2.2 1.9 2.5 2.6 11.8 11.8 10.8 Uttarakhand 2.6 1.8 1.5 0.2 0.3 0.3 0.3 0.5 0.4 0.9 1.1 1.3 4.0 3.7 3.4 NE states excl. Assam 3.3 2.8 2.3 0.34 0.25 0.28 0.24 0.98 0.55 1.6 1.7 2.4 5.4 5.8 5.5 All India 268.7 231.9 205.3 53.9 59.8 56.4 29.4 55.3 58.9 107.3 127.3 144.4 459.3 474.3 465.0
Source: Authors’ estimation based on NSS and PLFS unit level data. Note: * The state Telangana is combined with Andhra Pradesh for comparison.

7
2.3 Mounting youth unemployment causes an upsurge in the disheartened labour force
Labour force and LFPR declined
The labour force (those looking for work) increased only by about 10 million to reach 495 million
during 2017-18, because both Labour Force Participation Rate (LFPR, or share of those in working
age looking for work) and Work Participation Rate (WPR, or share of those looking for work actually
finding work) declined from 39.5 percent to about 37 percent, and 38.6 percent to about 34.7 percent
respectively between 2011-12 and 2017-18. For youth, LFPR fell from 44.6 percent to 38.3 percent,
and WPR fell from 42 percent to 31.4 percent during the same period (Table 1) – an indicator of
disheartened workers.
The declining overall LFPR is mainly due to the drastic drop of the female LFPR, which declined
from about 29 to 22 percent between 2004-05 and 2011-12 and further to 18 percent by 2017-18
(Figure 2: Panel A). While the female LFPR in urban areas declined marginally from 18 percent to
about 16 percent during 2005 and 2018 (with about 0.5 percentage point rise during 2011-12 and 2017-
18, a good news), a steady fall in rural female LFPR pulled the overall female LFPR down to a
historically low level. What is tragic is that education levels of youth, especially of girls, have risen
rapidly since the mid-noughties; the falling LFPR of youth indicates that rising expectations will meet
the wall of dashed hopes.
Although agricultural mechanization and the process of structural transformation in rural areas
(Himanshu, 2012; Mehrotra et al., 2014) affected the female LFPR severely, it was expected to bounce
back and rise, as large number of girls were attending schools and secondary education, who would
want to work outside the home (Hirway, 2012; Mehrotra and Parida, 2017). Secondary enrolment rose
to over 80 per cent between 2010 and 2016, with gender parity. But unfortunately, the evidence is that
work outside the home did not materialise. Rather, the LFPR of young women declined further from
low (about 24 percent) to very low (about 16 percent) level during 2011-12 and 2017-18 (Figure 2:
Panel B). For women, the job market offers few opportunities in rural areas, but is also tight in urban
areas, as their LFPR in urban areas has also been declining consistently.
Even though the overall male LFPR was almost constant at about 56 percent, the LFPR of male youth
population shows a consistent decline since 2004-05. It declined from 75 percent to 64 percent during
2004-05 and 2011-12, and further to 59 percent during 2017-18. (In rural areas, it declined from 77

8
percent to about 59 percent, while in urban areas it declined from 68 percent to about 59 percent.)
Even though this substantial decline is partly explained by rising enrollment in higher education, a
massive rise in open unemployment among educated youth reflects the fact that the current job market
is not capable of accommodating the youth. Educated unemployment increased to unprecedented
levels.
Figure 2: Overall and youth LFPR trends by sector and gender in India, 2005-2018
Panel A: Overall LFPR (%)
Panel B: Youth LFPR (%)
Source: Authors’ calculation and plot based on NSS and PLFS unit level data.
Educated youth unemployment increased massively
The overall unemployment rate (based on CWS) increased to an all-time high of 8.8 percent from 3
percent between 2011-12 and 2017-18 (Table 1). The open unemployment rate of the overall
population also (based on UPSS) increased from 2.2 percent to 6.1 percent; unemployed persons
increased from mere 10.6 to 30.1 million (3.25 million pa rise). Youth unemployment (based on CWS)
increased from 6.8 to 21.4 percent, while the open unemployment rate (based on UPSS) increased
from 6.1 to 21.4 percent during 2011-12 and 2017-18 (Table 1). The number of open unemployed
youth jumped from 9 to 25 million (Table 3).
0
20
40
60
Male Female Rural Male Rural Female Urban Male Urban Female
56
29
56
33
57
18
56
22
55
25
56
15.5
56
18
55
18
57
16
2004-05 2011-12 2017-18
0
20
40
60
80
Male Female Rural Male Rural Female Urban Male Urban Female
75
37
77
43
68
22
64
24
65
27
61
18
59
16
59
16
59
17.5
2004-05 2011-12 2017-18

9
For each level of education, the unemployment rate increased by 2017-18 (Figure 3): among
illiterates to 7.1 percent to 8.3 percent for youth having upto primary education, 13.7 percent with
middle education, 14.4 percent with secondary, 24 percent with higher secondary education, 35.8
percent for graduates and 36.2 for post graduates. Moreover, for the graduates with technical education
degree the unemployment rate was the highest (37.3 percent). In the case of formally vocationally
trained this rate was 33 percent. The incidence of unemployment almost doubled between 2011-12
and 2017-18 across the education categories.
Figure 3: Youth unemployment rates by level of education in India, 2012-2018
Source: Authors’ calculation and plot based on NSS and PLFS unit level data.
The states which contributed to this massive rise in open unemployed include: Uttar Pradesh (3.6),
Andhra Pradesh (2.2), Tamil Nadu (2.2), Maharashtra (1.9 million), Bihar (1.9), West Bengal (1.5),
Madhya Pradesh (1.3), Karnataka (1.2 ), Rajasthan (1.2), Odisha (1.1), Gujarat (1), Kerala (1 ) (all
millions).. Although in terms of the absolute number of unemployed, North-Eastern states like
Nagaland, Manipur, Mizoram and Arunachala Pradesh were much behind, in terms of the
unemployment rate these states were among the top ranked states of India. Kerala ranked the top in
terms of the incidence of open unemployment – not surprising given its high level of education. (Table
3).
All states are registering fall in agricultural employment, so this unemployment problem is expected
to mount further, unless non-farm jobs are created.
0
10
20
30
40
Illiterate UptoPrimary
Middle Secondary HigherSecondary
Graduate PG andAbove
WithTechnical
degree
VocationalEducation
Total
1.7 3.0 4.5 5.9
10.8
19.221.3
18.8 18.5
6.17.1 8.3
13.7 14.4
23.8
35.8 36.2 37.333.0
17.8
2011-12 2017-18

10
Table 3: Youth (age 15 to 29 years) unemployment and NLET in Indian states, 2005-2018
Name of the States
Open Unemployment rate (%)
Open Unemployed (million)
Not in Labour Force, Education and Training
(million) 2004-
05 2011-
12 2017-18 2004-05
2011-12
2017-18 2004-05 2011-
12 2017-
18 Andhra Pradesh* 3.2 5.9 18.9 0.5 0.7 2.2 4.2 5.3 5.8 Assam 7.8 15.0 27.0 0.3 0.5 0.8 2.0 2.5 2.6 Bihar 5.4 9.8 22.8 0.4 0.8 1.8 6.7 8.9 10.9 Gujarat 2.4 1.3 13.3 0.2 0.1 1.0 3.2 4.2 5.2 Haryana 6.3 8.1 20.7 0.2 0.3 0.8 1.6 2.1 2.4 Himachal Pradesh 4.7 4.0 18.4 0.06 0.04 0.17 0.1 0.2 0.3 Jammu & Kashmir 6.0 9.5 15.0 0.1 0.1 0.2 0.4 0.4 0.5 Karnataka 2.8 4.4 15.8 0.3 0.3 1.2 3.3 4.3 5.0 Kerala 28.2 20.6 36.3 1.3 0.7 1.0 1.7 1.8 1.3 Madhya Pradesh 2.1 2.6 12.0 0.2 0.2 1.3 3.9 4.8 5.9 Maharashtra 4.7 3.8 15.0 0.8 0.6 1.9 5.5 6.6 7.2 Odisha 12.5 6.5 23.6 0.9 0.3 1.1 2.9 3.2 3.8 Punjab 10.0 5.8 21.6 0.4 0.2 0.7 1.6 2.0 2.0 Rajasthan 2.7 2.9 14.3 0.3 0.3 1.2 3.1 4.0 5.6 Tamil Nadu 5.2 7.8 25.6 0.5 0.7 2.2 3.3 4.5 4.1 Uttar Pradesh 2.7 4.3 16.7 0.6 1.0 3.6 13.8 16.2 20.7 West Bengal 7.7 8.8 13.2 0.9 1.0 1.5 7.5 6.9 8.8 Delhi 10.4 11.3 22.2 0.2 0.2 0.5 1.0 1.0 1.6 Chhattisgarh 2.0 4.1 10.1 0.1 0.1 0.4 0.9 1.1 1.5 Jharkhand 5.5 7.7 20.4 0.2 0.3 0.7 1.7 2.4 3.0 Uttarakhand 5.1 10.2 27.5 0.1 0.1 0.2 0.4 0.4 0.7 NE states excl. Assam 9.0 16.3 26.0 0.2 0.3 0.4 0.6 0.6 1.0 All India 5.4 6.1 17.8 8.9 9.0 25.1 69.5 83.7 100.2 Source: Authors’ estimation based on NSS and PLFS unit level data. Note: * The state Telangana is combined with Andhra Pradesh.
Rising disheartened labour force: a potential threat for the economy
The slow growth (or scarcity) of non-farm jobs and the rising open unemployment together have
resulted in a massive increase of disheartened youth. Youth “Not in Labour Force, Education and
Training (NLET)” increased in India by about 2 million per annum during 2004-05 and 2011-12,
which further increased by about 3 million pa 2011-12 and 2017-18. About 100.2 million youth
declared themselves as NLET during 2017-18 (Table 3).
The states in which incidence of unemployment is higher, they also have reported large number of
disheartened labour force in the form of NLET youth. Uttar Pradesh ranked top among the states
having about 21 million NLET youth in2017-18 (Table 3). It is followed by Bihar, West Bengal,
Maharashtra, Madhya Pradesh, Andhra Pradesh, Rajasthan, Gujarat, Karnataka, Tamil Nadu, Odisha,
Jharkhand and Assam.

11
The situation is alarming because an additional 127 million youth (Table 1) are currently attending
education and training (in addition to those currently unemployed or currently NLET). After
completing education/training they would either search for jobs or remain NLET. If they join the
labour market, the unemployment rate would increase further. But if they prefer to remain NLET, it
would increase the volume of disheartened labour force or the so called “potential reserve army”.
These increased NLET youth along with the elderly population (which started growing4) would
constitute the total demographic liability of the economy as a whole. However, if measures are taken
to create non-farm jobs in both rural and urban areas, India could still harness the demographic
dividend.
3. Identifying the sub-sectors responsible for slow growth of non-farm jobs, 2005-2018
In the previous section, we have already explained that both agriculture (4.5 million pa decline) and
manufacturing (0.5 million pa decline) were responsible for 9 million decline of total employment in
India during 2011-12 and 2017-18. Now it is important to explore, which sub-sectors of manufacturing
are responsible for the employment fall in this sector?
Manufacturing employment
We found that most labour intensive subsectors contributed to growing overall and youth employment
in manufacturing during 2004-05 and 2011-12. However, these same subsectors were responsible for
the maximum decline of jobs post 2011-12 (Table 4). The decline occurred in: Food and Beverages,
Tobaco Products, Textile, Wearing Apparel, Wood products and Furniture, Paper and Paper products,
Rubber and Plastic Products, and Jewelry and sports goods etc. Since most businesses in labour
intensive sub-sectors are micro and small units, demonetization and other short term unfavorable
economic conditions might have been responsible for the decline. For sustaining growth of jobs in
these labour intensive subsectors, measures to boost domestic demand along with the export promotion
are needed.
But it is important to note that a few relative capital intensive subsectors have consistently been
contributing to the growth of manufacturing employment, even though their share of total employment
is quite low. These sub sectors include: Machinery Equipment, Electrical and Electronics Machinery,
Motor Vehicles, and Basic Metals (Table 4). These are the subsectors which normally demand
4 Share of elderly population in India increased from 8.6 percent (Census, 2011) to 9.8 percent (PLFS, 2017-18).

12
relatively skilled and professionally trained workers. Boosting growth of employment in these sectors
is very crucial because it is likely to increase the share of regular salaried employment and formal
jobs. But it seems a bit difficult because the capital intensity in these sub-sectors is growing rapidly in
recent years (Rodrik, 2012; Goldar, 2013; Mehrotra et al., 2014). Hence, addressing the skill issues
along with a structured industrial policy are the need of the hour, for boosting growth of jobs in these
sub-sectors (Mehrotra, forthcoming).
Non-manufacturing employment
The top most employment generating subsector of the non-manufacturing sector is construction, which
contributes about 54.3 million (about 92 percent) out of total 59 million jobs in non-manufacturing
during 2017-18 (Table 5). The second and third largest subsectors of non-manufacturing are the
electricity, water and gas supply (2.8 million, about 4.8 percent) and mining of metal ores, coal and
lignite etc. (1.6 million, about 2.7 percent) respectively. Although overall employment in these
subsectors increased, the absolute decline of youth employment in these sectors puts a further
question-mark on their future job prospects, given that their participation in manufacturing
employment has also fallen.
In construction alone, the number of youth employed declined from 17.8 to 16.6 million between
2011-12 and 2017-18. But this sector had registered a 7.1 million increase of youth employment during
2004-05 and 2011-12. Since the non-manufacturing sector has both forward and backward linkages
with the manufacturing sector, an industrial policy aiming to improve manufacturing would have a
knock-on effect on the growth of employment in the non-manufacturing sector. Moreover, this effect
would also likely to boost growth of jobs in modern services (Mehrotra, forthcoming).

13
Table 4: Subsector-wise industrial employment trends in India, 2005-2016.
Type of Industry and Sub-sectors
Total employment (million) Youth employment (million) 2004-05 2011-12 2017-18 2004-05 2011-12 2017-18
Manufacturing Sector Food & Beverages 5.5 6.4 5.9 1.9 2.1 1.7 Tobaco Products 4.7 4.9 3.3 1.9 1.7 1.0 Textiles 9.7 9.2 8.2 4.5 3.9 2.8 Wearing Apparel 7.2 9.6 9.8 3.4 3.8 3.3 Leather Products 1.3 1.3 1.3 0.6 0.5 0.5 Wood Products 5.2 3.9 3.0 1.9 1.2 0.7 Paper Products 0.6 0.5 0.8 0.2 0.2 0.3 Printing Media 0.9 0.6 0.7 0.4 0.2 0.1 Petroleum Products 0.1 0.2 0.2 0.0 0.1 0.1 Chemical Products 2.0 1.2 1.3 0.8 0.4 0.4 Rubber & Plastics 0.8 1.1 1.0 0.4 0.4 0.4 Non-metalic Products 4.5 5.0 4.1 1.5 1.9 1.3 Basic Metals 1.0 1.5 1.8 0.3 0.6 0.5 Fabricated Metals 2.6 3.0 2.8 1.1 1.0 0.9 Machinery Equipment 1.3 1.0 1.3 0.4 0.4 0.5 Electronics Machinery 0.3 0.4 0.5 0.2 0.2 0.2 Electrical Machinery 0.7 1.0 1.4 0.3 0.6 0.4 Medical Instruments 0.1 0.8 0.8 0.1 0.3 0.3 Motor Vehicles 0.6 1.0 1.2 0.3 0.4 0.6 Other Transports 0.4 0.5 0.3 0.1 0.2 0.1 Furniture 4.3 2.4 2.2 2.0 0.7 0.7 Jewelry & Sports goods 0.0 3.3 2.6 0.0 1.2 0.9 Recycling 0.1 1.0 2.0 0.0 0.3 0.7 Manufacturing Total 53.9 59.8 56.4 22.4 22.1 18.5
Non-Manufacturing Sector Mining and Quarrying 2.7 2.6 2.0 0.8 0.9 0.6 Electricity, water and gas 1.2 2.5 2.8 0.1 0.7 0.6 Construction 25.6 50.3 54.3 10.7 17.8 16.6 Non-manufacturing Total 29.4 55.3 58.9 11.6 19.4 17.8
Source: Authors’ estimation based on NSS and PLFS unit level data.
Employment growth in service sectors
Though service sector employment is driven by both traditional and modern services, the traditional
services like retail trade (37.3 million), land transport5 (21 million), public administration and defense
(7.5 million) and whole sale trade (6 million) etc., were still holding a major share (about 48 percent)
of total service sector employment in India. But most recently, these subsectors are showing decline
5 It is mostly includes the traditional transports of tangible goods and people by heavy vehicles (Bus and trucks), cycle rickshaw or auto rickshaw etc. But, it partly also includes the modern transport services in the cities and towns by the light vehicles like taxi and e- rickshaws.
14
of youth employment, with corresponding rise of employment in the modern service subsectors (Table
5).
The modern services (in descending order)- education, art and entertainment, hotel and restaurant
business, and event catering and other food service activities, health and community social services ,
telecommunication, business support service activities, sale, maintenance and repair of motor vehicles,
financial intermediation, computer related activities, research and development, modern auxiliary
transport, real estate services, and insurance and pension funding - have been driving the growth of
overall as well as youth employment in services.
Moreover, the falling youth employment in traditional services and the corresponding rise in modern
services is good news. If this trend continues, the share of formal employment within services will rise
further, as it has already increased in recent years (Figure 4: Panel A, it shows a consistent increase
from 21 to 25.4 percent during 2004-05 and 2011-12, and further to 31 percent by 2017-18).
In a context where both youth educated unemployment and the disheartened labour force are on the
rise policies to promote youth employment (both government and private) in growing service like
education, health and social work, research and development, public administration and defence,
financial intermediation including insurance, and telecommunication etc., would not only create jobs
for educated youth, but increase the share of regular and formal employment in services.

15
Table 5: Sub-sector wise service sector employment generated in India, 2005-2018
Sub-sectors Total employment (million)
Youth employment (million)
2004-05
2011-12
2017-18
2004-05
2011-12
2017-18
Sale, maintenance and repair of motor vehicles 2.5 3.2 3.6 1.4 1.4 1.6 Wholesale trade except motor vehicles 5.1 5.3 6.1 1.6 1.5 1.5 Retail trade except motor vehicles 33.7 35.6 37.3 11.8 9.8 9.3 Hotels & Restaurants 5.8 7.8 8.7 2.0 2.4 2.3 Land transport 15.1 17.5 20.9 5.4 5.1 6.2 Water transport 0.1 0.1 0.2 0.02 0.02 0.04 Air transport 0.1 0.1 0.1 0.02 0.01 0.04 auxiliary transport activities 0.5 0.9 1.2 0.2 0.3 0.3 Post and telecommunications 1.9 4.3 5.3 0.6 1.8 2.1 Financial intermediation 2.1 2.6 3.5 0.6 0.8 1.2 Insurance and pension funding 0.6 1.0 0.7 0.1 0.2 0.1 Activities auxiliary to financial intermediation 0.2 0.8 0.7 0.1 0.2 0.1 Real estate activities 0.5 0.9 1.0 0.04 0.1 0.2 Renting of machinery and equipment 0.5 0.6 0.9 0.2 0.2 0.3 Computer and related activities 0.8 1.5 2.6 0.5 0.3 0.6 Research and development 0.0 1.1 1.3 0.003 0.4 0.4 Other business activities 2.5 2.6 4.6 0.7 0.9 1.4 Public administration and defence 8.3 7.9 7.5 0.8 1.1 1.3 Education 11.1 14.1 17.6 3.4 3.5 3.7 Health & Social work 3.5 4.4 5.6 0.9 1.2 1.5 Other Social Services (art, entertainment, 12.7 15.1 15.3 4.1 4.5 3.5 Total 107.3 127.3 144.4 34.5 35.7 37.6 Source: Authors’ estimation based on NSS and PLFS unit level data.
4. The quality of jobs in non-farm sector is still very poor
First we explore the quality of jobs by examining the types of employment (viz., self-
employment, casual and regular employees), and then the security of employment (formal and
informal) based on the provision of social security benefits.
Rising regular salaried jobs and formal employment: Some good news
In the manufacturing sector, even though self-employment fell (5.5 million) and number of
casual workers (0.7 million)6, the regular salaried employment increased about 3 million. Non-
6 The decline of self-employment in manufacturing and its slow growth in service sector seems to be contrasting to the expectation of increased self-employment due to introduction of the government schemes like “Mudra” and “Pradhan Mantri Kaushal Vikas Yojana (MPKVY)”, and “Deen Dayal Upadhaya Gramin Kaushalya Yojana (DDU-GKY)” etc.

16
manufacturing too shows about 0.8 million rise in regular salaried employment during 2011-
12 and 2017-18. The service sector, however, has shown the maximum rise (17.3 million rise)
in regular salaried workers during 2011-12 and 2017-18 (Table 7).
The increase in regular salaried workers and decline in casual employment are always
desirable; because it is likely to increase the share of formal employment within the non-farm
sector. This result is clearly visible (Figure 4: Panel A) in a rising share of formal employment
in manufacturing (it increased from about 11to 15.5 percent during 2011-12 to 2017-18) and
services (it increased from about 20 to 21.5 percent during 2011-12 to 2017-18).
Although the share of overall formal employment in non-farm sectors increased marginally by
2 percentage points (Figure 4: Panel A), and share of formal employment within organized
sector increased (Figure 4: Panel C), the share of informal sector still holds the major share of
employment (90.7 percent overall and 83.5 percent in non-farm sectors) in India. This result
suggests that a substantial change on the ground is yet to happen to reduce the volume of
informality in India. We argue this could not be achieved without a structured industrial policy.
Organized sector employment declined despite increased registered enterprises
Although the number of registered enterprises increased by 3 million (Table 6) to reach 19.6
million during 2015-167, the numbers employed in the organized non-farm sector actually
declined, as also the organized sector share in total employment (Figure 4: Panel B). This
happened because the number of un-registered enterprises also increased by 3 million to reach
about 44 million (Table 6), and hence its share increased in total employment. Moreover, the
decline of organized manufacturing (about 2.5 million) and non-manufacturing (about 7
million) employment is also responsible for the overall declining share of non-farm organized
sector employment in India during the post 2011-12 periods (Table 6).
7 Also Economic Survey (2018). It claims that the number enterprises under Goods and Services Tax (GST) registration increased during the post GST implementation periods.

17
Figure 4: Sector-wise trends of formal and organized sector employment in India, 2005-2018 Panel A: Share of formal employment by sectors (%)
Panel B: Share of organised sector employment by sectors (%)
Panel C: Share of formal employment within organised sector employment by sectors (%)
Source: Authors’ estimation and plot based on NSS and PLFS unit level data.
0.0
5.0
10.0
15.0
20.0
25.0
Manufacturing Non-manufacturing Service Sector Non-farm Total Total Employment(incl. Agriculture)
10.47.2
19.214.8
6.2
10.9
5.3
19.9
14.4
7.5
15.4
5.2
21.5
16.5
9.3
2004-05 2011-12 2017-18
05
1015202530354045
Manufacturing Non-manufacturing Service Sector Non-farm Total Total Employment(incl. Agriculture)
28.4 31.227.5 28.3
12.7
34.640.4
31.7 34.4
21.4
3226.2
29.9 29.5
18.0
2004-05 2011-12 2017-18
0
20
40
60
80
Manufacturing Non-manufacturing Service Sector Non-farm Total
32.921.4
66.2
49.1
29.7
11.9
60
39.641.1
16.1
63.148.4
2004-05 2011-12 2017-18
18
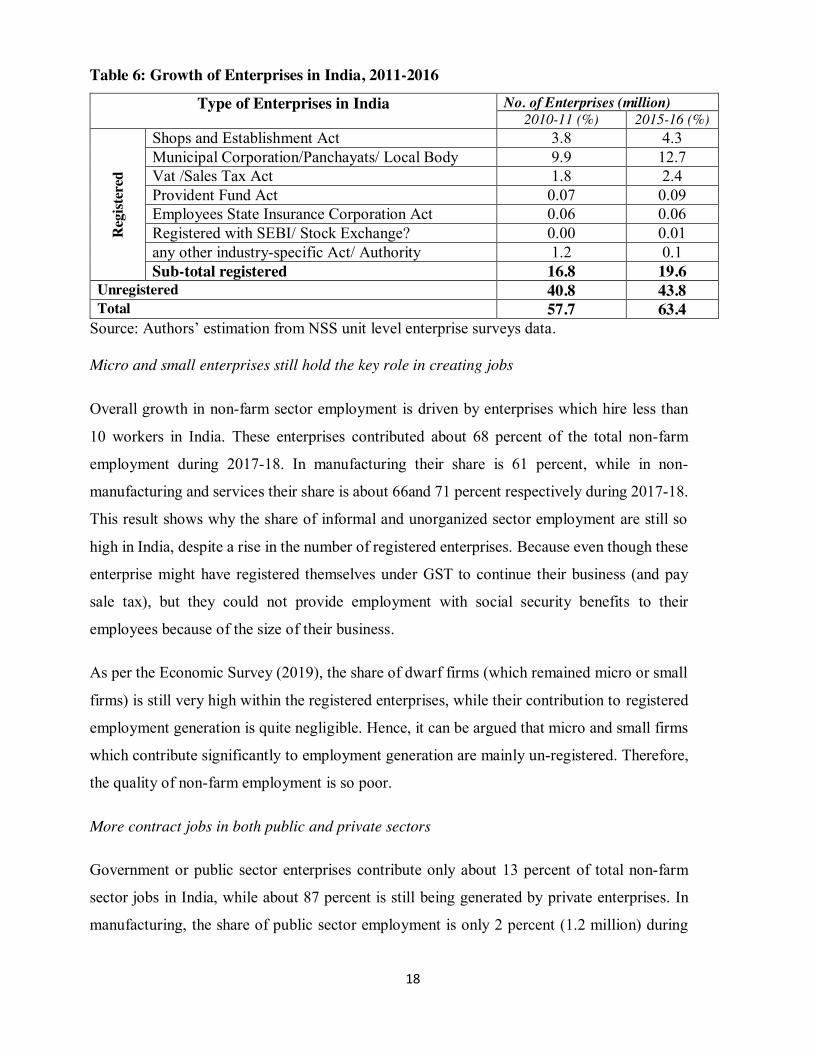
Table 6: Growth of Enterprises in India, 2011-2016
Type of Enterprises in India No. of Enterprises (million) 2010-11 (%) 2015-16 (%)
Reg
ister
ed
Shops and Establishment Act 3.8 4.3 Municipal Corporation/Panchayats/ Local Body 9.9 12.7 Vat /Sales Tax Act 1.8 2.4 Provident Fund Act 0.07 0.09 Employees State Insurance Corporation Act 0.06 0.06 Registered with SEBI/ Stock Exchange? 0.00 0.01 any other industry-specific Act/ Authority 1.2 0.1 Sub-total registered 16.8 19.6
Unregistered 40.8 43.8 Total 57.7 63.4
Source: Authors’ estimation from NSS unit level enterprise surveys data.
Micro and small enterprises still hold the key role in creating jobs
Overall growth in non-farm sector employment is driven by enterprises which hire less than
10 workers in India. These enterprises contributed about 68 percent of the total non-farm
employment during 2017-18. In manufacturing their share is 61 percent, while in non-
manufacturing and services their share is about 66and 71 percent respectively during 2017-18.
This result shows why the share of informal and unorganized sector employment are still so
high in India, despite a rise in the number of registered enterprises. Because even though these
enterprise might have registered themselves under GST to continue their business (and pay
sale tax), but they could not provide employment with social security benefits to their
employees because of the size of their business.
As per the Economic Survey (2019), the share of dwarf firms (which remained micro or small
firms) is still very high within the registered enterprises, while their contribution to registered
employment generation is quite negligible. Hence, it can be argued that micro and small firms
which contribute significantly to employment generation are mainly un-registered. Therefore,
the quality of non-farm employment is so poor.
More contract jobs in both public and private sectors
Government or public sector enterprises contribute only about 13 percent of total non-farm
sector jobs in India, while about 87 percent is still being generated by private enterprises. In
manufacturing, the share of public sector employment is only 2 percent (1.2 million) during

19
2017-18; while in non-manufacturing and services it is about 11 percent (6.3 million) and 18
percent (26.4 million) respectively.
Moreover, within Government and public sector enterprises the number of jobs “without any
written job contract” increased massively during 2017-18 (Table 7). In manufacturing they
increased from 0.2 million to 0.7 million (0.5 million increase), while in services they increased
from 6.5 million to 10.5 million (4 million increase). The number of jobs with a job contract
for “1 year of less” also increased across the sectors, at the cost of jobs with a contract “more
than 3 years”. This pattern is also observed in private sector employment during 2004-05 and
2017-18. This result is consistent with the employment data of the Annual Survey of India
(ASI), which claims that the share of contract jobs in India has increased from 16.5 percent to
35.5 percent during 1997-98 and 2014-15.
The share of employment “without any written job contract” in private manufacturing had
increased from 74 to 77 percent during 2004-05 and 2017-18. In non-manufacturing it
increased from 94.6 to 95.4 percent; while in services it also increased from 73 to 77 percent
during 2004-05 and 2017-18. If informality is defined by lack of social insurance, these are
additional dimensions of informal work that show no signs of change.
Rising informality within government/public sector enterprise
Though the share of informal employment declined marginally during 2011-12 and 2017-18,
it was mainly due to contribution of private sector enterprises. But the share of informal
employment within the government/ public sector actually increased during this period. It was
about 19 percent during 2004-05; increased to 36 percent in2011-12 and remained constant at
36 percent till 2017-18. This trend applies to public sector manufacturing enterprises also
(where it increased from 11 (2004-05), to 14 (2011-12), to a massive of 33 percent during
2017-18. Similar developments occurred in public sector non-manufacturing and services
enterprises.

20
Table 7: Types of employment generated in non-farm sectors in India, 2005-2018
Enterprise type and nature of jobs
Number of workers (million) in non-farm sectors Manufacturing Non-manufacturing Service
2004-05
2011-12
2017-18
2004-05
2011-12
2017-18
2004-05
2011-12
2017-18
By organized and un-organized sector Organized 15.3 20.7 18.1 9.2 22.3 15.4 29.5 40.3 43.2 Unorganized 38.6 39.1 38.4 20.2 32.9 43.5 77.9 87 101.3
By Formal and Informal Employment Formal 5.6 6.5 8.7 2.1 2.9 3.1 20.6 25.4 31 Informal 48.3 53.3 47.7 27.3 52.3 55.9 86.8 101.9 113.4
By Types of Employment Own account worker 18.4 20.7 18.3 4.1 4.8 5.2 42.6 49.2 52.0 Employer 0.8 0.9 1.4 0.3 0.4 1.0 1.8 2.2 3.2 Unpaid family worker 9.5 7.8 4.1 0.4 0.5 0.3 11.1 10.1 7.1 Regular salaried employee 15.9 20.5 23.4 3.0 5.3 6.1 43.6 56.9 74.2 casual workers 9.3 9.9 9.2 21.6 44.3 46.4 8.2 8.8 8.0
By Size of Enterprise (No. of total workers hired) Less than 6 31.4 33.2 29.1 13.4 21.5 27.5 74.4 83.9 89.9 6 and more but <10 4.4 5.5 5.2 3.9 12.0 11.0 6.1 11.0 12.8 10 and more but <20 3.7 4.3 4.1 2.8 6.5 5.4 5.4 7.8 9.6 Twenty and more 13.6 16.5 17.9 8.8 14.7 14.5 18.9 23.7 32.1
By Types of Enterprise Government/Public Sector 0.9 0.8 1.2 2.5 8.9 6.3 19.0 22.1 26.4 Private Sector Enterprises 53 59 55.3 27 46.4 52.7 88.3 105.2 118
By Types of Job Contract
Govt./ Public Sector
No written job contract 0.2 0.2 0.7 1.1 6.5 4.1 4.6 6.5 10.5 Job contract (Below 1 year) 0.02 0.04 0.05 0.06 0.69 0.75 0.40 0.78 1.12 Job contract (1 to 3 years) 0.03 0.01 0.03 0.01 0.06 0.09 0.33 0.51 0.90 Job contract (>3 years) 0.62 0.52 0.41 1.30 1.57 1.31 13.43 14.22 13.90 Subtotal job contracts 0.7 0.6 0.5 1.4 2.3 2.2 14.2 15.5 15.9
Private Sector
No written job contract 20.4 25.6 27.3 21.1 39.4 44.8 27.3 36.4 48.6 Job contract (Below 1 year) 0.4 0.7 1.1 0.1 0.3 0.6 0.6 1.6 1.5 Job contract (1 to 3 years) 0.4 0.5 0.8 0.1 0.1 0.1 0.7 1.2 1.5 Job contract (>3 years) 2.8 2.9 2.2 0.4 0.5 0.4 3.7 4.3 4.2 Subtotal job contracts 3.6 4.1 4.1 0.6 0.9 1.1 5.0 7.1 7.1
Formal jobs by public and private sectors (based on social security benefits) Govt./ Public Sector
Formal 0.8 0.6 0.8 1.5 1.8 1.8 15.8 17.6 19.0
Informal 0.1 0.1 0.4 1.0 7.1 4.5 3.2 4.5 7.5
Private Sector
Formal 4.8 5.9 7.9 0.6 1.1 1.3 4.7 7.8 12.1 Informal 48.2 53.1 47.3 26.3 45.3 51.3 83.6 97.4 105.9
Source: Authors’ estimation based on NSS and PLFS unit level data.

21
5. Concluding Remarks
Here we summarise the findings, and avoid offering policy suggestions in the interest of space (and
since we have done so elsewhere, Mehrotra and Guichard (forthcoming). Falling total employment is
an unprecedented trend seen from 2011-12 to 2017-18. Due to a decline of employment in agriculture
and manufacturing and slow growth of construction jobs, the process of structural transformation,
which had gained momentum post-2004-5, has stalled since 2012. Mounting unemployment of
educated youth, and poor quality of non-farm jobs have caused an increase in the disheartened labour
force.
Though the share of regular and formal employment increased marginally, most jobs are still generated
by micro and small units of the unorganized and private sectors. In contrast, the number and share of
informal jobs within government/public sector increased. Moreover, contract jobs and jobs without
out any written job contract increased massively in both government and private sectors.
Not surprisingly, real wages have not increased between 2011-12 and 2017-18 in neither rural nor
urban areas. A comprehensive employment policy combined with an industrial policy is necessary to
address agrarian transformation, boost real wages in rural areas, ensuring industrial development,
taking skill issues into consideration.
References
Bhalla, S. S. & Bhasin, K. (2019). Rethink poverty — and policy, Indian Express (News Paper), June 29.
Economic Survey. (2018). A New, Exciting Bird’s-Eye View of the Indian Economy Through the GST, Economic Survey 2017-18, Ministry of Finance, Government of India, Volume I, Chapter 2, pp.32-42.
Economic Survey. (2019). Nourishing Dwarfs to become Giants: Reorienting policies for MSME Growth. Economic Survey 2018-19, Ministry of Finance, Government of India, Volume I, Chapter 3, pp.57-77.
Goldar, B. (2013). Determinants of Import Intensity of India’s Manufactured Exports Under the New Policy Regime. Indian Economic Review, 48(1), 221-237.
Himanshu (2011). Employment Trends in India: A Re-examination. Economic and Political Weekly, 46 (37), 43-59.
Hirway, I. (2012). Missing Labour Force: An explanation. Economic and Political Weekly, 47 (37), 67-72.
Kannan, K.P. & G. Raveendran. (2012). Counting and Profiling the Missing Labour Force. Economic and Political Weekly, 47(6), 77-80.

22
Mehrotra, S. and S. Guichard (forthcoming), Planning India’s Development in the 20th Century and Beyond, Cambridge University Press.
Mehrotra, S. & Parida, J. K. (2017). Why is the labour force participation of women declining in India?. World Development, 98, 360-380.
Mehrotra, S., Parida, J., Sinha, S., & Gandhi, A. (2014). Explaining employment trends in the Indian economy: 1993-94 to 2011-12. Economic and Political Weekly, 49(32), 49-57.
Rangarajan, C., Kaul, P. I., & Seema. (2011). Where is the missing labour force? Economic and Political Weekly, 46 (39), 68-72.
Rodrik, D. (2012) “No More Growth Miracles”, Project Syndicate, Cambridge, available athttp://www.project-syndicate.org/commentary/no-more-growth-miracles-by-dani-rodrik, accessed on 20/06/2013.
Thomas, J. J. (2012). India's labour market during the 2000s: Surveying the changes. Economic and Political Weekly, 47(51), 39-51.
Annexure 1: Comparing the sample sizes of NSS and PLFS based on the new criterion
No of persons with secondary &
above level of education
Actual Sample size (individuals)
61st Round (2004-05) 68th Round (2011-12) PLFS (2017-18)
Rural Urban Total Rural Urban Total Rural Urban Total
Zero 230,112 (57.8)
82,073 (40.07)
312,185 (51.79)
118,130 (42.07)
48,097 (27.29)
166,227 (36.37)
54,322 (22.01
36,255 (19.44)
90,577 (20.9)
One 76,268 (19.16
38,002 (18.55)
114,270 (18.96)
61,462 (22)
33,945 (19)
95,407 (21)
116,517 (47.21
40,399 (21.66)
156,916 (36.21)
Two and more 91,645 (23.02)
37,153 (18.14)
128,798 (21.37)
101,171 (36.03)
41,733 (23.68)
142,904 (31.27)
75,970 (30.78
47,008 (25.2)
122,978 (28.38)
Three and more 47,580 (23.23)
47,580 (7.89) 52,461
(29.77) 52,461 (11.48) 62,868
(33.7) 62,868 (14.51)
Total Sample (Row %)
398,025 (66.03)
204,808 (33.97)
602,833 (100)
280,763 (61.44)
176,236 (38.56)
456,999 (100)
246,809 (56.96)
186,530 (43.03)
433,339 (100)
Source: Tabulated from NSS and PLFS unit data Note: The column percentages are given in the parentheses except the last row.