Embed Size (px)
Citation preview
8/7/2019 Indian_GAAP_07-08
http://slidepdf.com/reader/full/indiangaap07-08 1/125

8/7/2019 Indian_GAAP_07-08
http://slidepdf.com/reader/full/indiangaap07-08 2/125
CONTENTS
Board of Directors
Management’s Discussion and Analysis
Directors’ Report Corporate Governance
CEO Declaration on Code of Conduct
CEO & CFO Certificate
Financial Statements
Indian GAAP Standalone
Consolidated Statements
Statement under Section 212 1
Statement regarding Subsidiary Companies 1
8/7/2019 Indian_GAAP_07-08
http://slidepdf.com/reader/full/indiangaap07-08 3/1252
Auditors
Price Waterhouse
Chartered Accountants
Gurgaon
Bankers
Citibank, N.A.Citibank, N.A.Citibank, N.A.Citibank, N.A.Citibank, N.A.
Global Corporate & Investment Banking
DLF Centre, 5th Floor
Parliament Street
New Delhi–110 001
Deutsche Bank AGDeutsche Bank AGDeutsche Bank AGDeutsche Bank AGDeutsche Bank AG
Corp. Office – DLF Square
4th Floor, Jacaranda Marg,
DLF City, Phase – II
Gurgaon-122 002
Standard Chartered BankStandard Chartered BankStandard Chartered BankStandard Chartered BankStandard Chartered Bank
Corporate & Institutional Banking
Credit Operations, India
H -2, Connaught Circus
New Delhi–110 001
ICICI Bank LimitedICICI Bank LimitedICICI Bank LimitedICICI Bank LimitedICICI Bank Limited
ICICI Tower
NBCC Place, Bhisham Pitamah Marg
Pragati Vihar
New Delhi–110 003
HDFC Bank LimitedHDFC Bank LimitedHDFC Bank LimitedHDFC Bank LimitedHDFC Bank Limited
B-6/3, Safdarjung Enclave
DDA Commercial Complex
Opp. Deer Park
New Delhi-110 029
BOARD OF DIRECTORS
MR. SHIV NADARMR. SHIV NADARMR. SHIV NADARMR. SHIV NADARMR. SHIV NADAR
Chairman & Chief Strategy Officer
MR. VINEET NAYARMR. VINEET NAYARMR. VINEET NAYARMR. VINEET NAYARMR. VINEET NAYAR
CEO & Whole-time Director
MR. T. S. R. SUBRAMANIANMR. T. S. R. SUBRAMANIANMR. T. S. R. SUBRAMANIANMR. T. S. R. SUBRAMANIANMR. T. S. R. SUBRAMANIAN
Non-Executive Director
MS. ROBIN ABRAMSMS. ROBIN ABRAMSMS. ROBIN ABRAMSMS. ROBIN ABRAMSMS. ROBIN ABRAMS
Non-Executive Director
MR. AJAI CHOWDHRYMR. AJAI CHOWDHRYMR. AJAI CHOWDHRYMR. AJAI CHOWDHRYMR. AJAI CHOWDHRYNon-Executive Director
MR. SUBROTO BHATTACHARYAMR. SUBROTO BHATTACHARYAMR. SUBROTO BHATTACHARYAMR. SUBROTO BHATTACHARYAMR. SUBROTO BHATTACHARYANon-Executive Director
MR. AMAL GANGULIMR. AMAL GANGULIMR. AMAL GANGULIMR. AMAL GANGULIMR. AMAL GANGULI
Non-Executive Director
MR. P. C. SENMR. P. C. SENMR. P. C. SENMR. P. C. SENMR. P. C. SENNon-Executive Director
8/7/2019 Indian_GAAP_07-08
http://slidepdf.com/reader/full/indiangaap07-08 4/125
8/7/2019 Indian_GAAP_07-08
http://slidepdf.com/reader/full/indiangaap07-08 5/1254
Chart 4
IT/BPO Exports FY06 FY06 FY07 FY07 Growth
by Geography Split Revenues Split Revenues (FY06 to
FY07)
US 66.5% 15.7 61.4% 19.2 22%
UK 15.3% 3.6 17.8% 5.6 54%
Continental Europe 9.8% 2.3 12.3% 3.8 66%
APAC 7.1% 1.7 6.4% 2.0 20%
RoW 1.3% 0.3 2.1% 0.7 114%
Total 23.6 31.3 33%
(Revenues Numbers in USD Billion)
Source: NASSCOM Strategic Review 2008, NASSCOM StrategicReview 2007, HCL Analysis
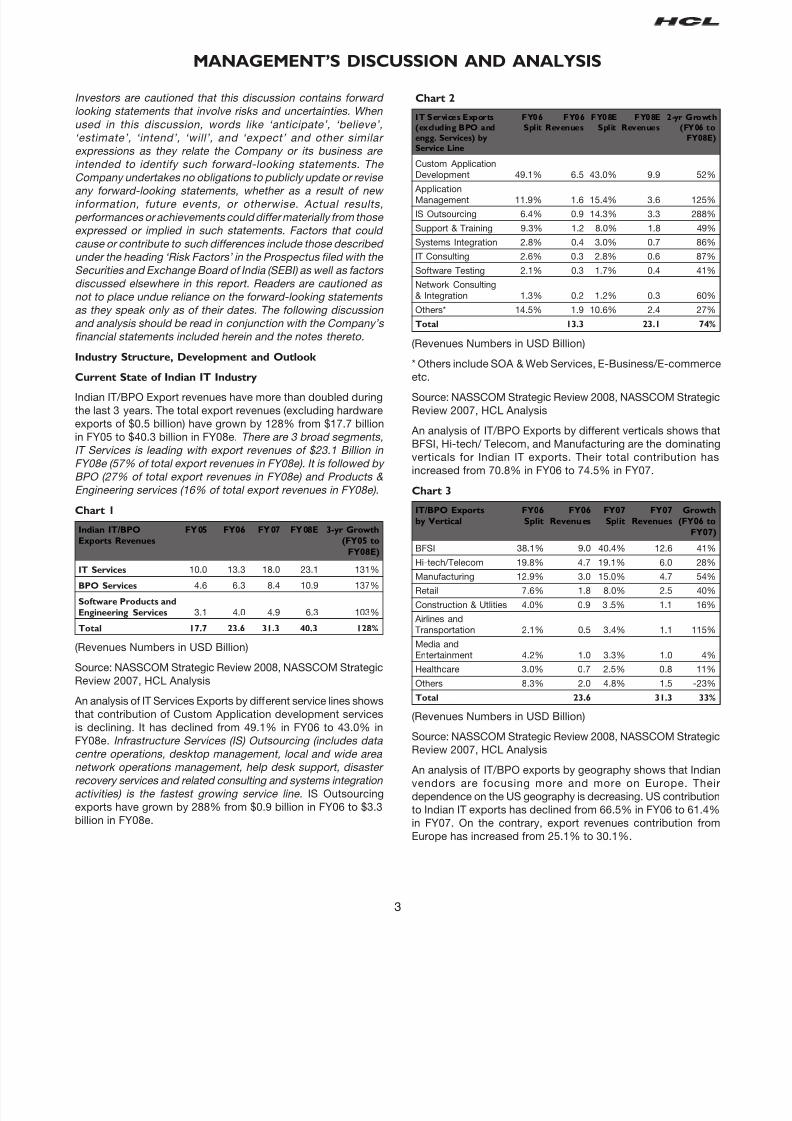
Drivers for Future Growth
The drivers for global sourcing are likely to remain strong in the
near future. There are three primary drivers for global sourcing:
1. Reduction in Costs – Cost pressures will remain strong ascustomers demand more value and businesses are facedwith increasing global competition. A potential economicslowdown in the near future could force businesses to cut
costs even further.
2. Access to new Talent pools – Developed countries arealready facing skill shortages in many areas such asmainframe computing, analytics, and engineering R&Dwhich need to be filled by sourcing globally. From amedium-to-long term perspective, the ageing populationin most developed countries will intensify talent crunchacross business and technology.
3. Improvements in specific aspects of business other thancosts – Business improvements will become increasinglycritical as companies touch minimum cost thresholds butremain under pressure to continuously improve financialperformance. Need for differentiation in the lines such asquality, customer satisfaction and speed-to-market willgain importance as the competition increases.
Apart from these core drivers, following 3 factors will furtheradd to the momentum of global sourcing:
1. Increase in Technology-related spending (including thespending on technology enabled business processes).
2. Propensity to outsource IT and business processes.
3. Conduciveness of the business environment in the sourcingdestinations.
Industry Outlook
o As per NASSCOM Strategic Review 2008, Worldwide ITOutsourcing Market is expected to grow from $183 Billionin 2007 to $242 Billion in 2011 at a CAGR of 7.2%. At thesame time, The BPO market is expected to grow from $462Billion in 2007 to $677 Billion in 2011 at a CAGR of 10%.
o As per NASSCOM-BAH study titled ‘Globalization ofEngineering Services – The next frontier for India’,Worldwide Offshored Engineering Services Market willgrow to $60 Billion by 2010. Out of that, India will have ashare of 20-25 percent share and expected marketpotential for India is $12 to $16 billion.
o As per NASSCOM Strategic Review 2008, the currenlow levels of market penetration reflect enough headroofor growth. The total value of technology-related servicfrom offshore locations is expected to reach $70-76 billiin FY08. Of that, India has a share of nearly 55%. Yet, trepresents less than a fifth of the current global markpotential for these services, which is estimated at over $3billion.
o US and UK markets would continue to dominate the glo
IT services spending with 75% share estimated for 201In APAC, Japan is a large untapped market for Indianvendors.
o To compete globally, Indian IT vendors would develcompetencies in the consulting space since consultiengagements increasingly trickle down to large deals.
o The BPO and Infrastructure sectors are 3-4 times the sof application development and maintenance. They alikely to be key focus areas of growth given their abilityaddress the talent shortage with acceptance of graduatnot limited to professionally qualified workforce.
o In the Infrastructure Management Services space, t
reducing hardware costs are offset by the increasing labocosts. Clients therefore prefer IT vendors who do not taover assets but are able to deliver services remotely in locost countries. Remote infrastructure delivery would likform a key component of large sized outsourcing dealsfuture.
o In the BPO space, non voice and platform basassignments would likely dominate and the Indian vendors are geared well to capitalize on the opportunitihaving steadily built capabilities in the past few years.
o With business transformation playing an important rolesourcing deals, Outcome-based pricing/output baspricing that aligns sourcing interests is increasingly gaini
acceptance. Revenues in such arrangements depend the value provider can add. Providers are expected to ptheir skin into the game.
o Continued growth across product development aengineering services reflects India’s increasing role in globtechnology IP creation; India would become a strateghub for R&D, accounting for a growing proportion of GlobProduct development resources.
o Larger deals are likely to be unbundled resulting in reducdeal size for incumbents while still being bigger for IndiIT. This could be challenging for incumbents and serve an opportunity for Indian IT vendors since the former mneed to prove cost and delivery advantages for execut
of such deals. Moreover, the earlier advantage of takiover people / assets may no longer hold good.
o India’s attractiveness as a preferred destination for toffshore model is not expected to be much dented evagainst the backdrop of emerging low cost locations liLatin America, East Europe and China. India woucontinue to dominate with the potential skilled workforcThe talent pool is large and growing steadily; while gapstalent suitability are challenges, they are being addressby strong provider-level efforts on skill developmeMoreover, there is no other global sourcing destinati

8/7/2019 Indian_GAAP_07-08
http://slidepdf.com/reader/full/indiangaap07-08 6/1255
that offers a comparable suite (IT services/BPO/
engineering services/ software product licensing/
development) and scale of services.
Company Overview
(Information provided in this section pertains to HCL
Technologies Ltd and its subsidiaries on a consolidated basis)
About HCL Technologies Limited
HCL Technologies Ltd (“HCL or the Company”) is one of India’sleading global IT services companies providing software-led IT
solutions, remote infrastructure management services and
Business Process Outsourcing (BPO) services. HCL has been in
operation since 1999 and focuses on transformational outsourcing,
working with clients in areas that impact and re-define the core of
their business. The company leverages its extensive global
offshore infrastructure spread across 60 locations and its global
network of offices in 18 countries to deliver solutions across select
verticals like Financial Services, Retail & Consumer, Life Sciences
and Healthcare, Hi-Tech, Telecom and Media & Entertainment.
HCL has established key business relationships with clients across
geographies belonging to Fortune 500/1000 category offering mix
of IT and BPO services.
in each of its service lines long term perspective. Today, each
these service lines has a robust and resilient business model
place.
Service Offerings
HCL offers a diversified portfolio of service offerings as defined
below. It is important to note that no single service line
contributes more than 37% to the total revenue, while maintaining
a leading edge in key verticals where the company has chosen
to focus. Moreover, HCL has built sustainable business models
1. Custom Application Services
Customized software and applications are transformi
the way organizations are doing businesses to achieve th
specific objectives. Recognizing the growing industry ne
of custom applications and outsourcing requirements, HC
is committed to provide world-class applicati
development, maintenance, and consulting outsourcin
services to satisfy customers to help increase th
productivity and minimize their total cost of ownersh
The service line accounts for 36.5% to the total revenu
HCL offers services ranging from custom applicati
development, deployment, and integration to maintenanc
and production support. HCL was one of the first to bri
multi-service delivery capability that combines customiz
application services with other key services like packag
application services, remote infrastructure manageme
and enterprise transformation services.
The company adds value to customer’s businessenabling IT technology transformation that brings transiti
and transforms approach with unique combination of m
service capability, outcome based pricing, tools a
methodologies like ASSETTM for transition.
With a focus on quality and keeping with the custome
information security requirements, all company softwa
development centers are certified with ISO 9001:200
Level 5 of Software Engineering Institute’s Capabil
Maturity Model (CMM Level 5) standards, and Briti
Security Standard—BS7799.
2. Engineering and R&D Services
Engineering and R&D Services account for 25.5% of t
Company’s revenues. HCL understands the importan
of Research & Development (R&D) for its custome
businesses and is committed to provide world-class R&
and Technology Services to them. HCL offe
comprehensive range of R&D and Engineering services
component vendors, OEMs, ODMs and ISVs acro
multiple industry segments and domains. The compa
has a proven track record in providing “end to e
solutions” that span concept to manufacture and ability
consistently deliver complex and critical products.
15%

8/7/2019 Indian_GAAP_07-08
http://slidepdf.com/reader/full/indiangaap07-08 7/1256
With its significant product engineering strength and
experience, HCL provides full lifecycle product engineering
services, spanning from requirements definition to
prototype architecture, development, testing, and
manufacturing technical help desk to field support,
maintenance and upgrades.
Other services offered include unique integrated services
that span hardware, software, electronic packaging, and
value-added services to customers, especially in mission-
critical, complex product engineering areas. Our
investments in test labs (the first private sector lab in India),
tools, and infrastructure coupled with our rich portfolio of
reusable components help to reduce both cost and time-
to-market.
HCL has initiated the first real business outcome based
engagement model - Global Risk Reward Partnership
(GRRP). GRRP is based on the fundamental of joint
outcome ownership of a product. HCL has successfully
partnered with global technology leaders to positively
influence revenues of their products under a risk-reward
sharing partnership.
HCL offers a unique end-to-end Software as a Service(SaaS) offering which encompasses consulting,
development, hosting and management through integrated
SaaS. This integrated offering speeds up the time to market
by 40%. HCL’s SaaS offerings leverage HCL’s investments
in SaaS such as ‘Agora’ SaaS Delivery Platform and more
than a decade of SaaS experience with 80+ clients.
3. Enterprise Application Services (EAS)
This service accounts for about 11.1% of the Company’s
revenue. HCL’s Enterprise Application Services line of
business is focused on providing package and platform-
led services ranging from blue printing, development,
deployment, global rollouts, helpdesk support, to
application maintenance in areas such as ERP, CRM, SCM,
and Middleware. The EAS group uses a platform-focused
approach to provide technology-based business
optimization.
Technology-based business optimization is the
cornerstone of HCL’s enterprise applications line of
business that is achieved through Stage-based offerings
and Process-driven optimization. Stage-based offerings
are focused on application consolidation, global single
instance, platform development, and service enablement,
while Process-driven optimization deals with processes
like partner integration, unified customer view and single
sign-on to deliver business optimization.
Some of the EAS unique service offerings include State-
based offerings like Upgrade Competency Center and
eZ.Migrate, Integrated offerings like iERP (integrated
applications, infrastructure and helpdesk support),
Competency-based offerings like Middleware integration
competency center for WebMethods and Tibco, SOA-
driven integration etc., Platform-based services like SAP
NetWeaver and Fusion Middleware and Consulting
services like Application Portfolio Optimization and
platform section.
HCL enjoys multi-faceted relationships and high-lev
strategic partnerships with some of the biggest ISVs a
IT and Technology firms like Microsoft, SAP, Orac
TIBCO, etc. HCL has recently joined the SAP Global Partn
– Services program where both firms teamed up for soluti
definition and co-develop new and extended functionalit
to implement enterprise SOA based services.
4. Enterprise Transformation Services (ETS)
The competitive environment with increasing customdemand for innovation and higher value is transformi
the current business processes in all the industries. T
clients are looking for new business models that are align
to changed business scenario to improve productivi
efficiency, market share and profitability in the mark
place. HCL’s ETS practice offers Business Consulti
services to customers to satisfy the demand of innovati
and higher value of their customers.
HCL’s ETS group offers services that bring Busines
Technology, Application and Data Transformation
customers. Services like Application Portfolio Optimizati
and Management analyzes and audits the application
and develops a business plan that aligns applications w
business needs and organizational objectives.
HCL offers end-to-end data warehouse & Busine
Intelligence (DW/BI) services at all levels of enterpri
through unique Data Transformation Methodology (DT
and reduces the complexity of data view across vario
data types and complex business processes.
Quality Process Consulting services offer proce
improvement services that span the entire continuu
ranging from Process definition, implementation & traini
to Process assessments for model and non-model bas
improvement initiatives.
HCL’s Technology Transformation Services are design
to ensure that IT systems are optimized and managed
transform business functions and ensure operation
efficiency.
5. Infrastructure Management Services (IMS)
HCL is the pioneer of Infrastructure Management Servic
(IMS) in India since 1993 and today, it is one of the faste
growing service line at HCL. HCL’s IMS pioneeri
leadership has been recognized by various independe
analyst and media firms. This year HCL’s IM
was acknowledged by Brown & Wilson Global User Surv
2008 as World’s No. 1 Infrastructure Outsourci
Vendor. HCL has been rated as leader in Global Delive
Infrastructure Management Wave, June 07.A focused player in the IT services arena, HCL
Infrastructure Management Services seek to provi
simplified infrastructure solutions through delivering hig
performance management services for comple
distributed infrastructure environments encompassing t
Internet, Client and legacy based infrastructure
HCL’s IMS accounts for about 15% of the Compa
revenues. It has, over the past few years, evolved into
“End-to-End” Remote Infrastructure Services provid

8/7/2019 Indian_GAAP_07-08
http://slidepdf.com/reader/full/indiangaap07-08 8/1257
HCL has grown from being a pure play IT Operations player
to offering “Design - Implement - Operate” services across
the IT Infrastructure Lifecycle.
HCL addresses the growing demand for the cost-effective
management of technology infrastructure across
geographically dispersed locations. With a mission to
develop innovative solutions for enterprises worldwide, the
company has developed and pioneered a unique model
for Remote IT infrastructure management that enables
customer organizations to achieve superior infrastructureperformance and significantly reduced costs.
HCL’s Remote Infrastructure Management (RIM) services
provide a single window that cater all IT infrastructure
needs and aim at transforming the IT infrastructure of
customers that not only ensure a well managed
Infrastructure support services but also provide competitive
advantage by delivering more value to the end user.
The company’s IMS services include, End User Computing,
Datacenter, Network Services, Information Security
Services, Pioneer IOMC and emerging areas like IT Service
Management. These services are delivered through an ISO
9002, ISO 27001 and ISO 20000 certified Operations
Management Center to 70+ G1000 companies from various
industries such as manufacturing, hi-tech, retail, banking
and finance, pharma and automobiles.
6. Business Process Outsourcing (BPO)
HCL’s BPO services contribute to about 11.9% of the
company’s revenue. HCL BPO focuses on a combination
of voice and non voice based processes that relate to:
• Business Generation (Contact Scoring/Customer
acquisition/Post Sales Service) ,
• Operations Management (Technical desk support/
Procurement Services/Transaction Processing /
Collection Services etc) and,
• Management Support (Primary/Secondary Research/
Data Analysis and Modeling)
The driving objective is to enhance business performance
of clients while at the same time cost optimization through
matured off shoring processes. HCL BPO has made
significant investments in its service delivery capabilities
like technology, human resources, intellectual property and
capacity. The suite of BPO services is configured to
address the generic and specific requirements of existing
and potential client base. HCL BPO has vertical driven
business strategy spanning verticals such as Telecom,
BFSI, Retail and Hi Tech. The division boasts of global
delivery centers in India and abroad compliant with ISO27001 security standards as also ISO 9001-2000 standards
in addition to other quality accreditations and standards.
The HCL Strategy
Differentiation Strategy
During the early phase of the Transformation journey, HCL
spotted an inflection point in the industry driven by a need for
transformation, dissatisfaction with large deals, an insatiable
desire to optimize and reduce cost, performance based pay and
increased adoption of Global Delivery in emerging areas. This
meant a shift in focus from pure cost considerations
innovation, value creation and flexibility for clients premised
trust, transparency and flexibility in relationships.
The initial years of transformation was focused on key initiativ
like “Employee First”, Multi Service offerings, Innovative Prici
models etc. HCL has also established a strong foundation
Collaborative Transformation as a way of business. HCL’s uniq
business approach has resulted in creation of a “Differentiat
Positioning” in the market place. This strategy has helped HC
to grow not only its existing relationships but also resultednew wins of transformational deals in different markets. Tod
HCL leads in execution of large integrated multi servi
transformational deals.
HCL continues to be a “Thought Leader” by gauging a
anticipating inflection points early in the industry and changi
the paradigm in a rapidly dynamic IT environment.
The HCL differentiation strategy is four fold:
The ‘Employee First’ philosophy at HCL
At the core of HCL’s Employee First philosophy is the conce
of talent transformation—recognition and enablement
competencies, as opposed to skilling employees in necessa
technical, business and behavioral areas. HCL follows a five fo
path of individual enlightenment – Support, Knowledg
Empowerment, Transformation and Recognition. Technologyheavily used in this path resulting in the enlightenment of nea
50,000 employees. The strategy is based on the fact th
employee enlightenment transpires to customer enlightenme
HCL’s Employee First philosophy has been captured by t
Harvard Business School in a case study and is now being taug
to future business leaders in their ‘Strategy and Leadersh
classes.
Blue Ocean Strategy
In 2005, HCL adopted a “Blue Ocean” approach by gaugi
early-on that the new generation outsourcers needed mo
transformational gains, value and innovative business mode
HCL has a four Pronged Blue Ocean Strategy all of which halegitimacy with proof points:
1. Pricing Innovation: Output Based Pricing Model
2. Technology Disruption: Business led Transformation
3. Market Creation: Building new service markets
4. Service Innovation: Through heavy investments in IP a
Solution Accelerators
HCL is uniquely positioned with its perfect blend of onsho
presence and offshore economics. Building competiti

8/7/2019 Indian_GAAP_07-08
http://slidepdf.com/reader/full/indiangaap07-08 9/1258
advantage also demands a shift from the earlier fee-driven/
service provider model to a new age outcome-based/partnership
model. At HCL, IT driven business innovation, emergence of
new disruptive technologies, business models, and widespread
acceptance of global delivery models are some of the
transformational forces at work today.
HCL being a disruptive force in technology is one amongst the
leading organizations that offer SOA driven integration to global
organizations. HCL’s SOA driven integration solutions for
business processes are aided by IP and Frameworks to enableautomated offshore development to continuously optimize the
customer’s business processes.
HCL’s investment in this arena has won several accolades for
the company. CrossfitTM, an automation SOA testing framework
has won the Technology Innovation award at the Financial
Services Outsourcing Annual Summit 2008.
Execution of Integrated Services designed to align IT with
Business
HCL’s integrated service offerings, backed by its investments in
innovative IPs & Frameworks, help customers to align their
application and IT portfolio with Business objectives. These
frameworks not only strengthen HCL’s execution capabilitiesbut also provide a single window to client to monitor the progress
of their projects. ASSETTM is once such framework that provides
a comprehensive and re-usable end-to-end framework to
professionally Advice, Plan, Execute and Manage transition in
large deals.
HCL brings unique strengths to organizations engaged in a
significant business transformation exercise to create new
competitive advantages. For such organizations, HCL has one
of the most mature portfolio of services among all offshore
providers—across Application Services, Core Infrastructure
support, Business Process Outsourcing, as also R&D and
Technology services. Multi-integrated solutions enable
customers achieve significant optimization not only within onearea but also at interface points (viz integrated help-desk for
applications and infrastructure).
Trust, Transparency and Flexibility
At HCL, all relationships –be it with employees, customers,
partners or stakeholders – need to be built on the foundation of
trust, transparency and flexibility. HCL’s Employee First
philosophy has led to empowered employees in the organization.
This has been reflected in a Survey of more than 250 Customers
and 830 respondents with Excellent feedback scores of Flexibility
(5.95) Trustworthy (6.31) and Loyalty (6.21) - on a scale of 7.
HCL’s clients increasingly feel, “the employees stand out as more
empowered when compared to like companies” and “Deliveron promise, even if circumstances are tough.”
Growth Strategy
HCL is a dominant player in its own niche and is uniquely
positioned as a co-sourcing vendor because of the experience
it has created for its clients. The unique positioning lends HCL
to be different in its Business Model from other Indian IT Services
players.
During the last 3 years, HCL has focused on the following 5
strategies for growth:
1. Create “New markets”, which it could lead. Establ
growth by being “first to market”.
2. Create “Diversity in Service lines” and not be depende
on one Service line alone.
3. Secure “higher proportion of annuity revenues” throu
focus on Operations, Output-based Pricing, Risk-Rewa
model and Long Term contracts.
4. Create “ Differentiators” through investments
“Disruptive Technologies” such as SOA, BI and APO.
5. Focus on doing more (work) for less (clients) rather th
less for more.
The creation of unique positioning of HCL through its “Run t
business” approach has been well received in the market
Fortune-1000 clients. HCL has also made significant investmen
in tools/ processes/ methodologies/ business models to ga
competitive advantage in the market. HCL has proven its super
delivery and execution capabilities by successfully moving lar
engagements to a steady state. Today, HCL works with Fortu
100, Fortune Global 500 and Fortune 1000+ clients globally. T
Company has done well in maintaining and growing its lar
existing customer relationships as also securing new clients thhas brought overall consistency in its growth.
Going forward, HCL will continue to focus on the aforemention
strategies.
Opportunities, Threats, Risks & Concerns
Opportunities
The Indian ITES and IT-BPO industry has come a long way fro
early years in 2000 and has been successful in establishing
credentials in delivering value based superior IT services to clien
across the world through its global delivery model. The resilien
of Indian the IT industry has been proved in facing challengi
times faced last year and that emanated primarily from a slow
US economy coupled with developments like the sub prime criselections in US, appreciating Indian Rupee against US Dollar, hi
inflation rate in India and a challenging business environment w
IT MNC’c increasing their presence in India. The downtrend
the US helped HCL to push forward with our sweet spot, althou
the overall strategy was to de-risk US and move towards Euro
and Asia, we saw high growth potential in US.
The industry is now poised for next phase of growth with glob
IT environment pointing towards increasing propensity
outsourcing / offshoring to countries like India. According
Nasscom, India continues to be the “nerve center” for glob
sourcing with over two-third of the Fortune 500 and majority
Global 2000 firms leveraging global sourcing delivery. Posit
market indicators and strong track record supports the indusoptimism in achieving its aspired target of USD 73-75 bn in ove
software and services revenues by FY 2010. The global region
spending patterns are also showing an increased importance
Europe and Asia Pacific regions in growth contribution while t
share of US reflecting marginal decline.
Within the overall industry environment as it unfolds, HCL
strategically geared to steer its growth. HCL has always be
the thought leader in gauging the inflection points in the indus
trends. It is always prepared to capitalize on the potent
opportunities made available by the external environment.

8/7/2019 Indian_GAAP_07-08
http://slidepdf.com/reader/full/indiangaap07-08 10/1259
HCL has adopted the Blue Ocean approach of doing business
and has been successful in reaping the benefit of its business
strategy. HCL’s Blue Ocean approach to business paid rich
dividends and we were ranked No. 1 ahead of all global players
in Remote Infrastructure Management (RIM) by the Black Book
of Outsourcing and awarded the Highly Commended Vendor
title by the National Outsourcing Association in Europe. HCL
becomes SAP Global Services partner to deliver joint business
value through Customer Centric Ecosystem. This milestone
partnership based on Blue Ocean thinking is aimed at enablingcustomers to access the business benefits of SAP’s enterprise
service-oriented architecture (enterprise SOA) and draw upon
HCL’s strengths in emerging geographies, strong domain
experience, risk taking and service innovation capabilities.
It has successfully identified newer markets, verticals and
services to drive its business growth. HCL’s Multi-service; Multi-
year; Multi-million dollar deals drove growth in 2007-08 and
contributed significantly to HCL’s top line and bottom line.
The domain focused approach of the Company has yielded rich
dividends strengthening the vertical strategy. HCL has
penetrated verticals like Media Publishing and Entertainment,
Life Sciences and Healthcare that are not the conventional
segments to offshore business process. The successes in itsapproach in these verticals would be replicated in other micro
verticals and geographies also.
HCL has differentiated itself in the market place in being “first to
market” its unique offerings. HCL has delivered and executed
innovative Multi Service engagements of larger size and
successfully able to move forward from “Transition” phase to
“Steady” phase thereby establishing HCL’s superior delivery and
execution capabilities.
HCL has been in the forefront of developing and deploying the
new breed of technologies for its customers with ensuing value
proposition.
Threats
Market-place & Competition
The industry is becoming increasingly converging in terms of
players having wider portfolio of service offerings as well as varied
business models with similar set of value propositions to be
offered to customers. This entail a more challenging environment
with increased competition and customer demands for value
creation in IT Infrastructure and IT Applications.
Increasingly, the Indian IT service provides have not only to
compete among themselves in the global market but have to
face stiff competition from the multinational IT vendors who have
made significant investments in India in setting captive global
offshore delivery centers.Other low-cost countries
Further, various other countries are competing with India in
offering superior service quality and delivery capabilities through
low cost options. The countries like China, Poland, Brazil,
Philippines etc are fast catching up in offering significant cost
advantages to customers through offshore options.
Increased customer demand for value enhancement
The evolving dynamics in the market place necessitates that
players continue to differentiate themselves in being able to offer
superior value by maximizing the client’s Return on Investmen
(ROI) on IT deployment while retaining cost competitiveness
The portfolio of service mix has to be constantly reviewed in li
with the evolving business needs of the clients. This necessitat
that players should be able to continuously anticipate the futu
technological trends and make suitable investments in R&
Intellectual Property based products & tools as also investme
in HR Assets i.e. training initiatives etc. in acquiring, developi
& re-skilling the human resources
Risks and Concerns
Operating Business Environment Risk
The business environment deteriorated sharply in the past ye
particularly in US primarily due to the subprime banking cri
emanating in US and its spiral-down effect to other parts of t
world. Most of the IT service providers derive significant busine
from the Banking, Financial Services & Insurance (BFSI) vertic
and consequent upon the US slowdown led by financial sect
the service providers are facing challenging times with the clien
adopting a “Wait and Watch” approach before finalizing th
respective IT spends.
Inflationary trend in agro-commodities and crude oil has alcaused deterioration of global macroeconomic environment a
spending pattern
HCL Strategy
HCL is well diversified geographically, to reduce its dependen
on any particular market. Moreover, it has a vertically focus
business approach and offers combination of service m
reducing its dependence on any particular service. T
Company’s business is spread over five distinct service lin
and no single business line contributed more than 37% of t
total revenue. Similarly, our revenue from biggest industry vertic
(BFSI) is also within 30% of overall revenue which is well low
than few of our competitors. This diversification strategy seem
to have paid-off wherein slow-down of BFSI sector caused sub-prime had very limited impact on HCL’s revenue projection
The Company is confident that the long term potential for t
industry is quite favorable in view of global tech spendi
forecasts remaining strong, aided by growth momentu
witnessed in Europe, Asia Pacific and Rest of the World.
Competition Related Risks
The Company faces competition not only from the India bas
IT services providers but increasingly from the multinational
vendors who are expanding their presence in the country owi
to attractiveness of the Offshoring model.
HCL Strategy
HCL’s differentiation strategy incorporating its unique busine
approach has led to its emerging as a “Thought Leader” in t
rapidly dynamic IT industry. HCL’s differentiation strategy is fo
fold which includes Employee First initiative, Blue Ocean strateg
Execution of Integrated Services designed to align IT w
Business and Trust, Transparency & Flexibility.
Employee Related Risks
Managing attrition rates and availability of talented and skill
pool of manpower are the two key challenges that are faci
the industry today. The other key industry challenge is the acu

8/7/2019 Indian_GAAP_07-08
http://slidepdf.com/reader/full/indiangaap07-08 11/12510
shortage of talented and experienced manpower caused by
lucrative employment opportunities offered by Indian and foreign
IT vendors.
HCL Strategy
HCL has put in place its “Employee First” initiative that is now in
its third year of successful implementation. The focus on
employees as key resources led to introduction of several
employee friendly policies that has helped HCL in containing its
attrition rates from 20.4% in 2005 to 15.2% in 2008. Success ofthis program is being hailed globally by leading media houses
and global forums. Now, this is being taught as a case study in
Harvard and London Business School. HCL has been taking
adequate steps to improve and augment the supply of
experienced manpower. The Company has concrete plans to
move its future expansion into tier II cities and set up campuses
close to the locations of high intensity qualified pool of resources.
It has partnered with select local engineering colleges/institutes
and imparts quality and contemporary technical education.
HCL makes continuous investments for in-house training and
development initiatives for upgradation of skills and re-skilling
of employees. This not only ensures that the Company has in-
house availability of talented pool of resources but also the
motivation of employees is maintained at high level by skill
enhancement.
Technology Risks
HCL operates in an ever evolving and dynamic technology
environment and it is of utmost importance that the Company
continuously reviews and upgrades its technology resources and
processes lest it faces technology obsolescence.
HCL Strategy
The Company keeps itself abreast and updated on the
contemporary developments in technology landscape through
participation in key technology forums, in-house training and
development initiatives and its intensive focus on core research& development activities. The Company is not dependent on
any single technology or platform. HCL has developed
competencies in various technologies, platforms and operating
environment and offers the wide range of technology options to
clients to choose from for their needs.
Further, HCL has a dedicated Engineering Excellence Group
(EEG) which offers consulting to various delivery teams in
developing best practices, development of reusable code and
registering patents for methodologies and tools developed.
Exchange Rate Risks
One single macroeconomic development that engaged the
attention of the entire industry last year was the relentlessappreciation of Indian Rupee against the US Dollar. The industry
is predominantly export driven and the magnitude of appreciation
was to the tune of 12-14% and upset the industry cost dynamics.
It was at this stage that the maturity and resilience of the industry
was tested to manage the situation through variety of measures
i.e. Cost-cutting initiatives and Risk Mitigation i.e. hedging etc.
HCL Strategy
As a risk containment strategy for its foreign currency exposures,
HCL has taken forward covers to hedge its receivables a
forecast revenues against the foreign currency fluctuations. T
Company does not speculate in foreign currency. Another k
pointer is gradual shift in geographical dependence away fro
US and increased focus on Europe, Asia Pacific and rest of t
world for generating business. This not only insulates fro
dependency on a single chosen economy but also ensures th
the revenue streams are denominated in multiple currenc
thereby de-risking the currency risk.
Business Concentration Risks
Geographical concentration
HCL has fairly well diversified portfolio of services spread ov
various geographies across multiple verticals. This has ensur
adequate de-risking of the business model and protects HC
from any adverse development in any geography, vertical or f
any service line. Enclosed below are the details of HCL’s busine
concentration based on geography and verticals. In additio
the client portfolio of HCL is also adequately diversified and do
not carry any concentration risks.
HCL Strategy
HCL derives 56% of business from US and rest 44% from nUS. Last year the slowdown was mostly felt in US, but t
business momentum from other non US geographies ensur
that Company’s overall growth objective was attained. In simi
way, The Company’s is well diversified through vertical servic
lines.
Industry vertical concentration
While the BFSI remained the most challenged vertical again
the backdrop of US slowdown, HCL’s broad based vertic
approach ensured that business impact is minimized throu
enhanced contribution from other verticals.
HCL Strategy
HCL’s has been successful in client engagements in new
growth verticals like life sciences and media publishing
entertainment. These verticals are not conventionally lar
outsourcers of business applications and therefore present go
growth potential. HCL has replicated its successful busine
engagements in these verticals in newer geographies and h
been successful in gaining clients in this space.
8/7/2019 Indian_GAAP_07-08
http://slidepdf.com/reader/full/indiangaap07-08 12/12511
Investment Portfolio Risks
The Company has consistently carried a high level of surpluscash and active treasury investments. The primary area of riskfor the Company’s market exposures are related to the interestrate risk on its investment securities.
HCL Strategy
All surplus funds are invested in avenues upon review by theinvestment committee. The guiding principles of all investment
decisions are safety of investments, followed by liquidity andreturns. The company invests its surplus funds in fixed depositswith reputed banks and debt based mutual funds. The companydoes not invest in equity or equity related instruments.
Internal Control systems and their adequacy.
The company has put in place an adequate system of internalcontrol commensurate with its size and nature of business. Thesesystems provide a reasonable assurance in respect of providingfinancial and operational information, complying with applicablestatutes, safeguarding of assets of the company and ensuringcompliance with corporate policies.
The company has a dedicated Internal Audit team which ensures
that:
• Adequate processes, systems, internal controls areimplemented and these controls are commensurate withthe size and operations of the company.
• Transactions are executed in accordance with policies andauthorization.
• Resources have been deployed as per the business plan,policies and authorization.
Further, management has supplemented the efforts of InternalAudit team by having a dedicated Risk Management team. Thisteam is responsible for HCL’s Corporate Governance programincluding Enterprise Risk Management Program, Assurance oncontinuity of Internal Control procedures and Legal compliances.
The company has a rigorous business planning system to settargets and parameters for operations which are reviewed withactual performance to ensure timely initiation of corrective action,if required.
The company’s audit committee comprising of 4 independentdirectors, which is a sub-committee of the board, reviewsadherence to internal control systems, internal audit reports, riskmanagement and legal compliances. This committee reviewsall quarterly and yearly results of the company and recommendsthe same to Board for their approval.
FINANCIAL PERFORMANCE
The financial performance of the Company as per Indian GAAPis discussed hereunder in two parts:
1. HCL Technologies Limited (Consolidated) which includesthe performance of its subsidiaries and joint venture.
2. HCL Technologies Limited (Standalone) which excludesthe performance of its subsidiaries and joint venture.
The Financial Statements have been prepared in compliancewith the requirements of the Companies Act 1956, and IndianGenerally Accepted Accounting Practices (GAAP).
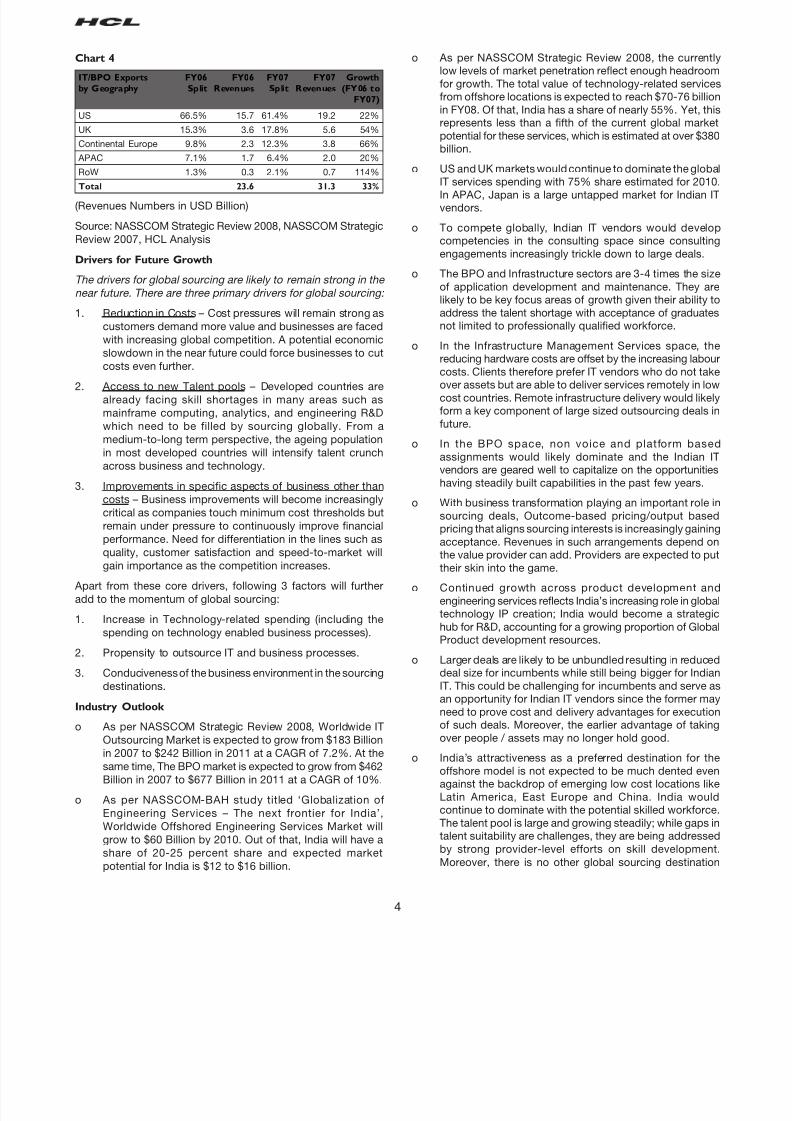
HCL Technologies Limited (Consolidated)
The Management Discussion and Analysis in this paragrarelates to the consolidated financial statements of HCTechnologies Limited and its subsidiaries. The discussion shoube read in conjunction with the financial statements and relatnotes to the consolidated accounts of HCL Technologies Limitfor the year ended 30 June 2008.
RESULTS OF OPERATIONS (CONSOLIDATED)
(Rs. in Cror
For the For the
Year Ended Year Ended
June 30,2008 June 30, 2007 Growt
Particulars Amount % Income Amount % Income% Increa
Revenue 7,562.8 97.5% 6,068.7 93.0% 24.6
Other Income 192.7 2.5% 455.9 7.0% -57.7
Total IncomeTotal IncomeTotal IncomeTotal IncomeTotal Income 7,755.57,755.57,755.57,755.57,755.5 100.0%100.0%100.0%100.0%100.0% 6,524.66,524.66,524.66,524.66,524.6 100.0%100.0%100.0%100.0%100.0% 18.918.918.918.918.9
Cost of Revenue 4,190.5 54.0% 3,357.5 51.5% 24.8
Administration andother expenses 2,065.6 26.6% 1,477.3 22.6% 39.8
Interest 17.7 0.2% 8.0 0.1% 120.6
Depreciation 298.8 3.9% 253.9 3.9% 17.7
Total ExpenditureTotal ExpenditureTotal ExpenditureTotal ExpenditureTotal Expenditure 6,572.66,572.66,572.66,572.66,572.6 84.7%84.7%84.7%84.7%84.7% 5,096.65,096.65,096.65,096.65,096.6 78.1%78.1%78.1%78.1%78.1% 29.029.029.029.029.0Profit before taxProfit before taxProfit before taxProfit before taxProfit before tax 1,182.91,182.91,182.91,182.91,182.9 15.3%15.3%15.3%15.3%15.3% 1,428.01,428.01,428.01,428.01,428.0 21.9%21.9%21.9%21.9%21.9% -17.2-17.2-17.2-17.2-17.2
Provision for tax 129.0 1.7% 104.1 1.6% 24.0
Minority Interest 2.4 0.0% 5.6 0.1% -56.4
Profit after tax 1,051.4 13.6% 1,318.3 20.2% -20.2
Fiscal Year 2008 compared with 2007
Revenues:-
Revenues during 2008 have grown by 24.6% as compared fiscal 2007. During 2008, the rupee has appreciated by 7.5against US$ (Average US$/INR rate during 2008 & 2007 we40.5 & 43.8 respectively) .Excluding the impact of strengthenof INR against US$, in dollar terms, revenues during 2008 ha
grown by 34.7 %.
The Company derives its revenue from three segments vinformation technology (software), infrastructure managemeand business process outsourcing services. Among the thrsegments, revenues from Infrastructure Management Servichave registered the highest growth rate of 34.2%. Segment wdetails are given below:
(Rs. in Cror
For the For the
Year Ended Year Ended
June 30,2008 June 30, 2007 Growt
% of % of
Particulars Amount Revenue Amount Revenue Increa
Information Tech-nology (Software) 5,517.6 73.0% 4,413.6 72.7% 25.025.025.025.025.0
InfrastructureManagement Service 1,142.6 15.1% 851.2 14.0% 34.234.234.234.234.2
Business ProcessOutsourcing 902.5 11.9% 803.9 13.2% 12.312.312.312.312.3
Total ServiceTotal ServiceTotal ServiceTotal ServiceTotal ServiceRevenueRevenueRevenueRevenueRevenue 7,562.87,562.87,562.87,562.87,562.8 6,068.76,068.76,068.76,068.76,068.7 24.624.624.624.624.6

8/7/2019 Indian_GAAP_07-08
http://slidepdf.com/reader/full/indiangaap07-08 13/12512
Geographical & Business Segment wise Composition of
revenue is given below:-
(Rs. in Crores)
For the For the
Year Ended Year Ended
June 30,2008 June 30, 2007 Growth
% of % of %
Geographical Mix Amount Revenue Amount Revenue Increase
US 4,073.7 53.9% 3,315.6 54.6% 22.9%22.9%22.9%22.9%22.9%
Europe 2,285.3 30.2% 1,817.8 30.0% 25.7%25.7%25.7%25.7%25.7%
Rest of the world 1,203.8 15.9% 935.3 15.4% 28.7%28.7%28.7%28.7%28.7%
Total ServiceTotal ServiceTotal ServiceTotal ServiceTotal Service
RevenueRevenueRevenueRevenueRevenue 7,562.87,562.87,562.87,562.87,562.8 6,068.76,068.76,068.76,068.76,068.7 24.6%24.6%24.6%24.6%24.6%
The Contribution of US geography to the total revenue of the
Company has gone down from 54.6% in fiscal 2007 to 53.9%
while the contribution of Europe has increased from 30% in fiscal
2007 to 30.2% in the current fiscal year, demonstrating a lower
dependence on the US. The top 5 customers accounts for 26.7%
of the Company’s revenue.
Cost of Revenues:-
(Rs. in Crores)
For the For the
Year Ended Year Ended
June 30,2008 June 30, 2007 Growth
% of % of %
Particulars Amount Revenue Amount Revenue Increase
Cost of Goods Sold 194.4 2.6% 190.7 3.1% 1.9%1.9%1.9%1.9%1.9%
Personnel Expenses 3,662.4 48.4% 2,872.2 47.3% 27.5%27.5%27.5%27.5%27.5%
Software development
expenses - external 312.7 4.1% 274.1 4.5% 14.1%14.1%14.1%14.1%14.1%
License and
transponder fee 21.0 0.3% 20.5 0.3% 2.7%2.7%2.7%2.7%2.7%
TotalTotalTotalTotalTotal 4,190.54,190.54,190.54,190.54,190.5 3,357.53,357.53,357.53,357.53,357.5 24.8%24.8%24.8%24.8%24.8%
The cost of revenues increased by 24.8% from Rs. 3,357.5 crores
in 2007 to Rs. 4,190.5 crores in 2008. This increase is mainly onaccount of increased personnel costs. Personnel costs increased
to Rs. 3,662.4 crores in 2008 from Rs. 2,872.2 crores in 2007,
an increase of 27.5%. Personnel costs include a non cash stock
option charge of Rs. 105.0 crores during the year ended June
30 2008 (Rs. 125.9 crores for the year ended June 30 2007).
Personnel costs have been driven up primarily by an increase in
the number of employees during the year from a total of 42,017
at the end of fiscal 2007 to 50,741 at the end of fiscal 2008.
Personnel costs as a percentage of revenues have increased
from 47.3% to 48.4% .The increase is primarily due to the
strengthening of INR against the USD which had a negative
impact on revenues.
Administration and other expenses:-
(Rs. in Crores)
For the For the
Year Ended Year Ended
June 30,2008 June 30, 2007 Growth
% of % of %
Particulars Amount Revenue Amount Revenue Increase
Rent 211.5 2.8% 126.7 2.1% 67.0%67.0%67.0%67.0%67.0%
Power & Fuel 100.5 1.3% 77.0 1.3% 30.6%30.6%30.6%30.6%30.6%
Travel and conveyance 653.5 8.6% 612.4 10.1% 6.7%6.7%6.7%6.7%6.7%
Communication costs 103.2 1.4% 106.8 1.8% -3.4%-3.4%-3.4%-3.4%-3.4%
(Rs. in Cror
For the For the
Year Ended Year Ended
June 30,2008 June 30, 2007 Growt
% of % of
Particulars Amount Revenue Amount Revenue Increa
Recruitment Training
& Development 73.1 1.0% 50.7 0.8% 44.144.144.144.144.1
Exchange differences 288.0 3.8% - -
Others 635.8 8.4% 503.7 8.3% 26.226.226.226.226.2TotalTotalTotalTotalTotal 2,065.62,065.62,065.62,065.62,065.6 1,477.31,477.31,477.31,477.31,477.3 39.839.839.839.839.8
During 2008, the company has incurred exchange loss of R
288.0 crores due to significant appreciation of USD against IN
on account of mark to market of forward covers, cancellation
forward covers and reinstatement of foreign currency assets a
liabilities. While during the year ended 30 June 2007, t
company has incurred exchange gain of Rs. 346.5 cror
(reported under Other Income) due to significant depreciation
USD against INR on account of mark to market of forward cove
and reinstatement of foreign currency assets and liabilities. (Re
note 1(e) of schedule 19 of Consolidated Balance sheet).
Excluding the exchange loss of Rs. 288.0 crores, administrati
and other expenses increased by 20.3% from Rs.1,477.3 crorin 2007 to Rs. 1,777.6 crores in 2008. This increase is mainly
account of increase in rent, project related travel costs, power
fuel and other establishment costs. Rental expenses ha
increased on account of additional facilities taken on lease f
expansion and also due to levy of service tax on rental paymen
during the current fiscal year. In line with the opinion express
by the Expert Advisory Committee of the Institute of Charter
Accountants of India, from the current year, the Company h
started amortizing lease rentals on a straight line basis duri
the entire lease term.
Interest:-
Interest cost during the year ended June 30 2008 is Rs. 17crores against Rs. 8.0 crores during the previous year. Th
represents interest on fund borrowed from banks to meet worki
capital requirements at various locations and interest on asse
taken on finance lease.
Profit before tax:-
Profit before tax decreased by 17.2% during the fiscal from R
1,428.0 crores in 2007 to Rs. 1,182.9 crores in 2008. During t
current year, the Company has incurred an exchange loss of R
223.2 crores (net of gain of Rs. 64.8 crores reported in revenu
against an exchange gain of Rs. 346.5 in 2007. Excluding exchan
gain and loss, profit before taxation increased to Rs. 1,406.0 cror
in 2008 from Rs. 1,081.5 crores an increase of 30.0%.
Taxation:-
The net tax expense for 2008 was Rs. 129.0 crores compar
to Rs. 104.1 crores in 2007.
A substantial portion of the profits of the Company’s Ind
operations is exempt from income tax, these profits bei
attributable to export operations of undertakings situated
Software Technology Parks (STP). Under the tax holiday, t
taxpayer can utilize an exemption from income tax for a perio
of any ten consecutive years beginning from the financial ye
when the unit started operations. The tax holiday on all faciliti

8/7/2019 Indian_GAAP_07-08
http://slidepdf.com/reader/full/indiangaap07-08 14/12513
under STPs expires in stages by 2010. The profits arising out ofthe domestic business are subject to corporate income tax atthe rate of 30% plus applicable surcharge and education cess.The Company is in the process of developing three campusesat Noida, Chennai & Bangalore in its Special Economic Zone(SEZ) approved facilities. A portion of the facilities at Noidacampus and certain facilities in leased premises have becomeoperational during the financial year 2007-08 as SEZ units andare entitled to applicable tax benefits. Income from units in SEZ
is fully exempt from tax for the first 5 years, 50% exempt for thenext five years and 50% exempt for subsequent five years subjectto fulfilling certain conditions.
Net profit:-
The Company’s profit after tax decreased to Rs. 1,051.4 croresin fiscal 2008 from Rs. 1,318.3 crores in fiscal 2007, a decreaseof 20.2%.
Fixed Assets:-
Gross block of fixed assets as at the end of fiscal 2008 stood atRs. 2,538.5 crores as compared to Rs. 1,984.8 crores as at theend of fiscal 2007 and capital work in progress (including capitaladvances) stood at Rs. 430.3 crores against Rs. 218.4 crores at
the end of fiscal 2007.
Capital work in progress includes payment of Rs. 85.6 croresfor 170 acres of land allotted to the Company in Nagpur in anapproved SEZ location. Company is in the process of takingpossession of this land.
The Company is in the process of developing facilities in itscampuses at NOIDA, Chennai & Bangalore. These campusesare spread over a combined area of 121 acres. Currently,approximately 16000 seats are under development. A portionof the facilities at NOIDA campus has become operational duringthe financial year 2007-08 as SEZ unit. All the three campusesare approved SEZ locations. Expenditure incurred till end of fiscal2008 for these facilities under construction is appearing undercapital work in progress.
Cash Flows:-
Cash generated from operations provides the major source offunds for the growth of the business. Net cash provided byoperating activities increased to Rs. 1,349.2 crores in the year2008 from Rs.1,079.8 crores in year 2007. This cash generatedhas been utilized in the purchase of fixed assets worth Rs. 554.2crores and payment of dividend of Rs. 621.3 crores (includingdividend distribution tax).
Also during the current year, the Company through its 100%subsidiary has acquired 100% equity stake in Capital StreamInc., a company based in United States of America, at a net
consideration of Rs. 153.6 crores and has also paid a sum ofRs. 14.7 crores for acquiring minority stake in a majority ownedsubsidiary.
Treasury Operations:-
The guiding principle of the Company’s treasury investment issafety, liquidity and return. The Company has efficiently managedits surplus funds through careful treasury operations.
The Company deploys its surplus funds primarily in debt mutualfunds and bank fixed deposits with a limit on investments withindividual fund/bank. Breakup of investments in different portfolio
is given below:-(Rs. in Cror
Particulars 2008 200
Debt Mutual Funds 1,364.5 1,541
Bonds 12.0 12
Fixed Deposits with Banks 540.2 275
TotalTotalTotalTotalTotal 1,916.81,916.81,916.81,916.81,916.8 1,8281,8281,8281,8281,828
Return from Investments is given below:-(Rs. in Cror
Other Income 2008 200
Interest Income 59.2 13
Dividend from Investments 10.2 9
Profit on sale of Investments 114.7 79
TotalTotalTotalTotalTotal 184.1184.1184.1184.1184.1 101101101101101
To take advantage of the lower tax rate applicable to long-tecapital gains, the Company invests in growth funds and hunrealized capital gains of Rs. 83.8 crores and Rs. 79.7 croras at the end of fiscal year 2008 and 2007.
HCL Technologies Limited (Standalone):-
The Consolidated Financial Statements brings o
comprehensively the performance of the Company and a
more relevant for understanding the Company’s Performan
The discussion in the paragraph 1 which follows should be rein conjunction with the financial statements and related notrelevant to HCL Technologies Limited (Standalone) for the yeended 30 June 2008.
RESULTS OF OPERATIONS (STANDALONE)
(Rs. in Cror
For the For the
Year Ended Year EndedJune 30, 2008 June 30, 2007 Growt
Particulars Amount % Income Amount % Income % Increa
Revenue 4,615.4 96.4% 3,768.6 89.6% 22.5
Other Income 170.4 3.6% 439.4 10.4% -61.2
Total IncomeTotal IncomeTotal IncomeTotal IncomeTotal Income 4,785.84,785.84,785.84,785.84,785.8 100.0%100.0%100.0%100.0%100.0% 4,208.04,208.04,208.04,208.04,208.0 100.0%100.0%100.0%100.0%100.0% 13.713.713.713.713.7
Cost of Revenue 2,448.2 51.2% 2,005.9 47.7% 22.0
Administration andother expenses 1,225.4 25.6% 833.3 19.8% 47.1
Interest 19.1 0.4% 13.0 0.3% 47.1
Depreciation 217.9 4.6% 178.2 4.2% 22.3
Total ExpenditureTotal ExpenditureTotal ExpenditureTotal ExpenditureTotal Expenditure 3,910.63,910.63,910.63,910.63,910.6 81.7%81.7%81.7%81.7%81.7% 3,030.43,030.43,030.43,030.43,030.4 72.0%72.0%72.0%72.0%72.0% 29.029.029.029.029.0
Profit before taxProfit before taxProfit before taxProfit before taxProfit before tax 875.2875.2875.2875.2875.2 18.3%18.3%18.3%18.3%18.3% 1,177.71,177.71,177.71,177.71,177.7 28.0%28.0%28.0%28.0%28.0% -25.7-25.7-25.7-25.7-25.7
Provision for tax 94.6 2.0% 75.9 1.8% 24.7Profit after taxProfit after taxProfit after taxProfit after taxProfit after tax 780.6780.6780.6780.6780.6 16.3%16.3%16.3%16.3%16.3% 1,101.81,101.81,101.81,101.81,101.8 26.2%26.2%26.2%26.2%26.2% -29.1-29.1-29.1-29.1-29.1
FISCAL 2008 COMPARED TO FISCAL 2007
Revenues:-
Revenue during the fiscal 2008 has grown by 22.5% compared to fiscal 2007. During 2008, the rupee has appreciatby 7.5% against US$ (Average US$/INR rate during 2008 & 20were 40.5 & 43.8 respectively). Excluding the impact strengthening of INR against US$, in dollar terms, revenue duri2008 have grown by 32.4 %.
8/7/2019 Indian_GAAP_07-08
http://slidepdf.com/reader/full/indiangaap07-08 15/12514
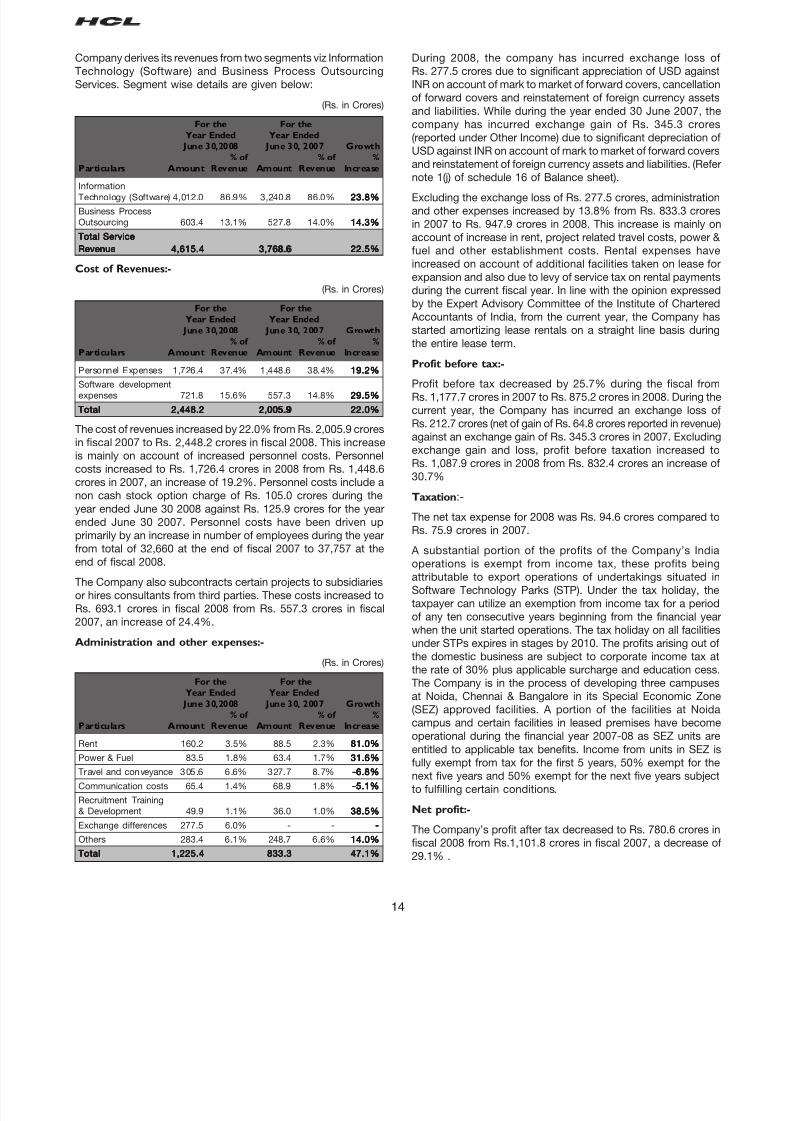
Company derives its revenues from two segments viz Information
Technology (Software) and Business Process Outsourcing
Services. Segment wise details are given below:
(Rs. in Crores)
For the For the
Year Ended Year Ended
June 30,2008 June 30, 2007 Growth
% of % of %
Particulars Amount Revenue Amount Revenue Increase
Information
Technology (Software) 4,012.0 86.9% 3,240.8 86.0% 23.8%23.8%23.8%23.8%23.8%
Business Process
Outsourcing 603.4 13.1% 527.8 14.0% 14.3%14.3%14.3%14.3%14.3%
Total ServiceTotal ServiceTotal ServiceTotal ServiceTotal Service
RevenueRevenueRevenueRevenueRevenue 4,615.44,615.44,615.44,615.44,615.4 3,768.63,768.63,768.63,768.63,768.6 22.5%22.5%22.5%22.5%22.5%
Cost of Revenues:-
(Rs. in Crores)
For the For the
Year Ended Year Ended
June 30,2008 June 30, 2007 Growth
% of % of %
Particulars Amount Revenue Amount Revenue Increase
Personnel Expenses 1,726.4 37.4% 1,448.6 38.4% 19.2%19.2%19.2%19.2%19.2%
Software development
expenses 721.8 15.6% 557.3 14.8% 29.5%29.5%29.5%29.5%29.5%
TotalTotalTotalTotalTotal 2,448.22,448.22,448.22,448.22,448.2 2,005.92,005.92,005.92,005.92,005.9 22.0%22.0%22.0%22.0%22.0%
The cost of revenues increased by 22.0% from Rs. 2,005.9 crores
in fiscal 2007 to Rs. 2,448.2 crores in fiscal 2008. This increase
is mainly on account of increased personnel costs. Personnel
costs increased to Rs. 1,726.4 crores in 2008 from Rs. 1,448.6
crores in 2007, an increase of 19.2%. Personnel costs include a
non cash stock option charge of Rs. 105.0 crores during the
year ended June 30 2008 against Rs. 125.9 crores for the year
ended June 30 2007. Personnel costs have been driven up
primarily by an increase in number of employees during the year
from total of 32,660 at the end of fiscal 2007 to 37,757 at theend of fiscal 2008.
The Company also subcontracts certain projects to subsidiaries
or hires consultants from third parties. These costs increased to
Rs. 693.1 crores in fiscal 2008 from Rs. 557.3 crores in fiscal
2007, an increase of 24.4%.
Administration and other expenses:-
(Rs. in Crores)
For the For the
Year Ended Year Ended
June 30,2008 June 30, 2007 Growth
% of % of %
Particulars Amount Revenue Amount Revenue Increase
Rent 160.2 3.5% 88.5 2.3% 81.0%81.0%81.0%81.0%81.0%
Power & Fuel 83.5 1.8% 63.4 1.7% 31.6%31.6%31.6%31.6%31.6%
Travel and conveyance 305.6 6.6% 327.7 8.7% -6.8%-6.8%-6.8%-6.8%-6.8%
Communication costs 65.4 1.4% 68.9 1.8% -5.1%-5.1%-5.1%-5.1%-5.1%
Recruitment Training
& Development 49.9 1.1% 36.0 1.0% 38.5%38.5%38.5%38.5%38.5%
Exchange differences 277.5 6.0% - - -----
Others 283.4 6.1% 248.7 6.6% 14.0%14.0%14.0%14.0%14.0%
TotalTotalTotalTotalTotal 1,225.41,225.41,225.41,225.41,225.4 833.3833.3833.3833.3833.3 47.1%47.1%47.1%47.1%47.1%
During 2008, the company has incurred exchange loss
Rs. 277.5 crores due to significant appreciation of USD again
INR on account of mark to market of forward covers, cancellati
of forward covers and reinstatement of foreign currency asse
and liabilities. While during the year ended 30 June 2007, t
company has incurred exchange gain of Rs. 345.3 cror
(reported under Other Income) due to significant depreciation
USD against INR on account of mark to market of forward cove
and reinstatement of foreign currency assets and liabilities. (Re
note 1(j) of schedule 16 of Balance sheet).Excluding the exchange loss of Rs. 277.5 crores, administrati
and other expenses increased by 13.8% from Rs. 833.3 cror
in 2007 to Rs. 947.9 crores in 2008. This increase is mainly
account of increase in rent, project related travel costs, power
fuel and other establishment costs. Rental expenses ha
increased on account of additional facilities taken on lease f
expansion and also due to levy of service tax on rental paymen
during the current fiscal year. In line with the opinion express
by the Expert Advisory Committee of the Institute of Charter
Accountants of India, from the current year, the Company h
started amortizing lease rentals on a straight line basis duri
the entire lease term.
Profit before tax:-
Profit before tax decreased by 25.7% during the fiscal fro
Rs. 1,177.7 crores in 2007 to Rs. 875.2 crores in 2008. During t
current year, the Company has incurred an exchange loss
Rs. 212.7 crores (net of gain of Rs. 64.8 crores reported in revenu
against an exchange gain of Rs. 345.3 crores in 2007. Excludi
exchange gain and loss, profit before taxation increased
Rs. 1,087.9 crores in 2008 from Rs. 832.4 crores an increase
30.7%
Taxation:-
The net tax expense for 2008 was Rs. 94.6 crores compared
Rs. 75.9 crores in 2007.
A substantial portion of the profits of the Company’s Ind
operations is exempt from income tax, these profits bei
attributable to export operations of undertakings situated
Software Technology Parks (STP). Under the tax holiday, t
taxpayer can utilize an exemption from income tax for a perio
of any ten consecutive years beginning from the financial ye
when the unit started operations. The tax holiday on all faciliti
under STPs expires in stages by 2010. The profits arising out
the domestic business are subject to corporate income tax
the rate of 30% plus applicable surcharge and education ces
The Company is in the process of developing three campus
at Noida, Chennai & Bangalore in its Special Economic Zo
(SEZ) approved facilities. A portion of the facilities at Noi
campus and certain facilities in leased premises have becomoperational during the financial year 2007-08 as SEZ units a
entitled to applicable tax benefits. Income from units in SEZ
fully exempt from tax for the first 5 years, 50% exempt for t
next five years and 50% exempt for the next five years subje
to fulfilling certain conditions.
Net profit:-
The Company’s profit after tax decreased to Rs. 780.6 crores
fiscal 2008 from Rs.1,101.8 crores in fiscal 2007, a decrease
29.1% .
8/7/2019 Indian_GAAP_07-08
http://slidepdf.com/reader/full/indiangaap07-08 16/12515
Fixed Assets:-
The Company has made additions of Rs. 281.4 crores during
2008 in the gross block of fixed assets which comprises
computers, software, other equipments and investment in
facilities. Gross block of fixed assets as at the end of fiscal 2008
stood at Rs. 1,599.6 crores and capital work in progress
(including capital advances) stood at Rs. 419.0 crores.
Capital work in progress includes payment of Rs. 85.6 crores
for 170 acres of land allotted to the Company in Nagpur in anapproved SEZ location. Company is in the process of taking
possession of this land.
The Company is in the process of developing facilities in its
campuses at NOIDA, Chennai & Bangalore. These campuses
are spread over a combined area of 121 acres. Currently,
approximately 16000 seats are under development. A portion
of the facilities at NOIDA campus has become operational during
the financial year 2007-08 as SEZ units. All the three campuses
are approved SEZ locations. Expenditure incurred till end of fiscal
2008 for these facilities under construction is appearing under
capital work in progress.
Cash Flows:-
Cash generated from operations provides the major source of
funds for the growth of the business. Net cash provided by
operating activities increased to Rs. 1,056.8 crores in the year
2008 from Rs. 997.9 crores in year 2007. This cash generated
has been utilized in the purchase of fixed assets worth Rs. 463.3
crores and payment of dividend of Rs. 621.3 crores (including
dividend distribution tax).
Treasury Operations:-
The guiding principle of the Company’s treasury investment is
safety, liquidity and return. The Company has efficiently managed
its surplus funds through careful treasury operations.
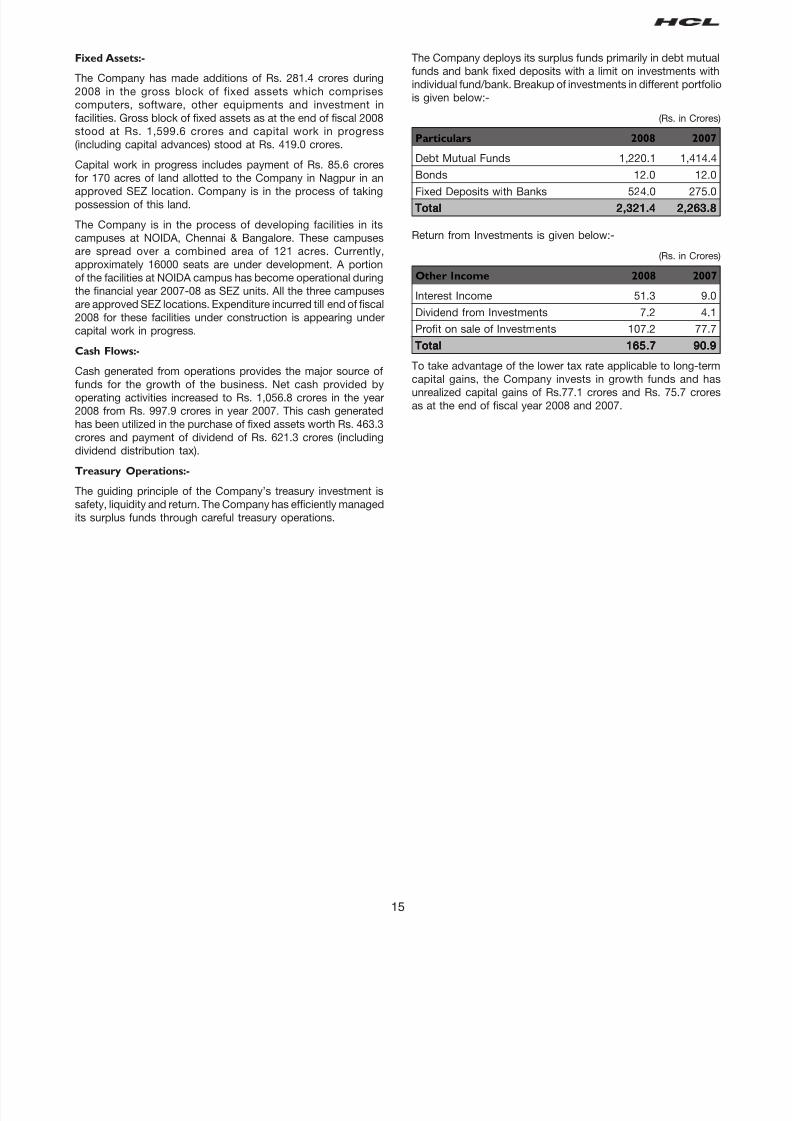
The Company deploys its surplus funds primarily in debt mutu
funds and bank fixed deposits with a limit on investments w
individual fund/bank. Breakup of investments in different portfo
is given below:-
(Rs. in Cror
Particulars 2008 200
Debt Mutual Funds 1,220.1 1,414
Bonds 12.0 12
Fixed Deposits with Banks 524.0 275
TotalTotalTotalTotalTotal 2,321.42,321.42,321.42,321.42,321.4 2,2632,2632,2632,2632,263
Return from Investments is given below:-
(Rs. in Cror
Other Income 2008 200
Interest Income 51.3 9
Dividend from Investments 7.2 4
Profit on sale of Investments 107.2 77
TotalTotalTotalTotalTotal 165.7165.7165.7165.7165.7 9090909090
To take advantage of the lower tax rate applicable to long-tecapital gains, the Company invests in growth funds and h
unrealized capital gains of Rs.77.1 crores and Rs. 75.7 cror
as at the end of fiscal year 2008 and 2007.

8/7/2019 Indian_GAAP_07-08
http://slidepdf.com/reader/full/indiangaap07-08 17/12516
DIRECTORS’ REPORT
Dear Shareholders,
Your Directors have pleasure in presenting this Sixteenth Annual Report together with the Audited Accounts for the year ended Ju
30, 2008.
FINANCIAL RESULTS
The highlights of consolidated financial results of your Company and its subsidiaries prepared under Indian GAAP are as follow
(Rs. in cror
Year ended Year ended
June 30, 2008 June 30, 2007
IncomeIncomeIncomeIncomeIncome
Revenues 7,562.78 6,068.74
Other income 192.72 455.85
7,755.507,755.507,755.507,755.507,755.50 6,524.596,524.596,524.596,524.596,524.59
ExpenditureExpenditureExpenditureExpenditureExpenditure
Cost of revenues 4,190.54 3,357.46
Administration and other expenses 2,065.56 1,477.29
Finance costs 17.70 8.03
Depreciation and amortization 298.84 253.86
6,572.646,572.646,572.646,572.646,572.64 5,096.645,096.645,096.645,096.645,096.64
Profit before tax and minority interestsProfit before tax and minority interestsProfit before tax and minority interestsProfit before tax and minority interestsProfit before tax and minority interests 1,182.861,182.861,182.861,182.861,182.86 1,427.951,427.951,427.951,427.951,427.95Provision for tax (129.03) (104.08)
Profit before minority interestsProfit before minority interestsProfit before minority interestsProfit before minority interestsProfit before minority interests 1,053.831,053.831,053.831,053.831,053.83 1,323.871,323.871,323.871,323.871,323.87
Share of minority shareholders (2.42) (5.56)
Net ProfitNet ProfitNet ProfitNet ProfitNet Profit 1,051.411,051.411,051.411,051.411,051.41 1,318.311,318.311,318.311,318.311,318.31
The highlights of financial results of your Company as a stand-alone entity prepared under Indian GAAP are as follows:
(Rs. in cror
Year ended Year ended
June 30, 2008 June 30, 2007
IncomeIncomeIncomeIncomeIncome
Revenues 4,615.39 3,768.62
Other income 170.40 439.42
4,785.794,785.794,785.794,785.794,785.79 4,208.044,208.044,208.044,208.044,208.04
ExpenditureExpenditureExpenditureExpenditureExpenditure
Cost of revenues 2,448.18 2,005.91
Administration and other expenses 1,225.42 833.26
Finance charges 19.07 12.97
Depreciation 217.87 178.21
3,910.543,910.543,910.543,910.543,910.54 3,030.353,030.353,030.353,030.353,030.35
Profit before taxProfit before taxProfit before taxProfit before taxProfit before tax 875.25875.25875.25875.25875.25 1,177.691,177.691,177.691,177.691,177.69
Provision for tax (94.60) (75.87)
Profit after taxProfit after taxProfit after taxProfit after taxProfit after tax 780.65780.65780.65780.65780.65 1,101.821,101.821,101.821,101.821,101.82
Balance in Profit and Loss Account brought forward 1,570.44 1,185.99
Amount available for appropriationAmount available for appropriationAmount available for appropriationAmount available for appropriationAmount available for appropriation 2,351.092,351.092,351.092,351.092,351.09 2,287.812,287.812,287.812,287.812,287.81AppropriationsAppropriationsAppropriationsAppropriationsAppropriations
Proposed final dividend [including Rs. 0.03 crores (previous year Rs. 0.45 crores) 199.94 133.19
paid for previous year]
Corporate dividend tax on proposed final dividend [including Rs. 0.01 crores 33.97 22.62
(previous year Rs. 0.06 crores) paid for previous year]
Interim dividend 398.64 392.40
Corporate dividend tax on interim dividend 67.75 58.98
Transfer to general reserve 78.06 110.18
Balance carried forward to the balance sheetBalance carried forward to the balance sheetBalance carried forward to the balance sheetBalance carried forward to the balance sheetBalance carried forward to the balance sheet 1,572.731,572.731,572.731,572.731,572.73 1,570.441,570.441,570.441,570.441,570.44
TotalTotalTotalTotalTotal 2,351.092,351.092,351.092,351.092,351.09 2,287.812,287.812,287.812,287.812,287.81

8/7/2019 Indian_GAAP_07-08
http://slidepdf.com/reader/full/indiangaap07-08 18/12517
TRANSFER TO RESERVES
Your Company proposes to transfer Rs. 78.06 crores to the General Reserve. An amount of Rs. 1,572.73 crores is proposed to
carried forward in the Profit & Loss Account.
OVERVIEW
During the financial year 2007-08, on a stand-alone basis, your Company’s revenues stood at Rs. 4,615.39 crores registering
growth of 22.47% over the previous year and on a consolidated basis, the Company’s revenues for the year 2007-08 stood
Rs. 7,562.78 crores registering a growth of 24.62 % over the previous year.
A detailed analysis on the Company’s performance is included in the Management‘s Discussion and Analysis Report titled “Management’s Discussion and Analysis”, which forms part of this Annual Report.
DIVIDEND
Your directors are pleased to recommend a final dividend of Rs. 3 per share for the financial year ended June 30, 2008, subject
approval of the shareholders at the ensuing Annual General Meeting. During the year under review, your directors had declared an
paid three interim dividends as per the details given hereunder:
S. No. Interim dividend paid Rate of dividend Amount of dividend Distribution tax paid Total Outflow
during the year ended paid by the Company Rs./crores
June 30, 2008 Rs./crores Rs./ crores
1 1st Interim Dividend Rs. 2/- per share 132.76 22.56 155.32
2 2nd Interim Dividend Rs. 2/- per share 132.86 22.58 155.44
3 3rd Interim Dividend Rs. 2/- per share 133.03 22.61 155.64
The total amount of dividend (including interim dividends) paid / payable for the year ended June 30, 2008 shall be Rs. 598.55 cror
as against Rs. 525.17 crores paid for the previous year. Dividend distribution tax paid / payable by the Company for the year end
June 30, 2008 would amount to Rs. 101.71 crores.
SUBSIDIARIES FORMED DURING THE YEAR
HCL Technologies (Shanghai) Limited
During the year under review, the Company has incorporatedits wholly owned subsidiary viz. HCL Technologies (Shanghai)Limited. Through this entity the Company established its firstsales and delivery center in Shanghai with an initial investment
of Rs. 2.77 crores (USD 0.7 million).Capital Stream Inc.
During the year under review, the Company acquired all of theoutstanding capital stock of Capital Stream Inc., a companyincorporated in USA for a cash consideration of Rs. 160 crores(USD 39.03 million). Capital Stream Inc. is engaged in providingcomprehensive end to end solutions for the automation of frontoffice functions of commercial lending institutions. Thistransaction was structured as reverse merger.
EXISTING SUBSIDIARIES/ JOINT VENTURES - FURTHER
INVESTMENT/ AMALGAMATION/ CLOSURE DURING
THE YEAR
HCL EAI Services Inc.
In order to consolidate its position in Enterprise ApplicationIntegration (“EAI”) space, the Company has acquired the balance49% stake in its Joint Venture Company viz. HCL EAI ServicesInc., a California corporation for a consideration of Rs.13.32crores (USD 3.49 million) through its downstream subsidiary HCLAmerica Inc., a company incorporated in USA. With thisacquisition, HCL EAI Services Inc. has become 100% subsidiaryof your Company.
Further w.e.f. July 01, 2008, HCL EAI Services Inc. has been
amalgamated with HCL America Inc.
HCL Jones Technologies (Bermuda) Limited
In June 2002, the Company entered into an agreement with Jon
Apparel Group Inc. (“Jones”), under which two new Compan
were established in Bermuda and Delaware. The Company he
51% stake in the said Joint Venture.
In December 2007, the Company and Jones had entered in
an agreement (“Termination Agreement”) to terminate the JoVenture agreement entered in June 2002. As a part of t
termination agreement, a subsidiary of the Company h
obtained binding commitments for the provision of IT servic
to Jones, with an aggregate contract value of Rs. 96.8 cror
(USD 22.5 million) upto 2012.
Further, pursuant to this termination, the Joint Venture Compa
in Bermuda viz. HCL Jones Technologies (Bermuda) Limited w
be wound up.
HCL Enterprise Solutions Limited
HCL Enterprise Solutions Limited was incorporated in Maurit
in regard to the Joint Venture entered into by the Company w
Computech Corporation. The Company has acquired 100
stake in the said Joint Venture, the last tranche acquired
February, 2005. Since the business pertaining to the said Jo
Venture has been fully integrated within the Company, it w
therefore decided to wind up this entity. Accordingly
application for winding up has been moved with the releva
authorities in Mauritius.
BRANCHES FORMED DURING THE YEAR
In order to scale the operations in new geographies, tCompany has set up four branches at the following locations

8/7/2019 Indian_GAAP_07-08
http://slidepdf.com/reader/full/indiangaap07-08 19/12518
Dublin, IrelandZurich, SwitzerlandTel- Aviv, IsraelPrague, Czech Republic
SUBSIDIARIES - FINANCIALS
The Company has 30 subsidiaries as on June 30, 2008. TheCompany has been granted exemption for the year ended June30, 2008 by the Ministry of Corporate Affairs from annexing theaccounts and other information of the subsidiaries along with
the accounts of the Company, as required under section 212 ofthe Companies Act, 1956.
As per the terms of the exemption letter, a statement containingbrief financial details of the Company’s subsidiaries for the yearended June 30, 2008 is included in the Annual Report.
As required under the Listing Agreements with the StockExchanges, consolidated financial statements of the Companyand its subsidiaries are attached.
CHANGES IN CAPITAL STRUCTURE
Issue of shares under Employee Stock Option Plans
During the year ended June 30, 2008, the Company allotted
2,657,156 equity shares of Rs. 2/- each fully paid up under itsEmployees Stock Option Plans (“ESOP”).
ISSUED AND PAID-UP SHARE CAPITAL
As on June 30, 2008, the issued and paid-up share capital ofthe Company was Rs.133,26,80,544/- (previous year :Rs.132,73,66,232/-) comprising 66,63,40,272 (previous year:66,36,83,116) equity shares of Rs. 2/- each fully paid-up.
STOCK OPTIONS PLANS
1999 Stock Option Plan / 2000 Stock Option Plan / 2004 Stock Option Plan
The details on these plans have been annexed to this report.
SHARES UNDER COMPULSORY DEMATERIALIZATIONThe equity shares of your Company are included in the list ofspecified scrips where delivery of shares in dematerialized (demat)form is compulsory effective from July 24, 2000, if the same aretraded on a stock exchange , which is linked to a depository. Asof June 30, 2008, 99.92% shares were held in demat form.
CORPORATE GOVERNANCE
The report of Board of Directors of the Company on CorporateGovernance is given as a separate section titled ‘CorporateGovernance Report 2007-08’, which forms part of this AnnualReport.
Certificate of the Statutory Auditors of the Company regardingcompliance with the Corporate Governance requirements asstipulated in clause 49 of the Listing Agreement with the stockexchanges is annexed with the Corporate Governance Report.
MANAGEMENT’S DISCUSSION & ANALYSIS
The Management’s Discussion and Analysis is given separatelyand forms part of this Annual Report.
INSIDER TRADING REGULATIONS
Based on the requirements under SEBI (Prohibition of InsiderTrading) Regulations, 1992, as amended from time to time, theCode of Conduct for prevention of insider trading and the Codefor corporate disclosures are in force.
DIRECTORS’ RESPONSIBILITY STATEMENT
A statement of responsibility of the Directors relating to complianwith the financial accounting and reporting requirements in respeof the financial statements, as specified under section 217(2Aof the Companies Act, 1956 inserted by the Compani(Amendment) Act, 2000, is annexed to this Report.
DIRECTORS
In accordance with the Articles of Association of the Compan
Mr. Amal Ganguli, Mr. T.S.R. Subramanian and Mr. AChowdhry, shall retire by rotation as Directors at the ensuiAnnual General Meeting and being eligible, they have offerthemselves for re-appointment.
Mr. Vineet Nayar is appointed as an additional Director of tCompany w.e.f. August 01, 2008. Pursuant to the Provisions section 260 of the Companies Act, 1956, Mr. Vineet Nayar holthe office upto the date of the ensuing Annual General Meetiand is eligible for appointment as Director of the Company. Subjeto the approval of the shareholders in the ensuing Annual GeneMeeting, he has been appointed as a Whole-time Director of tCompany for a period of five years w.e.f. August 01, 2008.
AUDITORS
The auditors, M/s. Price Waterhouse, Chartered Accountants, retat the conclusion of the ensuing Annual General Meeting and thhave confirmed their eligibility and willingness to be re-appointe
CONSERVATION OF ENERGY, RESEARCH ANDEVELOPMENT, TECHNOLOGY ABSORPTION, FOREIGEXCHANGE EARNINGS AND OUTGO
Disclosures of particulars as required by the Compani(Disclosure of Particulars in the Report of Board of DirectoRules, 1988, are set out in the annexure included in this Repo
FIXED DEPOSITS
Your Company has not accepted any fixed deposits.
DISCLOSURES UNDER SECTION 217 OF THE COMPANIACT, 1956
Except, as disclosed elsewhere in the report, there have beno material changes and commitments, which can affect tfinancial position of the Company between the end of the financyear and the date of this report.
As required under section 217(2A) of the Companies Act, 195read with the Companies (Particulars of Employees) Rules, 197as amended, the names and other particulars of employees aset out in the annexure included in this Report.
ACKNOWLEDGEMENTS
The Board wishes to place on record its appreciation to tcontribution made by employees of the Company and
subsidiaries during the year under review. The Company hachieved impressive growth through the competence, hard wosolidarity, cooperation and support of employees at all leveYour Directors thank the customers, clients, vendors and othbusiness associates for their continued support in the Companygrowth. The Directors also wish to thank the GovernmeAuthorities, Financial Institutions and Shareholders for thcooperation and assistance extended to the Company.
For and on behalf of the Board of DirectoFor and on behalf of the Board of DirectoFor and on behalf of the Board of DirectoFor and on behalf of the Board of DirectoFor and on behalf of the Board of Directo
Noida (U.P.), India SHIV NADA01 August 2008 Chairman and Chief Strategy Offic

8/7/2019 Indian_GAAP_07-08
http://slidepdf.com/reader/full/indiangaap07-08 20/12519
ANNEXURE TO THE DIRECTORS’ REPORT
a) Conservation of Energy
The nature of your Company’s operation does not involve
intensive energy consumption. However, your Company
constantly endeavors to plan infrastructure investments of
a design that results in conservation of energy. Adequatemeasures have been taken to reduce energy consumption,
wherever possible. As energy cost forms a very small part
of total cost, the impact on cost is not material.
b) Research and Development (“R&D”)
i) Specific areas in which R&D was carried out
Your Company continued its R&D efforts to build
competence in the emerging Internet, Telecom and
Embedded Technology areas thereby ensuring a
continuous movement up the value chain. Since
business and technologies are changing constantly,
continuous investments in research and development
need to be made.ii) Benefits derived as a result of above R&D
As a result of research efforts, your Company has been
able to develop processes and methodologies that have
resulted in constant improvement in quality and
productivity.
iii) Future plan of action
Your Company will continue to focus on R&D activities
and will make investments therein from time to time.
iv) Expenditure on R&D for the years ended June 30,
2008 and 2007 are as follows:
(Rs. in crores)
Particulars 2008 2007
Revenue expenditure 19.44 12.07
Capital expenditure - -
Total R&D expenditure 19.4419.4419.4419.4419.44 12.0712.0712.0712.0712.07
R&D expenditure as a percentage 0.42%0.42%0.42%0.42%0.42% 0.32%0.32%0.32%0.32%0.32%
of revenues
c) Technology absorption, adaptation and innovation
Your Company’s core businesses demand absorption
emerging technologies to stay at the cutting edge
technology. New methods for absorbing, adapting a
effectively deploying new technologies have bedeveloped. Your Company has made investments
applications and other software tools required f
engineering design work in all its Software Developme
Centers.
d) Foreign exchange earnings and outgo
Your Company is an export-oriented unit and the major
of the Information Technology (IT) services and Busine
Process Outsourcing (BPO) services by the Company a
for clients outside India.
The foreign exchange earned and spent by the Company duri
the year under review is as follows:
(Rs. in cror
Particulars 2008 200
Foreign exchange earningsForeign exchange earningsForeign exchange earningsForeign exchange earningsForeign exchange earnings 4,545.894,545.894,545.894,545.894,545.89 3,726.03,726.03,726.03,726.03,726.0
Foreign exchange outgoForeign exchange outgoForeign exchange outgoForeign exchange outgoForeign exchange outgo
- Expenditure in foreign currency 1,043.99 913.5
- CIF value of imports 67.78 50.8
- Dividend remitted in foreign currency 98.36 98.4
1,210.131,210.131,210.131,210.131,210.13 1,062.81,062.81,062.81,062.81,062.8
For and on behalf of the Board of Directo
Noida (U.P.), India SHIV NADA
01 August 2008 Chairman and Chief Strategy Offic
Particulars pursuant to the Companies (Disclosure of Particulars in the Report of Board of Directors) Rules, 1988
Directors’ Responsibility Statement as required under Section 217(2AA) of the Companies Act, 1956 as inserted by the Compan
(Amendment) Act, 2000
i) The financial statements have been prepared in accordance
with the accounting standards issued by the Institute of
Chartered Accountants of India and the requirements of the
Companies Act, 1956, to the extent applicable to theCompany. There have been no material departures from
prescribed accounting standards while preparing these
financial statements;
ii) The Board of Directors has selected the accounting policies
described in the notes to the accounts, which have been
consistently applied, except where otherwise stated. The
estimates and judgments relating to the financial statements
have been made on a prudent basis, in order that the financial
statements reflect in a true and fair manner, the state of
affairs of the Company as at June 30, 2008 and the profit of
the Company for the year ended on that date;
iii) The Board of Directors has taken proper and sufficient ca
for the maintenance of adequate accounting recordsaccordance with the provisions of the Companies Act, 19
for safeguarding the assets of the Company and f
preventing and detecting fraud and other irregularities;
iv) The annual accounts have been prepared on the histori
cost convention, as a going concern and on the accrual bas
For and on behalf of the Board of Directo
Noida (U.P.), India SHIV NADA
01 August 2008 Chairman and Chief Strategy Offic

8/7/2019 Indian_GAAP_07-08
http://slidepdf.com/reader/full/indiangaap07-08 21/12520
ANNEXURE TO THE DIRECTORS’ REPORT (Contd.)
DETAILS ON STOCK OPTION PLANS
1999 Stock Option Plan /2000 Stock Option Plan / 2004 Stock Option Plan
Pursuant to the approval of the shareholders, your Company had instituted the 1999 Stock Option Plan (“1999 Plan”), 2000 Sto
Options Plan (“2000 Plan”) and 2004 Stock Option Plan (“2004 Plan”) for all eligible employees of the Company and its subsidiarie
The 1999 Plan, 2000 Plan and 2004 Plan are administered by the Compensation Committee of the Board and provide for the issuan
of 20,000,000, 15,000,000 and 20,000,000 options, respectively.
Each option granted under the 1999 Plan, 2000 Plan and 2004 Plan, entitles the holder to four equity shares of the Company at a
exercise price, which is approved by the Compensation Committee.
The details of the options granted under the 1999 , 2000 and 2004 Plans are given below:
S. Description 1999 Plan 2000 Plan 2004 Pla
No.
1 Total number of options granted (gross) 26,600,874 17,747,401 4,476,17
2 The pricing formula Market price/ Market price Market price
internal valuation price determine
by Compensatio
Committe
3 Number of options vested 15,950,147 7,537,378 939,64
4 Number of options exercised 12,089,057 4,425,075 635,13
5 Total number of shares arising as a result of exercise of options 48,356,228 17,700,300 2,540,54
6 Number of options lapsed 11,689,387 9,230,885 515,49
7 Variation in terms of options None None Non
8 Money realized by exercise of options (Rs. crores) 384.02 243.59 3.1
9 Total number of options in force as on June 30, 2008Total number of options in force as on June 30, 2008Total number of options in force as on June 30, 2008Total number of options in force as on June 30, 2008Total number of options in force as on June 30, 2008 2,822,4302,822,4302,822,4302,822,4302,822,430 4,091,4414,091,4414,091,4414,091,4414,091,441 3,325,543,325,543,325,543,325,543,325,54
10 Grant to Senior Management
Number of Options 1,967,175 254,904 1,110,00
Vesting Period 3-7 years 2-7 years 1.5-5 year
The diluted earnings per share were Rs. 11.40 and Rs.16.27 for the fiscal years ended June 30, 2008 and 2007 respectively.
HCL TECHNOLOGIES LIMITED EMPLOYEES TRUST
In April 2001, HCL Technologies Limited Employees Trust (“Trust”) was formed for the purpose of acquiring the shares of the Compa
and thereby providing such shares to the eligible employees and directors of the Company and/or its subsidiaries at any tim
pursuant to the Stock Option Plans of the Company. The Company would provide this Trust interest free loan(s) from time to time
to a limit of Rs.150 crores for this purpose.
As on June 30, 2008, an amount of Rs. 6.52 crores is outstanding as loan from the Company and Nil shares of the Company are he
by the Trust. The Company has made provision of Rs. 6.52 crores against the same.
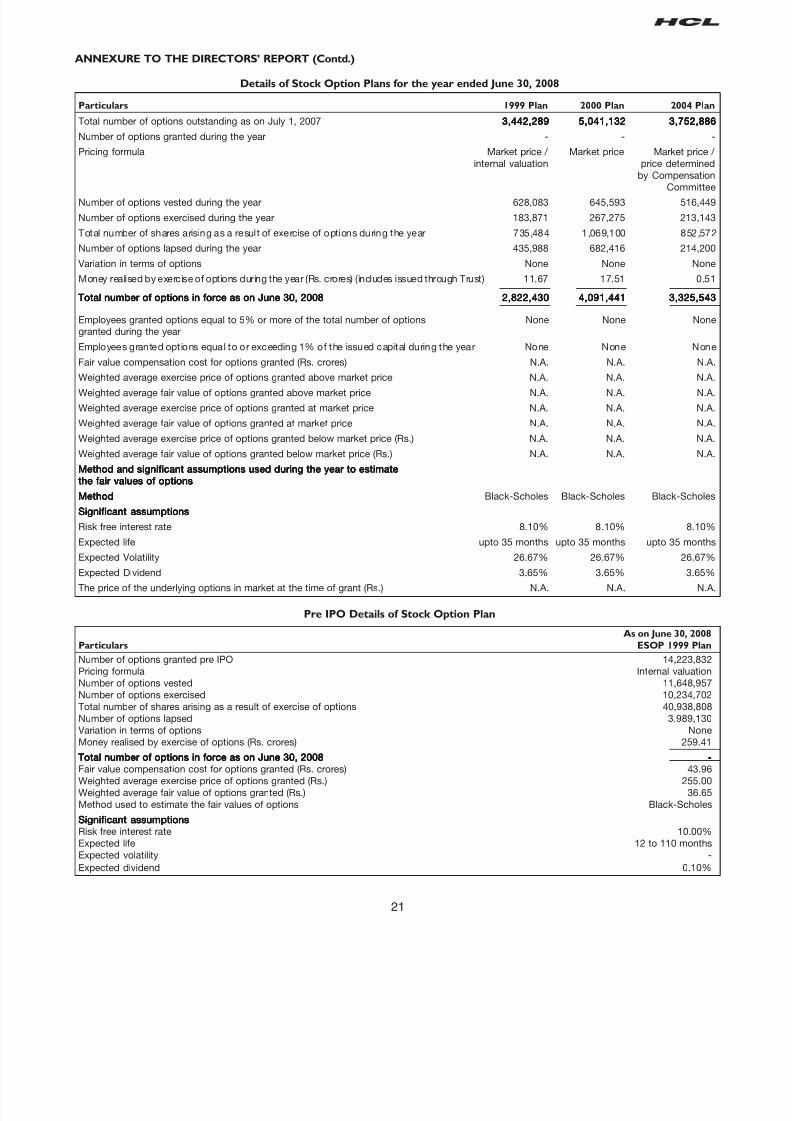
8/7/2019 Indian_GAAP_07-08
http://slidepdf.com/reader/full/indiangaap07-08 22/12521
Particulars 1999 Plan 2000 Plan 2004 Pla
Total number of options outstanding as on July 1, 2007 3,442,2893,442,2893,442,2893,442,2893,442,289 5,041,1325,041,1325,041,1325,041,1325,041,132 3,752,883,752,883,752,883,752,883,752,88
Number of options granted during the year - -
Pricing formula Market price / Market price Market price
internal valuation price determine
by Compensatio
Committe
Number of options vested during the year 628,083 645,593 516,44
Number of options exercised during the year 183,871 267,275 213,14
Total number of shares arising as a result of exercise of options during the year 735,484 1,069,100 852,57
Number of options lapsed during the year 435,988 682,416 214,20
Variation in terms of options None None Non
Money realised by exercise of options during the year (Rs. crores) (includes issued through Trust) 11.67 17.51 0.5
Total number of options in force as on June 30, 2008Total number of options in force as on June 30, 2008Total number of options in force as on June 30, 2008Total number of options in force as on June 30, 2008Total number of options in force as on June 30, 2008 2,822,4302,822,4302,822,4302,822,4302,822,430 4,091,4414,091,4414,091,4414,091,4414,091,441 3,325,543,325,543,325,543,325,543,325,54
Employees granted options equal to 5% or more of the total number of options None None Nongranted during the year
Employees granted options equal to or exceeding 1% of the issued capital during the year None None Non
Fair value compensation cost for options granted (Rs. crores) N.A. N.A. N.AWeighted average exercise price of options granted above market price N.A. N.A. N.A
Weighted average fair value of options granted above market price N.A. N.A. N.A
Weighted average exercise price of options granted at market price N.A. N.A. N.A
Weighted average fair value of options granted at market price N.A. N.A. N.A
Weighted average exercise price of options granted below market price (Rs.) N.A. N.A. N.A
Weighted average fair value of options granted below market price (Rs.) N.A. N.A. N.A
Method and significant assumptions used during the year to estimateMethod and significant assumptions used during the year to estimateMethod and significant assumptions used during the year to estimateMethod and significant assumptions used during the year to estimateMethod and significant assumptions used during the year to estimate
the fair values of optionsthe fair values of optionsthe fair values of optionsthe fair values of optionsthe fair values of options
MethodMethodMethodMethodMethod Black-Scholes Black-Scholes Black-Schole
Significant assumptionsSignificant assumptionsSignificant assumptionsSignificant assumptionsSignificant assumptions
Risk free interest rate 8.10% 8.10% 8.10%
Expected life upto 35 months upto 35 months upto 35 monthExpected Volatility 26.67% 26.67% 26.67%
Expected Dividend 3.65% 3.65% 3.65%
The price of the underlying options in market at the time of grant (Rs.) N.A. N.A. N.A
ANNEXURE TO THE DIRECTORS’ REPORT (Contd.)
Details of Stock Option Plans for the year ended June 30, 2008
Pre IPO Details of Stock Option Plan
As on June 30, 2008
Particulars ESOP 1999 Plan
Number of options granted pre IPO 14,223,832
Pricing formula Internal valuation
Number of options vested 11,648,957
Number of options exercised 10,234,702
Total number of shares arising as a result of exercise of options 40,938,808
Number of options lapsed 3,989,130
Variation in terms of options NoneMoney realised by exercise of options (Rs. crores) 259.4
Total number of options in force as on June 30, 2008Total number of options in force as on June 30, 2008Total number of options in force as on June 30, 2008Total number of options in force as on June 30, 2008Total number of options in force as on June 30, 2008
Fair value compensation cost for options granted (Rs. crores) 43.96
Weighted average exercise price of options granted (Rs.) 255.00
Weighted average fair value of options granted (Rs.) 36.65
Method used to estimate the fair values of options Black-Schole
Significant assumptionsSignificant assumptionsSignificant assumptionsSignificant assumptionsSignificant assumptions
Risk free interest rate 10.00%
Expected life 12 to 110 month
Expected volatility
Expected dividend 0.10%
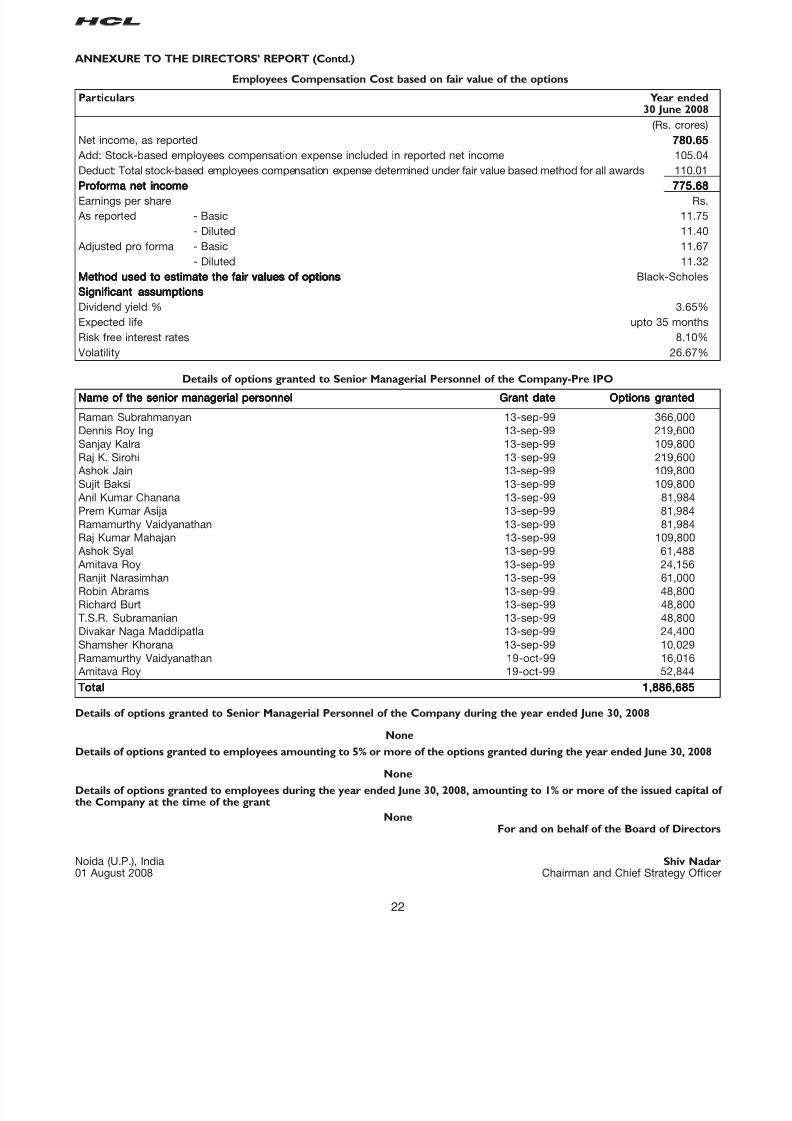
8/7/2019 Indian_GAAP_07-08
http://slidepdf.com/reader/full/indiangaap07-08 23/12522
ANNEXURE TO THE DIRECTORS’ REPORT (Contd.)
Employees Compensation Cost based on fair value of the options
Particulars Year ended30 June 2008
(Rs. crores)
Net income, as reported 780.65780.65780.65780.65780.65
Add: Stock-based employees compensation expense included in reported net income 105.04
Deduct: Total stock-based employees compensation expense determined under fair value based method for all awards 110.01
Proforma net incomeProforma net incomeProforma net incomeProforma net incomeProforma net income 775.68775.68775.68775.68775.68
Earnings per share Rs.
As reported - Basic 11.75
- Diluted 11.40
Adjusted pro forma - Basic 11.67
- Diluted 11.32
Method used to estimate the fair values of optionsMethod used to estimate the fair values of optionsMethod used to estimate the fair values of optionsMethod used to estimate the fair values of optionsMethod used to estimate the fair values of options Black-Scholes
Significant assumptionsSignificant assumptionsSignificant assumptionsSignificant assumptionsSignificant assumptions
Dividend yield % 3.65%
Expected life upto 35 months
Risk free interest rates 8.10%
Volatility 26.67%
Details of options granted to Senior Managerial Personnel of the Company-Pre IPO
Name of the senior managerial personnelName of the senior managerial personnelName of the senior managerial personnelName of the senior managerial personnelName of the senior managerial personnel Grant dateGrant dateGrant dateGrant dateGrant date Options grantedOptions grantedOptions grantedOptions grantedOptions granted
Raman Subrahmanyan 13-sep-99 366,000
Dennis Roy Ing 13-sep-99 219,600
Sanjay Kalra 13-sep-99 109,800
Raj K. Sirohi 13-sep-99 219,600
Ashok Jain 13-sep-99 109,800
Sujit Baksi 13-sep-99 109,800
Anil Kumar Chanana 13-sep-99 81,984
Prem Kumar Asija 13-sep-99 81,984
Ramamurthy Vaidyanathan 13-sep-99 81,984
Raj Kumar Mahajan 13-sep-99 109,800
Ashok Syal 13-sep-99 61,488
Amitava Roy 13-sep-99 24,156
Ranjit Narasimhan 13-sep-99 61,000
Robin Abrams 13-sep-99 48,800
Richard Burt 13-sep-99 48,800
T.S.R. Subramanian 13-sep-99 48,800
Divakar Naga Maddipatla 13-sep-99 24,400
Shamsher Khorana 13-sep-99 10,029
Ramamurthy Vaidyanathan 19-oct-99 16,016
Amitava Roy 19-oct-99 52,844
TotalTotalTotalTotalTotal 1,886,6851,886,6851,886,6851,886,6851,886,685
Details of options granted to Senior Managerial Personnel of the Company during the year ended June 30, 2008
None
Details of options granted to employees amounting to 5% or more of the options granted during the year ended June 30, 2008
None
Details of options granted to employees during the year ended June 30, 2008, amounting to 1% or more of the issued capital the Company at the time of the grant
NoneFor and on behalf of the Board of Directo
Noida (U.P.), India Shiv Nad01 August 2008 Chairman and Chief Strategy Offic

8/7/2019 Indian_GAAP_07-08
http://slidepdf.com/reader/full/indiangaap07-08 24/12523
Sl. Name Age Designation / Educational Remuneration Date of Experience Previous Designation held in Previuos
No ( in yrs.) Nature of duties Qual ifications (Rs.) Joining in Years Employment previuos employment employment held sin
1 Amit Shekhar 43 Practice Director Doctorate 2,444,077 13-Jun-06 18 i2 Technologies Director Nov.9
- CRM
2 Anand Pillai 49 Senior Vice President PGD, FMS/CSMS 5,405,176 1-Jun-05 25 Clime President & Chief Mentor Sep.0
- T2ID3 Ananth Vaidyanathan 39 Vice President B. Tech (Electronics) 4,390,189 21-May-07 17 Infosys Technologies Associate Vice President Jan.9
Ltd.
4 Anil Chanana 50 Executive Vice CA 6,285,456 1-Jan-07 27 HCL Technologies Executive Vice President Dec.8
President-Finance America Inc.
5 Anil Gupta 53 Vice President B.Tech, M.Tech 3,833,809 1-Jan-06 31 HCL Japan Ltd. Vice President Jan.0
6 Anup Dutta 49 Vice President BE (Electrical), 4,025,020 1-Jul-96 27 HCL Hewlett Senoir Manager Jul.8
M.Tech (Electrical) Packard Ltd.
7 Arjun Raghunathan 51 Technology Director BE (Electronics & 3 ,119,473 1-Jul-96 27 HCL Hewlett Senoir Manager Aug.8
Commn.Engineering), Packard Ltd.
ME (Computer Science)
8 Ashok Kumar M. 47 Vice President B.Tech 3,410,983 16-Mar-94 23 HCL Infinet Ltd. Head & Vice President Jun.200
9 Ashutosh Kaushik 45 General Manager MBA 2,545,080 24-Mar-94 24 HCL Comnet Ltd. DGM Mar.9
10 Badrinath Krishna 51 Principal MBA 4,163,546 19-Dec-05 29 Synergy Log-In Whole Time Director Apr.9
Systems Ltd.
11 Bala Chander D M 45 General Manager - CSA 2,531,400 3-Jan-05 21 Lovelock & Lewes Senoir Manager Jun.9
Internal Audit
12 Chitra Rajan 47 Global Technology M. Tech 2,401,531 1-Apr-98 23 Subconhacted Intel Consultant Jan.8Director - ATG
13 Dakshina Murthy Chaganti 54 Associate V ice M.A., PGDM 3,457,955 1-May-03 30 HCL Infosystems Ltd. Associate V ice President Dec.7
President
14 Davidson Devavaran 49 Senior Vice President M.Sc, MS 3,634,340 2-Apr-03 24 DSQ Software Ltd. Chief Operating Off icer Aug.9
15 Deepak Aggarwal 34 General Manager CA 2,488,764 22-Feb-07 11 Indian Oil Senoir Accounts Officer Jan.9
- Finance Corporation Ltd.
16 Deval Shah 41 Global Operations BE (Electronics), 2,668,208 13-Mar-00 16 HCL Poret Systems Project Director Mar.200
Director MS (Computer
Science)
17 Dharmander Kapoor 42 Practice Director MCA 3,623,384 21-Apr-03 17 Xavient Techniologies Program Manager Mar.0
18 Dilip Srivastava 49 Senior Vice MSW (HR & IR) 5,407,499 7-Jun-05 25 Vanguard Solutions Vice President - HR Apr.0
President - Corp HR
19 Dinesha L G 50 Associate Vice M.Sc., PGD (Finance 2,865 ,210 6-Oct-03 28 I-Flex Solutions Ltd. Principal Consu ltant Apr.0
President & Marketing)
20 Gade Rao 50 Corporate Vice BE (Electronics) 4,124,179 1-Jul-96 27 HCL Hewlett Senoir Manager - R & D Nov.8
President Packard Ltd.
21 Ganesh Nerur 54 Associate Vice B.Sc. 2,430,035 7-Feb-97 32 HCL Infosystems Ltd. General Manager Feb.9President
22 Goutam Rungta 35 Associate Vice CA 2,736,992 1-Mar-07 12 General Motors India General Manager Jul.0
President - Finance Pvt. Ltd.
23 Gunaseelan Narayanan 53 Sen ior Corporate M.Tech (Computer 5,127 ,027 1-Jul-96 28 HCL Hewlett General Manager Aug.7
Vice President Science) Packard Ltd.
24 Harsha Mutt 44 Vice President B.Tech 5,609 ,040 7-Aug-06 22 In fosys Technologies VP & Head of Delivery,Banking& Aug.8
- Operations CMS (Mechanical. Ltd. Capital Market
Engineering), CA
25 Hemant Kumar 54 Associate V ice B.Tech (Electr ical ) 3,853,151 1-Aug-05 31 Canon India Pvt. Ltd. Director & General Manager Apr.9
President
26 Jagathesan Arumugam 57 Associate Vice BE (Electronics), 2,577,588 24-Jan-00 34 Crompton Greaves Ltd. Deputy General Manager Sep.9
President MBA (Finance)
27 Jyoti Das 49 Associate Vice MBA (Computer 3,362 ,962 1-May-06 21 Raff les Software Pvt. Head - Business Development Jun.0
President - BMG Science), MSc Ltd.
(Finance)
28 Kabilan Adiypatham 53 Vice President MTech 2,700,814 4-Mar-97 28 New Concept Consultant Dec.8
Operations
29 Kaleeswaran Viswanathan 46 Deputy General M.Tech 2 ,713 ,733 3-Nov-06 22 Future Sof tware Ltd. Directo r(Engineering) Apr .9
Manager
30 Kannan Veeraraghavan 50 Vice President B.Com & 5,381,331 1-Aug-05 26 KPMG Peat Marwick Executive Director - Jun.9
Certificate Courses Software Process
31 Krishnamurti Rao 51 Associate Vice MBA 2,991,919 8-Dec-97 27 Tata Consultancy Senior Consultant May.8
President Service Ltd.
32 Madan Mulwan i 54 Vice President - Poytechnic . 2,581 ,125 1-Apr-88 33 HCL Infosystems Ltd. Deputy General Manager - Apr.8
Projects Diploma Projects
33 Madan Srinivasan 39 HR Director - B.Tech, MBA ) 3,898,655 2-May-07 15 Pepsico India Holding Vice President Aug.0
Transitions (PM & IR) Pvt. Ltd.
Management
34 Mahalingam Sundararajan 39 Associate Vice B.Tech (Chemical 2,465,397 14-Nov-05 16 J. Walter Thompson Associate Vice President Feb.0
President - Markting Engineering), PGDM - Strategic Planning
ANNEXURE TO THE DIRECTORS’ REPORT (Contd.)
Statement under Section 217 (2A) of the Companies Act, 1956 forming part of Directors’ Report
A. EMPLOYED FOR FULL FINANCIAL YEAR - 2007-08

8/7/2019 Indian_GAAP_07-08
http://slidepdf.com/reader/full/indiangaap07-08 25/12524
35 Manohar Lal Taneja 62 Vice President-Human MBA 2,404 ,587 5-Sep-06 40 HCL Infosystems Ltd. Executive Vice President Jan.8
Resources
36 Meena Vaidyanathan 36 General Manager PGD - Marketing 2,954,246 1-Dec-06 14 Honeywell Director Mar.0
37 Mohammed Salman 47 Vice President MBA - Marketing 3,654,668 10-Nov-06 23 Perot Systems General Manager Jun.0
38 Mural i Jayaraman Sr in ivasa 49 Vice Pres ident B.Tech (Chemical 3,031,434 1-Apr-05 26 Tata Consultancy Princ ipal Consultant Sep.9
-Operations Engineering) Services Ltd.
39 Murali K S 45 Global Operations B.Tech 2,403,974 10-Mar-05 20 PSI Data Systems Ltd. Vice President Mar.9
Director - Penstock
40 Murali Raghavan 43 Senior Vice President CA, MBA 5,421,680 27-Sep-05 20 Hewlett-Packard Practice Head - ERP Jun.0
(Marketing) Globalsoft Ltd.
41 Nalin Mittal 36 General Manager CA 2,539,690 15-Nov-96 12 Price Waterhouse Articleship Jul.9
Coopers
42 Prabhakara Rao Arrabolu 51 Senior V ice Pres ident B.Com MBA 3,260,916 1-Sep-04 27 Bir la Soft Global Head -Human Capital Jun.0
-Human Resources Management
43 Prabhuraman Sayanam 38 Associate V ice B.Tech (Computer 2,562,831 1-Jul-96 20 HCL Hewlett Packard Asstt. Manager - R&D Aug.8
President Science) Ltd.
44 Prahlad Bansal 51 Corporate Vice CA 3,577,082 1-Dec-94 28 HCL Ltd. DGM - Finance Sep.8
President-Finance
45 Pramod Gupta 47 Vice President MBA 3,694,049 8-Jun-01 24 Ariba Technologies Technical Director Jul.200
India
46 Prem Asija 58 Senior Corporate BE 6,343,417 1-Sep-97 39 APT Automation Director Jan.9
Vice President
47 Premkumar Seshadri 49 Corporate Vice MBA 13,330,186 29-Aug-03 25 Fugen IT Ltd. Founder & CEO May.9
President
48 Raj Malik 48 Vice President B.Tech 2,792,161 28-Jul-97 26 Commonwealth Bank Project Manager May.9
49 Raj Walia 42 Vice President B.Com , CWA 2,617,183 5-Jun-95 21 Pitzer Deputy General Manager Jun.9
50 Rajbir Singh 43 Practice Director B.Tech, MBA 2,849 ,231 14-Apr-04 20 Oracle India Pvt Ltd. Consulting Industry Manager Oct .0
- CRM (Marketing)
51 Rajiv Gupta 46 Senior Vice B.Sc. 3,346,102 17-Mar-03 24 Daksh E Services Head Operation Support Mar.0
President-Operations
(Telecomunications
Vertical)
52 Rajiv Sodhi 49 Corporate Vice B.Tech, MBA 4,168,512 24-Jul-97 27 Tata Consultancy Manager Systems Jul.8
President Services Ltd.
- Operations
53 Rajiv Swarup 56 Corporate Vice MBA 5,099,501 8-Mar-00 34 Modi Corpoartion Ltd. Director Business Development Sep.9
President
54 Rajnesh Avtar 40 Global Operations MBA 2,820,044 31-Jul-06 18 HP (USA) Senoir Software Manager May.9Director
55 Rakesh Singh 42 General Manager MCA 2,424,174 1-May-06 18 FCS Software Solutions Vice President - Delivery Dec.0
56 Ramachandra Kerur 56 Program Director BE (E lectr ical ), 3,406,856 17-Jun-02 31 Nuntius Systems Ltd. Chief Executive Officer Feb.0
M.Tech (Electronics)
57 Ramachandran Kalpathy 51 Practice Director B.Tech (Erlectrical) 2,528,173 9-Apr-01 30 Dusk Valley Tech. CIO Oct.200
-Servers And Storage
58 Ramaiah Sethuramalingam 40 Deputy General B .Tech 2,471 ,181 27-Jan-94 19 HCL Peripherals Ltd. Senior Manager R & D Ju l.9
Manager
59 Ramakrishna Venkatraman 56 Corporate Vice M.Tech (Electronics 5,291,949 23-Jul-03 33 Eximsoft Technolgies Managing Director Apr.9
President - Banking Engineering) Pvt. Ltd.
Practices
60 Ramakrishnan Venkatraman 48 Associate Vice M.Sc. - Electronics 2,793 ,944 8-Aug-06 25 Accenture Tech Senior Manager Ju l.0
President
61 Ramamurthy Vaidyanathan 53 Executive Vice B.E. (Metallurgy) 6,182,670 1-Jul-96 27 HCL Hewlett DGM - R & D Jul.8
President Packard Ltd.
62 Ramesh Ganesh 42 Associate Vice M.E. (Electronical. 2,883,636 7-Apr-97 18 Tata Electric Deputy Exe Engr Sep.9
President Engineering)
63 Ramesh Nathawani 45 Associate Vice BE (Comp.Science) 3,111,213 1-Mar-02 22 Planetasia Ltd. Head - ADG Oct.200
President
64 Rangarajan Raghavan 49 Senior Vice Diploma in 3,899,494 1-Apr-03 30 HCL Infinet Ltd. Business Head Apr.0
President- Operations Electrical
(Retail Vertical) Engineering
65 Ranjit Narasimhan 54 Executive Vice MBA 9,498,414 15-Apr-99 30 Riviera Confectionery Managing Director Jul.8
President Pvt. Ltd.
66 Rav i Kumar 53 Vice Pres ident PGD - Market ing 3,128,068 19-Mar-07 28 Start Indian Pvt. Ltd. Vice President - Corporate Affairs Mar.0
-Strategic Employee
Comm.
67 Ravi Shankar B 48 Senior Vice President MBA 4,782,623 5-Jul-04 26 Lister Tech President Jul.200
-TMG
Sl. Name Age Designation / Educational Remuneration Date of Experience Previous Designation held in Previuos
No ( in yrs.) Nature of duties Qualif ications (Rs.) Joining in Years Employment previuos employment employment held sin
ANNEXURE TO THE DIRECTORS’ REPORT (Contd.)
Statement under Section 217 (2A) of the Companies Act, 1956 forming part of Directors’ Report
A. EMPLOYED FOR FULL FINANCIAL YEAR - 2007-08

8/7/2019 Indian_GAAP_07-08
http://slidepdf.com/reader/full/indiangaap07-08 26/12525
68 Ravindra Nuguri 43 Global Program BE (Electronics 2,528,608 4-Feb-04 21 Tektronix Engg Ltd. Program Manager Jun.200
Director & Commn.), PGD
in S/W Technology
69 Ravishankar Sethuraman 41 Associate Vice BE (Electronics 2,416,774 8-Jul-99 19 DSQ Project Manager Apr.9President & Commn.)
70 Rita Gupta 46 Vice President CA 2,922,572 1-Jul-96 21 HCL Hewlett Manager - Finance Nov.8
Packard Ltd.
71 S Sivaguru 51 Associate Vice BE (Electronics) 3,460,791 8-Sep-04 28 Global Automatation Vice President Jun.9
President India Pvt Ltd.
72 Sandeep Raizada 42 Associate Vice BE (Electrical 3,332,012 19-Dec-05 20 Hewlett Packard Program Manager Feb.0
President - SAP Practice Engineering) Globalsoft Ltd.
73 Sandip Gupta 49 Corporate Vice CA 3,690,457 1-Oct-05 26 HCL Coment Systems Vice President Oct.9
President-FA& P & Services Ltd.
74 Sanjeev Nikore 48 Corporate Vice MBA 5,052,481 1-Oct-05 24 HCL Comnet Systems COO Jul.9
President-Sales& & Services Ltd.
Marketing
75 Sankar Venkatraman 38 Vice President BE (Electrical 3,963,269 14-Jul-06 12 Xansa Vice President Jan.0
& Elec.), MBA
76 Sateesh Tiptur 49 Associate Vice Phd. 3,786,726 22-Jan-01 26 Mphasis BFI Ltd. AGM - Technical Oct.9
President - Operations
77 Saurav Adhikari 50 Corporate Vice MBA 5,492,695 1-Nov-02 28 HCL Infinet Ltd. President Jan.200President
78 Shankar Subramanian 47 General Manager B.Tech 2,420,712 10-Mar-97 23 ICIL Senoir Consultant Oct.9
79 Sheela Mohan 44 Associate Vice B.Tech, M.Tech 2,741,120 6-Dec-99 21 Cadence Design Program Manager May.9
President (Computer Science) System
80 Shushil Kumar Saxena 51 General Manager MBA 2,492,060 28-Aug-97 21 Bharat Electronics Manager Apr.8
81 Sidhartha Chowdhury 53 Vice President MBA 2,568,668 8-Aug-00 30 EI&T Computers Manager EDP Jun.8
82 Sivaramakrishnan S 58 General Manager PG-Personnel 2 ,834 ,167 8-Apr-05 30 Siemens Shared Head - Bites Operations Feb.0
Management., Services
LLB, M.Sc.
83 Soami Narang 47 Vice President MBA 3,701,196 24-Apr-06 23 Satyam Computers Ltd. Vice President May.200
84 Solomon Suresh 47 General Manager - HR Phd. 2,517,370 5-Jan-07 15 Genpact Ltd. Vice President Mar.0
85 Sri Venkateswarlu B 42 Associate Vice B.Tech (Mech.), 3,121,882 13-Dec-05 20 Hewlett Packard Project Manager Sep.0
President - SAP MBA (Marketing)
Practice
86 Sridhara Rajan 45 Global Delivery M.Sc (Computer 3,577,071 12-Dec-05 23 Tata Consultancy Senior Consultant Jun.9
Head - SAP Practice Science) Services Ltd.
87 Srinath Sriram 48 Associate Vice B.Sc. 2,491,177 17-Nov-03 27 Bahwan Cybertek Tech Chief Executive Officer Apr.200President
88 Sriram Vaitheeswarankovil 51 Corporate Vice MBA 5,811,859 1-Oct-01 30 Cit i Corp Overseas Centre Head-Chennai Nov.8
President Software Ltd.
89 Sumathi Gurumurthi 47 Vice President M.A. 2,833,370 1-Jul-06 28 Bharti Airtel Ltd. VP Service Delivery Oct.9
Operations
90 Sumit Bhattacharya 59 Executive Vice BA ,MBA 3,248,331 21-Jan-02 36 Insync-Technology Chief Executive Officer Jun.9
President-Marketing
(BPO Division)
91 Sunil Kumar 49 Associate Vice M.Tech 2,561,984 1-Aug-96 28 Tata Unisys Group Manager Jan.9
President (Management &
Systems)
92 Sunita 46 CIO & Vice President M. Com 3,520,271 1-Oct-05 25 HCL Comnet Systems Associate Vice President Aug.9
& Services Ltd.
93 Suresh Sundaram 41 Vice President B.Tech 3,069,827 2-Jan-01 20 HCL Technologies Account Manager Jul.8
(Mechanical) America Inc.
94 Swaminathan Nagarajan 43 Operations Director MBA 2,775,843 27-Nov-03 10 India Software Group Principal Consultant Ju l.0
95 Tom Thomas 44 Vice President MBA 4,920,809 1-Aug-05 17 Self Employed Consultant Apr.0
96 Tony Ponniah 45 Associate Vice Phd. 3,016,767 15-Mar-07 21 Wipro Technologies Ltd. General Manager Sep.0
President
97 Udayakumar Nalinasekaren 48 Senior Vice President BE, ME 3,762 ,394 1-Jul-97 24 HCL Hewlett Group Project Manager Ju l.8
(Computer Science) Packard Ltd.
98 Unni Krishnan 55 Associate Vice BE (Mechnical), 2,791,924 14-Jul-04 31 Rave Technologies Delivery Head Apr.0
President M.Tech (Indl.
Engineering &
Management)
99 Ut tama Mukherjee 40 Practice Director- BE (Electrical) 3,329 ,247 18-Jan-07 19 Patni Computers Ltd. Senior Manager Mar.0
Business Intelligence
100 Vaidyanathan V iswanathan 47 V ice President B.Tech, MBA 3,652,963 5-Jul-06 22 iGate Globa l Solutions V ice Pres ident Mar.200
101 Vasudevan Aravamudhan 49 Vice President BE (Electronics) 3,997,485 1-Jul-96 25 HCL Hewlett Manager - R&D Dec.8
Packard Ltd.
Sl. Name Age Designation / Educational Remuneration Date of Experience Previous Designation held in Previuos
No ( in yrs.) Nature of duties Qual ifications (Rs.) Joining in Years Employment previuos employment employment held sin
ANNEXURE TO THE DIRECTORS’ REPORT (Contd.)
Statement under Section 217 (2A) of the Companies Act, 1956 forming part of Directors’ Report
A. EMPLOYED FOR FULL FINANCIAL YEAR - 2007-08

8/7/2019 Indian_GAAP_07-08
http://slidepdf.com/reader/full/indiangaap07-08 27/12526
102 Vasudevan Ramanujam 54 Vice President - CA 2,565,019 5-Mar-07 27 TVS Electronics Ltd. Vice President Jun.200
Campus Infrastructure
103 Venkatesan 50 Associate Vice BE, ME 2,565,699 30-Sep-98 25 Alstom Area Manager Jul.8
Muthukumaraswami President (Electronics)
104 Vijay Ahooja 51 Associate Vice MBA 3,882,464 16-Jul-01 29 Price Waterhouse Principal Consultant May.9
President Associates
105 Vijay Guntur 39 Vice President M.Sc (Computer 3,671,656 1-Jul-96 19 HCL Hewlett Deputy Manager Jun.8
Science), MBA Packard Ltd.
106 Vijay Mallya 43 Associate Vice MBA 2,903,500 21-Sep-98 23 State Bank Of India Associate Manager May.8
President
107 Vijay Reddy 53 SeniorVice President B. Sc.,M. Sc. 3,374,493 17-Feb-03 26 SCB Manager-IT Services Dec.9
- Technology
108 Vinay Gokhale 40 Associate Vice MBA 3,137,348 1-Mar-07 21 ITC Ltd. Assistant General Manager Jul.0
President
109 Vineet Nayar 46 Chief Executive MBA 29,042,401 1-Sep-05 23 HCL Comnet Systems Chief Executive Officer Jan.9
Officer & Services Ltd.
110 Vinit Bahri 43 Associate Vice CA 2,404,498 25-May-98 19 Apollo Tyres Manager May.9
President
111 Vinodh Chelambathodi 42 Associate Vice MBA 3,975,408 2-May-07 18 Aricent Associate VicePresident - HR Feb.0
President - Human
Resources
112 Viswanathan Balakrishnan 53 Senior Vice President B.Tech, PGDM 3 ,605,039 3-Mar-03 29 Meru Consultants Di recto r May.200
-Strategy (P) Ltd.
113 Vittal Devarajan 39 General Manager MBA 2,809,704 31-Mar-06 15 Ramco System Ltd. Head - Corporate Marketing Feb.0
- BMG
B. EMPLOYED FOR PART OF THE FINANCIAL YEAR - 2007-08
Sl. Name Age Designation / Educational Remuneration Date of Experience Previous Designation held in Previuos
No ( in yrs.) Nature of duties Qualif icat ions (Rs.) Joining in Years Employment previuos employment employment held sin
1 Amit Roy 49 Vice President - B. Com, CA 5,313,431 16-Jul-07 24 Samsung Electronics V ice President - Taxation Sep.0
Taxation
2 Amitabha Sinha 50 Vice President MBA 886,021 24-Mar-08 26 Keane Worldzen Managing Consulting Partner Sep.0
3 Anil Dhankher 39 Associate Vice MBA 820,140 16-Aug-06 17 ICICI Onesource Ltd. General Manager-HR Sep.0
President
4 Anil Sethi 39 Associate Vice MBA 758,589 11-Apr-08 17 Prudent IT Services VP & Member of The Board Jun.0President Pvt. Ltd.
5 Anirvanjyoti Chaudhuri 41 General Manager MA 543,520 19-Jun-06 18 IBM Country Leader (Deputy. Aug.200
General Manager)
6 Ashutosh Dhawan 40 Associate Vice MBA 1,326,855 7-Apr-08 16 Aricent Technologies AssociateVice President Dec.0
President - Finance - Finance
7 Atish Dasgupta 59 General Manager B.Tech, MBA 1,150,000 2-Jan-04 28 Synapz Management Principal Management Jan.0
Services Consulatnt
8 Binno Joseph 38 General Manager PGD 2,451,844 4-Jul-07 12 Coats Manager Jun.9
- Human Resources
9 Chandrasekharan 47 Global Operations M.Sc. 1,509,821 20-Dec-07 22 Aztecsoft Ltd. General Manager Dec.0
Kasinarayanan Director
10 Debajyoti Das 53 Head-Delivery M.Sc. 1,037,377 3-Nov-04 3 Timken Manager (Knowledge Management) Oct.0
11 Devasis Ghosh 46 Associate Vice MBA 2,099,067 1-Jul-00 20 HCL Infosystems Ltd. Project Manager Sep.9
President
12 Durga Kancherla 39 Operations Director MBA 472,675 7-May-08 15 Miracle Software Vice President Mar.0
Systems
13 Frederick Mony 60 Vice President M.Tech 1,380,132 11-Mar-02 35 Value Software Tech Chief Operating Officer Apr.014 Gopinath Rangaraja 50 General Manager M.Sc. 2,259,002 11-Aug-86 27 M/S Systems Dimensio Engineer Sep.8
- Quality
15 Harikumar Mahadeva Iyer 49 Associate Vice MBA 1,912,715 1-Oct-07 25 Al Rosta Mani Comm Div Manager Jun.0
President
16 Jagdish Prasad 43 Associate Vice M.Tech 913,231 17-Mar-08 22 Diebold Software Director (India Offshore Head) Aug.0
President Services Pvt. Ltd.
17 Jasmohan Mamak 46 Associate Vice MBA 2,346,405 1-Oct-07 27 Saksoft Ltd. Global Sales Director Mar.0
President
18 Javed Shaikh 42 Deputy General B.Tech 516,499 15-Sep-97 16 RGI Senoir Manager- Projects Apr.9
Manager and R&D
19 Manav Sehgal 34 General Manager B.Tech 450,008 1-May-08 16 The 5Th Medium Vice President Sep.0
Ltd.
Sl. Name Age Designation / Educational Remuneration Date of Experience Previous Designation held in Previuos
No ( in yrs.) Nature of duties Qualif ications (Rs.) Joining in Years Employment previuos employment employment held sin
ANNEXURE TO THE DIRECTORS’ REPORT (Contd.)
Statement under Section 217 (2A) of the Companies Act, 1956 forming part of Directors’ Report
A. EMPLOYED FOR FULL FINANCIAL YEAR - 2007-08

8/7/2019 Indian_GAAP_07-08
http://slidepdf.com/reader/full/indiangaap07-08 28/12527
ANNEXURE TO THE DIRECTORS’ REPORT (Contd.)
Statement under Section 217 (2A) of the Companies Act, 1956 forming part of Directors’ Report
A. EMPLOYED FOR FULL FINANCIAL YEAR - 2007-08
Sl. Name Age Designation / Educational Remuneration Date of Experience Previous Designation held in Previuos
No ( in yrs.) Nature of duties Qual ifications (Rs.) Joining in Years Employment previuos employment employment held sin
20 Manjunatha Hebbar 41 Vice President MBA 2,945,433 19-Jul-07 18 iGate Global Associate Vice Apr.0
Solutions Ltd. President - IT Delivery
21 Mukund Garg 38 Associate Vice B.Tech 1,114,103 18-Feb-08 16 Satyam Computer Associate Vice President Jun.0
President Services Ltd.
22 P K Viswanath Sastry 39 General Manager B.Com, 1,700 ,561 7-Apr -03 17 Tube Investments Senoir Manager - Systems Ju l.9
Diploma-Technical
23 Prabhat Goenka 41 Associate Vice CA, CS, CWA 521,868 1-Mar-95 17 Tinplate Company Senoir Accounts Officer Jan.9
President of India
24 Prateek Aggarwal 41 Senior Vice President MBA-Finance 3,322,904 17-Aug-05 17 GE Capital Vice President Feb.0
International Services
25 Ramakrishnan R 40 Business Solutions B.Tech 1,583 ,360 6-Oct-06 18 SAP Labs India Pvt. Ltd. Developer Manager Jan.200
Strategist
26 Raman Subrahmanyan 67 Advisor B.Tech 1,432,258 14-Mar-08 30 HCL Technoloiges Ltd. President & Chief Operating Officer Apr.9
27 Ramesh Visweswaraiah 44 General Manager B.Tech 869,740 5-Feb-07 20 Brooks Software Senior Program Manager Oct.0
- PMO - GPMO & QPE
28 Sandeep Mitra 37 Deputy General MBA 951,974 1-Jan-04 14 HCL America Inc. BDM Jul.0
Manager
29 Sanjeev Sharma 48 Associate Vice B.Tech - Electronics 2,966,864 18-Jul-07 26 Xansa India COO-Eas Execut ive Consultant Jun.0
President - SAP Engineering
Delivery
30 Santanu Mukherjee 53 Senior Vice President B.Tech 1,495,906 2-Apr-08 31 Genpact India Vice President Jun.0- Campus
Infrastructure
31 Shyamlal Bhattacharya 55 Vice President B.Sc., BE/B.Tech 568,493 1-Apr-08 30 HCL Comnet Systems Vice President-Service Delivery Nov.0
- Service Delivery and Services Ltd.
32 Sreelal Ramachandran 40 Deputy General B.Tech 416,993 8-May-08 18 Saksoft Senoir Vice President Sep.200
Manager - Delivery & Quality
33 Srinivasan Raman 49 Vice President B.E. 477,195 26-Oct-06 16 Collabnet Director Oct.0
- Marketing
34 Tanmoy Roy Choudhury 38 India Head - MBA 1,602,967 10-Dec-07 14 Microsoft Corporation Inside Sales Manager Mar.0
Captive Center Business India Pvt. Ltd.
35 T irthankar Banerjee 46 General Manager B.Tech 2 ,137 ,881 3-Sep-07 23 Sun Microsystems India Head - Software Sales Oct.200
36 Veera Patil 56 Deputy General M.Sc. 1,381,613 22-Sep-00 29 HCL EAI Services General Manager Sep.200
Manager Private Ltd.
37 Venkatesan Varadachari 47 Global Operations MBA 1,989,289 9-Feb-04 22 SSI Technologies Vice President Apr.9
Director
38 Vijay Sati 44 Associate Vice MBA 3,295,831 4-Dec-06 20 Pepsi Vice President- Purchase Nov.0
President
Notes:Notes:Notes:Notes:Notes:
1. None of the employees listed above is a relative of any director of the Company.
2. The nature of employment is contractual in all the above cases.
3. None of the employee listed above owns 2% or more of the paid-up equity share capital of the Company.

8/7/2019 Indian_GAAP_07-08
http://slidepdf.com/reader/full/indiangaap07-08 29/12528
Corporate Governance is based on the principles of integrity,
fairness, equity, transparency, accountability and commitment
to values. Good governance practices stem from the culture
and mindset of the organization. As stakeholders across the
globe evince keen interest in the practices and performance of
companies, Corporate Governance has engaged on the centre
stage.
Philosophy on Code of Governance
The Company continues to focus on good Corporate
Governance, in line with local and global standards. Its primary
objective is to create and adhere to a corporate culture of
conscience and consciousness, integrity, transparency and
accountability for efficient and ethical conduct of business for
meeting its obligations towards shareholders and other
stakeholders.
Corporate Governance is an integral part of the philosophy of
the Company in its pursuit of excellence, growth and value
creation. In addition to complying with the statutory requirements,
effective governance systems and practices towards improving
transparency, disclosures, internal controls and promotion of
ethics at work place have been institutionalized. The Company
recognizes that good governance is a continuing exercise and
reiterates its commitment to pursue highest standards of
Corporate Governance in the overall interest of all
stakeholders.
In accordance with Clause 49 of the Listing Agreement with t
Stock Exchanges in India, the report containing the details
governance systems and processes at HCL Technologi
Limited is as under:
Board of Directors
The Board of Directors ("Board") of the Company has an optimu
combination of executive, non-executive and independe
directors, who have indepth knowledge of business, in additi
to the expertise in their areas of specialization. The Boa
provides leadership, strategic guidance and an independent vie
to the Company's management. During the year, a majority
the Board comprised of independent directors. As on June 3
2008, the Board consisted of seven members, of whom, one
the promoter director who is designated as Chairman and Ch
Strategy Officer of the Company, and six are independent no
executive directors. The non-executive directors bring
external and wider perspective in Board deliberations a
decisions. The size and composition of the Board conform
the requirements of Clause 49 of the Listing Agreement with t
Stock Exchanges. Other details relating to the directors as
June 30, 2008 are given below:
CORPORATE GOVERNANCE REPORT 2007-08
Name of Director Position in the Company Directorships *Committee #Chairmanships
in other memberships in committees
companies in other of other companies
companies in which they are
members
Mr. Shiv Nadar Chairman & Chief Strategy Officer 3 2 -
Promoter Director
Mr. T.S.R. Subramanian Independent Non-Executive Director 2 - -
Mr. S. Bhattacharya Independent Non-Executive Director 6 6 4
Mr. Ajai Chowdhry Independent Non-Executive Director 7 3 -
Ms. Robin Abrams Independent Non-Executive Director 3 - -
Mr. Amal Ganguli Independent Non-Executive Director 13 8 5
Mr. P. C. Sen Independent Non-Executive Director - - -
*represents membership of Audit Committee and Shareholders' Grievance Committee of Indian public limited companies.
#represents chairmanship of Audit Committee and Shareholders' Grievance Committee of Indian public limited companies.
None of the Directors of the Company has any relationship with other Directors of the Company. The names of the other companie
entities in which the current directors are interested being a director, partner and/ or shareholder as on June 30, 20
are as under:
11111. Mr. Shiv Nadar
S. No. Name of the Company/Entity in which interested Nature of Interest
1. HCL Corporation Limited Director
• Member of Audit Committee
• Member of Selection Committee
2. HCL Comnet Systems & Services Limited • Chairman
• Member of Audit Committee
3. Indian School of Business • Director
4. HCL America Inc., USA • Director
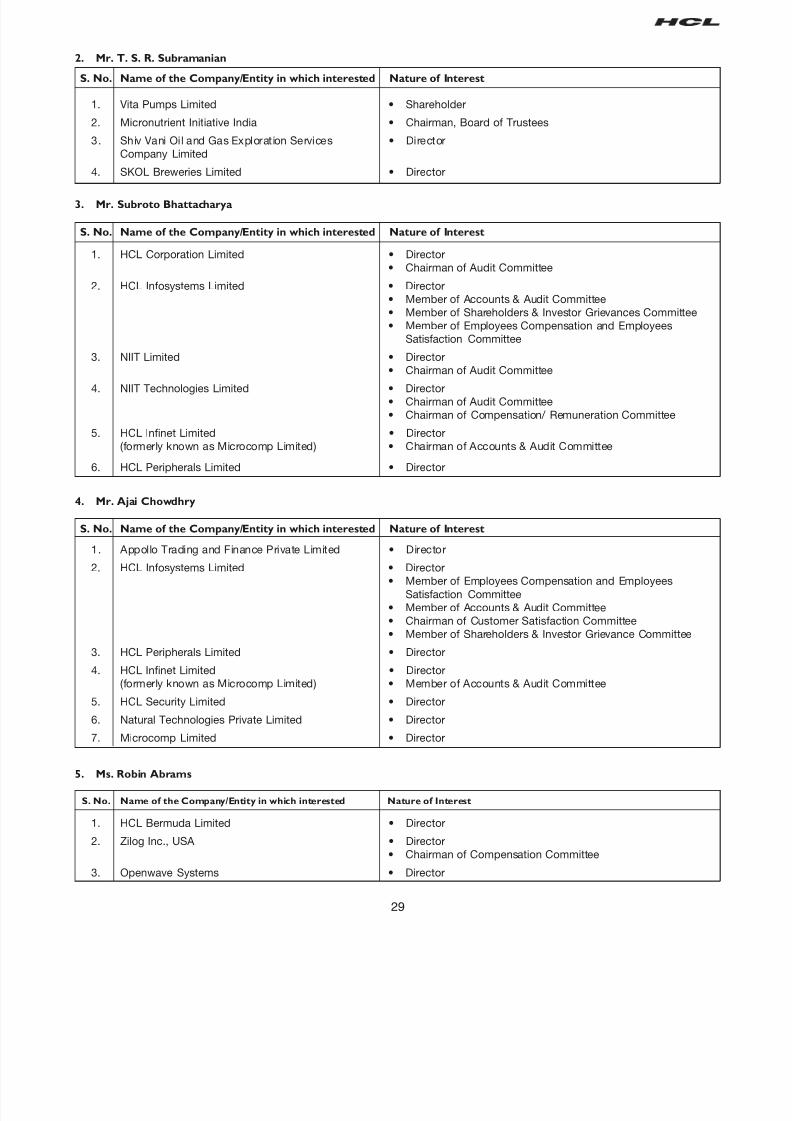
8/7/2019 Indian_GAAP_07-08
http://slidepdf.com/reader/full/indiangaap07-08 30/12529
2. Mr. T. S. R. Subramanian
S. No. Name of the Company/Entity in which interested Nature of Interest
1. Vita Pumps Limited Shareholder
2. Micronutrient Initiative India • Chairman, Board of Trustees
3. Shiv Vani Oil and Gas Exploration Services • Director
Company Limited
4. SKOL Breweries Limited • Director
3. Mr. Subroto Bhattacharya
S. No. Name of the Company/Entity in which interested Nature of Interest
1. HCL Corporation Limited • Director
• Chairman of Audit Committee
2. HCL Infosystems Limited • Director
• Member of Accounts & Audit Committee
• Member of Shareholders & Investor Grievances Committee
• Member of Employees Compensation and Employees
Satisfaction Committee
3. NIIT Limited • Director
• Chairman of Audit Committee
4. NIIT Technologies Limited • Director
• Chairman of Audit Committee
• Chairman of Compensation/ Remuneration Committee
5. HCL Infinet Limited • Director
(formerly known as Microcomp Limited) • Chairman of Accounts & Audit Committee
6. HCL Peripherals Limited • Director
4. Mr. Ajai Chowdhry
S. No. Name of the Company/Entity in which interested Nature of Interest
1. Appollo Trading and Finance Private Limited • Director
2. HCL Infosystems Limited • Director
• Member of Employees Compensation and Employees
Satisfaction Committee
• Member of Accounts & Audit Committee
• Chairman of Customer Satisfaction Committee
• Member of Shareholders & Investor Grievance Committee
3. HCL Peripherals Limited • Director
4. HCL Infinet Limited • Director
(formerly known as Microcomp Limited) • Member of Accounts & Audit Committee
5. HCL Security Limited • Director
6. Natural Technologies Private Limited • Director
7. Microcomp Limited • Director
5. Ms. Robin Abrams
S. No. Name of the Company/Entity in which interested Nature of Interest
1. HCL Bermuda Limited • Director
2. Zilog Inc., USA • Director
• Chairman of Compensation Committee
3. Openwave Systems • Director

8/7/2019 Indian_GAAP_07-08
http://slidepdf.com/reader/full/indiangaap07-08 31/12530
6. Mr. Amal Ganguli
S. No. Name of the Company/Entity in which interested Nature of Interest
1. Hughes Communications India Limited Director
• Chairman of Audit Committee
2. Aricent Technologies (Holdings) Limited • Director
• Chairman of Audit Committee
3. ML Infomap Private Limited • Director/ Shareholder
4. Tube Investments of India Limited • Director/ Shareholder• Member of Audit Committee
• Member of Remuneration Committee
5. New Delhi Television Limited • Director
• Chairman of Audit Committee
• Member of Remuneration Committee
6. Tata Communications Limited • Director
• Chairman of Audit Committee
7. Century Textiles and Industries Limited • Director
• Member of Audit Committee
8. AVTEC Limited • Director
9. ICRA Limited • Director
• Member of Audit Committee
10. Maruti Suzuki India Limited • Director
• Chairman of Audit Committee
11. AIG Trustees Company (India) Private Limited • Director
• Member of Audit Committee
12. Ascendas Property Fund Trustees Limited • Director
13. Aptuit Laurus Private Limited • Director
7. Mr. Probir Chandra Sen
S. No. Name of the Company/Entity in which interested Nature of Interest
Nil Nil
Board functioning and procedure
At HCL Technologies Limited, the Board plays a pivotal role in
ensuring good governance. The probable dates of the board
meetings for the forthcoming year are decided in advance and
published as a part of the Annual Report. The Board meets at least
once a quarter to review the quarterly results and other items of the
agenda. When necessary, additional meetings are held. The Board
meetings are generally held at the corporate office of the Company
at Noida. The agenda for each board meeting is drafted in
consultation with the Chairman and circulated in advance to t
Board members. Audit and Compensation Committees of the Boa
usually meet on the day of the board meeting.
There were six board meetings held during the year ended Ju
30, 2008. These were held on August 13, 2007, October 1
2007, January 17, 2008, February 04, 2008, April 15, 2008 a
June 26, 2008. The following table gives the attendance reco
of the directors in the board meetings and at the last Annu
General Meeting.
Name of Director No. of board meetings held No. of board meetings attended Whether attended last AGM
Mr. Shiv Nadar 6 5 * Yes
Mr. T.S.R. Subramanian 6 6 Yes
Ms. Robin Abrams 6 5 ** No
Mr. Ajai Chowdhry 6 6 Yes
Mr. S. Bhattacharya 6 6 Yes
Mr. Amal Ganguli 6 6 * Yes
Mr. P. C. Sen 6 5 Yes
* includes one meeting attended through conference call.
**includes three meetings attended through conference call.

8/7/2019 Indian_GAAP_07-08
http://slidepdf.com/reader/full/indiangaap07-08 32/12531
Availability of information to the members of the Board
The Board has complete access to any information within the
Company, and to any employee of the Company. The Board
welcomes the presence of managers in the board meetings, who
can provide additional insights into the items being discussed
in the meeting.
The information regularly provided to the Board includes:
Annual operating plans and budgets including capital
budgets and any updates.
• Quarterly results of the Company and its operating divisions
or business segments.
• Minutes of meetings of Audit Committee and Compensation
Committee of the Board.
• The information on recruitment and remuneration of senior
officers just below the Board level, including appointment or
removal of Chief Financial Officer and the Company Secretary.
• Show cause, demand, prosecution notices and penalty
notices which are materially important.
• Fatal or serious accidents, dangerous occurrences, any
material effluent or pollution problems.
• Any material default in the financial obligations to and by
the Company, or substantial non-payment for goods sold / services provided by the Company.
• Any issue, which involves possible public or product liability
claims of substantial nature, including any judgement or order
which, may have passed strictures on the conduct of the
Company or taken an adverse view regarding another
enterprise that can have negative implications on the Company.
• Details of any joint venture or collaboration agreement.
• Transactions that involve substantial payment towards
goodwill, brand equity, or intellectual property.
• Any significant development in Human Resources / Industrial
Relations front.
• Sale of material nature, of investments, subsidiaries, assets,
which is not in normal course of business.• Quarterly details of foreign exchange exposures and the
steps taken by the management to limit the risks of adverse
exchange rate movement, if material.
• Non-compliance of any regulatory, statutory nature or listing
requirements and shareholders service such as non-
payment of dividend, delay in share transfer etc.
• Statutory compliance report of all laws applicable to the
Company, as well as steps taken by the Company to rectify
instances of non-compliances, if any.
• Minutes of the board meetings of the subsidiaries along with
their financial statements and the investments made by these
companies.
• Details of the transactions with the related parties.
Statutory Compliance of Laws
The Board periodically reviews the compliance report of the laws
applicable to the Company as well as steps taken by the
Company to rectify the instances of non-compliances, if any.
Appointment / Re-appointment of Directors
The information or details pertaining to the Directors seeking
appointment / re-appointment in the Annual General Meeting,
to be provided in terms of Clause 49 of the Listing Agreement
with the Stock Exchanges, are furnished below:
Mr. Amal GanguliMr. Amal GanguliMr. Amal GanguliMr. Amal GanguliMr. Amal Ganguli has been a director of your Company since M
2003. Mr. Ganguli shall retire by rotation at the ensuing Annu
General Meeting and being eligible offers himself for re-appointme
Mr. Amal Ganguli, aged 68 years, is a Chartered Accountant.
was earlier associated with Price WaterhouseCoopers, India
its Senior Partner. In a distinguished career spanning nearly fo
decades, Mr. Ganguli was involved with the India practice of Pr
WaterhouseCoopers and is an authority on matters related to aud
taxation, mergers & acquisitions and corporate restructuring.
Mr. Amal Ganguli is a member of the Audit Committee of t
Company. As on June 30, 2008, his shareholding in the Compa
was nil. Details of directorships and committee memberships he
by him in other companies are given elsewhere in this Report.
Nature of expertise in functional area- Mr. Amal Ganguli h
expertise in areas relating to financial reporting, audit, taxatio
mergers & acquisitions and corporate restructuring.
Mr. T. S. R. SubramanianMr. T. S. R. SubramanianMr. T. S. R. SubramanianMr. T. S. R. SubramanianMr. T. S. R. Subramanian has been a director of your Compa
since September 1999. Mr. Subramanian shall retire by rotati
at the ensuing Annual General Meeting and being eligible offe
himself for re-appointment.
Mr. T. S. R. Subramanian, aged 69 years, is an Ex-CabinSecretary to the Government of India. He obtained his first degr
in Mathematics at St. Xavier’s College, Kolkata and thereaft
his Master’s Degree at Calcutta University. He also studied
Imperial College, London where he obtained his diploma a
has a Master’s Degree in Public Administration from Harva
University, specializing in economics.
Mr. T. S. R. Subramanian joined the Indian Administrative Serv
in 1961 and during his career with the Service he held vario
positions; he rose to the highest post in Indian Administratio
that of Cabinet Secretary. As Cabinet Secretary to the Governme
of India, Mr. Subramanian took a number of initiatives to modern
and develop the Infrastructure Sector in India, especially in t
Power, Telecom and Surface Transport Sectors.
Mr. T. S. R. Subramanian is the Chairman of the Audit Committ
and the Shareholders’ Committee of the Company. He is also
member of the Compensation Committee and Employees Sto
Option Allotment Committee of the Company. As on June 3
2008, his shareholding in the Company was 10,600 Equity Shar
of Rs.2/- each fully paid-up. Details of directorships a
committee memberships held by him in other companies a
given elsewhere in this Report.
Nature of expertise in functional area – Mr. T. S. R. Subramani
has expertise in business administration, and in modernizati
& development of infrastructure sector.
Mr. Ajai ChowdhryMr. Ajai ChowdhryMr. Ajai ChowdhryMr. Ajai ChowdhryMr. Ajai Chowdhry has been a director of your Company sin
January 2003. Mr. Chowdhry shall retire by rotation at the ensui
Annual General Meeting and being eligible offers himself for
appointment.
Mr. Ajai Chowdhry, aged 57 years, has a bachelor’s degree
electronics and communication engineering, and has attend
the Executive Program at the School of Business Administrati
at the University of Michigan in the U.S. Mr. Ajai Chowdhry
the Chairman & CEO of HCL Infosystems Limited. He is a
responsible for the significant international growth of HC

8/7/2019 Indian_GAAP_07-08
http://slidepdf.com/reader/full/indiangaap07-08 33/12532
Infosystems Limited and brings with him substantial experience
of the South East Asian markets including Malaysia, Thailand,
Hong Kong, Indonesia, People’s Republic of China andSingapore. He was also part of the IT Task Force set up by thePrime Minister of India, to give shape to India’s IT strategy.
Mr. Ajai Chowdhry is a member of the Shareholders’ Committeeof the Company. As on June 30, 2008, his shareholding in theCompany was 19,420 Equity Shares of Rs. 2/- each fully paid-up. Details of directorships and committee memberships held
by him in other companies are given elsewhere in this Report.
Nature of expertise in functional area – Mr. Ajai Chowdhry has
an expertise in business management and administration, andin information technologies (IT) sector.
Mr. Vineet NayarMr. Vineet NayarMr. Vineet NayarMr. Vineet NayarMr. Vineet Nayar is appointed as an Additional Director of the
Company w.e.f. August 01, 2008. Pursuant to the Provisions ofSection 260 of the Companies Act, 1956, Mr. Vineet Nayar holdsthe office upto the date of the ensuing Annual General Meetingand is eligible for appointment as Director of the Company. Subject
to the approval of the shareholders’ in the ensuing Annual GeneralMeeting, he has been appointed as a Whole-time Director of theCompany for a period of five years w.e.f. August 01, 2008.
Mr. Vineet Nayar, aged 46 years, has a Bachelor’s degree inTechnology and a Masters degree in Business Administration.Mr. Nayar started his career with HCL group in 1985. After
spending about seven years of his career as Engineer, ProductManager, Sales and Marketing Head at HCL, he played a key rolein enabling HCL to enter into the business for providing ITinfrastructure and networking services and today HCL is highlyplaced in Remote Infrastructure Management space. He became
the President of HCL Technologies Limited in April 2005 and ChiefExecutive Officer of the Company in October 2007. He wasinstrumental in instituting several radical transformational
programs across the organization. His mantra of “Employee First”and a strong belief in value-based leadership has been recognizedglobally as an example of “Organisational Innovation”. The Harvard
Business School has written a case study on his transformationat HCL, based on his innovation and radical leadership.
Mr. Vineet Nayar is a member of the Employees Stock OptionAllotment Committee of the Company. As on June 30, 2008, his
shareholding in the Company was nil. He is not holding anydirectorships and committee memberships in other companies.
Nature of expertise in functional area – Mr. Vineet Nayar has an
expertise in business management and administration, and ininformation technologies (IT) sector.
Code of Conduct
The Board has prescribed a Code of Conduct (“Code”) for allBoard members and senior management of the Company. The
Code is also posted on the website of the Company.
All Board members and senior management personnel haveconfirmed compliance with the Code for the year 2007-08. Adeclaration to this effect signed by the Chairman & Chief Strategy
Officer and Chief Executive Officer of the Company is providedelsewhere in the Annual Report.
Board Committees
Currently, the Board has four committees viz. Audit Committee,
Compensation Committee, Shareholders’ Committee and
Employees Stock Options Allotment Committee.
Keeping in view the requirements of the Companies Act, 19as well as Clause 49 of the Listing Agreement, the Board decidthe terms of reference of various committees and the assignmeof members to various committees. Normally, the committ
meetings are held once in every quarter except for ShareholdeCommittee and Employee Stock Options Allotment Committthat generally meet once in every month and if necessaadditional meetings are held.
Audit Committee
The Audit Committee comprises of following directors, name
a) Mr. T.S.R. Subramanian (Chairman)b) Ms. Robin Abramsc) Mr. Subroto Bhattacharya
d) Mr. Amal Ganguli
The Deputy Company Secretary acts as a Secretary to t
Committee.
Terms of Reference
The constitution and terms of reference of the Audit Committ
meet all the requirements of Section 292A of the CompanAct, 1956 as well as Clause 49 of the Listing Agreement.
The Board of Directors has approved the following terms
reference for the Audit Committee.
a) Statutory Auditors
Recommend to the Board the appointment and removal
the Statutory Auditors, fixation of audit fee and also appro
payment for any other services.
b) Review independence of Statutory Auditors
In connection with recommending the firm to be retained
the Company’s Statutory Auditors, review the informati
provided by the management relating to the independenof such firm, including, among other things, informati
relating to the non-audit services provided and expected
be provided by the Statutory Auditors.
The Committee is also responsible for:
i) Actively engaging in dialogue with the Statutory Audito
with respect to any disclosed relationship or servic
that may impact the objectivity and independence
the Statutory Auditors, and
ii) Recommending that the Board takes appropriate acti
in response to the Statutory Auditors’ Report to satis
itself of their independence.
c) Review Audit plan
Review with the Statutory Auditors their plans for, and t
scope of, their annual audit and other examinations.
d) Conduct of Audit
Discuss with the Statutory Auditors the matters required
be discussed for the conduct of the audit.
e) Review Audit results
Review with the Statutory Auditors the proposed report
8/7/2019 Indian_GAAP_07-08
http://slidepdf.com/reader/full/indiangaap07-08 34/12533
the annual audit, areas of concern, the accompanying
management letter, if any, the reports of their reviews of the
Company’s interim financial statements, and the reports of
the results of such other examinations outside of the course
of the statutory auditors’ normal audit procedures that they
may from time to time undertake.
f) Review financial statements
Review the Company’s financial reporting process and the
disclosure of its financial information to ensure that thefinancial statements are accurate, sufficient and credible.
The Audit Committee reviews with appropriate officers of
the Company and the Statutory Auditors, the annual and
interim financial statements of the Company prior to
submission to the Board or public release thereof, focusing
primarily on:
i) Any changes in accounting policies and practices.
ii) Major accounting entries based on exercise of judgment
by management.
iii) Qualifications in draft audit report.
iv) Significant adjustments arising out of audit.
v) The going concern assumption.
vi) Compliance with accounting standards.
vii) Compliance with stock exchanges and legal
requirements concerning financial statements.
viii) Any related party transactions i.e. transactions of the
Company with its subsidiaries, promoters or the
management, or their relatives, etc. that may have
conflict with the interest of the Company at large.
ix) Contingent liabilities.
x) Status of litigations by or against the Company.
xi) Claims against the Company and their effect on the
accounts.
g) Review policies
Review the Company’s financial and risk management policies.
h) Review internal audit function
Review the adequacy of internal audit function, including
the structure of internal audit department, staffing and
seniority of the official heading the department, reporting
structure coverage and frequency of internal audit.
i) Review internal audit plans
Review with the senior internal auditing executive andappropriate members of the staff of the internal auditing
department the plans for and the scope of their ongoing
audit activities.
j) Review internal audit reports
Review with the senior internal auditing executive and
appropriate members of the staff of the internal auditing
department the annual report of the audit activities,
examinations and results thereof of the internal auditing
department, any significant findings and follow up thereon.
The Audit Committee also reviews the findings of any internal
investigations by the internal auditors into the matters whe
there is suspected fraud or irregularity or a failure of intern
control system of a material nature and reporting the matt
to the Board.
k) Review systems of internal accounting controls
Review with the Statutory Auditors, the senior intern
auditing executive and, if and to the extent deem
appropriate by the Chairman of the Committee, membe
of their respective staffs the adequacy of the Companyinternal accounting controls, the Company’s financi
auditing and accounting organizations and personnel a
the Company’s policies and compliance procedures w
respect to business practices.
l) Review recommendations of Auditors
Review with the senior internal auditing executive and t
appropriate members of the staff of the internal auditi
department, the recommendations made by the Statuto
Auditors and the senior internal auditing executive, as w
as such other matters, if any, as such persons or oth
officers of the Company may desire to bring to the attenti
of the Committee.
m) Review other matters
Review such other matters in relation to the accountin
auditing and financial reporting practices and procedur
of the Company as the Committee may, in its own discretio
deem desirable in connection with the review functio
described above.
n) Reporting to Board
Report its activities to the Board in such manner and at su
times, as it deems appropriate.
o) Investigation
The Audit Committee has the authority to investigate amatter in relation to the items specified in Section 292A
the Companies Act, 1956 or referred to it by the Board a
for this purpose; it has full access to the informati
contained in the records of the Company. It can al
investigate any activity within its term of reference. It h
the authority to look into the reasons for substantial defau
in the payment to the depositors, debenture holde
shareholders (for non-payment of declared dividends) a
creditors, if any.
p) Seek information / advice
The Audit Committee can seek information from a
employee and can obtain from outside any legal or oth
professional advice. It can also secure attendance outsiders with relevant experience, if it considers necessa
q) To attend Annual General Meeting
The Chairman of the Audit Committee attends the Annu
General Meetings of the Company to provide any clarificati
on matters relating to audit sought by the members of t
Company.
Statutory Auditors of the Company are special invitees
the Audit Committee meetings, wherein they participate
discussions related to the review of financial statements

8/7/2019 Indian_GAAP_07-08
http://slidepdf.com/reader/full/indiangaap07-08 35/12534
the Company and any other matter that in the opinion of the
statutory auditors needs to be brought to the notice of the
Committee.
Six meetings of the Audit Committee were held during the year,
on the following dates:
August 13, 2007
September 7, 2007
October 16, 2007
January 17, 2008April 15, 2008
May 15, 2008
Attendance details of each member at the Audit Committee
meetings held during the year ended June 30, 2008 are as
follows:
Name of the Number of Number of
Committee Member Meetings held Meetings attended
Mr. T.S.R. Subramanian 6 6
Ms. Robin Abrams 6 6*
Mr. Subroto Bhattacharya 6 6
Mr. Amal Ganguli 6 6* includes three meetings attended through conference call.
Compensation Committee
The Compensation Committee of the Board consists of following
members:
a) Mr. Shiv Nadar (Chairman)
b) Mr. T.S.R. Subramanian
c) Ms. Robin Abrams
Terms of Reference
The role of the Compensation Committee has been defined as
under:
a) To review and approve/recommend the remuneration for
the Corporate Officers or Whole-Time Directors of the
Company;
b) To review and recommend to the Board the remuneration
policy for the Company;
c) To approve grant of stock options to the employees and /
or Directors of the Company and subsidiary companies and
perform such other functions as are required under the
various Employees Stock Option Plans of the Company;
d) To discharge such other function(s) or exercise such power(s)
as may be delegated to the Committee by the Board from
time to time.
Four meetings of the Compensation Committee were held during
the year, on the following dates:
August 13, 2007
October 16, 2007
January 17, 2008
April 15, 2008
Attendance details of each member at the Compensation
Committee meetings during the year ended June 30, 2008 are
as follows:
Name of the Number of Number of
Committee Member Meetings held Meetings attend
Mr. Shiv Nadar 4 3
Mr. T.S.R. Subramanian 4 4
Ms. Robin Abrams 4 4*
* includes one meeting attended through conference call.
Remuneration Policy and criteria of making payments Executive and Non-Executive Directors
The remuneration policy of the Company is aimed at rewardi
performance, based on review of achievements on a regular ba
and is in consonance with the existing industry practice.
The criteria for making payments to Executive and Non-Execut
Directors of the Company are as under:
Executive Directors:
During the year, the composition of the Board consists of o
one Executive Director viz. Mr. Shiv Nadar and during the ye
under review no remuneration has been paid to him.
Non-Executive Directors:
During the year, the Company paid sitting fee to its No
Executive Directors for attending the meetings of the Board
Directors and Audit Committee of the Company. The Compa
pays commission to its Non-Executive Directors as approv
by the Board within the limits approved by the shareholders
the Company. The amount of such commission, taken togeth
for all Non-Executive Directors, does not exceed 1% of the n
profits of the Company in a financial year. The said commissi
is decided each year by the Board of Directors and distribut
amongst the Non-Executive Directors based on their attendan
and contribution at Board and certain Committee meetings,
well as the time spent on operational matters other than meetings.
In addition to the above, the Directors of the Company are eligib
for issuance of shares under the Stock Option Plans of t
Company.
Remuneration to Directors:
The sitting fees and commission paid/ payable to the No
Executive Directors is as under:
Name of the Director Sitting Fees for Commission for Shareholding
the year ended the year ended the Company
June 30, 2008 June 30, 2008 on June 30, 20
Rs. / lacs Rs. / lacs
Mr. T.S.R. Subramanian 2.40 15 10,600
Ms. Robin Abrams 1.20 15 1,71,200
Mr. Amal Ganguli 2.20 15 Nil
Mr. S. Bhattacharya 2.40 15 Nil
Mr. Ajai Chowdhry 1.20 Nil 19,420
Mr. P. C. Sen 1.00 15 Nil
The Company had also granted the Stock Options to t
following directors of the Company under the 1999 Stock Opti
Plan of the Company as per the details given hereunder:

8/7/2019 Indian_GAAP_07-08
http://slidepdf.com/reader/full/indiangaap07-08 36/12535
Name of the Number of Vesting Period Vesting Start
Director Options Granted (in years) Date
Ms. Robin Abrams 48,800 5 October 1, 1999
Mr. T.S.R. Subramanian 48,800 5 October 1, 1999
There were no other pecuniary relationships or transactions of
the Non-Executive Directors vis-à-vis the Company.
Shareholders’ Committee
The Shareholders’ Committee consists of the following members:
a) Mr. T.S.R. Subramanian (Chairman)
b) Mr. Shiv Nadar
c) Mr. Subroto Bhattacharya
d) Mr. Ajai Chowdhry
Mr. Manish Anand, Deputy Company Secretary is the compliance
officer of the Company.
Terms of Reference
In view of the SEBI Corporate Governance norms, which have
been incorporated in the Listing Agreement, the Shareholders’
Committee has been formed to undertake the following activities:
a) To review and take all necessary actions for redressal ofinvestors’ grievances and complaints as may be required in
the interests of the investors.
b) To approve requests of rematerialisation of shares, issuan
of split and duplicate share certificates.
The details relating to the number of shareholders’ complain
received and resolved and number of pending transfers ha
been provided in the shareholders information section.
During the year under review, the Committee met 11 times.
Employees Stock Option Allotment Committee
The Employees Stock Option Allotment Committee consists following members:
a) Mr. Shiv Nadar, Chairman & Chief Strategy Officer
b) Mr. T.S.R. Subramanian, Director
c) Mr. Subroto Bhattacharya, Director
d) Mr. Vineet Nayar, Chief Executive Officer
e) Mr. Anil Chanana, Executive Vice President – Finance
This Committee has been formed to allot shares to the employe
who have exercised their stock options under the Stock Opti
Plans of the Company. During the year under review, t
Committee met 12 times.
General Body Meetings
The location and time of the General Meetings held during the preceding 3 years are as follows:
Year Date Venue Time Special Resolution
Annual General Meetings
2004-2005 December 16, 2005 FICCI Auditorium, 11.00 A.M. • Adjustment against the Share Premium account
Federation House, the Amalgamated Company in accordance
Tansen Marg, with the Scheme of Amalgamation.
New Delhi.
2005-2006 December 14, 2006 FICCI Auditorium, 11.00 A.M. • Commencement of business set out in the “Othe
Federation House, Objects” under the Object Clause of the
Tansen Marg, Memorandum of Association of the Company.
New Delhi.
2006-2007 December 13, 2007 FICCI Auditorium, 11.00 A.M. -
Federation House,
Tansen Marg,
New Delhi.
Extra-Ordinary General Meeting
2004-2005 December 21, 2004 FICCI Auditorium, 11.00 A.M. • Issue of 19,358,989 equity shares of the Compan
Federation House, to Deutsche Bank AG on preferential basis.
Tansen Marg,New Delhi.
During the year, no resolution was passed through Postal Ballot and presently, no resolution has been proposed to be passe
through postal ballot.
Subsidiary Companies
During the year, none of the subsidiaries was a material non-listed Indian subsidiary Company as per the criteria given in clause 49
the Listing Agreement. The Audit Committee of the Company reviews the financial statements and investments made by the unlist
subsidiary companies. The minutes of the board meetings as well as the statements of significant transactions and arrangemen
entered into by the unlisted subsidiary companies, if any, are placed before the Board of Directors of the Company from time to tim

8/7/2019 Indian_GAAP_07-08
http://slidepdf.com/reader/full/indiangaap07-08 37/12536
CEO/ CFO Certification
The Certificate as stipulated in clause 49(V) of the Listing
Agreement was placed before the Board along with the financial
statements for the year ended June 30, 2008 and the Board
reviewed the same. The said Certificate is provided elsewhere
in the Annual Report.
Disclosures
a) Related party transactions
The details of the transactions with related parties or others,
if any, as prescribed in the Listing Agreement, are being
placed before the Audit Committee from time to time. During
the year under review, the Company has not entered into
any transaction of a material nature with its subsidiaries,
promoters, directors or the management, their relatives, etc.,
that may have any potential conflict with the interest of the
Company.
b) Compliances by the Company
The Company has complied with the requirements of the
Stock Exchanges, SEBI and other statutory authorities on
all matters relating to capital markets during the last three
years. No penalties or strictures have been imposed on theCompany by the Stock Exchanges, SEBI or any other
statutory authorities relating to the above.
c) Material transactions with senior managerial personnel
During the year, no material transaction has been entered
into by the Company with the senior management personnel
where they had or were deemed to have any personal
interest that may have a potential conflict with the interest
of the Company. The Company has obtained requisite
declarations from all senior management personnels in this
regard and the same were placed before the Board of
Directors.
d) Other Disclosures
The Company has also laid down the procedures to inform
the Board members about the risk assessment and
minimization procedures.
During the year, the Company did not raise any mon
through public issue, right issues or preferential issues a
there was no unspent money raised through such issues
Means of Communication
a)a)a)a)a) Quarterly Results:Quarterly Results:Quarterly Results:Quarterly Results:Quarterly Results: Quarterly Results are genera
published in Financial Express/Business Standard a
Jansatta newspapers.
b)b)b)b)b) Website:Website:Website:Website:Website: The quarterly, half yearly and annual financ
statements are posted on the Company’s webswww.hcltech.com.
c)c)c)c)c) News Releases, Presentations, etc.:News Releases, Presentations, etc.:News Releases, Presentations, etc.:News Releases, Presentations, etc.:News Releases, Presentations, etc.: Official new
releases, detailed presentations made to med
analysts, institutional investors, etc. are displayed
the Company’s website www.hcltech.com. Offic
media releases are also sent to the Stock Exchange
d)d)d)d)d) Annual Report:Annual Report:Annual Report:Annual Report:Annual Report: Annual Report containing, inter al
Audited Annual Accounts, Consolidated Financ
Statements, Director’s Report, Auditor’s Report a
other important information is circulated to membe
and other entitled thereto. The Annual Report of t
Company is available on the Company website in a usefriendly and downloadable form.
e)e)e)e)e) Management Discussion and Analysis:Management Discussion and Analysis:Management Discussion and Analysis:Management Discussion and Analysis:Management Discussion and Analysis: T
Management Discussion and Analysis (MD & A) Repo
forms part of the Annual Report.
f)f)f)f)f) Intimation to the Stock Exchanges:Intimation to the Stock Exchanges:Intimation to the Stock Exchanges:Intimation to the Stock Exchanges:Intimation to the Stock Exchanges: The Compa
intimates the Stock Exchanges all price sensiti
information or such other matters which in its opini
are material and of relevance to the Shareholders.
g)g)g)g)g) SEBI EDIFAR:SEBI EDIFAR:SEBI EDIFAR:SEBI EDIFAR:SEBI EDIFAR: Pursuant to clause 51 of the Listi
Agreement, the Company during the year has upload
financial information like annual and quarterly financ
statements, segment-wise results and shareholdipattern on the SEBI’s website www.sebiedifar.nic.in
h)h)h)h)h) Designated Exclusive email- id:Designated Exclusive email- id:Designated Exclusive email- id:Designated Exclusive email- id:Designated Exclusive email- id: The Company h
designated an email- id [email protected] exclusiv
for investors servicing.
Shareholders’ Information
a) General Information
Dates of book closure October 23, 2008 to October 24, 2008 (both days inclusive)
Date, time and venue of the ensuing October 22, 2008; 11.00 A.M.
Annual General Meting FICCI Auditorium, Federation House,
1, Tansen Marg,
New Delhi 110 001
Dividend Payment Date (subject to the On or before November 21, 2008
approval of the shareholders)
Listing on stock exchanges in India at The National Stock Exchange of India Ltd. (NSE)
Exchange Plaza, 5th Floor, Plot No. C/1
G Block, Bandra Kurla Complex, Bandra East, Mumbai – 400 051, India.
Tel.: +(91) 22 26598236, Fax: +(91) 22 26598237
The Bombay Stock Exchange Ltd. (BSE)
Phiroze Jeejeebhoy Towers, Dalal Street,
Mumbai – 400 001, India
Tel.: +(91) 22 22721233, Fax: +(91) 22 22723121
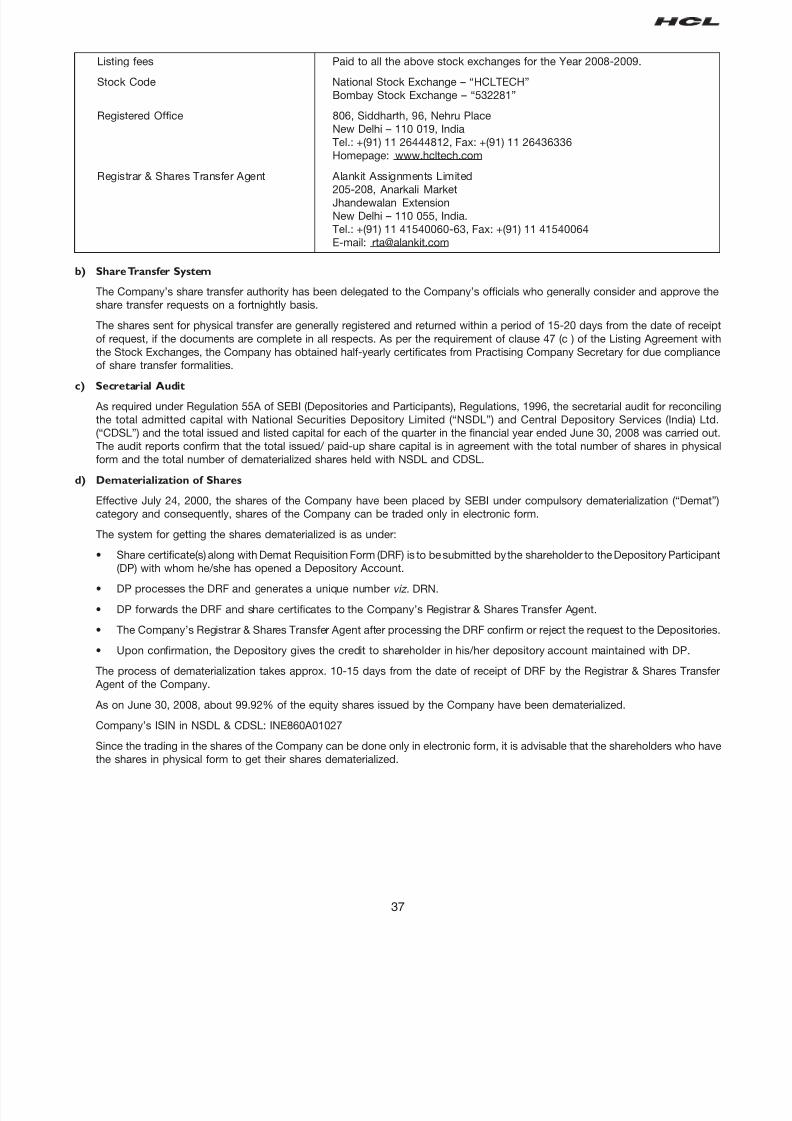
8/7/2019 Indian_GAAP_07-08
http://slidepdf.com/reader/full/indiangaap07-08 38/125

8/7/2019 Indian_GAAP_07-08
http://slidepdf.com/reader/full/indiangaap07-08 39/12538
e) Distribution of shareholding as on June 30, 2008
Number of Equity No. of Shareholders No. of Shares
Shares held Shareholders (%) Shares (%)
1 – 100 59,301 73.76 22,13,741 0.33
101 – 200 10,216 12.71 18,25,032 0.27
201 – 500 4,952 6.16 17,33,501 0.26
501 – 1000 1,782 2.22 13,50,280 0.20
1001 – 5000 2,861 3.56 69,95,558 1.055001 – 10000 624 0.78 44,22,440 0.66
10001 and above 660 0.82 64,77,99,720 97.22
TotalTotalTotalTotalTotal 80,39680,39680,39680,39680,396 100.00100.00100.00100.00100.00 66,63,40,27266,63,40,27266,63,40,27266,63,40,27266,63,40,272 100.00100.00100.00100.00100.00
f) Categories of shareholders as on June 30, 2008
Category Number of Equity shares held Voting Strength (%)
Promoters 45,00,42,352 67.54
Director & their Relatives 10,94,836 0.16
Mutual Funds/ UTI 1,41,25,189 2.12
Financial Institutions/ Banks 4,05,281 0.06
Insurance Companies 1,85,72,127 2.79
Foreign Institutional Investors 11,81,01,726 17.72
Foreign Banks 79,88,434 1.20
Bodies Corporate 1,68,27,394 2.53
Individuals 2,73,00,284 4.10
NRIs / OCBs 1,12,56,465 1.69
Foreign Nationals 1,20,236 0.02
Trusts 2,807 0.00
HUF 1,93,844 0.03
Clearing Members 3,09,297 0.05
Grand TotalGrand TotalGrand TotalGrand TotalGrand Total 66,63,40,27266,63,40,27266,63,40,27266,63,40,27266,63,40,272 100.00100.00100.00100.00100.00
g) Stock market data
Monthly high and low quotations, as well as the volume of shares traded at the National Stock Exchange of India Limited (“NSE”) a
the Bombay Stock Exchange Limited (“BSE”), for fiscal year are as follows:
Month NSE BSE
High Low Volume High Low Volume
(Rs.) (Rs.) (Number) (Rs.) (Rs.) (Number)
July 2007 348.00 304.50 1,40,37,314 350.00 304.50 30,79,188
August 333.90 265.15 1,66,07,943 334.00 266.85 29,11,804
September 318.00 270.35 1,86,53,771 317.50 270.05 32,77,794
October 332.00 244.30 2,55,17,762 332.00 260.25 63,90,071
November 331.90 286.00 3,15,94,427 328.20 285.00 76,23,549
December 335.50 261.15 1,22,76,012 336.00 280.10 11,62,070
January 2008 334.45 185.05 2,35,76,462 333.80 180.00 50,14,797
February 300.00 240.00 1,16,76,847 300.00 241.20 45,13,835
March 292.00 231.00 1,55,95,711 291.00 232.00 18,49,685
April 295.75 227.60 2,66,83,521 296.00 226.10 1,14,68,952
May 324.30 281.10 1,70,12,170 324.50 280.35 27,04,268
June 319.00 240.70 2,16,76,484 319.00 241.50 18,19,590

8/7/2019 Indian_GAAP_07-08
http://slidepdf.com/reader/full/indiangaap07-08 40/12539
h) Liquidity
The Company’s shares are among the most liquid and actively traded shares on NSE and BSE. The monthly trading volumes of t
Company’s shares on these exchanges are given in the table above in the Paragraph (g) titled ‘Stock Market Data’.
i) Share price performance in comparison to broad based Indices
j) Shareholders Services
(i) Complaints received during the year 2007-2008
The Company gives utmost priority to the interests of the shareholders. All the requests / complaints of the shareholde
have been resolved to the satisfaction of the shareholders within the statutory time limits. The status of shareholders’ complain
received during the financial year is as follows:
Source of ComplaintSource of ComplaintSource of ComplaintSource of ComplaintSource of Complaint ReceivedReceivedReceivedReceivedReceived ResolvedResolvedResolvedResolvedResolved
Directly from the Investors 83 83
Through SEBI, Stock Exchanges, etc. 2 2
TotalTotalTotalTotalTotal 8585858585 8585858585
(ii) Share Transfers – As on June 30, 2008, 9 cases comprising of 200 shares were pending for transfer and 1 case comprisi
of 86 shares were pending for transmission which were processed subsequently.
k) Outstanding GDRs/ ADRs/ Warrants or any Convertible Instruments, conversion date and likely impact on equity
The Company has not issued any GDRs/ ADRs/ Warrants or other instruments, which are pending for conversion.
PM Tower
37, Greams Road
Chennai - 600 006, India
Tel. : +(91) 44 2829 1735
Fax : +(91) 44 2829 1738
J-16
Anna Nagar EastChennai - 600 102, India
Tel. : +(91) 44 2626 4206
Fax : +(91) 44 2628 1120
Thapar House
43 / 44, Montieth Road
Egmore
Chennai - 600 008, India
Tel. : +(91) 44 2851 1293
Fax : +(91) 44 2851 1986
l) Centers’ Locations
Chennai Centers
50-53, Greams Road
Chennai - 600 006, India
Tel. : +(91) 44 2829 3298
Fax : +(91) 44 2829 4969
Raheja Towers
Module 812, 8th FloorMount Road
Chennai - 600 002, India
Tel. : +(91) 44 2860 3091
Fax : +(91) 44 2860 3087
34 & 35 Haddows Road
Chennai - 600 034, India
Tel. : +(91) 44 4220 9999
Fax : +(91) 44 4213 2749
8/7/2019 Indian_GAAP_07-08
http://slidepdf.com/reader/full/indiangaap07-08 41/12540
No.184-188, 190,192 & 196
Arcot Road, Vadapalani
Chennai - 600 026, India
Tel. : +(91) 44 2372 8366
Fax : +(91) 44 2480 6640
D-12, 12B, Ambattur Industrial Estate
Ambattur (AMB-1)
Chennai - 600 058, India
Tel. : +(91) 44 2623 0711
Fax : +(91) 44 2624 4213
64 & 65, Second Main Road
Ambattur Industrial Estate
Ambattur (AMB-3)
Chennai - 600 058, India
Tel. : +(91) 44 2652 1077
Fax : +(91) 44 4206 0485
73-74, South Phase
Ambattur Industrial Estate
Ambattur (AMB-5)
Chennai - 600 058, India
Tel. : +(91) 44 4393 5000
Fax : +(91) 44 4206 0441Sapna Trade Centre
109/110 P H Road
Chennai - 600 084, India
Tel. : +(91) 44 2822 1129
Fax : +(91) 44 2821 4278
No. 51, J.N. Road
Guindy (GUINDY-1)
Chennai - 600 097, India
Tel. : +(91) 44 2225 4460/65
Fax : +(91) 44 2225 4472
Arihant Technopolis
4/293 Old Mahabalipuram Road
Kandanchavadi
Chennai - 600 096, India
Tel. : +(91) 44 4395 7777
HCL Technologies Ltd. (C-5)
Module 1, Tower 1
Floor Nos. 1 & 6
“Chennai One” SEZ Unit
ETL Infrastructure Services Ltd.
200 Ft, Thoraipakkam
Pallavaram Ring Road
Thoraipakkam, Chennai – 600 096, India
Tel. : +(91) 44 6630 1000
HCL Technologies Ltd, (C-2)Unit-2, Block-1, No. 84
Greams Road
Thousand Lights
Chennai - 600 006, India
Tel. : +(91) 44 6622 5522
HCL Technologies Ltd.,(C-4)
Unit-2, Block-1, No.84
Greams Road
Thousand Lights
Chennai – 600 006, India
Tel. : +(91) 44 6622 5522
158, Arcot Road
Vadapalani
Chennai - 600 026, India
Tel. : +(91) 44 2375 0171
Fax : +(91) 44 2375 0185
78- Ambattur industrial Estate
Ambattur (AMB-2)
Chennai - 600 058, India
Tel. : +(91) 44 2623 2318
Fax : +(91) 44 2625 9476
94, South Phase
Ambattur Industrial Estate
Ambattur (AMB-4)
Chennai - 600 058, India
Tel. : +(91) 44 4226 2222
Fax : +(91) 44 4215 3333
8, South Phase, MTH Road
Ambattur Industrial Estate
Ambattur (AMB-6)
Chennai - 600 058, India
Tel. : +(91) 44 4396 8000
Fax : +(91) 44 4396 700449-50, Nelson
Manickam Road
Chennai - 600 029, India
Tel. : +(91) 44 2374 1939
Fax : +(91) 44 2374 1038
35, South Phase
Guindy Industrial estate
Ekkaduthangal, Guindy (GUINDY-2)
Chennai - 600 097, India
Tel. : +(91) 44 2231 8321, 44 2231 8320
601-602, 604 Tidel Park
4 Canal Road, Taramani
Chennai - 600 113, India
Tel. : +(91) 44 2254 0473
Fax : +(91) 44 2254 0308
HCL Technologies Ltd. (C-1)
#30, Ethiraj Salai
Egmore
Chennai - 600105, India
Tel. : +(91) 44 2828 9200
HCL Technologies Ltd,(C-3)Unit-2, Block-1, No. 84
Greams Road
Thousand Lights
Chennai - 600 006, India
Tel : +(91) 44 6622 5522

8/7/2019 Indian_GAAP_07-08
http://slidepdf.com/reader/full/indiangaap07-08 42/12541
Chennai SEZChennai SEZChennai SEZChennai SEZChennai SEZ
HCL Technologies Ltd.
SEZ UNIT, ETA TECHNO PARK
Special Economic Zone
Block-4 No.33, OMR, Navallur Village and Panchayat
Thiruporur Panchayat Union
Chengelpet Taluk, Kancheepuram Dist.
Chennai – 603 103, Tamil Nadu, India.
Tel. : +(91) 44 6741 2000
Fax : +(91) 44 6741 2222
Gurgaon CentersGurgaon CentersGurgaon CentersGurgaon CentersGurgaon Centers
3, Udyog Vihar Phase 1
Gurgaon - 122 016
Haryana, India
Tel. : +(91) 124 434 6400Fax : +(91) 124 243 9910
Plot No. 5,6,7 Udyog Vihar Phase 4
Gurgaon - 122 016
Haryana, India
Tel. : +(91) 124 434 6000
Fax : +(91) 124 401 9851
Kolkata CentersKolkata CentersKolkata CentersKolkata CentersKolkata Centers
SDF Building, 1st floor
Module No. 2. 212-214
228-230, Block – GP
Sector – V, Salt Lake City
Kolkata - 700 091, India
Tel. : +(91) 33 2357 3024-5
Fax : +(91) 33 2537 3027
HCL Technologies Ltd. - SEZ Unit
M/s. Unitech Hi-Tech Structures Limited
Special Economic Zone – IT/ITESPlot No.1, Block No. A2, 3rd & 4th Floors
DH Street, 316 New Town
Rajarhat, Dist. North 24 Parganas
Kolkata – 700 156, India
Noida CentersNoida CentersNoida CentersNoida CentersNoida Centers
A-9, 10 & 11, Sector 3
Noida - 201 301
U.P., India
Tel. : +(91) 120 252 0917
Fax : +(91) 120 252 6907
A – 1 CD, Sector 16
Noida - 201 301U.P., India
Tel. : +(91) 120 251 6321 – 28
Fax : +(91) 120 251 6315
A- 8 & 9, Sector 60
Noida - 201 301
U.P., India
Tel. : +(91) 120 438 4000
Fax : +(91) 120 258 2915
Plot No. 244, Udyog Vihar Phase 1
Gurgaon, 122 016
Haryana, India
Tel. : +(91) 124 434 6200
Fax : +(91) 124 234 9020
Plot No. C-1, Sector-34
Gurgaon - 122016
Haryana, India
Tel. : +(91) 124 661 6565, 465 6565
Fax : +(91) 124 221 2381
INFINITY Building, Tower – II
14th Floor
Plot No. 3A, Block GP, Sector-V
Salt Lake City
Kolkata – 700 091, India
Tel. : +(91) 33 2357 2487–90
Fax : +(91) 33 2357 2491
A – 5, Sector 24
Noida - 201 301
U.P., India
Tel. : +(91) 120 241 1502
Fax : +(91) 120 241 1005
A-11, Sector 16
Noida - 201 301U.P., India
Tel. : +(91) 120 251 0701
Fax : +(91) 120 251 0713
Plot No. 1 & 2
Noida Express Highway
Sector-125, Noida - 201 301
U.P., India
Tel. : +(91) 120 661 4300
Fax : +(91) 120 661 4331
Mumbai CentersMumbai CentersMumbai CentersMumbai CentersMumbai Centers
Unit No.181 B,
SDF 6, First Floor
SEEPZ, Andheri (East)
Mumbai - 400 096, India
Tel. : +(91) 22 2829 1999
Tel. : + (91) 22 5693 9295
Fax : + (91) 22 2929 2373

8/7/2019 Indian_GAAP_07-08
http://slidepdf.com/reader/full/indiangaap07-08 43/125

8/7/2019 Indian_GAAP_07-08
http://slidepdf.com/reader/full/indiangaap07-08 44/12543
Surya Sappihre
Plot No. 3
1st Phase Electronic city
Hosur Road
Bangalore - 560 100, India
Tel. : + (91) 80 6450 2301
HCL EAI Services Ltd.
# 6, A.S. Chambers
80 Feet Road
6th Block, Koramangala
Bangalore - 560 095
Tel. : +(91) 80 6644 1000
m) Financial Calendar (tentative and subject to change)
Financial reporting for the first quarter ending September 30, 2008 October 15, 200Financial reporting for the second quarter ending December 31, 2008 January 15, 200
Financial reporting for the third quarter ending March 31, 2009 April 14, 200
Financial reporting for the year ending June 30, 2009 July 23, 200
Annual General Meeting for the year ending June 30, 2009 October / November 200
n) Address for Shareholders’ correspondence
The Secretarial Department
HCL Technologies Limited
A-10 & 11, Sector – 3
Noida – 201 301 U.P., India
Tel. : +(91) 120 252 0917 / 937/ 997
Fax : +(91) 120 2526 907
E-mail: [email protected]
o) Compliance Certificate on the Corporate Governance from the Auditors
The certificate dated August 01, 2008 obtained from Statutory Auditors of the Company, M/s. Price Waterhouse, confirmi
compliance with the Corporate Governance requirements as stipulated under clause 49 of the Listing Agreement, is annex
hereto.

8/7/2019 Indian_GAAP_07-08
http://slidepdf.com/reader/full/indiangaap07-08 45/12544
AUDITORS’ CERTIFICATE
REGARDING COMPLIANCE OF CONDITIONS OF CORPORATE GOVERNANCE
To the Members of HCL Technologies Limited
We have examined the compliance of conditions of Corporate Governance by HCL Technologies Limited (“the Company”), for t
year ended June 30, 2008, as stipulated in Clause 49 of the Listing Agreements of the said Company with stock exchanges in Ind
The compliance of conditions of Corporate Governance is the responsibility of the Company’s management. Our examination wcarried out in accordance with the Guidance Note on Certification of Corporate Governance (as stipulated in Clause 49 of the Listin
Agreement), issued by the Institute of Chartered Accountants of India and was limited to procedures and implementation thereo
adopted by the Company for ensuring the compliance of the conditions of Corporate Governance. It is neither an audit nor a
expression of opinion on the financial statements of the Company.
In our opinion and to the best of our information and according to the explanations given to us, we certify that the Company h
complied with the conditions of Corporate Governance as stipulated in the above mentioned Listing Agreement.
We state that such compliance is neither an assurance as to the future viability of the Company nor the efficiency or effectiveness w
which the management has conducted the affairs of the Company.
Kaushik DuttaPartner
Membership No: 8854
For and on behalf of
Place: Gurgaon Price Waterhouse
Date: 01 August 2008 Chartered Accountants

8/7/2019 Indian_GAAP_07-08
http://slidepdf.com/reader/full/indiangaap07-08 46/12545
DECLARATION BY CHIEF EXECUTIVE OFFICER PURSUANT TO
CLAUSE 49(I)(D)(ii) OF THE LISTING AGREEMENT OF THE INDIAN STOCK EXCHANGES
We, Shiv Nadar, Chairman & Chief Strategy Officer and Vineet Nayar, Chief Executive Officer & Whole-time Director of HCL Technolog
Limited (“the Company”) confirm that the Company has adopted a Code of Conduct (“Code”) for its Board members and seni
management personnel and the Code is available on the Company’s web site.
We further confirm that the Company has in respect of the financial year ended June 30, 2008, received from its Board members awell as senior management personnel affirmation as to compliance with the Code of Conduct.
Place : Noida (U.P.), India Vineet Nayar Shiv Nadar
Date : 01 August 2008 CEO & Whole-time Director Chairman and Chief Strategy Office
CERTIFICATE BY CHIEF EXECUTIVE OFFICER (CEO) AND CHIEF FINANCIAL OFFICER (CFO)
PURSUANT TO CLAUSE 49(V) OF THE LISTING AGREEMENT OF THE INDIAN STOCK EXCHANGES
We, Shiv Nadar, Chairman & Chief Strategy Officer, Vineet Nayar, Chief Executive Officer & Whole-time Director, Ranjit Narasimha
President & Chief Executive Officer-BPO Division and Anil Chanana, Executive Vice President-Finance of HCL Technologies Limite
(“the Company”) certify that:
1. We have reviewed the financial statements and the Cash Flow Statement of the Company for the year ended June 30, 2008 a
that to the best of our knowledge and belief -
(i) these statements do not contain any materially untrue statement or omit any material fact or contain statements that mig
be misleading;
(ii) these statements together present a true and fair view of the Company’s affairs and are in compliance with the existi
accounting standards, applicable laws and regulations.
2. There are, to the best of our knowledge and belief, no transactions entered into by the Company during the year which a
fraudulent, illegal or violative of the Company’s code of conduct.3. We accept responsibility for establishing and maintaining internal controls for financial reporting and that we have evaluated t
effectiveness of internal control systems of the Company pertaining to financial reporting and we have disclosed to the audito
and the Audit Committee, deficiencies in the design or operation of such internal controls, if any, of which we are aware and t
steps we have taken or propose to take to rectify these deficiencies.
4. We have indicated to the auditors and the Audit Committee –
(i) significant changes, if any, in internal control over financial reporting during the year.
(ii) significant changes, if any, in accounting policies during the year and that the same have been disclosed in the notes to t
financial statements; and
(iii) instances of significant fraud of which we are aware and the involvement therein, if any, of the management or an employ
having a significant role in the Company’s internal control system over financial reporting.
Vineet Nayar Shiv Nadar
CEO & Whole-time Director Chairman and Chief Strategy Office
Place : Noida (U.P.), India Anil Chanana Ranjit Narasimhan
Date : 01 August 2008 Executive Vice President -Finance President & CEO-BPO Division

8/7/2019 Indian_GAAP_07-08
http://slidepdf.com/reader/full/indiangaap07-08 47/125

8/7/2019 Indian_GAAP_07-08
http://slidepdf.com/reader/full/indiangaap07-08 48/125
47
Financial Statements

8/7/2019 Indian_GAAP_07-08
http://slidepdf.com/reader/full/indiangaap07-08 49/125
48

8/7/2019 Indian_GAAP_07-08
http://slidepdf.com/reader/full/indiangaap07-08 50/125
49
1.1.1.1.1. We have audited the attached Balance Sheet of HCL
Technologies Limited, as at June 30 2008, and the related
Profit and Loss Account and Cash Flow Statement for the
year ended on that date annexed thereto, which we have
signed under reference to this report. These financial
statements are the responsibility of the company’s
management. Our responsibility is to express an opinion
on these financial statements based on our audit.
2.2.2.2.2. We conducted our audit in accordance with the auditing
standards generally accepted in India. Those Standards
require that we plan and perform the audit to obtain
reasonable assurance about whether the financial
statements are free of material misstatement. An audit
includes examining, on a test basis, evidence
supporting the amounts and disclosures in the financial
statements. An audit also includes assessing the
accounting principles used and significant estimates
made by management, as well as evaluating the overall
financial statement presentation. We believe that our
audit provides a reasonable basis for our opinion.
3.3.3.3.3. As required by the Companies (Auditor’s Report) Order,
2003, as amended by the Companies (Auditor’s Report)
(Amendment) Order, 2004 (together ‘the Order’), issued by
the Central Government of India in terms of sub-section
(4A) of Section 227 of ‘The Companies Act, 1956’ of India
(the ‘Act’) and on the basis of such checks of the books
and records of the company as we considered appropriate
and according to the information and explanations given to
us, we give in the Annexure a statement on the matters
specified in paragraphs 4 and 5 of the said Order.
4.4.4.4.4. Further to our comments in the Annexure referred to in
paragraph 3 above, we report that:
(a)(a)(a)(a)(a) We have obtained all the information and explanations,
which to the best of our knowledge and belief were
necessary for the purposes of our audit;
(b)(b)(b)(b)(b) In our opinion, proper books of account as required by
law have been kept by the company so far as appears
from our examination of those books;
(c)(c)(c)(c)(c) The Balance Sheet, Profit and Loss Account and Cash
Flow Statement dealt with by this report are in
agreement with the books of account;
(d)(d)(d)(d)(d) In our opinion, the Balance Sheet, Profit and Loss
Account and Cash Flow Statement dealt with by thisreport comply with the accounting standards referred
to in sub-section (3C) of Section 211 of the Act;
(e)(e)(e)(e)(e) On the basis of written representations received from
the directors, as on June 30, 2008 and taken on record
by the Board of Directors, none of the directors is
disqualified as on June 30, 2008 from being appointed
as a director in terms of clause (g) of sub-section (1) of
Section 274 of the Act;
ANNEXURE TO AUDITORS’ REPORT
[Referred to in paragraph 3 of the Auditors’ Report of even dat
to the members of HCL Technologies Limited on the financia
statements for the year ended June 30, 2008]
1. (a)(a)(a)(a)(a) The company is maintaining proper records showin
full particulars including quantitative details an
situation of fixed assets.
(b)(b)(b)(b)(b) The fixed assets are physically verified by th
management according to a phased programmdesigned to cover all the items over a period of thre
years, which in our opinion, is reasonable having regar
to the size of the company and the nature of its asset
Pursuant to the programme, a portion of the fixe
assets has been physically verified by the manageme
during the year and no material discrepancies betwee
the book records and the physical inventory have bee
noticed.
(c)(c)(c)(c)(c) In our opinion and according to the information an
explanations given to us, a substantial part of fixe
assets has not been disposed of by the company durin
the year.
2.2.2.2.2. The Company has neither granted nor taken any loan
secured or unsecured, to/from companies, firms or othe
parties covered in the register maintained under Sectio
301 of the Act. Consequently, clauses (iii)(b), (iii)(c), (iii)(d
(iii)(f) and (iii)(g) of paragraph 4 of the Order are not applicabl
3.3.3.3.3. In our opinion and according to the information an
explanations given to us, having regard to the explanatio
that certain items purchased are of special nature for whic
AUDITORS’ REPORT
To the Members of HCL Technologies Limited
(f)(f)(f)(f)(f) In our opinion and to the best of our information an
according to the explanations given to us, the sa
financial statements together with the notes thereo
and attached thereto give in the prescribed manne
the information required by the Act and give a true an
fair view in conformity with the accounting principle
generally accepted in India:
(i )(i )(i )(i )(i ) in the case of the Balance Sheet, of the state
affairs of the company as at June 30, 2008;
(ii)(ii)(ii)(ii)(ii ) in the case of the Profit and Loss Account, of th
profit for the year ended on that date; and
(iii)(iii)(iii)(iii)(ii i) in the case of the Cash Flow Statement, of th
cash flows for the year ended on that date.
Kaushik Dutta
Partner
Membership Number F-88540
For and on behalf ofPlace: Gurgaon, India Price Waterhouse
Date: 01 August 2008 Chartered Accountants

8/7/2019 Indian_GAAP_07-08
http://slidepdf.com/reader/full/indiangaap07-08 51/125
50
suitable alternative sources do not exist for obtaining
comparative quotations, there is an adequate internal control
system commensurate with the size of the company and
the nature of its business for the purchase of fixed assets
and for the sale of services. The activities of the Company
do not involve purchase of inventory and the sale of goods.
Further, on the basis of our examination of the books and
records of the company, and according to the information
and explanations given to us, we have neither come across
nor have been informed of any continuing failure to correct
major weaknesses in the aforesaid internal control system.
4.4.4.4.4. (a)(a)(a)(a)(a) In our opinion and according to the information and
explanations given to us, the particulars of contracts or
arrangements referred to in Section 301 of the Act have
been entered in the register required to be maintained
under that section.
(b)(b)(b)(b)(b) In our opinion and according to the information and
explanations given to us, the transactions made in
pursuance of contracts or arrangements entered into
the register in pursuance of Section 301 of the Act and
exceeding the value of Rupees Five Lakhs in respect of
any party during the year, are in respect of items of
special nature and in respect of which alternative
quotations are not considered necessary by the
Company.
5.5.5.5.5. The company has not accepted any deposits from the public
within the meaning of Sections 58A and 58AA of the Act
and the rules framed there under.
6.6.6.6.6. In our opinion, the company has an internal audit system
commensurate with its size and nature of its business.
7.7.7.7.7. The Central Government of India has not prescribed the
maintenance of cost records under clause (d) of sub-section
(1) of Section 209 of the Act for any of the products of thecompany.
8.8.8.8.8. (a)(a)(a)(a)(a) According to the information and explanations given to
us and the records of the company examined by us, in
our opinion, the company is generally regular in
depositing the undisputed statutory dues including
provident fund, investor education and protection fund,
employees’ state insurance, income-tax, sales-tax,
wealth tax, service tax, customs duty, cess and other
material statutory dues as applicable with the
appropriate authorities. As explained to us, the Company
did not have any dues on account of excise duty.
(b)(b)(b)(b)(b) According to the information and explanations given tous and the records of the company examined by us,
there are no dues of wealth tax, service tax, sales tax
and cess as at June 30, 2008 which have not been
deposited on account of dispute other than income tax
and custom duty, which are as follows-
Name of Nature of Amount Period to Forum where
the statute dues (Rs.) which the the dispute
amount is pending
relates
Income Tax Income Tax 47,949,416 2002-2003 Karnataka
Act, 1961 High Court
Income Tax Income Tax 2,432,594 1997-1998 Income
Act, 1961 Tax Appellate
Tribunal
(ITAT)
Income tax Income Tax 254,308,170 2004-2005 Income TaxAct, 1961 Appellate
Tribunal (ITAT)
Income tax Income Tax 14,443,922 2004-2005 Income Tax
Act, 1961 AppellateTribunal (ITAT)
Income tax Income Tax 3,477,963 2001-2002 Income TaxAct, 1961 Appellate
Tribunal (ITAT)
Income tax Income Tax 7,378,994 2001-2002 Karnataka HighAct, 1961 Court
Customs Act, Custom Duty 2,775,156 2003-2004 Custom, excise1962 and service tax
Appellate
Tribunal,Bangalore
9.9.9.9.9. The company has no accumulated losses as at June 3
2008 and it has not incurred any cash losses in the financi
year ended on that date or in the immediately precedin
financial year.
10.10.10.10.10. According to the records of the company examined by u
and the information and explanation given to us, th
company has not defaulted in repayment of dues to financi
institution as at the balance sheet date. The company ha
not issued any debentures. Further the Company does no
have any dues payable to bank as at the balance shee
date.
11.11.11.11.11. The company has not granted any loans and advances o
the basis of security by way of pledge of shares, debenture
and other securities.
12.12.12.12.12. The provisions of any special statute applicable to chit fun
/ nidhi / mutual benefit fund/societies are not applicable t
the company.
13.13.13.13.13. In our opinion, the company is not a dealer or trader
shares, securities, debentures and other investments.
14.14.14.14.14. In our opinion and according to the information an
explanations given to us, the company has not given anguarantee for loans taken by others from banks or financi
institutions during the year.
15.15.15.15.15. The company has not obtained any term loans during the
year.

8/7/2019 Indian_GAAP_07-08
http://slidepdf.com/reader/full/indiangaap07-08 52/125

8/7/2019 Indian_GAAP_07-08
http://slidepdf.com/reader/full/indiangaap07-08 53/125
52
Balance Sheet as at 30 June 2008
(All amounts in crores of rupees except share data and unless otherwise stated)
As at As at
Schedule 30 June 2008 30 June 2007
Sources of FundsSources of FundsSources of FundsSources of FundsSources of Funds
Shareholders’ fundsShareholders’ fundsShareholders’ fundsShareholders’ fundsShareholders’ funds
Share capital 1 133.27 132.74
Share application money pending allotment 1.71 -Reserves and surplus 2 3,079.85 3,292.28
3,214.83 3,425.02
Loan fundsLoan fundsLoan fundsLoan fundsLoan funds
Secured loans 3 25.24 40.77
Unsecured loans 4 0.09 0.12
25.33 40.89
3,240.163,240.163,240.163,240.163,240.16 3,465.913,465.913,465.913,465.913,465.91
Application of FundsApplication of FundsApplication of FundsApplication of FundsApplication of Funds
Fixed assetsFixed assetsFixed assetsFixed assetsFixed assets 5
Gross block 1,599.61 1,332.67
Less: Accumulated depreciation (874.32) (662.58)
Net block 725.29 670.09
Capital work-in-progress (including capital advances) 419.03 212.86
1,144.32 882.95
InvestmentsInvestmentsInvestmentsInvestmentsInvestments 6 1,797.34 1,988.86
Deferred tax assetsDeferred tax assetsDeferred tax assetsDeferred tax assetsDeferred tax assets 16(7) 140.60 29.84
Current assets, loans and advancesCurrent assets, loans and advancesCurrent assets, loans and advancesCurrent assets, loans and advancesCurrent assets, loans and advances
Sundry debtors 7 980.02 712.48
Cash and bank balances 8 686.88 380.94
Loans and advances 9 522.64 403.95
Other current assets 10 230.36 385.30
2,419.90 1,882.67
Less: Current liabilities and provisionsLess: Current liabilities and provisionsLess: Current liabilities and provisionsLess: Current liabilities and provisionsLess: Current liabilities and provisions 11 (2262.00) (1318.41)
Net current assetsNet current assetsNet current assetsNet current assetsNet current assets 157.90 564.26
3,240.163,240.163,240.163,240.163,240.16 3,465.913,465.913,465.913,465.913,465.91
Significant accounting policies and notes to the accounts 16
The Schedules referred to above form an integral part of the Balance Sheet.
This is the Balance Sheet referred to in our report of even date.
For HCL Technologies Limited
Kaushik Dutta Shiv Nadar T S R Subramanian
Partner Chairman and Chief Strategy Officer Director
Membership No.: F-88540
For and on behalf of Vineet Nayar Ranjit NarasimhanPrice Waterhouse CEO & Wholetime Director President & CEO-BPO Division
Chartered Accountants
Anil Chanana Manish Anand
Executive Vice President - Finance Deputy Company Secretary
Place: Gurgaon, India Place: Noida (UP), India
Date: 01 August 2008 Date: 01 August 2008
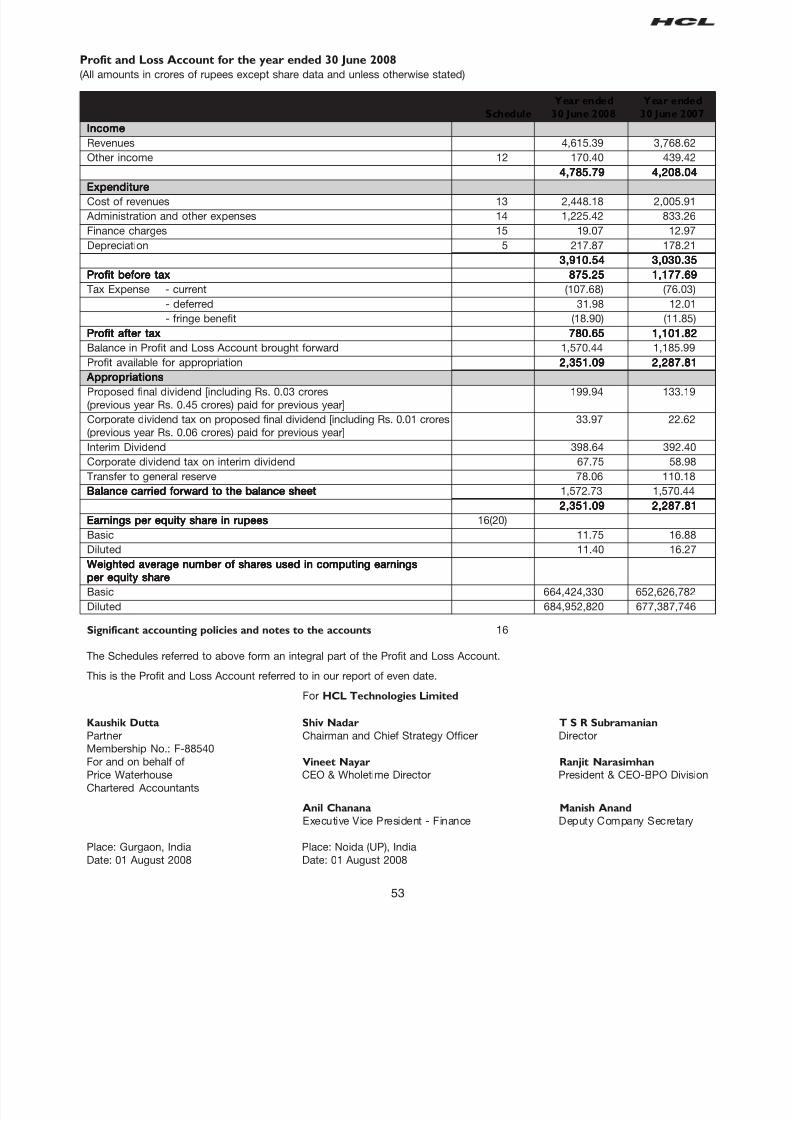
8/7/2019 Indian_GAAP_07-08
http://slidepdf.com/reader/full/indiangaap07-08 54/125
53
Profit and Loss Account for the year ended 30 June 2008
(All amounts in crores of rupees except share data and unless otherwise stated)
Year ended Year ended
Schedule 30 June 2008 30 June 2007
IncomeIncomeIncomeIncomeIncome
Revenues 4,615.39 3,768.62
Other income 12 170.40 439.42
4,785.794,785.794,785.794,785.794,785.79 4,208.044,208.044,208.044,208.044,208.04
ExpenditureExpenditureExpenditureExpenditureExpenditure
Cost of revenues 13 2,448.18 2,005.91
Administration and other expenses 14 1,225.42 833.26
Finance charges 15 19.07 12.97
Depreciation 5 217.87 178.21
3,910.543,910.543,910.543,910.543,910.54 3,030.353,030.353,030.353,030.353,030.35
Profit before taxProfit before taxProfit before taxProfit before taxProfit before tax 875.25875.25875.25875.25875.25 1,177.691,177.691,177.691,177.691,177.69
Tax Expense - current (107.68) (76.03)
- deferred 31.98 12.01
- fringe benefit (18.90) (11.85)
Profit after taxProfit after taxProfit after taxProfit after taxProfit after tax 780.65780.65780.65780.65780.65 1,101.821,101.821,101.821,101.821,101.82
Balance in Profit and Loss Account brought forward 1,570.44 1,185.99
Profit available for appropriation 2,351.092,351.092,351.092,351.092,351.09 2,287.812,287.812,287.812,287.812,287.81AppropriationsAppropriationsAppropriationsAppropriationsAppropriations
Proposed final dividend [including Rs. 0.03 crores 199.94 133.19
(previous year Rs. 0.45 crores) paid for previous year]
Corporate dividend tax on proposed final dividend [including Rs. 0.01 crores 33.97 22.62
(previous year Rs. 0.06 crores) paid for previous year]
Interim Dividend 398.64 392.40
Corporate dividend tax on interim dividend 67.75 58.98
Transfer to general reserve 78.06 110.18
Balance carried forward to the balance sheetBalance carried forward to the balance sheetBalance carried forward to the balance sheetBalance carried forward to the balance sheetBalance carried forward to the balance sheet 1,572.73 1,570.44
2,351.092,351.092,351.092,351.092,351.09 2,287.812,287.812,287.812,287.812,287.81
Earnings per equity share in rupeesEarnings per equity share in rupeesEarnings per equity share in rupeesEarnings per equity share in rupeesEarnings per equity share in rupees 16(20)
Basic 11.75 16.88
Diluted 11.40 16.27
Weighted average number of shares used in computing earningsWeighted average number of shares used in computing earningsWeighted average number of shares used in computing earningsWeighted average number of shares used in computing earningsWeighted average number of shares used in computing earnings
per equity shareper equity shareper equity shareper equity shareper equity share
Basic 664,424,330 652,626,782
Diluted 684,952,820 677,387,746
Significant accounting policies and notes to the accounts 16
The Schedules referred to above form an integral part of the Profit and Loss Account.
This is the Profit and Loss Account referred to in our report of even date.
For HCL Technologies Limited
Kaushik Dutta Shiv Nadar T S R SubramanianPartner Chairman and Chief Strategy Officer Director
Membership No.: F-88540
For and on behalf of Vineet Nayar Ranjit Narasimhan
Price Waterhouse CEO & Wholetime Director President & CEO-BPO Division
Chartered Accountants
Anil Chanana Manish Anand
Executive Vice President - Finance Deputy Company Secretary
Place: Gurgaon, India Place: Noida (UP), India
Date: 01 August 2008 Date: 01 August 2008
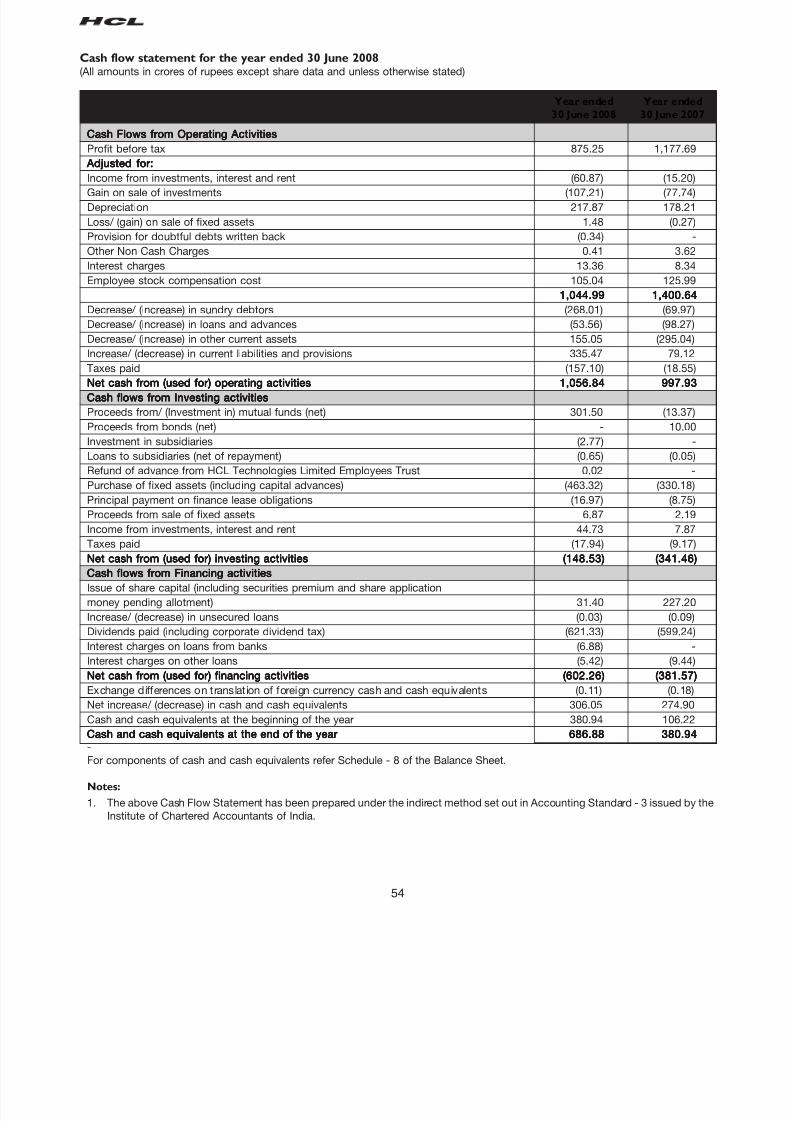
8/7/2019 Indian_GAAP_07-08
http://slidepdf.com/reader/full/indiangaap07-08 55/125
54
Cash flow statement for the year ended 30 June 2008(All amounts in crores of rupees except share data and unless otherwise stated)
Year ended Year ended
30 June 2008 30 June 2007
Cash Flows from Operating ActivitiesCash Flows from Operating ActivitiesCash Flows from Operating ActivitiesCash Flows from Operating ActivitiesCash Flows from Operating Activities
Profit before tax 875.25 1,177.69
Adjusted for:Adjusted for:Adjusted for:Adjusted for:Adjusted for:
Income from investments, interest and rent (60.87) (15.20)Gain on sale of investments (107.21) (77.74)
Depreciation 217.87 178.21
Loss/ (gain) on sale of fixed assets 1.48 (0.27)
Provision for doubtful debts written back (0.34) -
Other Non Cash Charges 0.41 3.62
Interest charges 13.36 8.34
Employee stock compensation cost 105.04 125.99
1,044.991,044.991,044.991,044.991,044.99 1,400.641,400.641,400.641,400.641,400.64
Decrease/ (increase) in sundry debtors (268.01) (69.97)
Decrease/ (increase) in loans and advances (53.56) (98.27)
Decrease/ (increase) in other current assets 155.05 (295.04)
Increase/ (decrease) in current liabilities and provisions 335.47 79.12
Taxes paid (157.10) (18.55)
Net cash from (used for) operating activitiesNet cash from (used for) operating activitiesNet cash from (used for) operating activitiesNet cash from (used for) operating activitiesNet cash from (used for) operating activities 1,056.841,056.841,056.841,056.841,056.84 997.93997.93997.93997.93997.93
Cash flows from Investing activitiesCash flows from Investing activitiesCash flows from Investing activitiesCash flows from Investing activitiesCash flows from Investing activities
Proceeds from/ (Investment in) mutual funds (net) 301.50 (13.37)
Proceeds from bonds (net) - 10.00
Investment in subsidiaries (2.77) -
Loans to subsidiaries (net of repayment) (0.65) (0.05)
Refund of advance from HCL Technologies Limited Employees Trust 0.02 -
Purchase of fixed assets (including capital advances) (463.32) (330.18)
Principal payment on finance lease obligations (16.97) (8.75)
Proceeds from sale of fixed assets 6.87 2.19
Income from investments, interest and rent 44.73 7.87
Taxes paid (17.94) (9.17)Net cash from (used for) investing activitiesNet cash from (used for) investing activitiesNet cash from (used for) investing activitiesNet cash from (used for) investing activitiesNet cash from (used for) investing activities (148.53)(148.53)(148.53)(148.53)(148.53) (341.46)(341.46)(341.46)(341.46)(341.46)
Cash flows from Financing activitiesCash flows from Financing activitiesCash flows from Financing activitiesCash flows from Financing activitiesCash flows from Financing activities
Issue of share capital (including securities premium and share application
money pending allotment) 31.40 227.20
Increase/ (decrease) in unsecured loans (0.03) (0.09)
Dividends paid (including corporate dividend tax) (621.33) (599.24)
Interest charges on loans from banks (6.88) -
Interest charges on other loans (5.42) (9.44)
Net cash from (used for) financing activitiesNet cash from (used for) financing activitiesNet cash from (used for) financing activitiesNet cash from (used for) financing activitiesNet cash from (used for) financing activities (602.26)(602.26)(602.26)(602.26)(602.26) (381.57)(381.57)(381.57)(381.57)(381.57)
Exchange differences on translation of foreign currency cash and cash equivalents (0.11) (0.18)
Net increase/ (decrease) in cash and cash equivalents 306.05 274.90
Cash and cash equivalents at the beginning of the year 380.94 106.22
Cash and cash equivalents at the end of the yearCash and cash equivalents at the end of the yearCash and cash equivalents at the end of the yearCash and cash equivalents at the end of the yearCash and cash equivalents at the end of the year 686.88686.88686.88686.88686.88 380.94380.94380.94380.94380.94
-
For components of cash and cash equivalents refer Schedule - 8 of the Balance Sheet.
Notes:
1. The above Cash Flow Statement has been prepared under the indirect method set out in Accounting Standard - 3 issued by th
Institute of Chartered Accountants of India.
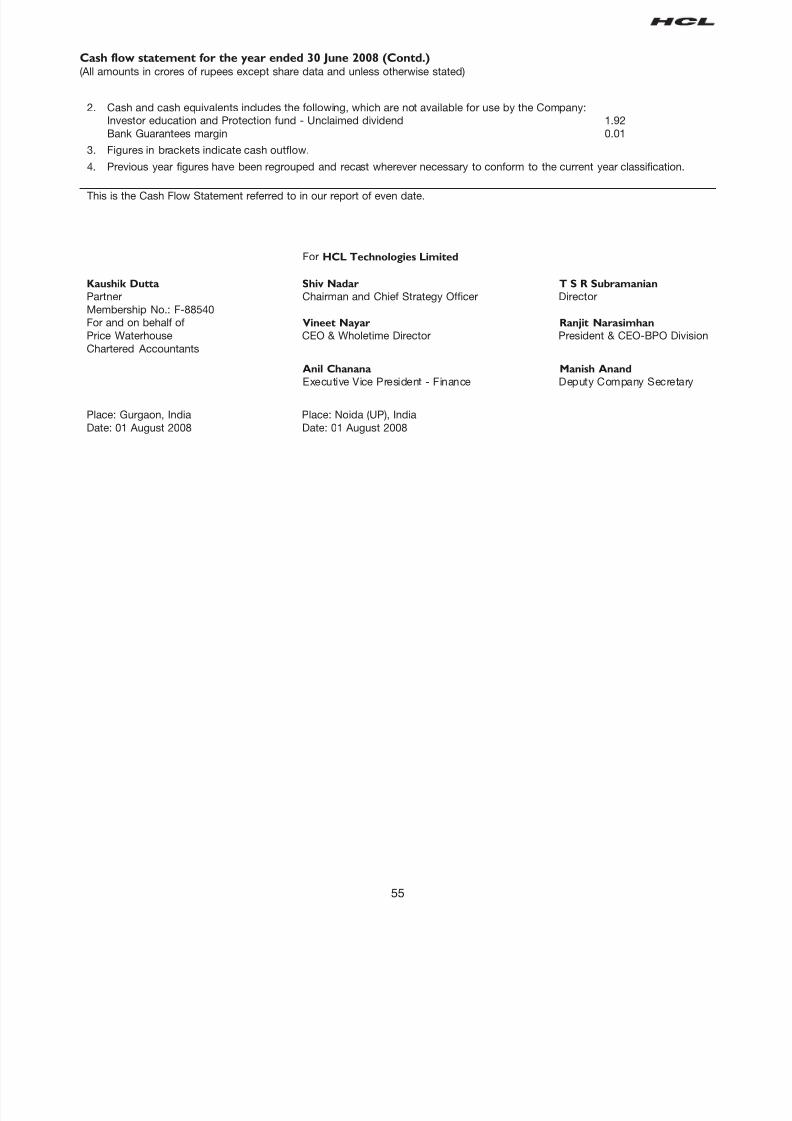
8/7/2019 Indian_GAAP_07-08
http://slidepdf.com/reader/full/indiangaap07-08 56/125
55
Cash flow statement for the year ended 30 June 2008 (Contd.)(All amounts in crores of rupees except share data and unless otherwise stated)
2. Cash and cash equivalents includes the following, which are not available for use by the Company:
Investor education and Protection fund - Unclaimed dividend 1.92
Bank Guarantees margin 0.01
3. Figures in brackets indicate cash outflow.
4. Previous year figures have been regrouped and recast wherever necessary to conform to the current year classification.
This is the Cash Flow Statement referred to in our report of even date.
For HCL Technologies Limited
Kaushik Dutta Shiv Nadar T S R Subramanian
Partner Chairman and Chief Strategy Officer Director
Membership No.: F-88540
For and on behalf of Vineet Nayar Ranjit Narasimhan
Price Waterhouse CEO & Wholetime Director President & CEO-BPO Division
Chartered Accountants
Anil Chanana Manish Anand
Executive Vice President - Finance Deputy Company Secretary
Place: Gurgaon, India Place: Noida (UP), India
Date: 01 August 2008 Date: 01 August 2008

8/7/2019 Indian_GAAP_07-08
http://slidepdf.com/reader/full/indiangaap07-08 57/125
56
Schedule 2: Reserves and Surplus As at Additions Deductions As at
1 July 2007 30 June 2008
Securities Premium Account 1,169.43 53.19 12.68 1,209.94
(971.16) (263.36) (65.09) (1,169.43)
General Reserve 413.33 78.06 2.45 488.94
(303.15) (110.18) - (413.33)
Hedging Reserve Account (net of deferred tax)(refer note 11 of Schedule 16) - (411.85) - (411.85)
- - - -
Employee stock options outstanding 139.08 105.04 24.03 220.09
[net of deferred employee compensation cost of
Rs.115.77 crores (previous year Rs. 242.76 crores)]
(50.88) (125.99) (37.79) (139.08)
Profit and Loss Account 1,570.44 80.35 78.06 1,572.73
(1,185.99) (494.63) (110.18) (1,570.44)
3,292.283,292.283,292.283,292.283,292.28 (95.21)(95.21)(95.21)(95.21)(95.21) 117.22117.22117.22117.22117.22 3,079.853,079.853,079.853,079.853,079.85
Previous year (2,511.18) (994.16) (213.06) (3,292.28)
Notes:
1. Addition to/ Deduction from the Securities Premium Account represent:
a) Addition of Rs. 29.16 crores (previous year Rs. 225.57 crores) in respect of allotment of equity shares of Rs. 2 each temployees of the Company and its subsidiaries under the Employee Stock Option Plan 1999, Employee Stock Option Pla2000 and Employee Stock Option Plan 2004.
b) Addition of Rs. 24.03 crores (previous year Rs. 37.79) being amount transferred from Employee stock options outstandinon exercise of stock options.
c) Deduction of Rs. Nil (previous year Rs. 65.09) being adjustment on account of capitalisation for issue of bonus shares in thratio of 1:1.
d) Deduction of Rs.12.68 crores (previous year Nil) being Fringe Benefit Tax on exercise of Employee stock options.
2. Deduction from General Reserves Rs.2.45 crores (previous year Rs. Nil) is on account of transitional provision on adoption AS 15 (revised). (refer note 17 (C) of schdule 16)
3. Previous year figures are in brackets.
Schedules forming part of the accounts
(All amounts in crores of rupees except share data and unless otherwise stated)
Schedule 1: Share Capital As at As at
30 June 2008 30 June 2007
AuthorisedAuthorisedAuthorisedAuthorisedAuthorised
750,000,000 (previous year 750,000,000 equity shares of Rs. 2 each) 150.00150.00150.00150.00150.00 150.00150.00150.00150.00150.00
Issued, Subscribed and Paid upIssued, Subscribed and Paid upIssued, Subscribed and Paid upIssued, Subscribed and Paid upIssued, Subscribed and Paid up
666,340,272 (previous year 663,683,116) equity shares of Rs. 2 each, fully paid up 133.27 132.74
(refer note 2 of schedule 16)
133.27133.27133.27133.27133.27 132.74132.74132.74132.74132.74
Notes:Notes:Notes:Notes:Notes:
1. Paid up share capital includes:
84,899,958 (previous year 84,899,958) equity shares of Rs. 2 each allotted as fully paid up, pursuant to contracts foconsideration other than cash.
• 82,986,872 (previous year 82,986,872) equity shares of Rs. 2 each issued as bonus shares in ratio of one share for every twheld by capitalisation of general reserve and 325,453,918 (previous year 325,453,918) equity shares of Rs. 2 each issued abonus shares in ratio of one share for every share held by capitalisation of securities premium account.
• 39,866,246 (previous year 39,130,762) equity shares of Rs. 2 each allotted to employees of the Company and its subsidiarieon exercising of vested stock options issued under Employee Stock Option Plan 1999 of the Company.
• 16,310,380 (previous year 15,241,280) equity shares of Rs. 2 each allotted to employees of the Company and its subsidiarieon exercising of vested stock options issued under Employee Stock Option Plan 2000 of the Company.
• 2,540,548 (previous year 1,687,976) equity shares of Rs. 2 each allotted to employees of the Company and its subsidiaries oexercising of vested stock options issued under Employee Stock Option Plan 2004 of the Company.
2. HCL Corporation Limited, which ceased to be the Holding Company w.e.f. 27 March 2007, held 326,003,539 (previous ye326,015,674) equity shares on the date of the Balance Sheet

8/7/2019 Indian_GAAP_07-08
http://slidepdf.com/reader/full/indiangaap07-08 58/125
57
Schedules forming part of the accounts
(All amounts in crores of rupees except share data and unless otherwise stated)
Schedule 3: Secured Loans As at As at
30 June 2008 30 June 2007
From OthersFrom OthersFrom OthersFrom OthersFrom Others
-Finance lease obligations
Leased Vehicles [refer note 3 (i) of schedule 16] 25.24 18.25
(Secured by hypothecation of leased vehicles)Land & Buildings [refer note 3 (ii) of schedule 16] - 22.52
25.2425.2425.2425.2425.24 40.7740.7740.7740.7740.77
Schedule 4: Unsecured Loans As at As at
30 June 2008 30 June 2007
Other Loans and Advances
-From financial institution 0.09 0.12
[Amount payable within one year - Rs. 0.07 crore (previous year Rs. 0.03 crore)]
0.090.090.090.090.09 0.120.120.120.120.12
Schedule 5: Fixed Assets
PARTICULARS GROSS BLOCK ACCUMULATED DEPRECIATION NET BLOCK
As at Additions Disposals/ As at As at Additions Disposals/ As at As at As at
1 July Adjustents 30 June 1 July Adjustments 30 June 30 June 30 June
2007 2008 2007 2008 2008 2007
Goodwill 1.98 - - 1.98 1.84 0.12 - 1.96 0.02 0.1
Freehold land (refer notes 1 & 2) 60.09 3.55 - 63.64 - - - - 63.64 60.0
Leasehold land 111.58 0.13 - 111.71 3.83 1.26 - 5.09 106.62 107.7
Building (refer notes 1 & 2) 124.74 34.30 4.60 154.44 23.52 6.86 0.24 30.14 124.30 101.
Plant and machinery 235.50 53.25 0.63 288.12 130.17 47.02 0.31 176.88 111.24 105.
Computers 376.62 72.44 1.81 447.25 248.74 78.13 0.96 325.91 121.34 127.
Software 126.30 61.09 - 187.39 88.71 27.32 - 116.03 71.36 37.5
Furniture and fixtures 262.46 30.72 1.03 292.15 152.50 48.05 0.61 199.94 92.21 109.
Vehicles - owned 5.29 1.98 0.98 6.29 3.67 0.58 0.89 3.36 2.93 1.6
- leased (refer note 3 28.11 23.96 5.43 46.64 9.60 8.53 3.12 15.01 31.63 18.5
(i) of schedule 16)
1,332.671,332.671,332.671,332.671,332.67 281.42281.42281.42281.42281.42 14.4814.4814.4814.4814.48 1,599.611,599.611,599.611,599.611,599.61 662.58662.58662.58662.58662.58 217.87217.87217.87217.87217.87 6.136.136.136.136.13 874.32874.32874.32874.32874.32 725.29725.29725.29725.29725.29 670.09670.09670.09670.09670.09
Previous year 1,014.08 324.54 5.95 1,332.67 488.40 178.21 4.03 662.58 670.09 525.
Capital work-in-progress (including capital advances) 419.03419.03419.03419.03419.03 212.86212.86212.86212.86212.86
Notes:
1 Additions to freehold land and building includes Rs. Nil (previous year Rs. 6.43 crores) and Rs. Nil (previous year Rs. 17.39 crores ) respectively acquired on
finance lease. (refer note 3 (ii) of schedule 16)
2 Addition to freehold land Rs. 3.55 crores (previous year Nil) and deletion from building Rs 4.60 crores (previous year Nil) on account of exercise of option to
purchase the land & building capitalised on finance lease in the previous year. (refer note 3 (ii) of schedule 16)

8/7/2019 Indian_GAAP_07-08
http://slidepdf.com/reader/full/indiangaap07-08 59/125
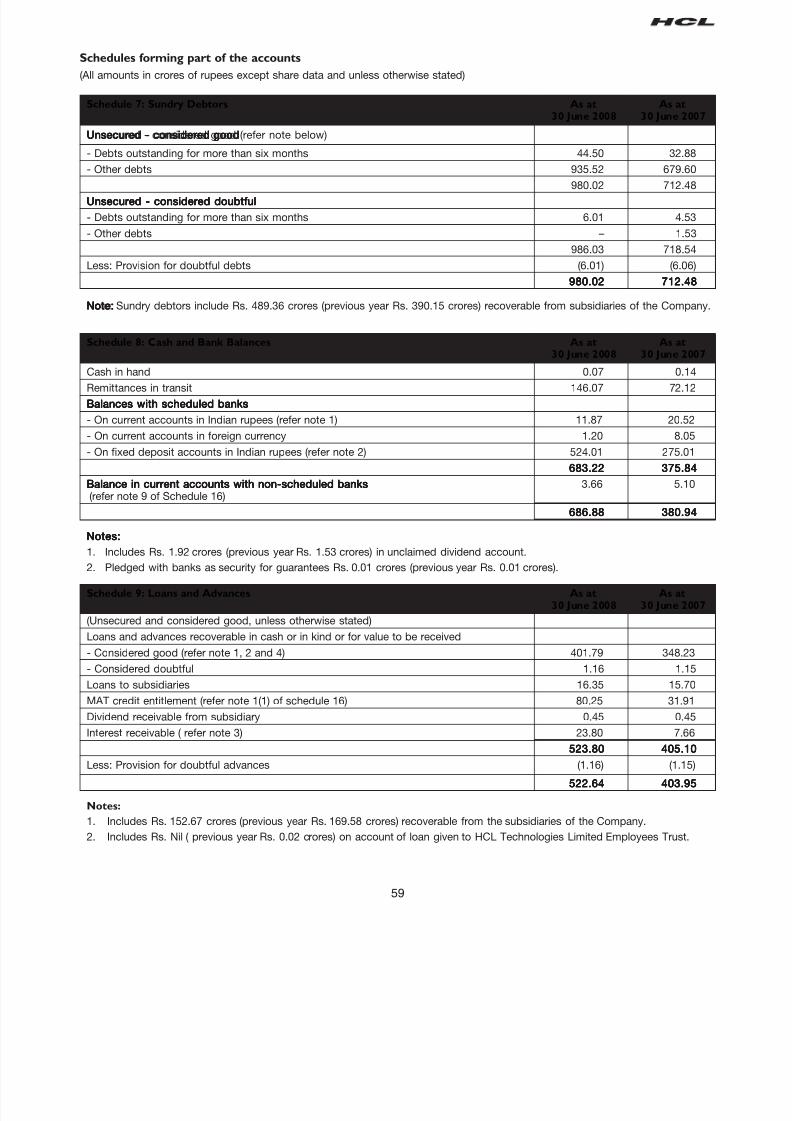
8/7/2019 Indian_GAAP_07-08
http://slidepdf.com/reader/full/indiangaap07-08 60/125
59
Schedules forming part of the accounts
(All amounts in crores of rupees except share data and unless otherwise stated)
Schedule 7: Sundry Debtors As at As at30 June 2008 30 June 2007
Unsecured - considered goodUnsecured - considered goodUnsecured - considered goodUnsecured - considered goodUnsecured - considered good (refer note below)
- Debts outstanding for more than six months 44.50 32.88
- Other debts 935.52 679.60
980.02 712.48
Unsecured - considered doubtfulUnsecured - considered doubtfulUnsecured - considered doubtfulUnsecured - considered doubtfulUnsecured - considered doubtful
- Debts outstanding for more than six months 6.01 4.53
- Other debts – 1.53
986.03 718.54
Less: Provision for doubtful debts (6.01) (6.06)
980.02980.02980.02980.02980.02 712.48712.48712.48712.48712.48
Note:Note:Note:Note:Note: Sundry debtors include Rs. 489.36 crores (previous year Rs. 390.15 crores) recoverable from subsidiaries of the Company
Schedule 8: Cash and Bank Balances As at As at30 June 2008 30 June 2007
Cash in hand 0.07 0.14
Remittances in transit 146.07 72.12
Balances with scheduled banksBalances with scheduled banksBalances with scheduled banksBalances with scheduled banksBalances with scheduled banks
- On current accounts in Indian rupees (refer note 1) 11.87 20.52
- On current accounts in foreign currency 1.20 8.05
- On fixed deposit accounts in Indian rupees (refer note 2) 524.01 275.01
683.22683.22683.22683.22683.22 375.84375.84375.84375.84375.84
Balance in current accounts with non-scheduled banksBalance in current accounts with non-scheduled banksBalance in current accounts with non-scheduled banksBalance in current accounts with non-scheduled banksBalance in current accounts with non-scheduled banks 3.66 5.10(refer note 9 of Schedule 16)
686.88686.88686.88686.88686.88 380.94380.94380.94380.94380.94
Notes:Notes:Notes:Notes:Notes:
1. Includes Rs. 1.92 crores (previous year Rs. 1.53 crores) in unclaimed dividend account.
2. Pledged with banks as security for guarantees Rs. 0.01 crores (previous year Rs. 0.01 crores).
Schedule 9: Loans and Advances As at As at30 June 2008 30 June 2007
(Unsecured and considered good, unless otherwise stated)
Loans and advances recoverable in cash or in kind or for value to be received
- Considered good (refer note 1, 2 and 4) 401.79 348.23
- Considered doubtful 1.16 1.15
Loans to subsidiaries 16.35 15.70
MAT credit entitlement (refer note 1(1) of schedule 16) 80.25 31.91
Dividend receivable from subsidiary 0.45 0.45
Interest receivable ( refer note 3) 23.80 7.66
523.80523.80523.80523.80523.80 405.10405.10405.10405.10405.10
Less: Provision for doubtful advances (1.16) (1.15)
522.64522.64522.64522.64522.64 403.95403.95403.95403.95403.95
Notes:
1. Includes Rs. 152.67 crores (previous year Rs. 169.58 crores) recoverable from the subsidiaries of the Company.
2. Includes Rs. Nil ( previous year Rs. 0.02 crores) on account of loan given to HCL Technologies Limited Employees Trust.

8/7/2019 Indian_GAAP_07-08
http://slidepdf.com/reader/full/indiangaap07-08 61/125
60
3. Includes Rs. 0.01 (previous year Rs. Nil) recoverable from the subsidiaries of the Company.
4. Dues from the officers of the Company Rs. Nil (previous year Rs. Nil), maximum balance outstanding during the year Rs. N(previous year Rs. 0.07 crores).
Schedule 10: Other Current Assets As at As at
30 June 2008 30 June 2007
Unbilled revenue (refer note below) 167.31 102.68
Deferred costs 63.05 7.12
Unrealised gain on derivative financial instruments (net) - 275.50
230.36230.36230.36230.36230.36 385.30385.30385.30385.30385.30
Note:Note:Note:Note:Note: Includes Rs. 91.42 crores (previous year Rs. 59.56 crores) in respect of subsidiaries of the Company.
Schedule 11: Current Liabilities and Provisions As at As at
30 June 2008 30 June 2007
Current liabilitiesCurrent liabilitiesCurrent liabilitiesCurrent liabilitiesCurrent liabilities
Sundry creditors (refer note 1 & 2) 1,050.06 858.50
Unrealised loss on derivative financial instruments (net) 648.21 -
Unearned revenue (refer note 3) 57.39 55.44
Advance from customers (refer note 4) 44.48 65.32
Investor Education and Protection Fund- Unclaimed dividend 1.92 1.53
Other liabilities 26.79 22.23
1,828.851,828.851,828.851,828.851,828.85 1,003.021,003.021,003.021,003.021,003.02
ProvisionsProvisionsProvisionsProvisionsProvisions
Provision for staff benefits 94.62 67.13
Provision for income tax (refer note 5) 96.98 88.54
Provision for fringe benefit tax (refer note 6) 7.68 4.41
Provision for wealth tax - 0.01
Provision for dividend (including corporate dividend tax) 233.87 155.30
433.15433.15433.15433.15433.15 315.39315.39315.39315.39315.39
2,262.002,262.002,262.002,262.002,262.00 1,318.411,318.411,318.411,318.411,318.41
Notes:Notes:Notes:Notes:Notes:
1. Sundry creditors include Rs. 569.42 crores (previous year Rs. 568.10 crores) due to subsidiaries of the Company.
2 Sundry creditors includes Rs. Nil (previous year Nil) payable to Micro & Small Enterprise (refer note 22 of schedule 16)
3. Unearned revenue includes Rs. 6.15 crores (previous year Rs. 35.41 crores) pertaining to the subsidiaries of the Company.
4. Advance from customer includes Rs. 13.32 crores (previous year Rs. 64.46 crores) pertaining to the subsidiaries of the Compan
5. Net of advance income tax of Rs. 243.88 crores (previous year Rs. 96.06 crores).
6. Net of fringe benefit advance tax of Rs. 46.51 crores (previous year Rs. 19.29 crores).
Schedules forming part of the accounts(All amounts in crores of rupees except share data and unless otherwise stated)

8/7/2019 Indian_GAAP_07-08
http://slidepdf.com/reader/full/indiangaap07-08 62/12561
Schedule 12: Other Income Year ended Year ended
30 June 2008 30 June 2007
Interest income-gross
[Tax deducted at source Rs. 7.67 crores (previous year Rs. 0.05 crores)]
- On fixed deposits 50.54 7.72
- On investments (other than trade) 0.67 1.25- On loans 0.05 0.05
Dividend Income
- On trade investments 0.45 0.45
- On investments (other than trade) 6.79 3.65
Exchange differences - 345.34
Rent income 2.37 2.08
Profit on sale of investments (other than trade) 107.21 77.73
Profit on sale of fixed assets (net) - 0.27
Provision for diminution in value of investments written back - 0.01
Provision for doubtful debts written back 0.34 -
Miscellaneous income 1.98 0.87170.40170.40170.40170.40170.40 439.42439.42439.42439.42439.42
Schedule 13: Cost of Revenues Year ended Year ended
30 June 2008 30 June 2007
Personnel expensesPersonnel expensesPersonnel expensesPersonnel expensesPersonnel expenses
Salaries, wages and bonus 1,532.14 1,244.34
Contribution to provident and other funds 56.04 42.46
Staff welfare expenses 33.17 35.79
Employee stock compensation expense 105.04 125.99
1,726.39 1,448.58OthersOthersOthersOthersOthers
Software development expenses - external 721.79 557.33
2,448.182,448.182,448.182,448.182,448.18 2,005.912,005.912,005.912,005.912,005.91
Schedules forming part of the accounts(All amounts in crores of rupees except share data and unless otherwise stated)
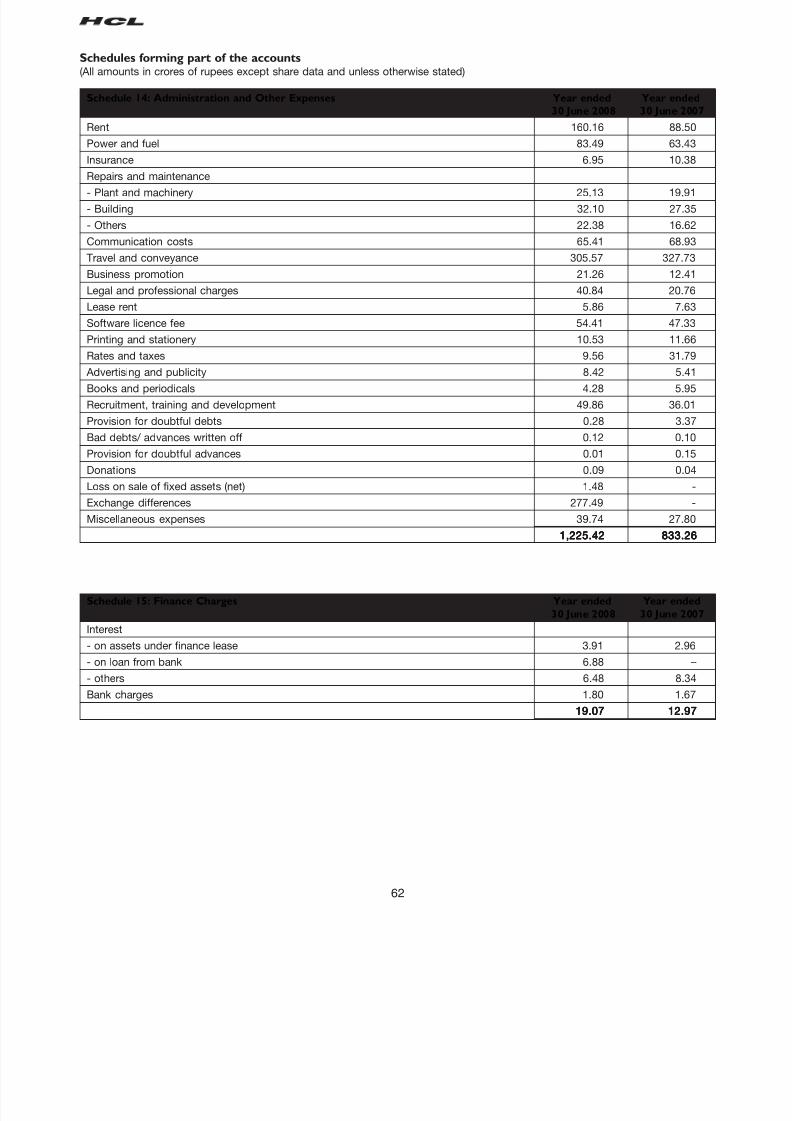
8/7/2019 Indian_GAAP_07-08
http://slidepdf.com/reader/full/indiangaap07-08 63/125
62
Schedules forming part of the accounts(All amounts in crores of rupees except share data and unless otherwise stated)
Schedule 14: Administration and Other Expenses Year ended Year ended
30 June 2008 30 June 2007
Rent 160.16 88.50
Power and fuel 83.49 63.43
Insurance 6.95 10.38
Repairs and maintenance- Plant and machinery 25.13 19.91
- Building 32.10 27.35
- Others 22.38 16.62
Communication costs 65.41 68.93
Travel and conveyance 305.57 327.73
Business promotion 21.26 12.41
Legal and professional charges 40.84 20.76
Lease rent 5.86 7.63
Software licence fee 54.41 47.33
Printing and stationery 10.53 11.66
Rates and taxes 9.56 31.79
Advertising and publicity 8.42 5.41
Books and periodicals 4.28 5.95
Recruitment, training and development 49.86 36.01
Provision for doubtful debts 0.28 3.37
Bad debts/ advances written off 0.12 0.10
Provision for doubtful advances 0.01 0.15
Donations 0.09 0.04
Loss on sale of fixed assets (net) 1.48 -
Exchange differences 277.49 -
Miscellaneous expenses 39.74 27.80
1,225.421,225.421,225.421,225.421,225.42 833.26833.26833.26833.26833.26
Schedule 15: Finance Charges Year ended Year ended
30 June 2008 30 June 2007
Interest
- on assets under finance lease 3.91 2.96
- on loan from bank 6.88 –
- others 6.48 8.34
Bank charges 1.80 1.67
19.0719.0719.0719.0719.07 12.9712.9712.9712.9712.97

8/7/2019 Indian_GAAP_07-08
http://slidepdf.com/reader/full/indiangaap07-08 64/125
63
Schedules forming part of the accounts
(All amounts in crores of rupees except share data and unless otherwise stated)
Schedule 16: Significant accounting policies and notes to the accounts
Company Overview
HCL Technologies Limited (hereinafter referred to as ‘HCL’ or ‘the Company’) is primarily engaged in providing a range of informatio
technology, business process outsourcing and infrastructure product and management services. The Company was incorporated
India in November 1991 and focuses on technology and R&D outsourcing, working with clients in areas at the core of their business
The Company leverages an extensive offshore infrastructure and its global network of offices in various countries and professiona
to deliver solutions across select verticals including Retail & Consumer, Aerospace, Automotive, Telecom, Financial ServiceGovernment, Hitech, Media and Entertainment, Travel, Transportation and Logistics, Energy and utilities, Life Sciences and Healthcar
1. Significant accounting policies
a) Basis of preparation
The financial statements are prepared and presented under the historical cost convention, in accordance with the India
Generally Accepted Accounting Principles (“GAAP”), the applicable accounting standards notified u/s 211(3C) of th
Companies Act, 1956, the relevant provisions of the Companies Act, 1956 and guidelines issued by the Securities an
Exchange Board of India. The financial statements are presented in crores of Indian rupees.
b) Use of estimates
The preparation of financial statements in conformity with GAAP requires management to make estimates and assumption
that affect the reported amounts of assets and liabilities, disclosure of contingent assets and liabilities at the date of th
financial statements and the results of operations during the reporting period. Examples of such estimates include estimate
of expected contract costs to be incurred to complete software development, income taxes, employee benefit plansprovision for doubtful debts and advances and estimated useful life of fixed assets and intangible assets. Actual result
could differ from these estimates. Any revision to accounting estimates is recognised prospectively in current and futu
periods.
c) Revenue recognition
i) IT Services
Revenue from IT services comprises income from time and material and fixed price contracts. Revenue with respec
to time and material contracts is recognized as related services are performed. Revenue from fixed price contract
and fixed time frame contracts is recognized in accordance with the percentage completion method under which th
sales value of performance, including earnings thereon, is recognized on the basis of cost incurred in respect of eac
contract as a proportion of total cost expected to be incurred. The cumulative impact of any revision in estimates o
the percentage of work completed is reflected in the year in which the change becomes known. Provisions for estimate
losses are made during the year in which a loss becomes probable based on current contract estimates. Revenu
from sale of licenses for the use of software applications is recognised on transfer of title in the user license. Revenu
from annual technical service contracts is recognised on a pro rata basis over the period in which such services ar
rendered. Income from revenue sharing agreements is recognized when the right to receive is established. Cost an
earnings in excess of billing are classified as unbilled revenue, while billing in excess of Cost and earnings are classifie
as unearned revenue. Incremental revenue from existing contracts arising on future sales of the customers’ product
will be recognized when it is earned. Revenue and related direct costs from transition services in outsourcin
arrangements are deferred and recognized over the period of the arrangement. Certain upfront non-recurring cost
incurred in the initial phases of outsourcing contracts and contract acquisition costs, are deferred and amortize
usually on a straight line basis over the term of the contract. The Company periodically estimates the undiscounte
cash flows from the arrangement and compares it with the unamortized costs. If the unamortized costs exceed th
undiscounted cash flow, a loss is recognized.
ii) Business Process Outsourcing services
Revenue from Business Process Outsourcing services is derived from both time based and unit-price contracts
Revenue is recognized as the related services are performed in accordance with the specific terms of the contract
with the customer.
The Company accounts for volume discounts and pricing incentives to customers. The discount terms in the Company
arrangements with customers generally entitle the customer to discounts, if the customer completes a specified lev
of revenue transactions. In some arrangements, the level of discount varies with increases in the levels of revenu
transactions. The Company recognizes discount obligations as a reduction of revenue based on the ratable allocatio
of the discount to each of the underlying revenue transactions that result in progress by the customer toward earnin
the discount.
Revenues are shown net of sales tax, value added tax, service tax and applicable discounts and allowances. Th
revenue is recognized net of discounts and allowances.

8/7/2019 Indian_GAAP_07-08
http://slidepdf.com/reader/full/indiangaap07-08 65/125
64
Schedules forming part of the accounts
(All amounts in crores of rupees except share data and unless otherwise stated)
Schedule 16: Significant accounting policies and notes to the accounts (Contd.)
iii) Others
Profit on sale of Investments is recorded on transfer of title from the Company and is determined as the differenc
between the sales price and the then carrying value of the investment. Interest on the deployment of surplus funds
recognised using the time-proportion method, based on interest rates implicit in the transaction. Dividend income
brokerage, commission and rent are recognised when the right to receive the same is established.
d) Expenditure
Expenses are accounted for on the accrual basis and provisions are made for all known losses and liabilities.
e) Fixed assets
Fixed assets are stated at the cost of acquisition including incidental costs related to acquisition and installation les
accumulated depreciation. Fixed assets under construction, advances paid towards acquisition of fixed assets and cost o
assets not ready for use before the year-end, are disclosed as capital work in progress.
f) Depreciation
Depreciation on fixed assets except leasehold land and leasehold improvements is provided on the straight-line metho
over their estimated useful lives, as determined by the management, at the rates which are equal to or higher than the rate
prescribed under Schedule XIV of the Companies Act, 1956. Leasehold land is amortised over the period of lease. Leaseho
improvements are amortised over a period of four years or the remaining period of the lease, whichever is shorter. Estimate
useful life of goodwill is five years and the carrying value of goodwill at the end of each accounting period is reviewed foimpairment. Depreciation is charged on a pro-rata basis for assets purchased/sold during the year. Assets costing les
than Rs. 5,000 are fully depreciated in the year of purchase. The management’s estimate of the useful life of the variou
fixed assets is as follows:
Life (in years)
Buildings 20
Plant and machinery (including office equipment,
air conditioners and electrical installations) 4
Computers 2- 4
Software 3
Furniture and fixtures 4
Vehicles-Owned 5
Vehicle-Leased Over the period of lease or 5 years, whichever is lower
(g) Leases
Finance leases
The assets taken on finance lease are capitalised at the inception of the lease at the lower of the fair value or the presen
value of minimum lease payments and a liability is created for an equivalent amount. Each lease rental paid is allocate
between the liability and interest cost, so as to obtain a constant periodic rate of interest on outstanding liability for eac
period.
Operating leases
Lease payments under an operating lease are recognised as an expense in the profit and loss account on a straight lin
basis over the lease term.
h) Investments
Trade investments are the investments made to enhance the company’s business interests. Investments are either classifie
as long term or current investments, based on management’s intention at the time of purchase. Long-term investment
are stated at cost and provision is made to recognise any decline, other than temporary, determined separately for eac
investment. Current investments are stated at the lower of cost and fair value. The comparison of cost and fair value i
done separately in respect of each category of investments.

8/7/2019 Indian_GAAP_07-08
http://slidepdf.com/reader/full/indiangaap07-08 66/125
65
Schedules forming part of the accounts
(All amounts in crores of rupees except share data and unless otherwise stated)
Schedule 16: Significant accounting policies and notes to the accounts (Contd.)
i) Foreign exchange transactions
Foreign exchange transactions are recorded at the exchange rates prevailing at the date of the transaction. Realise
gains and losses on foreign exchange transactions during the year are recognised in the Profit and Loss Account. Foreig
currency monetary assets and liabilities are translated at year-end rates and resultant gains/losses on foreign exchang
translations are recognised in the Profit and Loss Account.
The branches of the Company are considered integral to the Company’s operations. The transactions of these branche
have been translated as if the transactions of the branches were the transactions of the Company itself.
j) Derivative Instruments and Hedge Accounting
The Company uses derivative financial instruments (foreign currency forward and option contracts) to hedge its risk
associated with foreign currency fluctuations relating to certain forecasted transactions.
The use of foreign currency forward contracts is governed by the Company’s policies, which provide written principles o
the use of such financial derivatives consistent with the Company’s risk management strategy. The Company does no
use derivative financial instruments for speculative purposes.
Foreign currency forward contract derivative instruments are initially measured at fair value, and are remeasured a
subsequent reporting dates.
In respect of derivatives designated as hedges, the Company formally documents all relationships between hedgin
instruments and hedged items, as well as its risk management objective and strategy for undertaking various hedg
transactions. The Company also formally assesses both at the inception of the hedge and on an ongoing basis, whethe
each derivative is highly effective in offsetting changes in fair values or cash flows of the hedged item. Changes in the fa
value of these derivatives (net of tax) that are designated and effective as hedges of future cash flows are recognise
directly in Hedging Reserve Account under shareholders’ funds and the ineffective portion is recognized immediately
profit and loss account. Changes in the fair value of derivative financial instruments that do not qualify for hedge accountin
are recognized in profit and loss account as they arise.
Hedge accounting is discontinued from the last testing date when the hedging instrument expires or is sold, terminated
or exercised, or no longer qualifies for hedge accounting. Cumulative gain or loss on such hedging instrument recognise
in shareholder’s funds is retained there until the forecasted transaction occurs. If a hedged transaction is no longe
expected to occur, the net cumulative gain or loss recognised in shareholders’ funds is transferred to profit and los
account for the year.
k) Employee stock option based compensationThe Company calculates the compensation cost based on the intrinsic value method wherein the excess of market pric
of underlying equity shares on the date of the grant of options over the exercise price of the options given to employee
under the employee stock option schemes of the Company, is recognised as deferred stock compensation cost and
amortised on a graded vesting basis over the vesting period of the options.
l) Taxation
Income tax expenses comprise current tax and deferred tax charge or credit (reflecting the tax effects of the timin
differences between the accounting income and taxable income for the period). The deferred tax charge or credit and th
corresponding deferred tax liabilities or assets are recognised using the tax rates that have been enacted or substantial
enacted by the balance sheet date. Deferred tax assets are recognised only to the extent there is reasonable certainty tha
the assets can be realised in the future; however, where there is unabsorbed depreciation or carried forward loss unde
taxation laws, deferred tax assets are recognised only if there is virtual certainty of realisation of such assets. Deferred ta
assets are reviewed for the appropriateness of their carrying values at each balance sheet date.
The tax filings are subject to review by the tax authorities in the jurisdictions where the company conducts business
These reviews may result in assessments of additional taxes that are resolved with the authorities or potentially throug
the courts. Resolution of these matters involves some degree of uncertainty; accordingly, the company provides incom
taxes for the liabilities it believes will ultimately result from the proceedings.
Minimum Alternate Tax (MAT) paid in accordance with tax laws, which give rise to future economic benefits in the form o
adjustment of future tax liability, is considered as an asset in the balance sheet when it is probable that the future econom
benefit associated with it will flow to the company and the asset can be measured reliably.
Provision for wealth tax is made based on tax liability computed after considering tax allowances and exemptions availab
in accordance with the provisions of the Wealth tax Act, 1957.

8/7/2019 Indian_GAAP_07-08
http://slidepdf.com/reader/full/indiangaap07-08 67/125
66
m) Employee benefits
Provident Fund:
Contributions to provident fund, a defined benefit plan are deposited with a recognised provident fund trust, set up by th
Company. The interest rate payable by the trust to the beneficiaries every year is notified by the government and th
company has an obligation to make good the shortfall, if any, between the return from the investments of the trust and thnotified interest rate. Liability with regard to the same is accrued based on actuarial valuations at the balance sheet date
carried out by an independent actuary.
Superannuation:
The Company made contributions to a scheme administered by an insurance company in respect of superannuation fo
applicable employees. The Company had no further obligations to the superannuation plan beyond its monthly contribution
Compensated absences:
The employees of the Company are entitled to compensated absences. The employees can carry forward a portion o
unutilized accrued compensated absence and utilize it in future periods or receive cash compensation at retirement o
termination of employment for the unutilized accrued compensated absence. The Company records an obligation fo
compensated absences in the period in which the employee renders the service that increase this entitlement. The Compan
measures the expected cost of compensated absence as the additional amount that the Company expects to pay as
result of the unused entitlement that has accumulated at the balance sheet date.Gratuity:
The Company provides for gratuity, a defined benefit retirement plan. The plan provides a lump sum payment to veste
employees, at retirement or termination of employment, an amount based on the respective employee’s last drawn salar
and the years of employment with the Company.
Liability with regard to compensated absences and gratuity is accrued based on actuarial valuations at the balance shee
date, carried out by an independent actuary. Gains and losses arising out of actuarial evaluations are recognised immediate
in the Profit and Loss account as income or expense.
State Plans:
The Company’s contribution to State Plans namely Employee State Insurance Fund and Employees Pension Scheme ar
charged to Revenue every year.
n) Research and Development
Revenue expenditure on research and development is expensed as incurred. Capital expenditure incurred on equipmen
and facilities acquired or constructed for research and development activities and having alternative future uses, ar
capitalised and included in fixed assets.
o) Earnings per share
In determining earnings per share, the company considers the net profit after tax and includes the post tax effect of an
extra ordinary /exceptional item. Basic earning per share is computed using the weighted average number of equi
shares outstanding during the year. Diluted earning per share is computed using the weighted average number of equit
shares outstanding during the year and dilutive equity equivalent shares outstanding at the year end, except where th
results would be anti dilutive.
p) Impairment of assets
Impairment loss, if any, is provided to the extent, the carrying amount of assets exceeds their recoverable amount.
Recoverable amount is higher of an asset’s net selling price, and its value in use. Value in use is the present value o
estimated future cash flows expected to arise from the continuing use of an asset and from its disposal at the end of i
useful life.
q) Provisions and Contingent liabilities
A provision is recognised when there is a present obligation as a result of a past event, it is probable that an outflow o
resources will be required to settle the obligation and in respect of which reliable estimate can be made. A disclosure o
a contingent liability is made when there is a possible obligation or a present obligation that may, but probably will not
require an outflow of resources. Where there is a possible obligation or a present obligation in respect of which th
likelihood of outflow of resources is remote, no provision or disclosure is made.
Schedules forming part of the accounts
(All amounts in crores of rupees except share data and unless otherwise stated)
Schedule 16: Significant accounting policies and notes to the accounts (Contd.)

8/7/2019 Indian_GAAP_07-08
http://slidepdf.com/reader/full/indiangaap07-08 68/125
67
Schedules forming part of the accounts
(All amounts in crores of rupees except share data and unless otherwise stated)
Schedule 16: Significant accounting policies and notes to the accounts (Contd.)
2. Employee stock option plan (ESOP)
The Company has established ESOP 1999, ESOP 2000 and ESOP 2004, for a total grant of 20,000,000, 15,000,000 an
20,000,000 options respectively to employees of the Company and its subsidiaries. These options are vested over a maximum
period of 110 months, 104 months and 84 months respectively from the date of grant and are to be exercised within a maximum
period of five years from the date of vesting.
Each option granted under the above plans entitles the holder to four equity shares of the Company at an exercise price, whic
is approved by the Compensation Committee.
As at 30 June 2008 2,822,430 (previous year 3,442,289) options were outstanding with the employees of the Company and it
subsidiaries under the ESOP 1999 Plan
Movement in Stock options Year ended Year ended
30 June 2008 30 June 2007
Outstanding at the beginning of the year 3,442,289 5,914,361
Add: Granted during the year - -
Less: Forfeited during the year (245,688) (519,995)
Exercised during the year (183,871) (1,564,580)
Expired during the year (190,300) (387,497)
Options outstanding at the end of the year 2,822,4302,822,4302,822,4302,822,4302,822,430 3,442,2893,442,2893,442,2893,442,2893,442,289
As at 30 June 2008 4,091,441 (previous year 5,041,132) options were outstanding with the employees of the Company and it
subsidiaries under the ESOP 2000 Plan
Movement in Stock options Year ended Year ended
30 June 2008 30 June 2007
Outstanding at the beginning of the year 5,041,132 8,453,526
Add: Granted during the year - -
Less: Forfeited during the year (358,796) (898,137)
Exercised during the year (267,275) (2,185,299)
Expired during the year (323,620) (328,958)
Options outstanding at the end of the year 4,091,4414,091,4414,091,4414,091,4414,091,441 5,041,1325,041,1325,041,1325,041,1325,041,132
As at 30 June 2008 3,325,543 (previous year 3,752,886) options were outstanding with the employees of the Company and it
subsidiaries under the ESOP 2004 Plan
Movement in Stock options Year ended Year ended
30 June 2008 30 June 2007
Outstanding at the beginning of the year 3,752,886 2,669,400
Add: Granted during the year - 1,720,200
Less: Forfeited during the year (210,780) (214,720)
Exercised during the year (213,143) (421,994)
Expired during the year (3,420) -
Options outstanding at the end of the year 3,325,5433,325,5433,325,5433,325,5433,325,543 3,752,8863,752,8863,752,8863,752,8863,752,886
The Company has calculated the compensation cost based on the intrinsic value method i.e. the excess of market price o
underlying equity shares on the date of the grant of options over the exercise price of the options given to employees under th
employee stock option schemes of the Company is recognised as deferred stock compensation cost and is amortised on

8/7/2019 Indian_GAAP_07-08
http://slidepdf.com/reader/full/indiangaap07-08 69/125
68
graded vesting basis over the vesting period of the options. Had the Company applied the fair value method for determinin
compensation cost, the impact on net income and earnings per share is provided below:
Year ended Year ended
30 June 2008 30 June 2007
Net income – As reportedNet income – As reportedNet income – As reportedNet income – As reportedNet income – As reported 780.65780.65780.65780.65780.65 1,101.821,101.821,101.821,101.821,101.82Net income – ProformaNet income – ProformaNet income – ProformaNet income – ProformaNet income – Proforma 775.68775.68775.68775.68775.68 1,080.171,080.171,080.171,080.171,080.17
Earnings per share (refer note 20)Earnings per share (refer note 20)Earnings per share (refer note 20)Earnings per share (refer note 20)Earnings per share (refer note 20)
Basic - As reported 11.75 16.88
- Proforma 11.67 16.55
Diluted - As reported 11.40 16.27
- Proforma 11.32 15.95
Assumptions
The fair value of each share is estimated on the date of grant using the Black-Scholes model with the following assumptions
Year ended
30 June 2007
Dividend yield % 3.65%Expected term Up to 35 months
Risk free interest rates 8.10%
Volatility 26.67%
The volatility of the share has been determined on the basis of the Company’s historical share price for the period of 3 years
months. There has been no grant during the year.
3.3.3.3.3. i)i)i)i)i) The Company has acquired vehicles on finance leases. The total minimum lease payments and maturity profile of financ
leases at the balance sheet date, the element of interest included in such payments, and the present value of the minimum
lease payments as of 30 June 2008 are as follows:
Total minimum Interest included Present value of
lease payments in minimum lease minimum lease
outstanding payments payments
Not later than one year 12.41 3.18 9.23
(8.42) (1.69) (6.73)
Later than one year and not later than five years 20.01 4.00 16.01
(13.24) (1.72) (11.52)
32.4232.4232.4232.4232.42 7.187.187.187.187.18 25.2425.2425.2425.2425.24
(21.66) (3.41) (18.25)
Previous year figures are in brackets.
ii)ii)ii)ii)ii) During the year ended 30 June 2006, the Company has entered into a lease agreement for a plot of land and building und
which on expiry of five year period, lessor was bound to sell and company was required to purchase it. On getting possessio
of the same in the previous year, the Company has capitalised the aforesaid property by treating the transaction as a financ
lease and amount apportioned to freehold land and building on a fair value basis.
During the current year the Company has purchased the said land and building at a value of Rs. 22.76 crores which haresulted in an adjustment to the values of land and building capitalised earlier on the basis of fair values. Accordingly
addition to freehold land of Rs. 3.55 crores (previous year Rs. Nil) and deletion from building of Rs 4.60 crores (previous yea
Rs. Nil) has been made.
Schedules forming part of the accounts
(All amounts in crores of rupees except share data and unless otherwise stated)
Schedule 16: Significant accounting policies and notes to the accounts (Contd.)
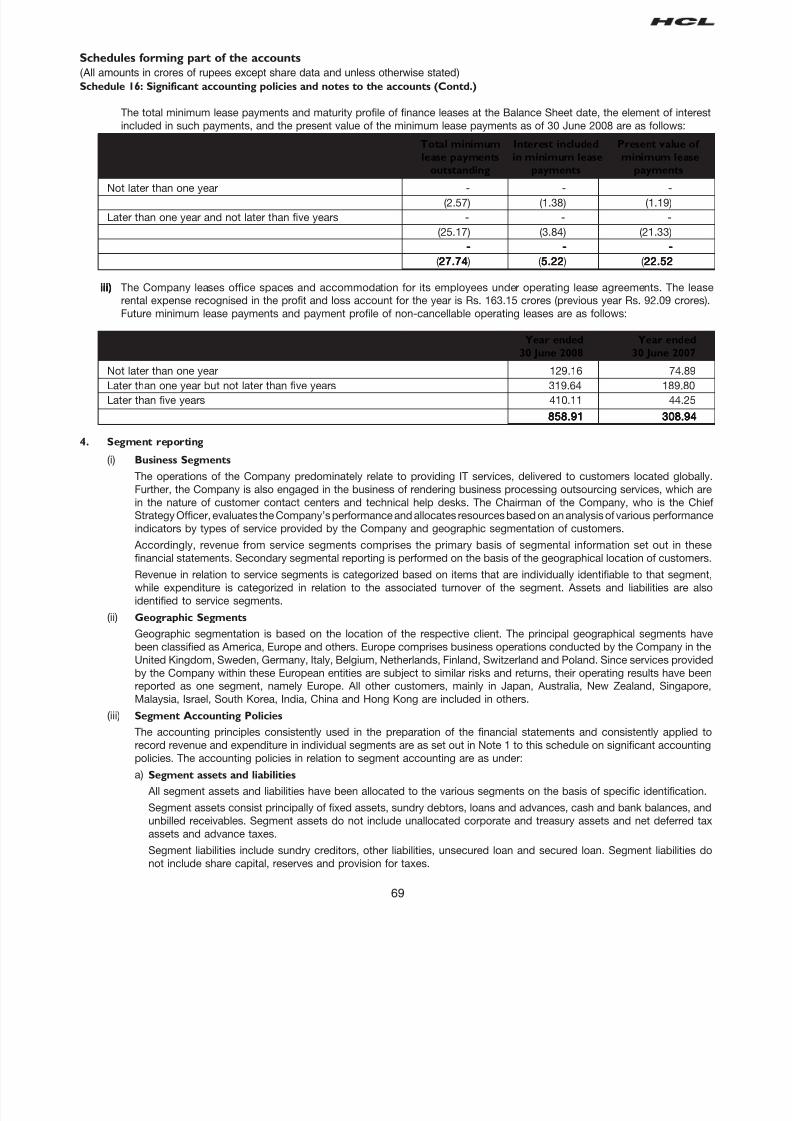
8/7/2019 Indian_GAAP_07-08
http://slidepdf.com/reader/full/indiangaap07-08 70/125

8/7/2019 Indian_GAAP_07-08
http://slidepdf.com/reader/full/indiangaap07-08 71/125
70
IT services Business process Total
outsourcing services
Segment RevenuesSegment RevenuesSegment RevenuesSegment RevenuesSegment Revenues 4,012.01 603.38 4,615.394,615.394,615.394,615.394,615.39
Segment resultsSegment resultsSegment resultsSegment resultsSegment results 1,006.88 162.38 1,169.261,169.261,169.261,169.261,169.26
Unallocated corporate expenses (464.41)
Other Income 170.40
Net profit before taxesNet profit before taxesNet profit before taxesNet profit before taxesNet profit before taxes 875.25875.25875.25875.25875.25
Income tax 94.60
Net profit after taxesNet profit after taxesNet profit after taxesNet profit after taxesNet profit after taxes 780.65780.65780.65780.65780.65
AssetsAssetsAssetsAssetsAssets
Segment assets 2,376.04 337.37 2,713.41
Unallocated assets 2,788.75
Total assetsTotal assetsTotal assetsTotal assetsTotal assets 5,502.165,502.165,502.165,502.165,502.16
LiabilitiesLiabilitiesLiabilitiesLiabilitiesLiabilities
Segment liabilities 1,213.49 83.62 1,297.11
Unallocated liabilities 990.22
Total liabilitiesTotal liabilitiesTotal liabilitiesTotal liabilitiesTotal liabilities 2,287.332,287.332,287.332,287.332,287.33
OthersOthersOthersOthersOthers
Capital expenditure (including capital work in progress) 237.85 13.87 251.72
Unallocated corporate capital expenditure 235.87
TotalTotalTotalTotalTotal 487.59487.59487.59487.59487.59
Significant non-cash adjustmentsSignificant non-cash adjustmentsSignificant non-cash adjustmentsSignificant non-cash adjustmentsSignificant non-cash adjustments
Depreciation 157.44 38.83 196.27
Unallocated corporate depreciation 21.60
TotalTotalTotalTotalTotal 217.87217.87217.87217.87217.87
Provision for doubtful debts/ advances and bad debts/ advances written off 0.28
Schedules forming part of the accounts
(All amounts in crores of rupees except share data and unless otherwise stated)
Schedule 16: Significant accounting policies and notes to the accounts (Contd.)
b) Segment revenue and expenses
Segment revenue is directly attributable to the segment and segment expenses have been allocated to various segmen
on the basis of specific identification. However, segment revenue does not include miscellaneous income, incom
from investments and other income. Segment expenses do not include premium amortized on bonds, diminutio
allowance in respect of current and trade investments, permanent diminution in case of long term investment, charg
taken for stock options issued to employees, corporate expenses and finance cost.
Financial information about the business segments for the year ended 30 June 2008 is as follows:

8/7/2019 Indian_GAAP_07-08
http://slidepdf.com/reader/full/indiangaap07-08 72/125
71
IT services Business process Total
outsourcing services
Segment RevenuesSegment RevenuesSegment RevenuesSegment RevenuesSegment Revenues 3,240.84 527.78 3,768.623,768.623,768.623,768.623,768.62
Segment resultsSegment resultsSegment resultsSegment resultsSegment results 798.52 114.53 913.05913.05913.05913.05913.05
Unallocated corporate expenses (174.78)
Other Income 439.42
Net profit before taxesNet profit before taxesNet profit before taxesNet profit before taxesNet profit before taxes 1,177.691,177.691,177.691,177.691,177.69
Income tax 75.87
Net profit after taxesNet profit after taxesNet profit after taxesNet profit after taxesNet profit after taxes 1,101.821,101.821,101.821,101.821,101.82
AssetsAssetsAssetsAssetsAssets
Segment assets 1,829.22 309.45 2,138.67
Unallocated assets 2,645.65
Total assetsTotal assetsTotal assetsTotal assetsTotal assets 4,784.324,784.324,784.324,784.324,784.32
LiabilitiesLiabilitiesLiabilitiesLiabilitiesLiabilities
Segment liabilities 1,044.16 65.37 1,109.53
Unallocated liabilities 249.77
Total liabilitiesTotal liabilitiesTotal liabilitiesTotal liabilitiesTotal liabilities 1,359.301,359.301,359.301,359.301,359.30OthersOthersOthersOthersOthers
Capital expenditure (including capital work in progress) 321.54 39.78 361.32
Unallocated corporate capital expenditure 12.45
TotalTotalTotalTotalTotal 373.77373.77373.77373.77373.77
Significant non-cash adjustmentsSignificant non-cash adjustmentsSignificant non-cash adjustmentsSignificant non-cash adjustmentsSignificant non-cash adjustments
Depreciation 126.43 41.91 168.34
Unallocated corporate depreciation 9.87
TotalTotalTotalTotalTotal 178.21178.21178.21178.21178.21
Provision for doubtful debts/ advances and bad debts/ advances written off 2.31 1.31 3.62
Revenue from the geographic segments based on domicile of the customer is as follows:
Year ended Year ended
30 June 2008 30 June 2007America 2,780.67 2,280.21
Europe 1,423.62 1,150.17
Others 411.10 338.24
4,615.394,615.394,615.394,615.394,615.39 3,768.623,768.623,768.623,768.623,768.62
Substantial portion of the total assets of the Company are in the India geography. Assets used in the Company’s business hav
not been identified to any of the geographic segments, as the assets are used interchangeably between the segments.
5. Related party transactions
a) Related parties where control exists
Subsidiaries
HCL America Inc., United States of America
HCL Great Britain Limited, United KingdomHCL (Netherlands) BV, Netherlands
HCL GmbH, Germany
HCL Belgium NV, Belgium
HCL Sweden AB, Sweden
HCL Italy SLR, Italy
HCL Australia Services Pty. Limited, Australia
HCL (New Zealand) Limited, New Zealand
HCL Hong Kong SAR Limited, Hong Kong
HCL Japan Limited, Japan
HCL Comnet Systems and Services Limited, India
Financial information about the business segments for the year ended 30 June 2007 is as follows:
Schedules forming part of the accounts
(All amounts in crores of rupees except share data and unless otherwise stated)
Schedule 16: Significant accounting policies and notes to the accounts (Contd.)

8/7/2019 Indian_GAAP_07-08
http://slidepdf.com/reader/full/indiangaap07-08 73/125
72
HCL Comnet Limited, IndiaHCL Bermuda Limited, BermudaHCL Holdings GmbH, AustriaHCL Enterprise Solutions Limited, MauritiusIntelicent India Limited, IndiaDSI Financial Solutions Pte. Limited, Singapore
HCL BPO Services (NI) Limited, Northern IrelandHCL Jones Technologies (Bermuda) Limited, BermudaHCL Jones Technologies LLC, United States of AmericaHCL Singapore Pte. Limited, SingaporeHCL Poland Sp.z.o.o., PolandHCL (Malaysia) Sdn. Bhd., MalaysiaHCL EAI Services Inc., United States of AmericaAalayance (UK) Limited, United KingdomHCL EAI Services Limited, IndiaHCL Technoparks Limited, IndiaHCL Technologies (Shanghai) Limited, ShanghaiCapital Stream Inc. , United States of America** w.e.f. 15th Feb 2008
Others
HCL Technologies Limited Employees Trust
b) Related parties with whom transactions have taken place during the year
Subsidiaries
HCL America Inc., United States of AmericaHCL Great Britain Limited, United KingdomHCL (Netherlands) BV, NetherlandsHCL GmbH, GermanyHCL Belgium NV, BelgiumHCL Sweden AB, SwedenHCL Australia Services Pty. Limited, AustraliaHCL (New Zealand) Limited, New ZealandHCL Hong Kong SAR Limited, Hong KongHCL Comnet Systems and Services Limited, IndiaHCL Comnet Limited, IndiaHCL Bermuda Limited, BermudaIntelicent India Limited, IndiaHCL Jones Technologies (Bermuda) Limited, BermudaHCL Singapore Pte. Limited, SingaporeHCL (Malaysia) Sdn. Bhd., MalaysiaHCL EAI Services Limited, IndiaHCL Technoparks Limited, IndiaHCL BPO Services (NI) Limited, Northern IrelandHCL Technologies (Shanghai) Limited, ShanghaiHCL Poland Sp.z.o.o., PolandHCL EAI Services Inc., United States of America
Jointly controlled entities
NEC HCL System Technologies Limited
Others (Significant influence)
HCL Corporation Limited*HCL Infosystems Limited**HCL Peripherals Limited**HCL Technologies Limited Employees Trust
* Holding Company till 27 March 2007** Fellow subsidiary till 27 March 2007
c) Key Management Personnel
Shiv Nadar, Chairman and Chief Strategy Officer
Schedules forming part of the accounts
(All amounts in crores of rupees except share data and unless otherwise stated)
Schedule 16: Significant accounting policies and notes to the accounts (Contd.)

8/7/2019 Indian_GAAP_07-08
http://slidepdf.com/reader/full/indiangaap07-08 74/125
73
d) Transactions with related parties during the year in the ordinary course of business
Particulars Subsidiaries Fellow Jointly controlled Others - Significant Total
subsidiaries entities Influence
Year ended Year ended Year ended Year ended Year ended
30 June 30 June 30 June 30 June 30 June
2008 2007 2008 2007 2008 2007 2008 2007 2008 200
Sale of materials and services 2,294.06 1,916.91 - - 1.63 1.33 6.35 5.69 2,302.04 1,923.
Purchase of materials and services 719.91 561.64 - 0.21 0.02 - 23.75 27.00 743.68 588.
Payment for use of facilities 2.51 0.75 - 0.50 0.18 - 1.62 0.95 4.31 2.2
Receipt for use of facilities 2.37 2.08 - - - - - - 2.37 2.0
Dividend income 0.45 0.45 - - - - - - 0.45 0.4
Interest Paid 6.48 8.34 - - - - - - 6.48 8.3
Other receipts 9.74 2.56 - - 1.62 1.57 - - 11.36 4.1
Investments 2.77 - - - - - - - 2.77
Loans (net of repayments) 0.65 0.05 - - - - - - 0.65 0.0
Purchase of capital equipments 3.01 0.37 - 0.67 - - 34.27 47.27 37.28 48.3
Bad debts/advances written off - - - - - - - 0.23 - 0.2
Guarantees (54.16) 2.81 - - - - - - (54.16) 2.8
Others(if any) - - - - - - - - -
e) Outstanding balances with related parties
Particulars Subsidiaries Fellow Jointly controlled Others - Significant Total
subsidiaries entities Influence
As at As at As at As at As at
30 June 30 June 30 June 30 June 30 June
2008 2007 2008 2007 2008 2007 2008 2007 2008 200
Debtors 489.36 390.15 - - 0.25 0.74 2.65 1.22 492.26 392.
Short Term Loans outstanding 16.35 15.70 - - - - 0.03 0.03 16.38 15.7
Other receivables 244.54 229.60 - 0.04 0.15 0.26 4.68 2.74 249.37 232.
Creditors 569.42 568.10 - 0.01 - - 5.13 10.16 574.55 578.2
Advance received 13.32 64.46 - - - - - - 13.32 64.4
Unearned revenue 6.15 35.41 - - - - 0.60 0.54 6.75 35.9
6. Loans and advances in the nature of loans to subsidiaries and others
Name of the company Amount of loan Rate of Interest Maximum amount outstanding
during the year HCL Technologies Limited Employees Trust - - 0.02
(0.02) (-) (0.02)
HCL EAI Services Limited 0.55 9% 0.55
(0.55) (9%) (0.57)
HCL Technoparks Limited 15.80 - 15.80
(15.15) (-) (15.15)
Schedules forming part of the accounts
(All amounts in crores of rupees except share data and unless otherwise stated)
Schedule 16: Significant accounting policies and notes to the accounts (Contd.)
Previous year figures are given in brackets.

8/7/2019 Indian_GAAP_07-08
http://slidepdf.com/reader/full/indiangaap07-08 75/125
74
7. Components of Deferred Tax Assets
As at As at30 June 2008 30 June 2007
Carry forward long term capital loss - 1.60
Depreciation 42.14 28.24
Accrued employee costs 19.68 -
Unrealised loss on derivative instruments 78.78 -
140.60140.60140.60140.60140.60 29.8429.8429.8429.8429.84
8. Research and Development Expenditure
Year ended Year ended
30 June 2008 30 June 2007
Revenue 19.44 12.07
Capital - -19.4419.4419.4419.4419.44 12.0712.0712.0712.0712.07
9. Closing Balance and Maximum balances outstanding with non scheduled banks are as follows:
Closing Balance Maximum Balance
As at As at Year ended Year ended
30 June 2008 30 June 2007 30 June 2008 30 June 2007
Non-scheduled banksNon-scheduled banksNon-scheduled banksNon-scheduled banksNon-scheduled banks
- On Current account- On Current account- On Current account- On Current account- On Current account
Citi Bank N.A. Singapore -SGD 0.23 0.19 0.23 0.21
Citi Bank N.A. Singapore -USD 0.22 0.21 0.22 0.24
Deutsche Bank, France -Euro 0.03 0.03 0.04 0.04
Deutsche Bank, Singapore -SGD 0.76 1.53 1.71 2.73Bank of America, New York -USD 0.06 0.05 0.22 0.31
Deutsche Bank, London -GBP 0.03 1.11 1.35 2.64
Banker Trust, New York -USD 2.33 - 4.25 0.44
Deutsche Bank, New York -USD - 1.98 1.98 2.47
TotalTotalTotalTotalTotal 3.663.663.663.663.66 5.105.105.105.105.10
Schedules forming part of the accounts
(All amounts in crores of rupees except share data and unless otherwise stated)
Schedule 16: Significant accounting policies and notes to the accounts (Contd.)
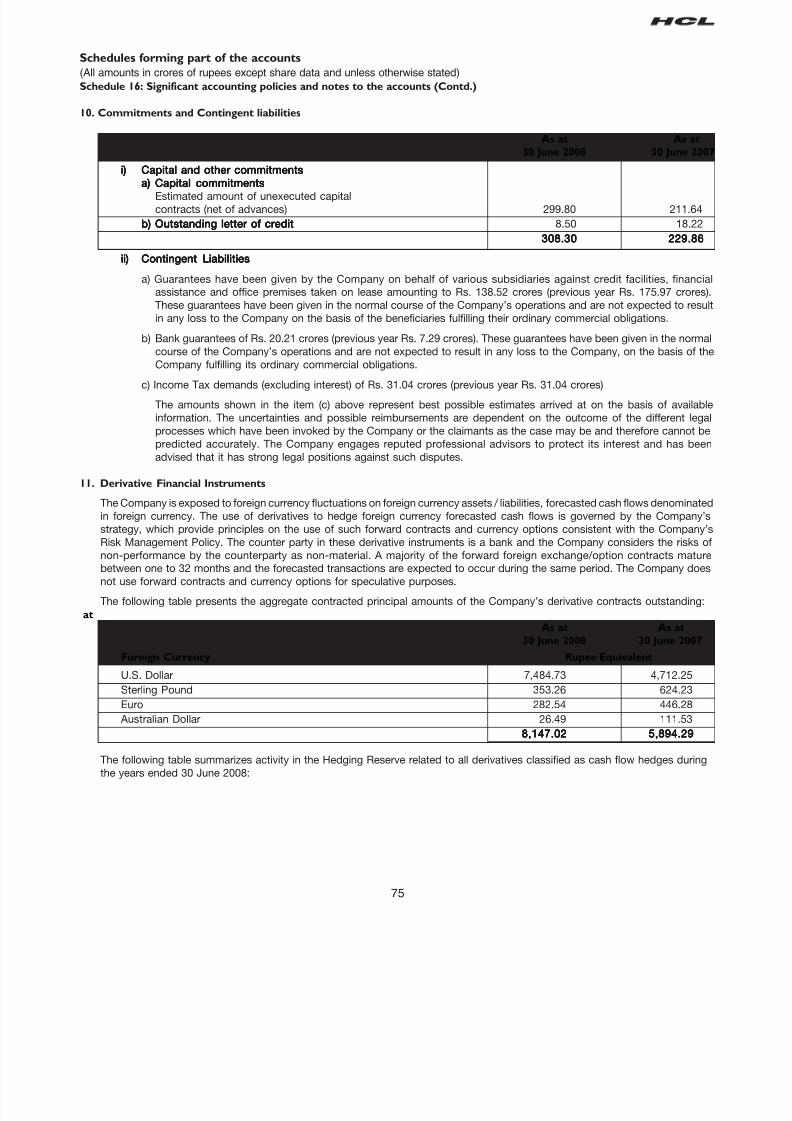
8/7/2019 Indian_GAAP_07-08
http://slidepdf.com/reader/full/indiangaap07-08 76/125
75
10. Commitments and Contingent liabilities
As at As at
30 June 2008 30 June 200
i)i)i)i)i) Capital and other commitmentsCapital and other commitmentsCapital and other commitmentsCapital and other commitmentsCapital and other commitments
a)a)a)a)a) Capital commitmentsCapital commitmentsCapital commitmentsCapital commitmentsCapital commitmentsEstimated amount of unexecuted capital
contracts (net of advances) 299.80 211.64
b)b)b)b)b) Outstanding letter of creditOutstanding letter of creditOutstanding letter of creditOutstanding letter of creditOutstanding letter of credit 8.50 18.22
308.30308.30308.30308.30308.30 229.86229.86229.86229.86229.86
ii)ii)ii)ii)ii) Contingent LiabilitiesContingent LiabilitiesContingent LiabilitiesContingent LiabilitiesContingent Liabilities
a) Guarantees have been given by the Company on behalf of various subsidiaries against credit facilities, financi
assistance and office premises taken on lease amounting to Rs. 138.52 crores (previous year Rs. 175.97 crores
These guarantees have been given in the normal course of the Company’s operations and are not expected to resu
in any loss to the Company on the basis of the beneficiaries fulfilling their ordinary commercial obligations.
b) Bank guarantees of Rs. 20.21 crores (previous year Rs. 7.29 crores). These guarantees have been given in the norm
course of the Company’s operations and are not expected to result in any loss to the Company, on the basis of th
Company fulfilling its ordinary commercial obligations.
c) Income Tax demands (excluding interest) of Rs. 31.04 crores (previous year Rs. 31.04 crores)
The amounts shown in the item (c) above represent best possible estimates arrived at on the basis of availab
information. The uncertainties and possible reimbursements are dependent on the outcome of the different lega
processes which have been invoked by the Company or the claimants as the case may be and therefore cannot b
predicted accurately. The Company engages reputed professional advisors to protect its interest and has bee
advised that it has strong legal positions against such disputes.
11. Derivative Financial Instruments
The Company is exposed to foreign currency fluctuations on foreign currency assets / liabilities, forecasted cash flows denominate
in foreign currency. The use of derivatives to hedge foreign currency forecasted cash flows is governed by the Company’
strategy, which provide principles on the use of such forward contracts and currency options consistent with the Company
Risk Management Policy. The counter party in these derivative instruments is a bank and the Company considers the risks onon-performance by the counterparty as non-material. A majority of the forward foreign exchange/option contracts matur
between one to 32 months and the forecasted transactions are expected to occur during the same period. The Company doe
not use forward contracts and currency options for speculative purposes.
The following table presents the aggregate contracted principal amounts of the Company’s derivative contracts outstanding:
at
As at As at
30 June 2008 30 June 2007
Foreign Currency Rupee Equivalent
U.S. Dollar 7,484.73 4,712.25
Sterling Pound 353.26 624.23
Euro 282.54 446.28
Australian Dollar 26.49 111.53
8,147.028,147.028,147.028,147.028,147.02 5,894.295,894.295,894.295,894.295,894.29
The following table summarizes activity in the Hedging Reserve related to all derivatives classified as cash flow hedges during
the years ended 30 June 2008:
Schedules forming part of the accounts
(All amounts in crores of rupees except share data and unless otherwise stated)
Schedule 16: Significant accounting policies and notes to the accounts (Contd.)

8/7/2019 Indian_GAAP_07-08
http://slidepdf.com/reader/full/indiangaap07-08 77/125
76
Particulars Year ended Year ended
30 June 2008 30 June 2007
Balance as at the beginning of the year - -
Unrealized gain/ (losses) on cash flow hedging derivatives during the year (418.01) -
Net gains / (losses) reclassified into net income on occurrence of hedged (72.62) -transactions
Balance as at the end of the year (490.63) -
Deferred tax 78.78 -
(411.85) -
At 30 June 2008, the estimated net amount of existing gains/ (loss) that is expected to be reclassified into the income statemen
within the next twelve months is Rs. (78.72) crores.
12. The details of investments in mutual funds/ bonds and their movements during the year are provided below:
Schedules forming part of the accounts
(All amounts in crores of rupees except share data and unless otherwise stated)
Schedule 16: Significant accounting policies and notes to the accounts (Contd.)
i) Details of Investments in bonds - Other than trade and unquoted
Face Value Balance as at Balance as at Balance as at Balance as at
Particulars 30 June 2008 30 June 2008 30 June 2007 30 June 2007
Units Amount Units Amount
National Housing Bonds 5.5% 10,000 3,000 3.00 3,000 3.00
Rural Electrification Corporation Limited 5.5% 10,000 3,000 3.00 3,000 3.00
National Highway Authority Of India 5.65% 10,000 3,000 3.00 3,000 3.00
SIDBI Capital Gains bond 5.5% 10,000 3,000 3.00 3,000 3.00
TotalTotalTotalTotalTotal 12.0012.0012.0012.0012.00 12.0012.0012.0012.0012.00
ii) Details of Investments in mutual funds - Other than trade and unquoted-Long Term
Face Value Balance as at Balance as at Balance as at Balance as at
Particulars 30 June 2008 30 June 2008 30 June 2007 30 June 2007
Units Amount Units Amount
ICICI Prudential Institutional Liquid Plan - 10 51,061,355 55.98 92,188,404 101.06
Super Institutional Growth
ABN AMRO FTP Series 3 Yearly Plan growth 10 - - 10,000,000 10.00
ABN AMRO FTP Series 4 -17 mth Institutional Growth 10 - - 10,000,000 10.00
ABN Amro Money Plus Institutional Growth 10 59,209,425 70.43 14,719,243 16.43
Birla FTP - Series O- Growth 10 - - 15,000,000 15.00
CAN Floating Rate Fund Short Term Growth Fund 10 - - 24,848,162 27.00
DSP Merrill Lynch Liquid plus institutional plan growth 1,000 - - 564,141 57.36
DSP ML Strategic Bond Fund-Growth Institutional 1,000 - - 150,000 15.00
DWS Fixed Term Fund - Series 14- Growth Plan 10 - - 25,377,280 25.38
DWS Fixed Term Fund - Series 15 growth Plan 10 - - 10,000,000 10.00
DWS Fixed Term Fund - Series 16 -Institutional Plan 10 - - 10,000,000 10.00
Fidelity Cash Fund -super Institutional-growth 10 80,631,702 84.78 14,470,105 15.00G44 IDFC Floating Rate Fund Institutional Plan 10 58,941,412 69.41 46,659,018 54.56
B LTP Growth
HDFC Cash Management Fund Savings Plan Growth 10 - - 28,640,165 45.00
HDFC FMP 13 M July 2006(1)-Institutional Plan growth 10 - - 15,000,000 15.00
HDFC FMP 16 M December 2006 (2)-Wholesale 10 - - 10,000,000 10.00
Plan Growth
HDFC Liquid -Premium Plus - Growth 10 23,518,959 35.00 23,518,959 35.00
HSBC Cash Fund - Institutional Plus - Growth 10 - - 18,769,775 21.00
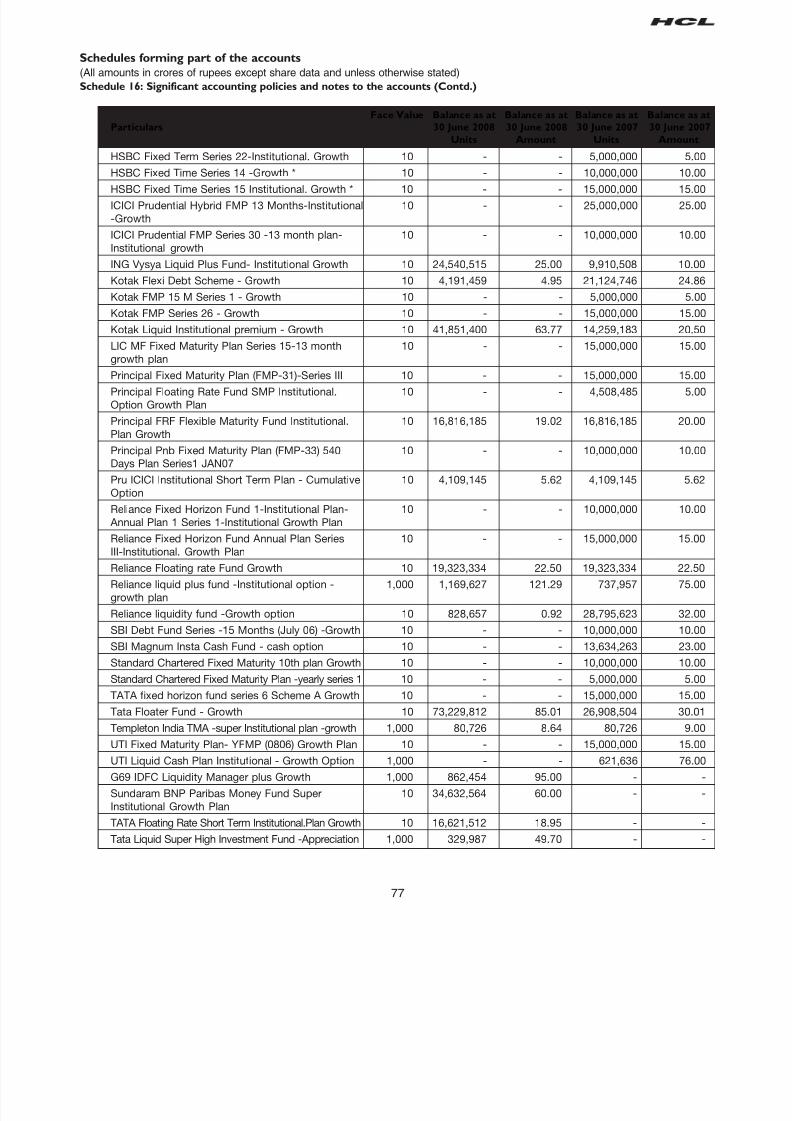
8/7/2019 Indian_GAAP_07-08
http://slidepdf.com/reader/full/indiangaap07-08 78/125
77
Schedules forming part of the accounts
(All amounts in crores of rupees except share data and unless otherwise stated)
Schedule 16: Significant accounting policies and notes to the accounts (Contd.)
HSBC Fixed Term Series 22-Institutional. Growth 10 - - 5,000,000 5.00
HSBC Fixed Time Series 14 -Growth * 10 - - 10,000,000 10.00
HSBC Fixed Time Series 15 Institutional. Growth * 10 - - 15,000,000 15.00
ICICI Prudential Hybrid FMP 13 Months-Institutional 10 - - 25,000,000 25.00
-Growth
ICICI Prudential FMP Series 30 -13 month plan- 10 - - 10,000,000 10.00
Institutional growth
ING Vysya Liquid Plus Fund- Institutional Growth 10 24,540,515 25.00 9,910,508 10.00
Kotak Flexi Debt Scheme - Growth 10 4,191,459 4.95 21,124,746 24.86
Kotak FMP 15 M Series 1 - Growth 10 - - 5,000,000 5.00
Kotak FMP Series 26 - Growth 10 - - 15,000,000 15.00
Kotak Liquid Institutional premium - Growth 10 41,851,400 63.77 14,259,183 20.50
LIC MF Fixed Maturity Plan Series 15-13 month 10 - - 15,000,000 15.00
growth planPrincipal Fixed Maturity Plan (FMP-31)-Series III 10 - - 15,000,000 15.00
Principal Floating Rate Fund SMP Institutional. 10 - - 4,508,485 5.00
Option Growth Plan
Principal FRF Flexible Maturity Fund Institutional. 10 16,816,185 19.02 16,816,185 20.00
Plan Growth
Principal Pnb Fixed Maturity Plan (FMP-33) 540 10 - - 10,000,000 10.00
Days Plan Series1 JAN07
Pru ICICI Institutional Short Term Plan - Cumulative 10 4,109,145 5.62 4,109,145 5.62
Option
Reliance Fixed Horizon Fund 1-Institutional Plan- 10 - - 10,000,000 10.00
Annual Plan 1 Series 1-Institutional Growth Plan
Reliance Fixed Horizon Fund Annual Plan Series 10 - - 15,000,000 15.00
III-Institutional. Growth Plan
Reliance Floating rate Fund Growth 10 19,323,334 22.50 19,323,334 22.50
Reliance liquid plus fund -Institutional option - 1,000 1,169,627 121.29 737,957 75.00
growth plan
Reliance liquidity fund -Growth option 10 828,657 0.92 28,795,623 32.00
SBI Debt Fund Series -15 Months (July 06) -Growth 10 - - 10,000,000 10.00
SBI Magnum Insta Cash Fund - cash option 10 - - 13,634,263 23.00
Standard Chartered Fixed Maturity 10th plan Growth 10 - - 10,000,000 10.00
Standard Chartered Fixed Maturity Plan -yearly series 1 10 - - 5,000,000 5.00
TATA fixed horizon fund series 6 Scheme A Growth 10 - - 15,000,000 15.00
Tata Floater Fund - Growth 10 73,229,812 85.01 26,908,504 30.01
Templeton India TMA -super Institutional plan -growth 1,000 80,726 8.64 80,726 9.00UTI Fixed Maturity Plan- YFMP (0806) Growth Plan 10 - - 15,000,000 15.00
UTI Liquid Cash Plan Institutional - Growth Option 1,000 - - 621,636 76.00
G69 IDFC Liquidity Manager plus Growth 1,000 862,454 95.00 - -
Sundaram BNP Paribas Money Fund Super 10 34,632,564 60.00 - -
Institutional Growth Plan
TATA Floating Rate Short Term Institutional.Plan Growth 10 16,621,512 18.95 - -
Tata Liquid Super High Investment Fund -Appreciation 1,000 329,987 49.70 - -
Face Value Balance as at Balance as at Balance as at Balance as at
Particulars 30 June 2008 30 June 2008 30 June 2007 30 June 2007
Units Amount Units Amount

8/7/2019 Indian_GAAP_07-08
http://slidepdf.com/reader/full/indiangaap07-08 79/125
78
Schedules forming part of the accounts
(All amounts in crores of rupees except share data and unless otherwise stated)
Schedule 16: Significant accounting policies and notes to the accounts (Contd.)
ICICI Prudential Flexible Income Plan Growth 10 65,139,833 95.40 - -
Birla Cash Plus Institutional Prem.- Growth 10 57,596,916 75.00 - -
UTI Fixed Maturity Plan - (YFMP 06/08)- 10 10,000,000 10.00 - -
Institutional Dividend Plan -Re investment
DSPML FMP- 12 M -Series 1 Growth 10 10,000,000 10.00 - -
TotalTotalTotalTotalTotal 1,086.371,086.371,086.371,086.371,086.37 1,051.281,051.281,051.281,051.281,051.28
Less: Dimunition in the value of Investment - -
TotalTotalTotalTotalTotal 1,086.371,086.371,086.371,086.371,086.37 1,051.281,051.281,051.281,051.281,051.28
iii) Details of Investments in mutual funds - Other than trade and unquoted - Current Investments
Face Value Balance as at Balance as at Balance as at Balance as at
Particulars 30 June 2008 30 June 2008 30 June 2007 30 June 2007
Units Amount Units Amount
Birla Cash Plus Institutional Premium Plan Growth 10 - - 46,682,851 48.08
Birla Fixed Maturity Plan Annual Series 3 Nov. 05 Growth 10 - - 9,347,105 10.00
CAN Floating Rate Fund Short Term Growth Fund 10 - - 20,400,851 22.00
DSP Merrill Lynch Liquid plus institutional plan daily 1,000 - - 100,157 10.02
dividend
DSP Merrill Lynch Liquidity Fund Institutional Plan 1,000 - - 100,045 10.01
Daily Dividend
DSP Merrill Lynch Liquidity Fund IP- Growth 1,000 - - 193,619 20.00
HDFC Cash Management Fund - Savings Plus Plan 10 - - 534,860 0.79
Growth
HDFC FMP 13 M JUNE 2006(1)-Institutional Plan 10 - - 15,000,000 15.00
growth
HSBC Fixed Time Series IX 370 Days Growth * 10 - - 15,000,000 15.00
HSBC Fixed Time Series VI Growth * 10 - - 10,000,000 10.00
ING Vysya Liquid Fund Super Institutional Plan 10 21,245,416 22.38 33,718,391 35.51
Growth Option
JM Equity and Derivative Plan Growth 10 - - 9,530,091 10.00
Principal Cash Management Fund Liquid Option 10 - - 16,320,578 18.00
Institutional Premium Plan Growth
Principal Floating Rate Fund SMP Institutional. 10 - - 5,458,565 5.57
Option Growth Plan
Principal FRF Flexible Maturity Fund Institutional. 10 11,039,567 12.48 11,039,567 11.50
Plan Growth
Principal Income Fund STP Institutional Plan - 10 - - 4,096,279 4.71
Growth
SBI FMP MDFS 13 Months June 2006 10 - - 10,000,000 10.00
Tata Fixed Horizon Fund Series 2 - Plan C 18 10 - - 15,000,000 15.00
months Growth
TATA Fixed Horizon Fund Series 3 scheme F Growth * 10 - - 15,000,000 15.00
TATA Fixed Horizon Fund Series 3 Scheme G Growth 10 - - 15,000,000 15.00
TATA Floating Rate Short Term Institutional.Plan 10 - - 11,413,752 11.95
Growth
Templeton India TMA -super Institutional plan-growth 1,000 - - 143,476 15.01
Face Value Balance as at Balance as at Balance as at Balance as at
Particulars 30 June 2008 30 June 2008 30 June 2007 30 June 2007
Units Amount Units Amount

8/7/2019 Indian_GAAP_07-08
http://slidepdf.com/reader/full/indiangaap07-08 80/125
79
Face Value Balance as at Balance as at Balance as at Balance as at
Particulars 30 June 2008 30 June 2008 30 June 2007 30 June 2007
Units Amount Units Amount
Schedules forming part of the accounts
(All amounts in crores of rupees except share data and unless otherwise stated)
Schedule 16: Significant accounting policies and notes to the accounts (Contd.)
UTI Fixed Maturity Plan- YFMP (0606) Growth Plan 10 - - 15,000,000 15.00
UTI Fixed Term Income fund Series -Plan 18- Growth 10 - - 15,000,000 15.00
UTI Spread Fund -Dividend Plan Reinvestment 10 5,373,800 5.40 5,000,000 5.00
ABN Amro Money Plus Institutional Plan Daily dividend 10 - - - -
AIG India Liquid Fund Super IP -Daily dividend 1,000 - - - -
Birla Cash Plus - Institutional premium Plan Daily 10 1,497,380 1.50 - -Dividend
Fidelity Cash Fund -super inst-Daily dividend 10 - - - -
Grindlays Floating Rate Fund -LT-Inst Plan B-daily 10 - - - -dividend
JM High Liquidity Fund-Super IP Plan - daily Divd. 10 - - - -
JM Money Manager Fund Super Plus Plan-daily 10 - - - -dividend
Kotak Liquid inst premium - daily dividend 10 - - - -
Principal Floating Rate Fund SMP - Institutional 10 - - - -Plan daily dividend
Reliance liquid plus fund-inst option -Daily dividend 1,000 - - - -
Reliance liquidity fund -daily dividend 10 - - - -
SBI Premier Liquid Fund Super inst -Daily Dividend 10 - - - -
SBI -SHF -Liquid Plus Inst. Plan -daily dividend 10 - - - -
G70 IDFC Liquidity Manager plus Daily Dividend 1,000 - - - -
Sundaram BNP Paribas Money Fund Super Inst 10 - - - -Daily Div Rein
Tata Floater Fund - Daily dividend 10 - - - -
Tata Floating Rate Short Term Fund Inst Plan Daily 10 - - - -Dividend
Tata Liquid Super High Investment Fund -daily 1,000 18,035 2.01 - -dividend
UTI Liquid Cash Plan Institutional Daily Income Option 1,000 - - - -
ICICI Prudential Flexible Income Plan Dividend Daily 10 - - - -
IDFC Fixed Maturity Plan -Quarterly Series 36-Dividend 10 10,000,000 10.00 - -
ABN Amro Interval Fund Series 2 Quarterly Plan M 10 10,000,000 10.00 - -Interval Dividend
DSPML FMP- 3M Series10 -Div 10 10,000,000 10.00 - -
DWS Quarterly Interval Fund - Series 1- 10 10,000,000 10.00 - -Dividend Plan
JM Interval Fund -Quarterly Plan 1-Inst Dividend Plan 10 10,000,000 10.00 - -
Kotak Quarterly Interval Plan Series 2-Dividend 10 9,996,801 10.00 - -
Reliance Fixed Horizon Fund VIII Series 7 - 10 10,000,000 10.00 - -Institutional Dividend Payout Plan
UTI Fixed Income Interval Fund -Monthly Interval 10 20,000,000 20.00 - -Plan Series -1-Institutional Dividend Plan -Payout
TotalTotalTotalTotalTotal 133.77133.77133.77133.77133.77 363.15363.15363.15363.15363.15
Less: Dimunition in the value of Investment - -
TotalTotalTotalTotalTotal 133.77133.77133.77133.77133.77 363.15363.15363.15363.15363.15
Note:Note:Note:Note:Note:
*These units have been pledged in favour of HSBC Banking Corporation Limited in consideration of financial arrangement
however no facility has been availed as on date.

8/7/2019 Indian_GAAP_07-08
http://slidepdf.com/reader/full/indiangaap07-08 81/125
80
iv) Details of units of mutual funds & bonds purchased and redeemed/ sold during the year
Particulars Face Purchased Sale/ Redemption Proceed
Value During the Year During the Year
Units Amount Units Amount
ICICI Prudential Flexible Income Plan Dividend Daily 10 123,478,855 130.56 123,478,855 130.56
ICICI Prudential Flexible Income Plan Growth 10 65,139,833 95.40 - -
ABN Amro Money Plus Institutional Growth 10 44,490,182 54.00 - -
ABN Amro Money Plus Institutional Plan Daily dividend 10 50,063,819 50.06 50,063,819 50.06
AIG India Liquid Fund Super IP -Daily dividend 1,000 350,511 35.08 350,511 35.08
Birla Cash Plus - Institutional premium Plan Daily 10 310,002,727 310.61 308,505,347 309.11
Dividend
Birla Cash Plus Institutional Prem.- Growth 10 57,596,916 75.00 46,682,851 59.29
DSP Merrill Lynch Liquid plus institutional plan 1,000 2,517,204 251.79 2,617,361 261.81
daily dividend
DSP Merrill Lynch Liquidity Fund Institutional Plan 1,000 5,273,211 527.43 5,373,256 537.43
Daily Dividend
Fidelity Cash Fund -super inst-Daily dividend 10 8,009,205 8.01 8,009,205 8.01Fidelity Cash Fund -super inst-growth 10 80,631,702 85.00 14,470,105 16.23
Grindlays Floating Rate Fund -LT-Inst Plan B -daily 10 36,033,546 36.05 36,033,546 36.05
dividend
G44 IDFC Floating Rate Fund-LT-Inst Plan B-Growth 1,000 31,511,063 37.50 19,228,669 24.65
ING Vysya Liquid Plus Fund- Institutional Growth 10 14,630,007 15.00 - -
JM High Liquidity Fund-Super IP Plan - daily Divd. 10 124,935,907 125.14 124,935,907 125.14
JM Money Manager Fund Super Plus Plan-daily 10 100,918,004 100.96 100,918,004 100.96
dividend
Kotak Flexi Debt Scheme - Growth 10 4,177,668 5.00 21,110,956 27.20
Kotak Liquid inst premium - daily dividend 10 60,734,552 74.27 60,734,552 74.27
Kotak Liquid inst premium - Growth 10 41,851,400 65.00 14,259,183 22.86
Principal Floating Rate Fund SMP - Institutional 10 15,018,178 15.02 15,018,178 15.02
Plan daily dividend
Reliance liquid plus fund -inst option -Daily dividend 1,000 462,399 46.29 462,399 46.29
Reliance liquid plus fund -inst option -growth plan 1,000 431,670 46.29 - -
Reliance liquidity fund -daily dividend 10 60,117,416 60.14 60,117,416 60.14
SBI Premier Liquid Fund Super inst -Daily Dividend 10 136,043,644 136.49 136,043,644 136.49
SBI -SHF -Liquid Plus Inst. Plan -daily dividend 10 10,018,132 10.02 10,018,132 10.02
G70 IDFC Liquidity Manager Plus- Daily Dividend 1,000 847,654 84.78 847,654 84.78
Standard Chartered Liquidity Manager plus Growth 10 862,454 95.00 - -
Sundaram BNP Paribas Money Fund Super Inst 10 24,818,354 25.05 24,818,354 25.05
Daily Div Rein
Sundaram BNP Paribas Money Fund Super Inst 10 34,632,564 60.00 - -Growth
Tata Floater Fund - Daily dividend 10 140,217,829 140.72 140,217,829 140.72
Tata Floater Fund - Growth 10 46,321,308 55.00 - -
Tata Floating Rate Short Term Fund Inst Plan Daily 10 26,332,849 26.35 26,332,849 26.35
Dividend
TATA Floating Rate Short Term Inst.Plan Growth 10 16,621,512 20.00 11,413,752 14.20
Tata Liquid Super High Investment Fund -Appreciation 1,000 329,987 49.70 - -
Tata Liquid Super High Investment Fund-daily dividend 1,000 4,133,255 460.66 4,115,220 458.65
Schedules forming part of the accounts
(All amounts in crores of rupees except share data and unless otherwise stated)
Schedule 16: Significant accounting policies and notes to the accounts (Contd.)

8/7/2019 Indian_GAAP_07-08
http://slidepdf.com/reader/full/indiangaap07-08 82/125
81
Particulars Face Purchased Sale/ Redemption Proceed
Value During the Year During the Year
Units Amount Units Amount
UTI Liquid Cash Plan Iistitutional Daily Income Option 1,000 295,299 30.10 295,299 30.10
UTI spread fund -dividend plan reinvestment 10 373,800 0.40 - -
ICICI Prudential Hybrid FMP 13 Months-Institutional 10 - - 25,000,000 27.27
-Growth
ICICI Prudential FMP Series 30 -13 month plan- 10 - - 10,000,000 10.80
Institutional growth
ICICI Prudential Institutional Liquid Plan -super inst. 10 - - 41,127,049 49.00
Growth
ABN AMRO FTP Series 3 Yearly Plan growth 10 - - 10,000,000 10.81
ABN AMRO FTP Series 4 -17 mth Institutional Growth 10 - - 10,000,000 11.19
Birla FMP-Series 3- Annual-Growth 10 - - 9,347,105 11.61
Birla FTP - Series O- Growth 10 - - 15,000,000 16.81
Can Floating Rate Fund Short Term Growth Fund 10 - - 45,249,013 54.72
DSP Merrill Lynch Liquid plus institutional plan growth 1,000 - - 564,141 63.22DSP Merrill Lynch Liquidity Fund IP- Growth 1,000 - - 193,619 21.85
DSP ML Strategic Bond Fund-Growth Institutional 10 - - 150,000 15.95
DWS Fixed Term Fund - Series 14- Growth Plan 10 - - 25,377,280 27.44
DWS Fixed Term Fund - Series 15 growth Plan 10 - - 10,000,000 10.83
DWS Fixed Term Fund - Series 16 -Institutional Plan 10 - - 10,000,000 10.80
HDFC Cash Management Fund - Savings Plus Plan 10 - - 534,860 0.92
Growth
HDFC FMP 13 M July 2006(1)-Institutional Plan growth 10 - - 15,000,000 16.28
HDFC FMP 13 M June 2006(1)-Institutional Plan growth 10 - - 15,000,000 16.23
HDFC FMP 16 M December 2006 (2)-Wholesale 10 - - 10,000,000 11.16
Plan Growth
HSBC cash fund -institutional plus growth 10 - - 18,769,775 23.48
HSBC Fixed Term Series 22-Inst. Growth 10 - - 5,000,000 5.58
HSBC Fixed Time Series 14 -Growth 10 - - 10,000,000 10.81
HSBC Fixed Time Series -6- Growth 10 - - 10,000,000 11.26
HSBC Fixed Time Series 9-Growth 10 - - 15,000,000 16.20
HSBC Fixed Time Series15 Inst. Growth 10 - - 15,000,000 16.25
ING Vysya Liquid Fund Super Institutional - 10 - - 12,472,975 15.00
Growth Option
JM Equity & Derivative Fund Growth Option 10 - - 9,530,091 11.21
Kotak FMP 15 M Series 1 - Growth 10 - - 5,000,000 5.51
Kotak FMP Series 26 - Growth 10 - - 15,000,000 16.47
LIC MF Fixed Maturity Plan Series 15-13 month 10 - - 15,000,000 16.36growth plan
Principal Cash Management Fund Liquid Option 10 - - 16,320,578 20.19
Institutional prem. Plan -Growth
Principal Fixed Maturity Plan (FMP-31)-Series III 10 - - 15,000,000 16.31
Principal Floating Rate Fund SMP Inst. Option 10 - - 9,967,050 12.37
Growth Plan
Principal Income Fund Short Term Instl Plan Growth 10 - - 4,096,279 5.65
Principal Pnb Fixed Maturity Plan (FMP-33) 540 10 - - 10,000,000 10.25
Days Plan Series1 JAN07
Schedules forming part of the accounts
(All amounts in crores of rupees except share data and unless otherwise stated)
Schedule 16: Significant accounting policies and notes to the accounts (Contd.)

8/7/2019 Indian_GAAP_07-08
http://slidepdf.com/reader/full/indiangaap07-08 83/125
82
Reliance Fixed Horizon Fund 1-Institutional Plan- 10 - - 10,000,000 10.84
Annual Plan 1 Series 1-Institutional Growth Plan
Reliance Fixed Horizon Fund Annual Plan Series 10 - - 15,000,000 16.36
III-Inst. Growth Plan
SBI Debt Fund Series -13 Months (June06) -Growth 10 - - 10,000,000 10.81
SBI Debt Fund Series -15 Months (July 06) -Growth 10 - - 10,000,000 10.99
SBI Magnum Insta Cash Fund - cash option 10 - - 13,634,263 25.02
Standard Chartered Fixed Maturity 10th plan Growth 10 - - 10,000,000 10.92
Standard Chartered Fixed Maturity Plan -yearly series 1 10 - - 5,000,000 5.42
Tata Fixed Horizon Fund Series 2 - Plan C 18 10 - - 15,000,000 16.50
months Growth
TATA Fixed Horizon Fund Series 3 scheme 10 - - 15,000,000 16.85
F 18 months Growth
TATA Fixed Horizon Fund Series 3 scheme G Growth 10 - - 15,000,000 16.94TATA fixed horizon fund series 6 Scheme A Growth 10 - - 15,000,000 16.29
Templeton India Treausry management account 1,000 - - 143,476 16.85
Super Institutional Plan-Growth
UTI Fixed Maturity Plan- YFMP (0606) Growth Plan 10 - - 15,000,000 16.22
UTI Fixed Maturity Plan- YFMP (0806) Growth Plan 10 - - 15,000,000 16.23
UTI Fixed Term Income fund series 1 -plan 18-Q4 10 - - 15,000,000 16.63
growth Plan
UTI Liquid Cash Plan Institutional -growth option 1,000 - - 621,636 82.79
Reliance liquidity fund -Growth option 10 - - 27,966,966 34.00
IDFC Fixed Maturity Plan -Quarterly Series 36-Dividend 10 10,000,000 10.00 - -
ABN Amro Interval Fund Series 2 Quarterly Plan M 10 10,000,000 10.00 - -
Interval DividendDSPML FMP- 12 M -Series 1 Growth 10 10,000,000 10.00 - -
DSPML FMP- 3M Series10 -Div 10 10,000,000 10.00 - -
DWS QUARTERLY INTERVAL FUND -SERIES 1- 10 10,000,000 10.00 - -
Dividend Plan
JM Interval Fund -Quarterly Plan 1-Inst Dividend Plan 10 10,000,000 10.00 - -
Kotak Quarterly Interval Plan Series 2-Dividend 10 9,996,801 10.00 - -
Reliance Fixed Horizon Fund VIII Series 7- 10 10,000,000 10.00 - -
INSTITUTIONAL DIVIDEND PAYOUT PLAN
Reliance Fixed Horizon Fund VIII Series6 -370 10 10,000,000 10.00 - -
days Growth
UTI Fixed Income Interval Fund -Monthly Interval 10 20,000,000 20.00 - -
Plan Series -1-Institutional Dividend Plan -PayoutUTI Fixed Maturity Plan - (YFMP 06/08)- 10 10,000,000 10.00 - -
INSTITUTIONAL DIVIDEND PLAN -Re investment
HDFC Cash Management Fund - Savings Plan Growth 10 28,640,165 49.40
Reliance Fixed Horizon Fund VIII Series6 -370 10 10,000,000 10.00
days Growth
TotalTotalTotalTotalTotal 3,563.873,563.873,563.873,563.873,563.87 3,865.373,865.373,865.373,865.373,865.37
Schedules forming part of the accounts
(All amounts in crores of rupees except share data and unless otherwise stated)
Schedule 16: Significant accounting policies and notes to the accounts (Contd.)
Particulars Face Purchased Sale/ Redemption Proceed
Value During the Year During the Year
Units Amount Units Amount
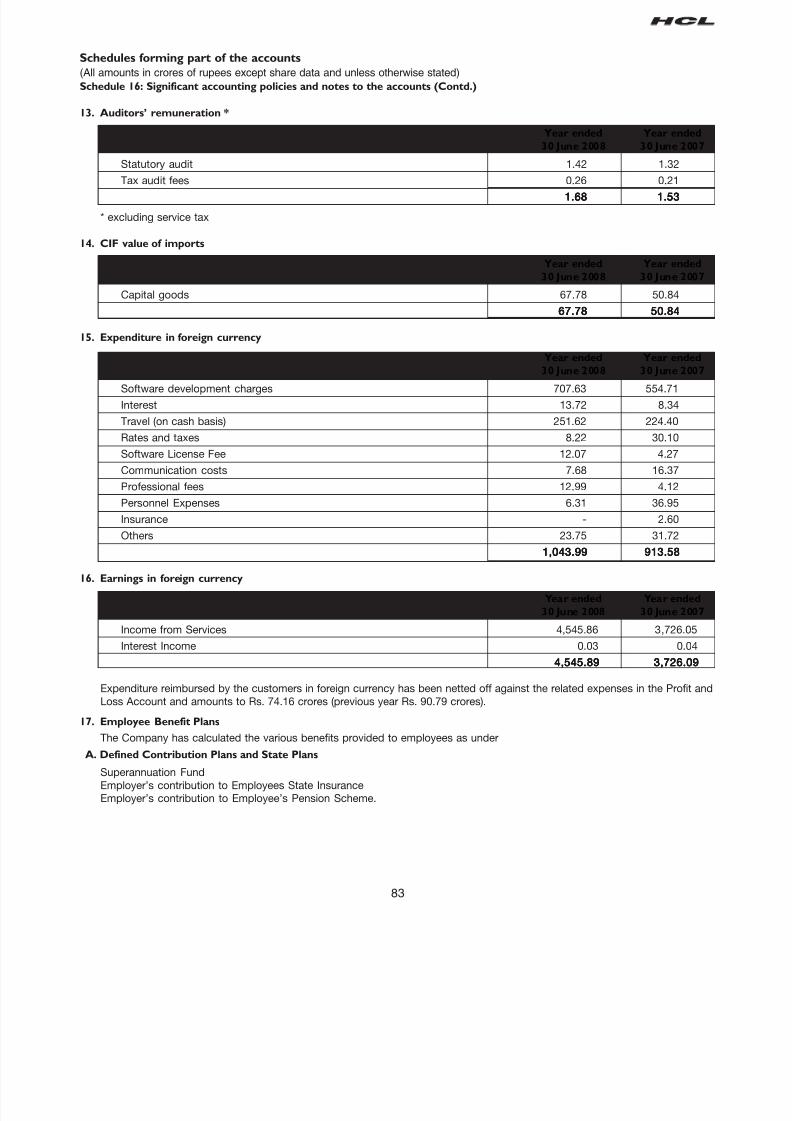
8/7/2019 Indian_GAAP_07-08
http://slidepdf.com/reader/full/indiangaap07-08 84/125
83
Schedules forming part of the accounts
(All amounts in crores of rupees except share data and unless otherwise stated)
Schedule 16: Significant accounting policies and notes to the accounts (Contd.)
13. Auditors’ remuneration *
Year ended Year ended
30 June 2008 30 June 2007
Statutory audit 1.42 1.32
Tax audit fees 0.26 0.211.681.681.681.681.68 1.531.531.531.531.53
* excluding service tax
14. CIF value of imports
Year ended Year ended
30 June 2008 30 June 2007
Capital goods 67.78 50.84
67.7867.7867.7867.7867.78 50.8450.8450.8450.8450.84
15. Expenditure in foreign currency
Year ended Year ended
30 June 2008 30 June 2007
Software development charges 707.63 554.71
Interest 13.72 8.34
Travel (on cash basis) 251.62 224.40
Rates and taxes 8.22 30.10
Software License Fee 12.07 4.27
Communication costs 7.68 16.37
Professional fees 12.99 4.12
Personnel Expenses 6.31 36.95
Insurance - 2.60
Others 23.75 31.72
1,043.991,043.991,043.991,043.991,043.99 913.58913.58913.58913.58913.58
16. Earnings in foreign currency Year ended Year ended
30 June 2008 30 June 2007
Income from Services 4,545.86 3,726.05
Interest Income 0.03 0.04
4,545.894,545.894,545.894,545.894,545.89 3,726.093,726.093,726.093,726.093,726.09
Expenditure reimbursed by the customers in foreign currency has been netted off against the related expenses in the Profit an
Loss Account and amounts to Rs. 74.16 crores (previous year Rs. 90.79 crores).
17. Employee Benefit Plans
The Company has calculated the various benefits provided to employees as under
A. Defined Contribution Plans and State Plans
Superannuation Fund
Employer’s contribution to Employees State Insurance
Employer’s contribution to Employee’s Pension Scheme.

8/7/2019 Indian_GAAP_07-08
http://slidepdf.com/reader/full/indiangaap07-08 85/125
84
Schedules forming part of the accounts
(All amounts in crores of rupees except share data and unless otherwise stated)
Schedule 16: Significant accounting policies and notes to the accounts (Contd.)
During the year the Company has recognized the following amounts in the Profit and Loss account:-
Year ended
30 June 2008
Superannuation Fund 0.93
Employer’s contribution to Employees State Insurance 0.38
Employer’s contribution to Employee’s Pension Scheme. 20.81
B. Defined Benefit Plans
a) Gratuity
b) Employers Contribution to Provident Fund
Gratuity
The following table set out the status of the gratuity plan as required under AS 15 (Revised):
Particulars Year ended
30 June 2008
Defined Benefit obligations at period beginning 38.42Service Cost 9.50
Interest cost 3.53
Actuarial (gain)/loss 5.43
Benefits paid (2.98)
Present value of plan assets -
Defined Benefit obligations at period end 53.9053.9053.9053.9053.90
Liability recognised in the balance sheet 53.9053.9053.9053.9053.90
Expense recognized in Profit and Loss account
Service cost 9.50Interest cost 3.53
Expected return on plan assets -
Actuarial (gain)/loss 5.43
Net gratuity cost 18.4618.4618.4618.4618.46
Experience AdjustmentsExperience AdjustmentsExperience AdjustmentsExperience AdjustmentsExperience Adjustments
Plan Liabilities 4.65
AssumptionsAssumptionsAssumptionsAssumptionsAssumptions
Interest rate 8%
Estimated Rate of salary increases 6%-12%
Employers Contribution to Provident Fund
The Guidance on implementing AS 15 , Employee Benefits (revised 2005) issued by Accounting Standard Board (ASB) states benefi
involving employer established provident funds, which requires interest shortfall to be recompensed are to be considered as define
benefits plans. Pending the issuance of the guidance note from the Actuarial Society of India, the Company’s actuary has expresse
an inability to reliable measure provident fund liabilities. Accordingly the company is unable to exhibit the related information.
During the year ended 30 June 2008, the Company has contributed Rs. 33.92 crores towards Employers’ contribution to the Providen
Fund.
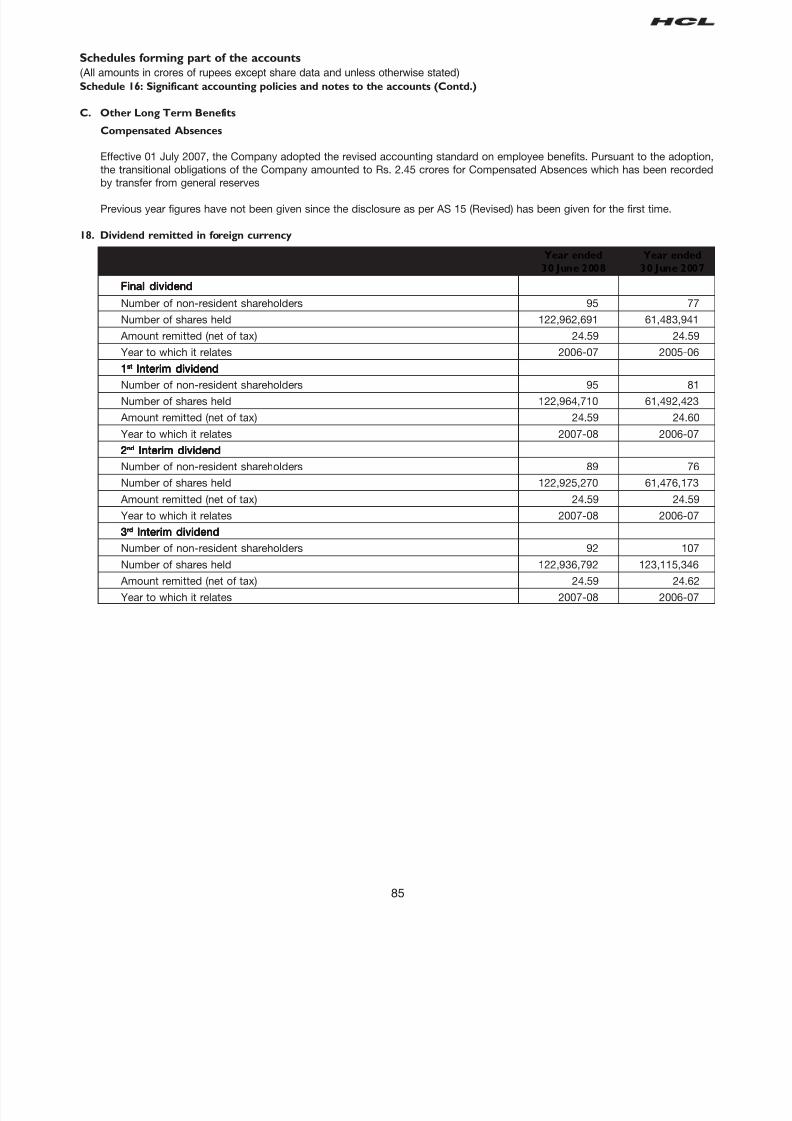
8/7/2019 Indian_GAAP_07-08
http://slidepdf.com/reader/full/indiangaap07-08 86/125
85
Schedules forming part of the accounts
(All amounts in crores of rupees except share data and unless otherwise stated)
Schedule 16: Significant accounting policies and notes to the accounts (Contd.)
C. Other Long Term Benefits
Compensated Absences
Effective 01 July 2007, the Company adopted the revised accounting standard on employee benefits. Pursuant to the adoptio
the transitional obligations of the Company amounted to Rs. 2.45 crores for Compensated Absences which has been recorde
by transfer from general reserves
Previous year figures have not been given since the disclosure as per AS 15 (Revised) has been given for the first time.
18. Dividend remitted in foreign currency
Year ended Year ended
30 June 2008 30 June 2007
Final dividendFinal dividendFinal dividendFinal dividendFinal dividend
Number of non-resident shareholders 95 77
Number of shares held 122,962,691 61,483,941
Amount remitted (net of tax) 24.59 24.59
Year to which it relates 2006-07 2005-06
11111ststststst Interim dividendInterim dividendInterim dividendInterim dividendInterim dividend
Number of non-resident shareholders 95 81
Number of shares held 122,964,710 61,492,423
Amount remitted (net of tax) 24.59 24.60
Year to which it relates 2007-08 2006-07
22222ndndndndnd Interim dividendInterim dividendInterim dividendInterim dividendInterim dividend
Number of non-resident shareholders 89 76
Number of shares held 122,925,270 61,476,173
Amount remitted (net of tax) 24.59 24.59
Year to which it relates 2007-08 2006-07
33333rdrdrdrdrd Interim dividendInterim dividendInterim dividendInterim dividendInterim dividend
Number of non-resident shareholders 92 107
Number of shares held 122,936,792 123,115,346
Amount remitted (net of tax) 24.59 24.62
Year to which it relates 2007-08 2006-07

8/7/2019 Indian_GAAP_07-08
http://slidepdf.com/reader/full/indiangaap07-08 87/125
86
Schedules forming part of the accounts
(All amounts in crores of rupees except share data and unless otherwise stated)
Schedule 16: Significant accounting policies and notes to the accounts (Contd.)
19. Managerial remuneration
a) Computation of Net Profit in accordance with Section 349 of the Companies Act, 1956 and calculation of commissio
payable to non whole-time directors:
Year endedYear endedYear endedYear endedYear ended30 June 200830 June 200830 June 200830 June 200830 June 2008
Profit before Tax as per Profit and Loss AccountProfit before Tax as per Profit and Loss AccountProfit before Tax as per Profit and Loss AccountProfit before Tax as per Profit and Loss AccountProfit before Tax as per Profit and Loss Account 875.25875.25875.25875.25875.25
Add:Add:Add:Add:Add:
Depreciation as per books of accounts 217.87
Provision for doubtful debts/ advances 0.28
Book loss on sale of fixed assets 1.48
Donations 0.09 219.72
Less:Less:Less:Less:Less:
Depreciation under section 350 of the Companies Act, 1956 217.97
Profit on sale of Investments 107.21 325.18
Profit as per section 349Profit as per section 349Profit as per section 349Profit as per section 349Profit as per section 349 769.79769.79769.79769.79769.79Add:Add:Add:Add:Add:
Director’s remuneration 0.75
Profit as per section 198Profit as per section 198Profit as per section 198Profit as per section 198Profit as per section 198 770.54770.54770.54770.54770.54
Commission payable to non whole-time directors:Commission payable to non whole-time directors:Commission payable to non whole-time directors:Commission payable to non whole-time directors:Commission payable to non whole-time directors:
Maximum commission under Section 309 of the Companies Act, 1956 @ 1% 7.71
Commission approved by the boardCommission approved by the boardCommission approved by the boardCommission approved by the boardCommission approved by the board 0.750.750.750.750.75
b) Managerial remuneration comprises:
Year ended Year ended
30 June 2008 30 June 2007
Sitting fees 0.10 0.08Commission to non-executive directors 0.75 0.75
0.850.850.850.850.85 0.830.830.830.830.83
The wholly owned subsidiaries have made the following payments to a director of the Company:
Year ended Year ended
30 June 2008 30 June 2007
Remuneration paid to executive director 3.41 1.39
3.413.413.413.413.41 1.391.391.391.391.39

8/7/2019 Indian_GAAP_07-08
http://slidepdf.com/reader/full/indiangaap07-08 88/125
87
Schedules forming part of the accounts
(All amounts in crores of rupees except share data and unless otherwise stated)
Schedule 16: Significant accounting policies and notes to the accounts (Contd.)
20. Earnings per equity share (EPS)
Year ended Year ended
30 June 2008 30 June 2007
Net profit as per Profit and Loss Account for computation of EPS 780.65 1,101.82
Weighted average number of shares outstanding in computation of basic EPS 664,424,330 652,626,782Dilutive effect of stock options outstanding 20,528,490 24,760,964
Weighted average number of equity shares and equity equivalent shares
outstanding in computing diluted EPS 684,952,820 677,387,746
Nominal value of equity shares (in Rs.) 2 2
Earnings per equity share (in Rs.)
- Basic 11.75 16.88
- Diluted 11.40 16.27
For HCL Technologies LimitedHCL Technologies LimitedHCL Technologies LimitedHCL Technologies LimitedHCL Technologies Limited
Shiv NadarShiv NadarShiv NadarShiv NadarShiv Nadar T S R SubramanianT S R SubramanianT S R SubramanianT S R SubramanianT S R SubramanianChairman and Chief Strategy Officer Director
Vineet NayarVineet NayarVineet NayarVineet NayarVineet Nayar Ranjit NarasimhanRanjit NarasimhanRanjit NarasimhanRanjit NarasimhanRanjit NarasimhanCEO & Wholetime Director President & CEO-BPO Division
Anil ChananaAnil ChananaAnil ChananaAnil ChananaAnil Chanana Manish AnandManish AnandManish AnandManish AnandManish AnandExecutive Vice President - Finance Deputy Company Secretary
Place: Noida (UP), IndiaDate: 01 August 2008
21.21.21.21.21. The company has a comprehensive system of maintenance of information and documents as required by the transfer pricin
legislation under sections 92-92F of the Income Tax Act, 1961. Since the law requires existence of such information an
documentation to be contemporaneous in nature, the company appoints independent consultants for conducting a Transfe
Pricing Study to determine whether the transactions with associate enterprises are undertaken, during the financial year, on a“arms length basis”. Adjustments, if any, arising from the transfer pricing study in the respective jurisdictions shall be accounte
for as and when the study is completed for the current financial year. However the management is of the opinion that its internation
transactions are at arms’ length so that the aforesaid legislation will not have any impact on the financial statements.
22. Micro, Small and Medium Enterprises
As per information available with the management, the dues payable to enterprises covered under “The Micro, Small and Medium
Enterprises Development Act, 2006” are as follows:
Particulars For the year ended For the year ended
30 June 2008 30 June 2007
Principal Interest Principal Interest
Amount due to Vendor - - - -
Principal amount paid beyond the appointed date 0.01 - - -Interest under normal credit terms - - - - -
Accrued during the year - - - -
Unpaid - - - -
Total Interest payable - - - - -
Accrued during the year - - - -
Unpaid - - - -
This has been determined on the basis of responses received from vendors on specific confirmation sought by the Company
this regard.
23.23.23.23.23. The previous year’s figures have been re-classified/re-grouped to conform to current year’s classification.

8/7/2019 Indian_GAAP_07-08
http://slidepdf.com/reader/full/indiangaap07-08 89/125
88
BALANCE SHEET ABSTRACT AND COMPANY’S GENERAL BUSINESS PROFILE
(All amounts in thousands of rupees, unless otherwise stated)
I. Registration details
Registration No. 55-46369 State Code 55
Balance Sheet Date 30 June 2008
II. Capital raised during the year
Public issue Rights issue
Nil NilBonus issue Private placement
Nil 427,495
Note: Capital raised during the year includes share application money.
III. Position of mobilisation and deployment of funds
Total liabilities Total assets
32,401,587 32,401,587
Sources of funds
Paid-up capital Reserves and surplus
1,349,786* 30,798,538
Secured loans Unsecured loans
252,378 886*Includes Rs. 17,105 thousands in respect of share application money.
Application of funds
Net fixed assets Investments
11,443,185** 17,973,412
Net current assets Misc. expenditure
1,579,024 Nil
Accumulated losses Deferred tax
Nil 1,405,966
** Includes Rs. 4,190,275 thousands in respect of capital work-in-progress.
IV. Performance of CompanyTurnover Total expenditure
47,857,912 39,105,403
Profit before tax Profit after tax
8,752,509 7,806,481
Earnings per share (in Rs.) Dividend rate
11.75 (Basic) 450%
11.40 (Diluted)
V. Generic names of Principal Products/Services of Company (as per monetary terms)
Product description: Software
Item code (ITC code): 852490
For HCL Technologies Limited
Shiv Nadar T S R SubramanianChairman and Chief Strategy Officer Director
Vineet Nayar Ranjit NarasimhanCEO & Wholetime Director President & CEO-BPO Division
Anil Chanana Manish AnandExecutive Vice President - Finance Deputy Company Secretary
Place: Noida (UP), IndiaDate: 01 August 2008

8/7/2019 Indian_GAAP_07-08
http://slidepdf.com/reader/full/indiangaap07-08 90/125
Consolidated Statements

8/7/2019 Indian_GAAP_07-08
http://slidepdf.com/reader/full/indiangaap07-08 91/125
90

8/7/2019 Indian_GAAP_07-08
http://slidepdf.com/reader/full/indiangaap07-08 92/125
91
REPORT OF THE AUDITORS TO THE BOARD OF DIRECTORS OF HCL TECHNOLOGIES LIMITED
1.1.1.1.1. We have audited the attached consolidated Balance Sheet
of HCL Technologies Limited ("the Company"), as at 30th
June, 2008, the consolidated Profit and Loss Account for
the year ended on that date annexed thereto, and the
consolidated cash flow statement for the year ended on
that date, which we have signed under reference to this
report. These consolidated financial statements are theresponsibility of the Company's management. Our
responsibility is to express an opinion on these consolidated
financial statements based on our audit.
2.2.2.2.2. We conducted our audit in accordance with auditing
standards generally accepted in India. Those Standards
require that we plan and perform the audit to obtain
reasonable assurance about whether the financial
statements are prepared, in all material respects, in
accordance with an identified financial reporting framework
and are free of material misstatement. An audit includes
examining, on a test basis, evidence supporting the amounts
and disclosures in the financial statements. An audit also
includes assessing the accounting principles used andsignificant estimates made by management, as well as
evaluating the overall financial statement presentation. We
believe that our audit provides a reasonable basis for our
opinion.
3.3.3.3.3. We did not audit the financial statements of certain
consolidated entities whose financial statements reflect total
assets of Rs. 139.83 crores, as at 30th June, 2008 and total
revenues of Rs. 172.64 crores for the year ended on that
date. These financial statements have been audited by other
auditors whose reports have been furnished to us, and our
opinion, in so far as it relates to the amounts included in
respect of these consolidated entities, is based solely on
the report of the other auditors.
4.4.4.4.4. We report that the consolidated financial statements have
been prepared by the Company in accordance with the
requirements of Accounting Standard (AS) 21, Consolidate
Financial Statements and AS 27, Financial Reporting o
Interests in Joint Ventures, issued by the Institute o
Chartered Accountants of India and on the basis of th
separate audited financial statements of the Company an
its consolidated entities included in the consolidate
financial statements.
5.5.5.5.5. On the basis of the information and explanations given
us and on consideration of the separate audit reports o
individual audited financial statements of the Company an
its consolidated entities, in our opinion, the consolidate
financial statements give a true and fair view in conformit
with the accounting principles generally accepted in India
(i) in the case of the consolidated Balance Sheet, of th
consolidated state of affairs of the Company and it
consolidated entities as at 30th June, 2008;
(ii) in the case of the consolidated Profit and Loss Accoun
of the consolidated results of operations of the Companand its consolidated entities for the year ended on tha
date; and
(iii) in the case of the consolidated Cash Flow Statemen
of the consolidated cash flows of the Company and it
consolidated entities for the year ended on that date.
Kaushik DuttaKaushik DuttaKaushik DuttaKaushik DuttaKaushik Dutta
Partner
Membership Number: F – 88540For and on behalf of
Place: Gurgaon, India Price Waterhouse
Date : 01 August 2008 Chartered Accountants

8/7/2019 Indian_GAAP_07-08
http://slidepdf.com/reader/full/indiangaap07-08 93/125
92
Consolidated Balance Sheet as at 30 June 2008
(All amounts in crores of rupees except share data and unless otherwise stated)
As at As at
Schedule 30 June 2008 30 June 2007
Sources of FundsSources of FundsSources of FundsSources of FundsSources of Funds
Shareholders’ fundsShareholders’ fundsShareholders’ fundsShareholders’ fundsShareholders’ funds
Share capital 1 133.27 132.74
Share application money pending allotment 1.71 -
Reserves and surplus 2 4,046.04 3,934.49
4,181.02 4,067.23
Minority interestMinority interestMinority interestMinority interestMinority interest 6.59 16.59
Loan fundsLoan fundsLoan fundsLoan fundsLoan funds
Secured loans 3 47.04 76.74
Unsecured loans 4 7.97 0.12
55.01 76.86
4,242.624,242.624,242.624,242.624,242.62 4,160.684,160.684,160.684,160.684,160.68
Application of fundsApplication of fundsApplication of fundsApplication of fundsApplication of funds
Fixed assetsFixed assetsFixed assetsFixed assetsFixed assets 5
Gross block 2,538.54 1,984.80
Less : Accumulated depreciation (1,410.12) (1,084.12)
Net block 1,128.42 900.68
Capital work-in-progress (including capital advances) 430.25 218.39
1,558.67 1,119.07
InvestmentsInvestmentsInvestmentsInvestmentsInvestments 6 1,376.94 1,553.73
Deferred tax asset (net)Deferred tax asset (net)Deferred tax asset (net)Deferred tax asset (net)Deferred tax asset (net) 19(3) 268.51 85.52
Current assets, loans and advancesCurrent assets, loans and advancesCurrent assets, loans and advancesCurrent assets, loans and advancesCurrent assets, loans and advances
Inventories 7 70.69 37.31
Sundry debtors 8 1,586.36 1,101.10
Cash and bank balances 9 1,011.24 660.67
Loans and advances 10 474.86 312.08
Other current assets 11 456.73 451.52
3,599.88 2,562.68
Less: Current liabilities and provisionsLess: Current liabilities and provisionsLess: Current liabilities and provisionsLess: Current liabilities and provisionsLess: Current liabilities and provisions 12 (2,561.38) (1,160.32)
Net current assetsNet current assetsNet current assetsNet current assetsNet current assets 1,038.50 1,402.36
4,242.624,242.624,242.624,242.624,242.62 4,160.684,160.684,160.684,160.684,160.68
Significant accounting policies and notes to the accounts 19 (0.00) (0.00)
The schedules referred to above form an integral part of the Consolidated Balance Sheet.
This is the Consolidated Balance Sheet referred to in our report of even date.
For HCL Technologies Limited
Kaushik Dutta Shiv Nadar Vineet Nayar T S R Subramanian
Partner Chairman and Chief Strategy Officer CEO & Wholetime Director Director
Membership No.: F-88540For and on behalf of Anil Chanana Ranjit Narasimhan Manish Anand
Price Waterhouse Executive Vice President - Finance President & CEO - BPO Division Deputy Company Secretary
Chartered Accountants
Place: Gurgaon, India Place: Noida (UP), India
Date: 01 August 2008 Date: 01 August 2008

8/7/2019 Indian_GAAP_07-08
http://slidepdf.com/reader/full/indiangaap07-08 94/125
93
Consolidated Profit and Loss Account for the year ended 30 June 2008
(All amounts in crores of rupees except share data and unless otherwise stated)
Year ended Year ended
Schedule 30 June 2008 30 June 2007
IncomeIncomeIncomeIncomeIncome
Sales 13 7,562.78 6,068.74
Other income 14 192.72 455.85
7,755.507,755.507,755.507,755.507,755.50 6,524.596,524.596,524.596,524.596,524.59
ExpenditureExpenditureExpenditureExpenditureExpenditure
Cost of goods sold 15 194.41 190.70
Cost of services 16 3,996.13 3,166.76
Administration and other expenses 17 2,065.56 1,477.29
Finance costs 18 17.70 8.03
Depreciation and amortisation 5 298.84 253.86
6,572.646,572.646,572.646,572.646,572.64 5,096.645,096.645,096.645,096.645,096.64
Profit before tax and minority interestProfit before tax and minority interestProfit before tax and minority interestProfit before tax and minority interestProfit before tax and minority interest 1,182.861,182.861,182.861,182.861,182.86 1,427.951,427.951,427.951,427.951,427.95
Tax Expense - current (170.91) (127.11)
- deferred (net) 66.16 38.98
- fringe benefit (24.28) (15.95)
Profit after tax and before minority interestProfit after tax and before minority interestProfit after tax and before minority interestProfit after tax and before minority interestProfit after tax and before minority interest 1,053.831,053.831,053.831,053.831,053.83 1,323.871,323.871,323.871,323.871,323.87
Share of minority shareholders (2.42) (5.56)
Net Profit after tax and minority interestNet Profit after tax and minority interestNet Profit after tax and minority interestNet Profit after tax and minority interestNet Profit after tax and minority interest 1,051.41 1,318.31Balance in profit and loss account brought forward 2,093.94 1,493.00
Profit available for appropriation 3,145.353,145.353,145.353,145.353,145.35 2,811.312,811.312,811.312,811.312,811.31
AppropriationsAppropriationsAppropriationsAppropriationsAppropriations
Proposed final dividend [including Rs.0.03 crores (previous year 199.94 133.19Rs. 0.45 crores) paid for previous year]
Corporate dividend tax on proposed final dividend [including Rs. 0.01 crores 33.97 22.62(previous year Rs. 0.06 crores) paid for previous year]
Interim dividend 398.64 392.40
Corporate dividend tax on interim dividend 67.75 58.98
Transfer to general reserve 78.06 110.18
Balance carried forward to the Balance SheetBalance carried forward to the Balance SheetBalance carried forward to the Balance SheetBalance carried forward to the Balance SheetBalance carried forward to the Balance Sheet 2,366.99 2,093.94
3,145.353,145.353,145.353,145.353,145.35 2,811.312,811.312,811.312,811.312,811.31
Earnings per equity share (in Rupees)Earnings per equity share (in Rupees)Earnings per equity share (in Rupees)Earnings per equity share (in Rupees)Earnings per equity share (in Rupees)
Basic 15.82 20.20
Diluted 15.35 19.46
Weighted average number of equity shares used in computing earningsWeighted average number of equity shares used in computing earningsWeighted average number of equity shares used in computing earningsWeighted average number of equity shares used in computing earningsWeighted average number of equity shares used in computing earningsper equity shareper equity shareper equity shareper equity shareper equity share 19(9)
Basic 664,424,330 652,626,782
Diluted 684,952,820 677,387,746
Significant accounting policies and notes to the accounts 19
The schedules referred to above form an integral part of the Consolidated Profit and Loss Account.
This is the Consolidated Profit and Loss Account referred to in our report of even date.
For HCL Technologies Limited
Kaushik Dutta Shiv Nadar Vineet Nayar T S R Subramanian
Partner Chairman and Chief Strategy Officer CEO & Wholetime Director Director
Membership No.: F-88540
For and on behalf of Anil Chanana Ranjit Narasimhan Manish Anand
Price Waterhouse Executive Vice President - Finance President & CEO - BPO Division Deputy Company Secretary
Chartered Accountants
Place: Gurgaon, India Place: Noida (UP), India
Date: 01 August 2008 Date: 01 August 2008

8/7/2019 Indian_GAAP_07-08
http://slidepdf.com/reader/full/indiangaap07-08 95/125
94
Consolidated Cash flow statement for the year ended 30 June 2008
(All amounts in crores of rupees except share data and unless otherwise stated)
Year ended Year ended
30 June 2008 30 June 2007
Cash Flows from Operating ActivitiesCash Flows from Operating ActivitiesCash Flows from Operating ActivitiesCash Flows from Operating ActivitiesCash Flows from Operating Activities
Profit before tax 1,182.86 1,427.95
Adjusted for:Adjusted for:Adjusted for:Adjusted for:Adjusted for:
Income from investments and interest (69.40) (22.56)
(Profit)/loss on sale of investments (net) (114.33) (78.49)Depreciation and amortization 298.84 253.86
Finance charge 9.52 1.42
(Profit)/loss on sale of fixed assets 1.59 (0.34)
Amortisation of Stock Compensation 105.04 125.99
Other Non Cash Charges 19.45 12.34
Taxes paid (209.72) (52.33)
Decrease / (increase) in sundry debtors (439.26) (299.96)
Decrease / (increase) in inventories (33.38) (14.18)
Decrease / (increase) in loans & advances (55.81) (355.79)
Decrease / (increase) in other assets (158.47) (33.63)
Increase / (decrease) in current liabilities and provisions 812.31 115.55
Net cash from (used for) operating activitiesNet cash from (used for) operating activitiesNet cash from (used for) operating activitiesNet cash from (used for) operating activitiesNet cash from (used for) operating activities 1,349.241,349.241,349.241,349.241,349.24 1,079.831,079.831,079.831,079.831,079.83
Cash flows from Investing activitiesCash flows from Investing activitiesCash flows from Investing activitiesCash flows from Investing activitiesCash flows from Investing activities
Investment in mutual funds & others (net) 291.99 39.61
Proceeds from sale of bonds (net) - 10.00
Refund of advance from HCL Technologies Limited Employees Trust 0.02 -
Stake Acquired from Minority (14.68) -
Purchase of fixed assets (including capital advances) (554.25) (389.66)
Proceeds from sale of fixed assets 7.47 2.11
Payment for business acquisition (net of cash acquired) (153.61) -
Income from investments and interest 53.42 15.66
Taxes paid (18.67) (9.17)
Principal payment for capital lease obligations (17.87) (9.34)
Net cash from (used for) investing activitiesNet cash from (used for) investing activitiesNet cash from (used for) investing activitiesNet cash from (used for) investing activitiesNet cash from (used for) investing activities (406.18)(406.18)(406.18)(406.18)(406.18) (340.79)(340.79)(340.79)(340.79)(340.79)
Cash flows from Financing activitiesCash flows from Financing activitiesCash flows from Financing activitiesCash flows from Financing activitiesCash flows from Financing activities
Proceeds / (repayment) of short-term loans (8.81) 3.14
Interest on loans (8.82) (0.58)
Repayment of long-term loans (7.23) (12.73)
Proceeds from long-term loans 7.89 -
Issue of share capital (including share premium and share application money pending allotment) 31.40 227.19
Dividend paid to minority shareholders of consolidated subsidiaries (11.00) -
Dividends paid (including corporate dividend tax) (621.33) (599.23)
Cash flows from (used for) financing activitiesCash flows from (used for) financing activitiesCash flows from (used for) financing activitiesCash flows from (used for) financing activitiesCash flows from (used for) financing activities (617.90)(617.90)(617.90)(617.90)(617.90) (382.21)(382.21)(382.21)(382.21)(382.21)
Effect of exchange rates on cash and cash equivalents held in foreign currency 25.41 (8.69)
Net increase / (decrease) in cash and cash equivalents 325.16 356.83
Cash and cash equivalents at the beginning of the year 660.67 312.53
Cash and cash equivalents at the end of the yearCash and cash equivalents at the end of the yearCash and cash equivalents at the end of the yearCash and cash equivalents at the end of the yearCash and cash equivalents at the end of the year 1,011.241,011.241,011.241,011.241,011.24 660.67660.67660.67660.67660.67
(0.00)
For components of cash and cash equivalents refer schedule - 9 of the Balance Sheet 0.00
Notes:Notes:Notes:Notes:Notes:
1. The above Cash Flow Statement has been prepared under the indirect method set out in Accounting Standard - 3 issued by the Institute of
Chartered Accountants of India
2. Cash and cash equivalents includes the following, which are not available for use by the Company:
Investor Education and Protection Fund-Unclaimed dividend 1.92
Bank Guarantees margin 2.13

8/7/2019 Indian_GAAP_07-08
http://slidepdf.com/reader/full/indiangaap07-08 96/125
95
3. Figures in brackets indicate cash outflow
4. Previous year figures have been regrouped and recast wherever necessary to conform to the current period classification.
This is the Consolidated Cash Flow Statement referred to in our report of even date
For HCL Technologies Limited
Kaushik Dutta Shiv Nadar Vineet Nayar T S R Subramanian
Partner Chairman and Chief Strategy Officer CEO & Wholetime Director Director
Membership No.: F-88540
For and on behalf of Anil Chanana Ranjit Narasimhan Manish Anand
Price Waterhouse Executive Vice President - Finance President & CEO - BPO Division Deputy Company Secretary
Chartered Accountants
Place: Gurgaon, India Place: Noida (UP), India
Date: 01 August 2008 Date: 01 August 2008
Consolidated Cash flow statement for the year ended 30 June 2008 (Contd.)(All amounts in crores of rupees except share data and unless otherwise stated)

8/7/2019 Indian_GAAP_07-08
http://slidepdf.com/reader/full/indiangaap07-08 97/125
96
Schedules to the consolidated financial statements
(All amounts in crores of rupees except share data and unless otherwise stated)
Schedule 1: Share Capital As at As at
30 June 2008 30 June 2007
AuthorisedAuthorisedAuthorisedAuthorisedAuthorised
750,000,000 (previous year 750,000,000) equity shares of Rs. 2 each 150.00 150.00
Issued, subscribed and paid upIssued, subscribed and paid upIssued, subscribed and paid upIssued, subscribed and paid upIssued, subscribed and paid up
666,340,272 (previous year 663,683,116) equity shares of Rs. 2 each, fully paid up(refer note 4 of schedule 19) 133.27 132.74
133.27133.27133.27133.27133.27 132.74132.74132.74132.74132.74
Notes:Notes:Notes:Notes:Notes:
1. Paid up share capital includes:
84,899,958 (previous year 84,899,958) equity shares of Rs 2 each alloted as fully paid up, pursuant to contracts for consideration other tha
cash.
• 82,986,872 (previous year 82,986,872) equity shares of Rs 2 each issued as bonus shares in the ratio of one share for every two held b
capitalisation of general reserve and 325,453,918 (previous year 325,453,918) equity shares of Rs. 2 each issued as bonus shares in the ratio
of one share for every share held by capitalisation of securities premium account.
• 39,866,246 (previous year 39,130,762) equity shares of Rs 2 each alloted to employees of the Company and its subsidiaries on exercising o
vested stock options issued under Employee Stock Option Plan 1999 of the Company.
• 16,310,380 (previous year 15,241,280) equity shares of Rs 2 each alloted to employees of the Company and its subsidiaries on exercising ovested stock options issued under Employee Stock Option Plan 2000 of the Company.
• 2,540,548 (previous year 1,687,976) equity shares of Rs. 2 each allotted to employees of the Company and its subsidiaries on exercising o
vested stock options issued under Employee Stock Option Plan 2004 of the Company.
2. HCL Corporation Limited, which ceased to be the Holding Company w.e.f 27th March 2007, held 326,003,539 (previous year 326,015,674) equitshares on the date of Balance Sheet.
Schedule 2: Reserves and Surplus As at Additions Deductions As at
1 July 2007 30 June 2008
Securities premium account 1,169.43 53.19 12.68 1,209.94
(971.16) (263.36) (65.09) (1,169.43)
Foreign currency translation reserve (102.00) 53.98 - (48.02)
(-1.28) - (100.72) (-102.00)
General Reserve 634.04 78.06 3.21 708.89
(523.86) (110.18) - (634.04)
Hedging Reserve account (net of deferred tax)
(refer note 12 of schedule 19) - (411.85) - (411.85)
(-) (-) (-) (-)
Employee Stock Options Outstanding
[net of deferred employee compensation
cost of Rs. 115.77 crores (previous year Rs. 242.76 crores)] 139.08 105.04 24.03 220.09
(50.88) (125.99) (37.79) (139.08)
Profit and Loss Account 2,093.94 351.11 78.06 2,366.99
(1,493.00) (711.12) (110.18) (2,093.94)
3,934.493,934.493,934.493,934.493,934.49 229.53229.53229.53229.53229.53 117.98117.98117.98117.98117.98 4,046.044,046.044,046.044,046.044,046.04
Previous year (3,037.62) (1,210.65) (313.78) (3,934.49)
Notes:
1. Addition to / Deduction from the Securities Premium Account represent:
a) Addition of Rs.29.16 crores (previous year Rs. 225.57 crores) in respect of allotment of equity shares of Rs. 2 each to employees of the
Company and its subsidiaries under the Employee Stock Option Plan 1999, Employee Stock Option Plan 2000 and Employee StockOption Plan 2004.
b) Addition of Rs.24.03 crores (previous year Rs. 37.79 crores) being amount transferred from Employee stock options outstanding onexercise of stock options.
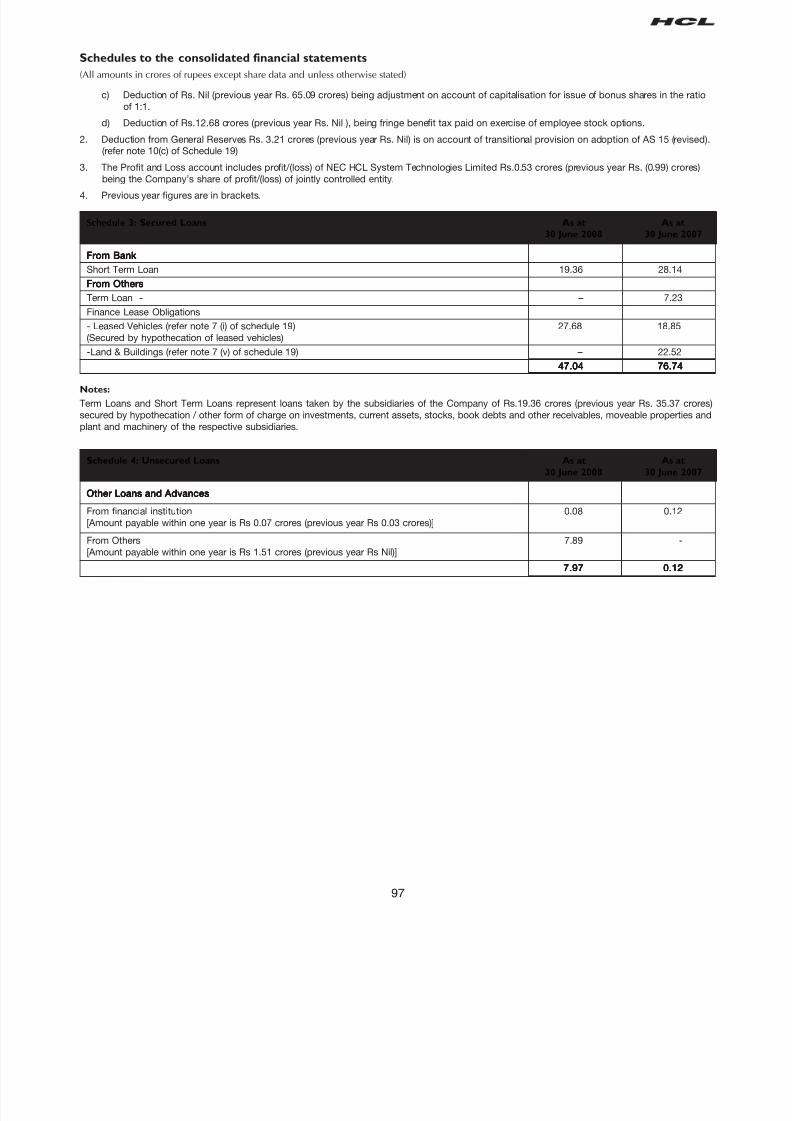
8/7/2019 Indian_GAAP_07-08
http://slidepdf.com/reader/full/indiangaap07-08 98/125
97
Schedules to the consolidated financial statements
(All amounts in crores of rupees except share data and unless otherwise stated)
Schedule 3: Secured Loans As at As at
30 June 2008 30 June 2007
From BankFrom BankFrom BankFrom BankFrom Bank
Short Term Loan 19.36 28.14
From OthersFrom OthersFrom OthersFrom OthersFrom Others
Term Loan - – 7.23
Finance Lease Obligations
- Leased Vehicles (refer note 7 (i) of schedule 19) 27.68 18.85
(Secured by hypothecation of leased vehicles)
-Land & Buildings (refer note 7 (v) of schedule 19) – 22.52
47.0447.0447.0447.0447.04 76.7476.7476.7476.7476.74
Notes:
Term Loans and Short Term Loans represent loans taken by the subsidiaries of the Company of Rs.19.36 crores (previous year Rs. 35.37 crore
secured by hypothecation / other form of charge on investments, current assets, stocks, book debts and other receivables, moveable properties an
plant and machinery of the respective subsidiaries.
Schedule 4: Unsecured Loans As at As at
30 June 2008 30 June 2007
Other Loans and AdvancesOther Loans and AdvancesOther Loans and AdvancesOther Loans and AdvancesOther Loans and Advances
From financial institution 0.08 0.12
[Amount payable within one year is Rs 0.07 crores (previous year Rs 0.03 crores)]
From Others 7.89 -
[Amount payable within one year is Rs 1.51 crores (previous year Rs Nil)]
7.977.977.977.977.97 0.120.120.120.120.12
c) Deduction of Rs. Nil (previous year Rs. 65.09 crores) being adjustment on account of capitalisation for issue of bonus shares in the ratio
of 1:1.
d) Deduction of Rs.12.68 crores (previous year Rs. Nil ), being fringe benefit tax paid on exercise of employee stock options.
2. Deduction from General Reserves Rs. 3.21 crores (previous year Rs. Nil) is on account of transitional provision on adoption of AS 15 (revised(refer note 10(c) of Schedule 19)
3. The Profit and Loss account includes profit/(loss) of NEC HCL System Technologies Limited Rs.0.53 crores (previous year Rs. (0.99) crores)
being the Company’s share of profit/(loss) of jointly controlled entity.4. Previous year figures are in brackets.

8/7/2019 Indian_GAAP_07-08
http://slidepdf.com/reader/full/indiangaap07-08 99/125
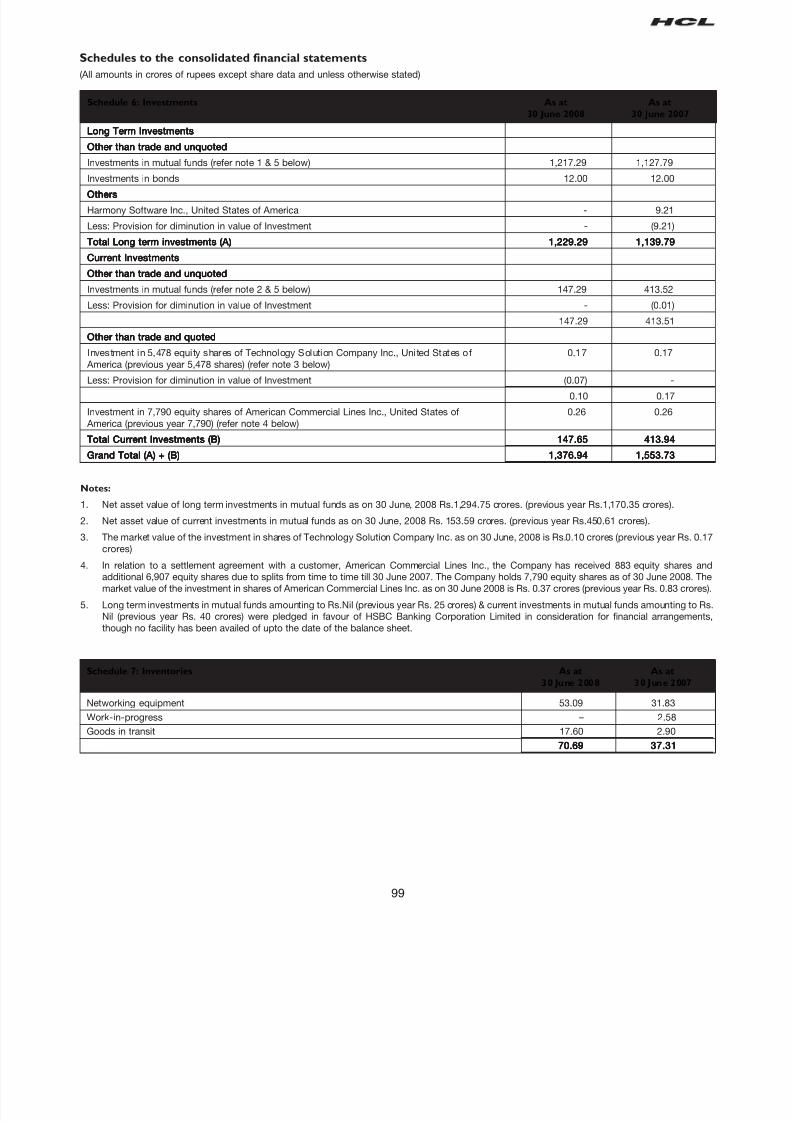
8/7/2019 Indian_GAAP_07-08
http://slidepdf.com/reader/full/indiangaap07-08 100/125
99
Schedules to the consolidated financial statements
(All amounts in crores of rupees except share data and unless otherwise stated)
Schedule 6: Investments As at As at
30 June 2008 30 June 2007
Long Term InvestmentsLong Term InvestmentsLong Term InvestmentsLong Term InvestmentsLong Term Investments
Other than trade and unquotedOther than trade and unquotedOther than trade and unquotedOther than trade and unquotedOther than trade and unquoted
Investments in mutual funds (refer note 1 & 5 below) 1,217.29 1,127.79
Investments in bonds 12.00 12.00OthersOthersOthersOthersOthers
Harmony Software Inc., United States of America - 9.21
Less: Provision for diminution in value of Investment - (9.21)
Total Long term investments (A)Total Long term investments (A)Total Long term investments (A)Total Long term investments (A)Total Long term investments (A) 1,229.291,229.291,229.291,229.291,229.29 1,139.791,139.791,139.791,139.791,139.79
Current InvestmentsCurrent InvestmentsCurrent InvestmentsCurrent InvestmentsCurrent Investments
Other than trade and unquotedOther than trade and unquotedOther than trade and unquotedOther than trade and unquotedOther than trade and unquoted
Investments in mutual funds (refer note 2 & 5 below) 147.29 413.52
Less: Provision for diminution in value of Investment - (0.01)
147.29 413.51
Other than trade and quotedOther than trade and quotedOther than trade and quotedOther than trade and quotedOther than trade and quoted
Investment in 5,478 equity shares of Technology Solution Company Inc., United States of 0.17 0.17
America (previous year 5,478 shares) (refer note 3 below)
Less: Provision for diminution in value of Investment (0.07) -
0.10 0.17
Investment in 7,790 equity shares of American Commercial Lines Inc., United States of 0.26 0.26
America (previous year 7,790) (refer note 4 below)
Total Current Investments (B)Total Current Investments (B)Total Current Investments (B)Total Current Investments (B)Total Current Investments (B) 147.65147.65147.65147.65147.65 413.94413.94413.94413.94413.94
Grand Total (A) + (B)Grand Total (A) + (B)Grand Total (A) + (B)Grand Total (A) + (B)Grand Total (A) + (B) 1,376.941,376.941,376.941,376.941,376.94 1,553.731,553.731,553.731,553.731,553.73
Notes:
1. Net asset value of long term investments in mutual funds as on 30 June, 2008 Rs.1,294.75 crores. (previous year Rs.1,170.35 crores).
2. Net asset value of current investments in mutual funds as on 30 June, 2008 Rs. 153.59 crores. (previous year Rs.450.61 crores).
3. The market value of the investment in shares of Technology Solution Company Inc. as on 30 June, 2008 is Rs.0.10 crores (previous year Rs. 0.1
crores)
4. In relation to a settlement agreement with a customer, American Commercial Lines Inc., the Company has received 883 equity shares anadditional 6,907 equity shares due to splits from time to time till 30 June 2007. The Company holds 7,790 equity shares as of 30 June 2008. Th
market value of the investment in shares of American Commercial Lines Inc. as on 30 June 2008 is Rs. 0.37 crores (previous year Rs. 0.83 crores
5. Long term investments in mutual funds amounting to Rs.Nil (previous year Rs. 25 crores) & current investments in mutual funds amounting to RNil (previous year Rs. 40 crores) were pledged in favour of HSBC Banking Corporation Limited in consideration for financial arrangement
though no facility has been availed of upto the date of the balance sheet.
Networking equipment 53.09 31.83
Work-in-progress – 2.58
Goods in transit 17.60 2.90
70.6970.6970.6970.6970.69 37.3137.3137.3137.3137.31
Schedule 7: Inventories As at As at
30 June 2008 30 June 2007
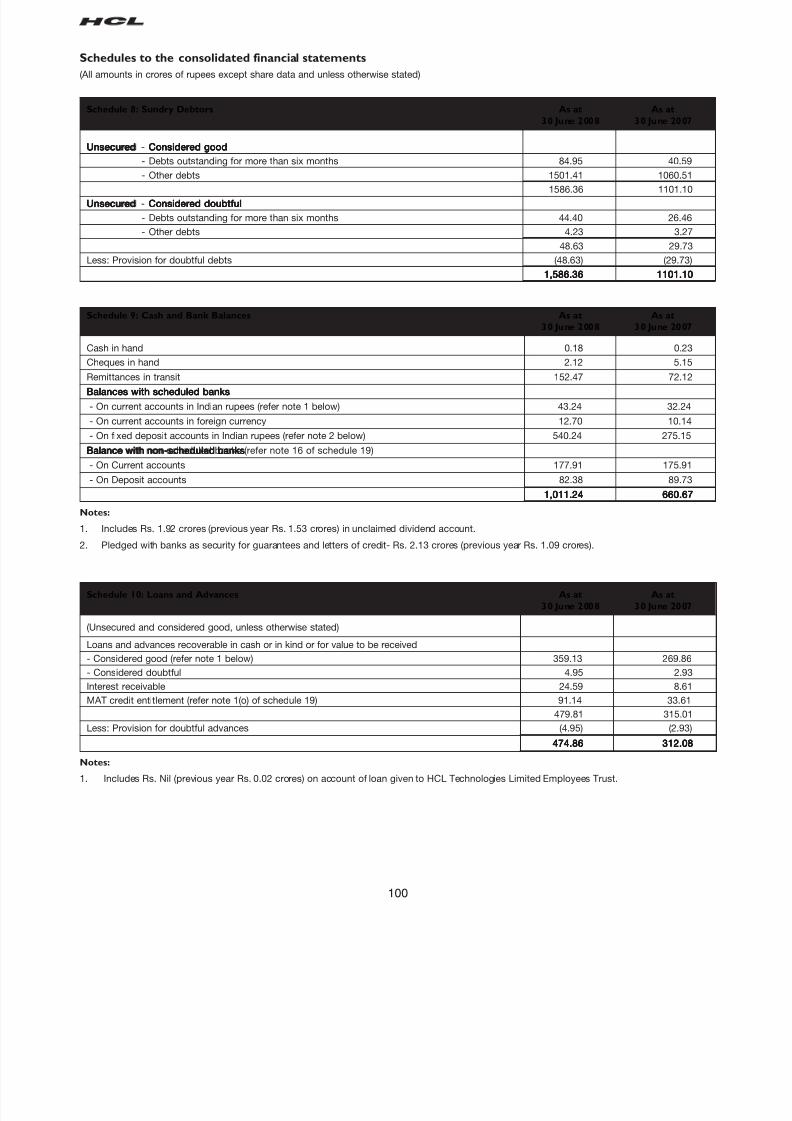
8/7/2019 Indian_GAAP_07-08
http://slidepdf.com/reader/full/indiangaap07-08 101/125
100
Schedules to the consolidated financial statements
(All amounts in crores of rupees except share data and unless otherwise stated)
Schedule 8: Sundry Debtors As at As at
30 June 2008 30 June 2007
UnsecuredUnsecuredUnsecuredUnsecuredUnsecured - Considered goodConsidered goodConsidered goodConsidered goodConsidered good
- Debts outstanding for more than six months 84.95 40.59
- Other debts 1501.41 1060.51
1586.36 1101.10
UnsecuredUnsecuredUnsecuredUnsecuredUnsecured - Considered doubtfulConsidered doubtfulConsidered doubtfulConsidered doubtfulConsidered doubtful
- Debts outstanding for more than six months 44.40 26.46
- Other debts 4.23 3.27
48.63 29.73
Less: Provision for doubtful debts (48.63) (29.73)
1,586.361,586.361,586.361,586.361,586.36 1101.101101.101101.101101.101101.10
Schedule 9: Cash and Bank Balances As at As at
30 June 2008 30 June 2007
Cash in hand 0.18 0.23
Cheques in hand 2.12 5.15Remittances in transit 152.47 72.12
Balances with scheduled banksBalances with scheduled banksBalances with scheduled banksBalances with scheduled banksBalances with scheduled banks
- On current accounts in Indian rupees (refer note 1 below) 43.24 32.24
- On current accounts in foreign currency 12.70 10.14
- On fixed deposit accounts in Indian rupees (refer note 2 below) 540.24 275.15
Balance with non-scheduled banksBalance with non-scheduled banksBalance with non-scheduled banksBalance with non-scheduled banksBalance with non-scheduled banks (refer note 16 of schedule 19)
- On Current accounts 177.91 175.91
- On Deposit accounts 82.38 89.73
1,011.241,011.241,011.241,011.241,011.24 660.67660.67660.67660.67660.67
Notes:
1. Includes Rs. 1.92 crores (previous year Rs. 1.53 crores) in unclaimed dividend account.
2. Pledged with banks as security for guarantees and letters of credit- Rs. 2.13 crores (previous year Rs. 1.09 crores).
(Unsecured and considered good, unless otherwise stated)
Loans and advances recoverable in cash or in kind or for value to be received
- Considered good (refer note 1 below) 359.13 269.86
- Considered doubtful 4.95 2.93
Interest receivable 24.59 8.61
MAT credit entitlement (refer note 1(o) of schedule 19) 91.14 33.61
479.81 315.01
Less: Provision for doubtful advances (4.95) (2.93)
474.86474.86474.86474.86474.86 312.08312.08312.08312.08312.08
Notes:
1. Includes Rs. Nil (previous year Rs. 0.02 crores) on account of loan given to HCL Technologies Limited Employees Trust.
Schedule 10: Loans and Advances As at As at
30 June 2008 30 June 2007

8/7/2019 Indian_GAAP_07-08
http://slidepdf.com/reader/full/indiangaap07-08 102/125
101
Schedules to the consolidated financial statements
(All amounts in crores of rupees except share data and unless otherwise stated)
CurrentCurrentCurrentCurrentCurrent LLLLLiabilities and Provisionsiabilities and Provisionsiabilities and Provisionsiabilities and Provisionsiabilities and Provisions
Current liabilitiesCurrent liabilitiesCurrent liabilitiesCurrent liabilitiesCurrent liabilities
Sundry creditors (refer note 1) 969.46 592.07
Unrealised loss on derivative financial instrumets (net) 685.08 -
Advance from customers 61.26 8.28
Unearned revenue 219.34 97.32
Investor Education and Protection Fund-Unclaimed dividend 1.92 1.53Interest accrued but not due on borrowings 1.95 1.25
Other liabilities 90.75 79.68
2,029.762,029.762,029.762,029.762,029.76 780.13780.13780.13780.13780.13
ProvisionsProvisionsProvisionsProvisionsProvisions
Provision for income tax (refer note 2) 117.01 108.82
Provision for fringe benefit tax (refer note 3) 9.29 4.53
Provision for dividend (including corporate dividend tax) 233.87 155.30
Provision for warranty (refer note 15 of schedule 19) 1.39 1.58
Provision for staff benefits 170.06 109.96
531.62531.62531.62531.62531.62 380.19380.19380.19380.19380.19
2,561.382,561.382,561.382,561.382,561.38 1,160.321,160.321,160.321,160.321,160.32
Schedule 12: Current Liabilities and Provisions As at As at
30 June 2008 30 June 2007
Schedule 11: Other Current Assets As at As at
30 June 2008 30 June 2007
Unbilled revenue 323.49 140.58
Deferred Cost 133.24 33.83
Unrealised gain on derivative financial instruments (net) - 277.11
456.73456.73456.73456.73456.73 451.52451.52451.52451.52451.52
Notes:Notes:Notes:Notes:Notes:
1. Sundry creditors includes Rs. Nil (previous year Rs. Nil) payable to Micro & Small Enterprise (refer note 17 of schedule 19)
2. Net of advance income tax of Rs. 358.38 crores (previous year Rs. 161.03 crores)
3. Net of fringe benefit advance tax of Rs. 57.97 crores (previous year Rs. 26.93 crores).
SaleSaleSaleSaleSale
Goods 233.44 224.53
Services 7,329.34 5,844.21
7,562.787,562.787,562.787,562.787,562.78 6,068.746,068.746,068.746,068.746,068.74
Schedule 13: Sales Year ended Year ended
30 June 2008 30 June 2007

8/7/2019 Indian_GAAP_07-08
http://slidepdf.com/reader/full/indiangaap07-08 103/125
102
Schedules to the consolidated financial statements
(All amounts in crores of rupees except share data and unless otherwise stated)
Interest income - gross
[Tax deducted at source Rs 7.82 crores (previous year Rs 0.13 crores)]
- On fixed deposits 52.56 9.41
- On investment (other than trade) 0.90 1.25- Others 5.74 2.82
Profit on sale of investments-other than trade 114.69 79.15
Dividend from investments-other than trade 10.20 9.08
Provision for liabilities not required written back 0.87 0.05
Profit on sale of fixed assets (net) - 0.34
Exchange differences - 346.48
Miscellaneous income 7.76 7.27
192.72192.72192.72192.72192.72 455.85455.85455.85455.85455.85
Schedule 14: Other Income Year ended Year ended
30 June 2008 30 June 2007
Opening stock 31.83 15.00
Purchases 215.67 207.53
Closing stock (53.09) (31.83)
194.41194.41194.41194.41194.41 190.70190.70190.70190.70190.70
Schedule 15: Cost of Goods Sold Year ended Year ended
30 June 2008 30 June 2007
Personnel expensesPersonnel expensesPersonnel expensesPersonnel expensesPersonnel expenses
Salaries, wages and bonus 3,165.41 2,440.57
Contribution to provident fund and other employee benefits 344.59 259.92
Staff welfare expenses 47.38 45.68Employee stock compensation expense 105.04 125.99
3,662.423,662.423,662.423,662.423,662.42 2,872.162,872.162,872.162,872.162,872.16
OthersOthersOthersOthersOthers
Software development expenses - external 312.69 274.14
License and transponder fee 21.02 20.46
3,996.133,996.133,996.133,996.133,996.13 3,166.763,166.763,166.763,166.763,166.76
Schedule 16: Cost of Services Year ended Year ended
30 June 2008 30 June 2007

8/7/2019 Indian_GAAP_07-08
http://slidepdf.com/reader/full/indiangaap07-08 104/125
103
Schedules to the consolidated financial statements
(All amounts in crores of rupees except share data and unless otherwise stated)
Schedule 17: Administration and Other Expenses Year ended Year ended
30 June 2008 30 June 2007
Rent 211.50 126.65
Power and fuel 100.54 77.00
Insurance 17.50 23.48
Repairs and maintenance
- Plant and machinery 30.75 38.05
- Buildings 36.72 30.05
- Others 33.27 31.98
Communication costs 103.17 106.77
Travel and conveyance 653.47 612.42
Business promotion 27.04 22.24
Legal and professional charges 75.38 45.85
Software license fee 87.16 53.43
Software tools 23.06 16.92
Printing and stationery 16.12 16.56
Rates and taxes 15.28 37.13
Advertising and publicity 11.09 6.43
Postage and courier 4.59 4.12
Provision for doubtful advances / advances written off 0.55 0.15
Donations 0.18 0.12
Dues and subscription 3.82 5.32
Recruitment, training and development 73.13 50.74
Provision for doubtful debts/ bad debts written off 18.90 12.19
Provision for diminution in value of investments 0.07 -
Loss on sale of investments-other than trade 0.37 0.66
Loss on sale of fixed assets (net) 1.59 -
Exchange differences 287.97 -
Miscellaneous expenses 232.34 159.03
2,065.562,065.562,065.562,065.562,065.56 1,477.291,477.291,477.291,477.291,477.29
Schedule 18: Finance Costs Year ended Year ended
30 June 2008 30 June 2007
Interest
-on assets under finance lease 3.96 3.03
-on loans from banks 9.16 1.02
-others 0.36 0.40
Bank charges 4.22 3.58
17.7017.7017.7017.7017.70 8.038.038.038.038.03

8/7/2019 Indian_GAAP_07-08
http://slidepdf.com/reader/full/indiangaap07-08 105/125
104
Schedules to the consolidated financial statements
(All amounts in crores of rupees except share data and unless otherwise stated)
Schedule 19: Significant Accounting Policies and Notes to the Accounts
Subsidiary companies are those in which HCL Technologies Limited (HCL), directly or indirectly, have an interest of more than one half othe voting power or otherwise has power to exercise control over the operations. Subsidiaries are consolidated from the date on whiceffective control is transferred to the Company until the date of cessation of the parent-subsidiary relationship.
Company Overview
HCL Technologies Limited and its consolidated subsidiaries and associates, (hereinafter collectively referred to as ‘HCL’ or ‘the Company’) arprimarily engaged in providing a range of information technology, business process outsourcing and infrastructure product and management serviceThe Company was incorporated in India in November 1991 and focuses on technology and R&D outsourcing, working with clients in areas at the corof their business. The Company leverages an extensive offshore infrastructure and its global network of offices in various countries and professionato deliver solutions across select verticals including Retail & Consumer, Aerospace, Automotive, Telecom, Financial Services, Government, Hi-techMedia and Entertainment , Travel , Transportation and Logistics , Energy and utilities , Life Sciences and Healthcare.
1. Significant Accounting Policies
a) Basis of preparation
The financial statements are prepared and presented under the historical cost convention, in accordance with the Indian GeneraAccepted Accounting Principles (GAAP), the applicable accounting standards notified u/s 211 (3C) of the Companies Act, 1956, threlevant provisions of the Companies Act, 1956 and guidelines issued by the Securities and Exchange Board of India. The financiastatements are prepared in crores of Indian rupees.
b) Principles of consolidation
These consolidated financial statements relate to HCL Technologies Limited, the parent company, its subsidiaries and joint venturesreferred to in these financial statements as “the Company”, which are as follows:
Name of the company Location Holding percentage
Subsidiaries
1. HCL America Inc. United States of America 100%
2. HCL Great Britain Limited United Kingdom 100%
3. HCL (Netherlands) BV Netherlands 100%
4. HCL GmbH, Germany Germany 100%
5. HCL Belgium NV, Belgium Belgium 100%
6. HCL Sweden AB, Sweden Sweden 100%
7. HCL Italy SLR, Italy Italy 100%
8. HCL Australia Services Pty. Limited Australia 100%
9. HCL (New Zealand) Limited New Zealand 100%
10. HCL Hong Kong SAR Limited Hong Kong 100%
11. HCL Japan Limited, Japan Japan 100%
12. HCL Comnet Systems & Services Limited India 99.88%
13. HCL Comnet Limited India 99.88%
14. HCL Bermuda Limited Bermuda 100%15. HCL Holdings GmbH Austria 100%
16. HCL Enterprise Solutions Limited Mauritius 100%
17. Intelicent India Limited India 100%
18. DSI Financial Solutions Pte. Limited Singapore 100%
19. HCL BPO Services (NI) Limited Northern Ireland 100%
20. HCL Jones Technologies LLC [Refer note 2(a) of schedule 19] United States of America 51%
21. HCL Jones (Bermuda) Limited [Refer note 2(a) of schedule 19] Bermuda 51%
22. HCL Singapore Pte. Limited Singapore 100%
23. HCL (Malaysia) Sdn. Bhd. Malaysia 100%
24. HCL EAI Services Inc. [Refer note 2(b) of schedule 19] United States of America 100%
25. Aalayance (UK) Ltd United Kingdom 100%
26. HCL EAI Services Limited India 100%
27. HCL Technopark Limited India 100%
28. HCL Poland Sp.Z.o.o Poland 100%
29. HCL Technologies (Shanghai) Ltd Shanghai 100%
30. Capital Stream Inc. [Refer note 2(c) of schedule 19] United States of America 100%
Joint venture
1. NEC HCL System Technologies Limited India 49%
8/7/2019 Indian_GAAP_07-08
http://slidepdf.com/reader/full/indiangaap07-08 106/125
105
Schedules to the consolidated financial statements
(All amounts in crores of rupees except share data and unless otherwise stated)
Schedule 19: Significant Accounting Policies and Notes to the Accounts (Contd.)
All material inter company transactions, balances and unrealized surplus and deficit on transactions between group companies aeliminated. Consistency in adoption of accounting policies among all group companies is ensured to the extent practicable. Separatdisclosures are made of minority interest.
Investment in business entities over which the Company exercises joint control is accounted for using proportionate consolidatioexcept where the control is considered to be temporary. Investments in associates are accounted for using the equity method.
Minority interest in subsidiaries represents the minority shareholders’ proportionate share of net assets and the net income of HCLmajority owned subsidiaries.
Goodwill has been recorded to the extent that the cost of acquisition, comprising purchase consideration and transaction costs, exceedthe book value of net assets in each acquired company. The goodwill arising on consolidation is not amortized but tested for impairmenon a periodic basis.
c) Use of estimates
The preparation of financial statements in conformity with GAAP requires management to make estimates and assumptions that affecthe reported amounts of assets and liabilities, disclosure of contingent assets and liabilities at the date of the financial statements and thresults of operations during the reporting period. Examples of such estimates include estimates of expected contract costs to be incurreto complete performance under software development arrangements, income taxes, provision for warranty, employee benefit planprovision for doubtful debts and advances, estimated useful life of the fixed assets and intangible assets. The actual results could diffefrom those estimates. Any revision to accounting estimates is recognized prospectively in current and future periods.
d) Foreign exchange transactions and translation of financial statements of foreign operations
Foreign exchange transactions are recorded at the exchange rates prevailing at the date of transaction. Realized gains and losses o
foreign exchange transactions during the year are recognized in the Profit and Loss Account. Foreign currency monetary assets anliabilities are translated at year-end rates and resultant gains/losses on foreign exchange translations are recognized in the Profit anLoss Account.
Foreign operations of the Company are classified into integral and non-integral. The financial statements of an integral foreign operatioare translated as follows:
Revenue items, except opening and closing inventories and depreciation, are translated at a monthly weighted average rate. Openinand closing inventories are translated at the rate prevalent at the commencement and close respectively of the accounting period.
Monetary assets and liabilities are translated using the closing rate. Non-monetary assets and liabilities, other than investments and fixeassets are translated using the exchange rate at the date of the transaction i.e. the date when they were acquired.
Fixed assets existing at the date of acquisition of a subsidiary are translated using the exchange rate at that date. For fixed assetacquired later, the exchange rate at the date of acquisition of the fixed asset is used. Investments are translated at historical cost. The nexchange difference resulting from the translation of items in the financial statements of the subsidiary is recognized as income oexpense for the period.
In respect of foreign operations identified as non-integral to the operations of the Company, the translation of functional currency inreporting currency is performed for balance sheet accounts using the exchange rates in effect at the balance sheet date and for revenuand expense accounts using an appropriate monthly weighted average exchange rate for the respective periods. The gain or losresulting from such translations is accumulated in a foreign currency translation reserve.
Contingent liabilities are translated at the closing rate.
e) Derivative Instruments and Hedge Accounting
The Company uses derivative financial instruments (foreign currency forward and option contracts) to hedge its risks associated witforeign currency fluctuations relating to certain forecasted transactions.
The use of foreign currency forward contracts is governed by the Company’s policies, which provide written principles on the use of sucfinancial derivatives consistent with the Company’s risk management strategy. The Company does not use derivative financial instrumenfor speculative purposes.
Foreign currency forward contract derivative instruments are initially measured at fair value, and are remeasured at subsequent reportindates.
In respect of derivatives designated as hedges, the Company formally documents all relationships between hedging instruments anhedged items, as well as its risk management objective and strategy for undertaking various hedge transactions. The Company alsformally assesses both at the inception of the hedge and on an ongoing basis, whether each derivative is highly effective in offsettinchanges in fair values or cash flows of the hedged item. Changes in the fair value of these derivatives (net of tax) that are designated andeffective as hedges of future cash flows are recognised directly in Hedging Reserve Account under shareholders’ funds and the ineffectivportion is recognized immediately in profit and loss account. Changes in the fair value of derivative financial instruments that do noqualify for hedge accounting are recognized in profit and loss account as they arise.
Hedge accounting is discontinued from the last testing date when the hedging instrument expires or is sold, terminated, or exercised, no longer qualifies for hedge accounting. Cumulative gain or loss on such hedging instrument recognised in shareholder’s funds retained there until the forecasted transaction occurs. If a hedged transaction is no longer expected to occur, the net cumulative gain oloss recognised in shareholders’ funds is transferred to profit and loss account for the year.
f) Revenue recognition
i ) IT Services
Revenue from IT services comprises income from time and material and fixed price contracts. Revenue with respect to time an

8/7/2019 Indian_GAAP_07-08
http://slidepdf.com/reader/full/indiangaap07-08 107/125
106
material contracts is recognized as related services are performed. Revenue from fixed price contracts and fixed time framcontracts is recognized in accordance with the percentage completion method under which the sales value of performancincluding earnings thereon, is recognized on the basis of cost incurred in respect of each contract as a proportion of total coexpected to be incurred. The cumulative impact of any revision in estimates of the percentage of work completed is reflected in thyear in which the change becomes known. Provisions for estimated losses are made during the year in which a loss becomeprobable based on current contract estimates. Revenue from sale of licenses for the use of software applications is recognised o
transfer of title in the user license. Revenue from annual technical service contracts is recognised on a pro rata basis over thperiod in which such services are rendered. Income from revenue sharing agreements is recognized when the right to receive established. Costs and earnings in excess of billing are classified as unbilled revenue, while billing in excess of costs and earningare classified as unearned revenue. Incremental revenue from existing contracts arising on future sales of the customers’ producwill be recognized when it is earned. Revenue and related direct costs from transition services in outsourcing arrangements ardeferred and recognized over the period of the arrangement. Certain upfront non-recurring costs incurred in the initial phases ooutsourcing contracts and contract acquisition costs, are deferred and amortized usually on a straight line basis over the term othe contract. The Company periodically estimates the undiscounted cash flows from the arrangement and compares it with thunamortized costs. If the unamortized costs exceed the undiscounted cash flow, a loss is recognized.
ii) Networking Services
Revenue from sale of products is recognized when persuasive evidence of an arrangement exists, risk and reward of ownershihas been transferred to the customer, the sales price is fixed or determinable and collectibility is reasonably assured. Revenufrom product sales are shown net of sales tax and applicable discounts and allowances.
Revenue from installation services is recognized when installation of networking equipment at customer site is completed anaccepted by the customer.
Revenue from bandwidth services is recognized upon actual usage of such services by customers based on either the time fwhich these service are provided or volume of data transferred or both and excludes service tax.
Revenue from maintenance services is recognized ratebly over the period of the contract.
Revenue from infrastructure management services comprise income from time-and-material, fixed price contracts and fixed timframe contracts. Revenue with respect to time-and-material contracts is recognized as related services are performed. Revenuwith respect to fixed price contracts and fixed time frame contracts is recognized in accordance with the percentage of completiomethod.
Warranty costs on sale of goods and services are accrued based on management estimates and historical data at the time thosrelated revenues are recognized.
Unearned income arising in respect of bandwidth services and maintenance services is calculated on the basis of unutilized perioof service at the balance sheet date and represents revenue, which is expected to be earned in future periods in respect of thesservices.
iii) Business Process Outsourcing services
Revenue from business process outsourcing services is derived from both time based and unit-price contracts. Revenue is recognizeas the related services are performed in accordance with the specific terms of the contracts with the customer.
The Company accounts for volume discounts and pricing incentives to customers. The discount terms in the Companyarrangements with customers generally entitle the customer to discounts, if the customer completes a specified level of revenutransactions. In some arrangements, the level of discount varies with increases in the levels of revenue transactions. The Companrecognizes discount obligations as a reduction of revenue based on the ratable allocation of the discount to each of the underlyinrevenue transactions that result in progress by the customer toward earning the discount.
Revenues are shown net of sales tax, value added tax, service tax and applicable discounts and allowances. The revenue irecognized net of discounts and allowances.
iv) Others
Profit on sale of Investments is recorded on transfer of title from the Company and is determined as the difference between thsales price and the then carrying value of the investment. Interest on the deployment of surplus funds is recognized using the timeproportion method, based on interest rates implicit in the transaction. Dividend income, commission, brokerage and rent arecognized when the right to receive the same is established.
g) Expenditure
Expenses are accounted for on an accrual basis and provisions are made for all known losses and liabilities.
h) Inventory
Inventories are valued at the lower of cost and net realizable value. The cost is calculated on the basis of weighted average pricmethod. The net realizable value is determined with reference to selling price of related finished goods. The comparison of cosand net realizable value is made on an item by item basis.
i) Fixed assets, Intangible assets and Capital work-in-progress
Fixed assets are stated at cost of acquisition including incidental costs related to acquisition and installation less accumulatedepreciation. Fixed assets under construction, advances paid towards acquisition of fixed assets and cost of assets not ready fouse before the year-end, are disclosed as capital work in progress. Intangible assets represent goodwill which arise or have beeacquired through acquisitions and software.
Schedules to the consolidated financial statements
(All amounts in crores of rupees except share data and unless otherwise stated)
Schedule 19: Significant Accounting Policies and Notes to the Accounts (Contd.)

8/7/2019 Indian_GAAP_07-08
http://slidepdf.com/reader/full/indiangaap07-08 108/125
107
j) Leases
Assets given under finance lease are recognized as receivables at an amount equal to the net investment in the lease. The financincome is recognised based on periodic rate of return on the net investment of the lessor outstanding in respect of the financlease.
Assets given under operating leases are shown in the balance sheet under fixed assets and depreciated on a basis consistent wit
the depreciation policy of the Company. The lease income is recognised in the profit and loss Account on a straight-line basis ovethe lease term.
Assets taken on finance lease are capitalized at the inception of the lease at the lower of the fair value or the present value minimum lease payments and a liability is created for an equivalent amount. Each lease rental paid is allocated between the liabiliand interest cost, so as to obtain a constant periodic rate of interest on outstanding liability for each period.
Lease payments under an operating lease are recognized as an expense in the profit and loss account on a straight-line basis ovethe lease term.
k) Depreciation and amortization
Depreciation on fixed assets except leasehold land and leasehold improvement is provided on the straight-line method over theestimated useful lives, as determined by the management, at the rate which are equal to or higher than the rates prescribed undeSchedule XIV of the Companies Act, 1956. Leasehold land is amortized over the period of lease. Leasehold improvements aamortized over a period of four years or the remaining period of the lease, whichever is shorter. Depreciation is charged on a prorata basis for assets purchased/sold during the year. Assets costing less than Rs. 5,000 are fully depreciated in the year of purchas
Intangible assets are amortized over their respective individual estimated useful life on a straight line basis.
The management’s estimates of the useful life of the various fixed assets/intangibles are as follows:
l ) Investments
Trade investments are the investments made to enhance the Company’s business interests. Investments are either classified along-term or current investments, based on management’s intention at the time of purchase. Long-term investments are stated acost and provision is made to recognise any decline, other than temporary, determined separately for each investment. Curreninvestments are stated at the lower of cost and fair value. The comparison of cost and fair value is done separately in respect oeach category of investment.
m) Research and development
Revenue expenditure on research and development is expensed as incurred. Capital expenditure incurred on equipment anfacilities acquired or constructed for research and development activities and having alternative future use, are capitalised anincluded in fixed assets.
n) Warranty
Provision for warranty is calculated on the basis of the unexpired warranty period of equipment installed during the year and thannual maintenance cost of equipment.
o) Taxation
Income tax expenses comprise current tax and deferred tax charge or credit (reflecting the tax effects of timing differences betweeaccounting income and taxable income for the period). The deferred tax charge or credit and the corresponding deferred taliabilities or assets are recognized using the tax rates that have been enacted or substantively enacted by the Balance Sheet dateDeferred tax assets are recognized only to the extent there is reasonable certainty that the assets can be realized in futurhowever, where there is unabsorbed depreciation or carried forward loss under the taxation laws, deferred tax assets are recognizeonly if there is virtual certainty of realization of such assets. Deferred tax assets are reviewed for the appropriateness of thecarrying values at each Balance Sheet date. The deferred tax liabilities/assets and tax expense are determined separately for thparent, each subsidiary and joint venture and then aggregated.
The tax filings are subject to review by the tax authorities in the jurisdictions where the Company conducts business. Thesreviews may result in assessments of additional taxes that are resolved with the authorities or potentially through the courtsResolution of these matters involves some degree of uncertainty; accordingly, the Company provides income taxes for the liabilitieit believes will ultimately result from the proceedings.
Schedules to the consolidated financial statements
(All amounts in crores of rupees except share data and unless otherwise stated)
Schedule 19: Significant Accounting Policies and Notes to the Accounts (Contd.)
Life (in years)
Fixed Assets
Buildings 20
Plant and machinery (including office equipment, air conditioners and electrical installations) 4 to 5
Computers 2 to 4
Furniture and fixtures 4
Vehicles – owned 5
Vehicles – leased Over the period of lease or5 years, whichever is lower
Intangibles
Software 3
Goodwill (arising other than on consolidation) 5

8/7/2019 Indian_GAAP_07-08
http://slidepdf.com/reader/full/indiangaap07-08 109/125
108
Minimum Alternate Tax (MAT) paid in accordance with tax laws, which give rise to future economic benefits in the form of adjustmeof future tax liability, is considered as an asset in the Balance Sheet when it is probable that the future economic benefit associatewith it will flow to the Company and the asset can be measured reliably.
Provision for wealth tax is made based on tax liability computed after considering tax allowances and exemptions available accordance with the provisions of the Wealth Tax Act, 1957.
p) Earnings per share In determining earnings per share, the Company considers the net profit after tax and includes the post tax effect of any extraordina/exceptional item. Basic earnings per share are computed using the weighted average number of equity shares outstanding durinthe year. Diluted earnings per share is computed using the weighted average number of equity shares outstanding during the yeaand dilutive equity equivalent shares outstanding at the year-end, except where the results would be anti-dilutive.
q) Employee benefits
India
Provident Fund:
Contributions to provident fund, a defined benefit plan are deposited with a recognised provident fund trust, set up by the CompanThe interest rate payable by the trust to the beneficiaries every year is notified by the government and the company has an obligatioto make good the shortfall, if any, between the return from the investments of the trust and the notified interest rate. Liability witregard to the same is accrued based on actuarial valuations at the balance sheet date, carried out by an independent actuary.
Superannuation:
The Company made contributions to a scheme administered by an insurance company in respect of superannuation for applicab
employees. The Company had no further obligations to the superannuation plan beyond its monthly contributions.
Compensated absences:
The employees of the Company are entitled to compensated absences. The employees can carry forward a portion of unutilizeaccrued compensated absence and utilize it in future periods or receive cash compensation at retirement or termination employment for the unutilized accrued compensated absence. The Company records an obligation for compensated absences ithe period in which the employee renders the service that increase this entitlement. The Company measures the expected cost compensated absence as the additional amount that the Company expects to pay as a result of the unused entitlement that haaccumulated at the balance sheet date.
Gratuity:
The Company provides for gratuity, a defined benefit retirement plan. The plan provides a lump sum payment to vested employeeat retirement or termination of employment, an amount based on the respective employee’s last drawn salary and the years oemployment with the Company.
Liability with regard to compensated absences and gratuity is accrued based on actuarial valuations at the balance sheet datcarried out by an independent actuary. Gains and losses arising out of actuarial evaluations are recognised immediately in th
Profit and Loss account as income or expense.State Plans:
The Company’s contribution to State Plans namely Employee State Insurance Fund and Employees Pension Scheme are chargeto Revenue every year.
Subsidiaries in the US
The Company has a saving and investment plan under section 401(k) of the Internal Revenue Code of the United States of AmericThis is a defined contribution plan. Contributions are charged to income in the period in which they accrue. Leave encashment accrued based on actuarial valuation at the balance sheet date.
Subsidiaries in Europe
The Company contributes towards pension plans of the various governments for the employees of its subsidiaries in UniteKingdom, Sweden, Netherlands, Belgium, Germany and Northern Ireland.
Subsidiaries in Australia
As per local laws of Australia, employers must provide a minimum level of superannuation for most employees or incur a non-tadeductible superannuation guarantee charge including interest and penalties. The required level of employer superannuation contributiois a percentage of the employee’s earnings base. The Company contributes to a fund approved by the Government of Australia.
Subsidiaries in Malaysia and Singapore
As per local laws of Malaysia and Singapore, employers are required to contribute up to 13% of the basic salary of the employeesThe Company contributes to a fund approved by the Government of the Country.
r) Impairment of assets
Impairment loss, if any, is provided to the extent of the excess, the carrying amount of assets exceeds their recoverable amounRecoverable amount is the higher of an asset’s net selling price, and its value in use. Value in use is the present value of estimatefuture cash flows expected to arise from the continuing use of an asset and from its disposal at the end of its useful life.
s) Provisions and contingent liabilities
A provision is recognised when there is a present obligation as a result of a past event, it is probable that an outflow of resource
Schedules to the consolidated financial statements
(All amounts in crores of rupees except share data and unless otherwise stated)
Schedule 19: Significant Accounting Policies and Notes to the Accounts (Contd.)
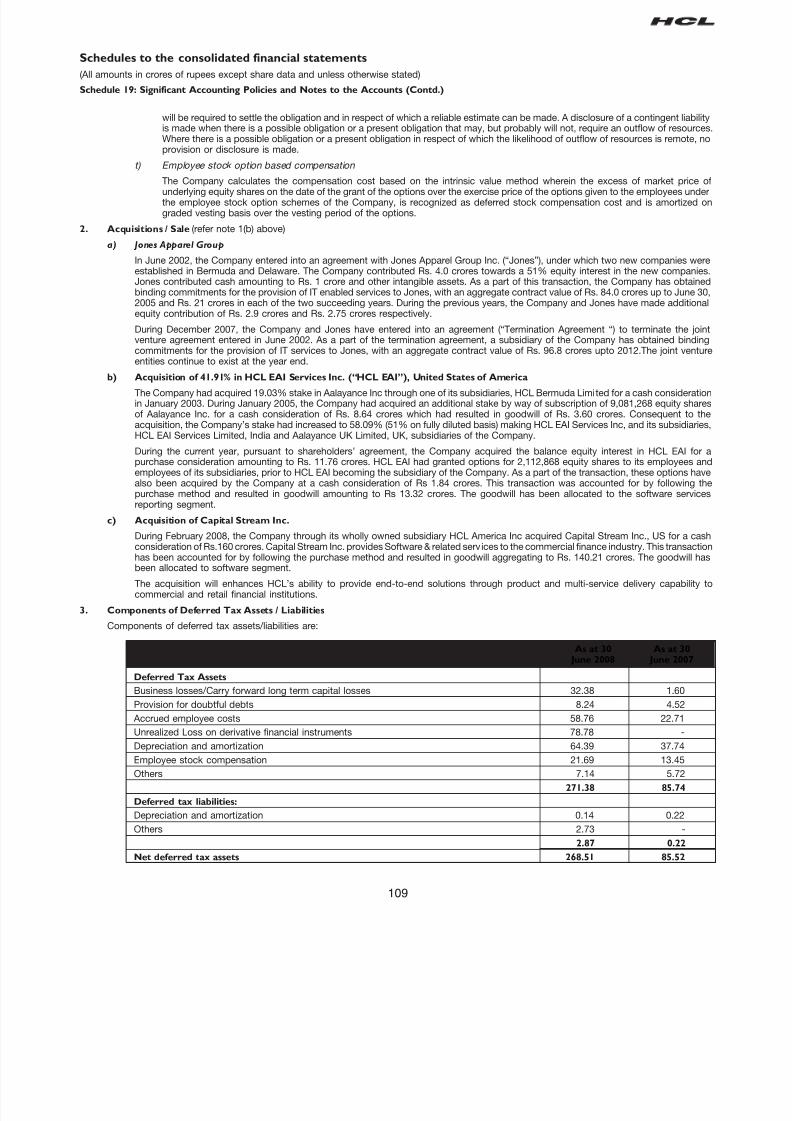
8/7/2019 Indian_GAAP_07-08
http://slidepdf.com/reader/full/indiangaap07-08 110/125
109
will be required to settle the obligation and in respect of which a reliable estimate can be made. A disclosure of a contingent liabilitis made when there is a possible obligation or a present obligation that may, but probably will not, require an outflow of resourceWhere there is a possible obligation or a present obligation in respect of which the likelihood of outflow of resources is remote, nprovision or disclosure is made.
t) Employee stock option based compensation
The Company calculates the compensation cost based on the intrinsic value method wherein the excess of market price ounderlying equity shares on the date of the grant of the options over the exercise price of the options given to the employees undethe employee stock option schemes of the Company, is recognized as deferred stock compensation cost and is amortized ograded vesting basis over the vesting period of the options.
2. Acquisitions / Sale (refer note 1(b) above)
a) Jones Apparel Group
In June 2002, the Company entered into an agreement with Jones Apparel Group Inc. (“Jones”), under which two new companies werestablished in Bermuda and Delaware. The Company contributed Rs. 4.0 crores towards a 51% equity interest in the new companiesJones contributed cash amounting to Rs. 1 crore and other intangible assets. As a part of this transaction, the Company has obtainebinding commitments for the provision of IT enabled services to Jones, with an aggregate contract value of Rs. 84.0 crores up to June 302005 and Rs. 21 crores in each of the two succeeding years. During the previous years, the Company and Jones have made additionaequity contribution of Rs. 2.9 crores and Rs. 2.75 crores respectively.
During December 2007, the Company and Jones have entered into an agreement (“Termination Agreement “) to terminate the joinventure agreement entered in June 2002. As a part of the termination agreement, a subsidiary of the Company has obtained bindincommitments for the provision of IT services to Jones, with an aggregate contract value of Rs. 96.8 crores upto 2012.The joint ventu
entities continue to exist at the year end.b) Acquisition of 41.91% in HCL EAI Services Inc. (“HCL EAI”), United States of America
The Company had acquired 19.03% stake in Aalayance Inc through one of its subsidiaries, HCL Bermuda Limited for a cash consideratioin January 2003. During January 2005, the Company had acquired an additional stake by way of subscription of 9,081,268 equity shareof Aalayance Inc. for a cash consideration of Rs. 8.64 crores which had resulted in goodwill of Rs. 3.60 crores. Consequent to thacquisition, the Company’s stake had increased to 58.09% (51% on fully diluted basis) making HCL EAI Services Inc, and its subsidiariesHCL EAI Services Limited, India and Aalayance UK Limited, UK, subsidiaries of the Company.
During the current year, pursuant to shareholders’ agreement, the Company acquired the balance equity interest in HCL EAI for purchase consideration amounting to Rs. 11.76 crores. HCL EAI had granted options for 2,112,868 equity shares to its employees anemployees of its subsidiaries, prior to HCL EAI becoming the subsidiary of the Company. As a part of the transaction, these options havalso been acquired by the Company at a cash consideration of Rs 1.84 crores. This transaction was accounted for by following thpurchase method and resulted in goodwill amounting to Rs 13.32 crores. The goodwill has been allocated to the software servicereporting segment.
c) Acquisition of Capital Stream Inc.
During February 2008, the Company through its wholly owned subsidiary HCL America Inc acquired Capital Stream Inc., US for a cas
consideration of Rs.160 crores. Capital Stream Inc. provides Software & related services to the commercial finance industry. This transactiohas been accounted for by following the purchase method and resulted in goodwill aggregating to Rs. 140.21 crores. The goodwill habeen allocated to software segment.
The acquisition will enhances HCL’s ability to provide end-to-end solutions through product and multi-service delivery capability tcommercial and retail financial institutions.
3. Components of Deferred Tax Assets / Liabilities
Components of deferred tax assets/liabilities are:
As at 30 As at 30June 2008 June 2007
Deferred Tax Assets
Business losses/Carry forward long term capital losses 32.38 1.60
Provision for doubtful debts 8.24 4.52
Accrued employee costs 58.76 22.71
Unrealized Loss on derivative financial instruments 78.78 -
Depreciation and amortization 64.39 37.74
Employee stock compensation 21.69 13.45
Others 7.14 5.72
271.38 85.74
Deferred tax liabilities:
Depreciation and amortization 0.14 0.22
Others 2.73 -
2.87 0.22
Net deferred tax assets 268.51 85.52
Schedules to the consolidated financial statements
(All amounts in crores of rupees except share data and unless otherwise stated)
Schedule 19: Significant Accounting Policies and Notes to the Accounts (Contd.)

8/7/2019 Indian_GAAP_07-08
http://slidepdf.com/reader/full/indiangaap07-08 111/125
110
4. Employee Stock Option Plan (ESOP)
The Company has established ESOP 1999, ESOP 2000 and ESOP 2004, for a total grant of 20,000,000, 15,000,000 and 20,000,000 optionrespectively to employees of the Company and its subsidiaries. These options are vested over a maximum period of 110 months, 104 monthand 84 months respectively from the date of grant and are to be exercised within a maximum period of five years from the date of vesting.
Each option granted under the above plans entitles the holder to four equity shares of the Company, at an exercise price, which is approved b
the Compensation Committee.As at 30 June 2008 2,822,430 (previous year 3,442,289) options were outstanding with the employees of the Company under the ESOP 199Plan.
Schedules to the consolidated financial statements
(All amounts in crores of rupees except share data and unless otherwise stated)
Schedule 19: Significant Accounting Policies and Notes to the Accounts (Contd.)
Movement in Stock options Year ended Year ended30 June 2008 30 June 2007
Outstanding at the beginning of the year 3,442,289 5,914,361
Add: Granted during the year - -
Less: Forfeited during the year (245,688) (519,995)
Exercised during the year (183,871) (1,564,580)
Expired during the year (190,300) (387,497)
Options outstanding at the end of the year 2,822,430 3,442,289
As at 30 June 2008 4,091,441 (previous year 5,041,132) options were outstanding with the employees of the Company under the ESOP 200Plan.
Movement in Stock options Year ended Year ended30 June 2008 30 June 2007
Outstanding at the beginning of the year 5,041,132 8,453,526
Add: Granted during the year - -
Less: Forfeited during the year (358,796) (898,137)
Exercised during the year (267,275) (2,185,299)
Expired during the year (323,620) (328,958)
Options outstanding at the end of the year 4,091,4414,091,4414,091,4414,091,4414,091,441 5,041,1325,041,1325,041,1325,041,1325,041,132
As at 30 June 2008 3,325,543 (previous year 3,752,886) options were outstanding with the employees of the Company under the ESOP 200Plan.
Movement in Stock options Year ended Year ended30 June 2008 30 June 2007
Outstanding at the beginning of the year 3,752,886 2,669,400
Add: Granted during the year - 1,720,200
Less: Forfeited during the year (210,780) (214,720)
Exercised during the year (213,143) (421,994)
Expired during the year (3,420) -
Options outstanding at the end of the year 3,325,5433,325,5433,325,5433,325,5433,325,543 3,752,8863,752,8863,752,8863,752,8863,752,886
The Company has calculated the compensation cost based on the intrinsic value method i.e. the excess of market price of underlying equitshares on the date of the grant of options over the exercise price of the options given to employees under the employee stock option schemeof the Company is recognized as deferred stock compensation cost and is amortized on a graded vesting basis over the vesting period of thoptions. Had the Company applied the fair value method for determining compensation cost, the impact on net income and earnings per shais provided below:
Year ended Year endedJune 30 2008 June 30 2007
Net income- As reportedNet income- As reportedNet income- As reportedNet income- As reportedNet income- As reported 1,051.411,051.411,051.411,051.411,051.41 1,318.311,318.311,318.311,318.311,318.31
Net income - ProformaNet income - ProformaNet income - ProformaNet income - ProformaNet income - Proforma 1,046.841,046.841,046.841,046.841,046.84 1,298.991,298.991,298.991,298.991,298.99
Earnings per share (Rs.)Earnings per share (Rs.)Earnings per share (Rs.)Earnings per share (Rs.)Earnings per share (Rs.)
Basic - As reported 15.82 20.20
- Proforma 15.76 19.90
Diluted - As reported 15.35 19.46
- Proforma 15.28 19.18

8/7/2019 Indian_GAAP_07-08
http://slidepdf.com/reader/full/indiangaap07-08 112/125
111
Assumptions
The fair value of each share is estimated on the date of grant using the Black-Scholes model with the following assumptions:
Schedules to the consolidated financial statements
(All amounts in crores of rupees except share data and unless otherwise stated)
Schedule 19: Significant Accounting Policies and Notes to the Accounts (Contd.)
The volatility of the share has been determined on the basis of Company’s historical share price for the period of 3 years 6 months. There habeen no grants during the year.
5. Segment Reporting
(i) Business Segments
The operations of the Company and its subsidiaries predominately relate to providing IT services, delivered to customers located globalFurther, subsidiaries are also engaged in the business of rendering networking services including sale of networking equipment, softwaand business processing outsourcing services, which are in the nature of customer contact centers and technical help desks. ThChairman of the Company, who is the Chief Strategy Officer, evaluates the Company’s performance and allocates resources based on aanalysis of various performance indicators by types of service provided by the Company and geographic segmentation of customers
Accordingly, revenue from service segments comprise the primary basis of segmental information set out in these financial statementsSecondary segmental reporting is performed on the basis of the geographical location of customers.
Revenue in relation to service segments is categorised based on items that are individually identifiable to that segment, while expendituris categorised in relation to the associated turnover of the segment. Assets and liabilities are also identified to service segments.
(ii) Geographic Segments
Geographic segmentation is based on the location of the respective client. The principal geographical segments have been classified aAmerica, Europe, India and others. Europe comprises business operations conducted by the Company in the United Kingdom, SwedenGermany, Italy, Belgium, Netherlands, Northern Ireland, Finland, Poland and Switzerland. Since services provided by the Company withthese European entities are subject to similar risks and returns, their operating results have been reported as one segment, nameEurope. India has been identified as a separate segment. All other customers, mainly in Japan, Australia, New Zealand, SingaporMalaysia, Israel, South Korea, China and Hong Kong are included in others.
The Company is presenting only revenue for geographic segments.
(iii) Segment accounting policies
The accounting principles consistently used in the preparation of the financial statements and consistently applied to record revenue anexpenditure in individual segments are as set out in note 1 to this schedule on significant accounting policies. The accounting policies relation to segment accounting are as under:
a) Segment assets and liabilities
All segment assets and liabilities have been allocated to the various segments on the basis of specific identification.
Segment assets consist principally of fixed assets, sundry debtors, loans and advances, cash and bank balances, and unbillereceivables. Segment assets do not include unallocated corporate and treasury assets and net deferred tax assets and advanctaxes.
Segment liabilities include sundry creditors, other liabilities, unsecured loan and secured loan. Segment liabilities do not includshare capital, reserves and provision for taxes.
b) Segment revenue and expenses
Segment revenue is directly attributable to the segment and segment expenses have been allocated to various segments on thbasis of specific identification. However, segment revenue does not include other income. Segment expenses do not includpremium amortized on bonds, diminution allowance in respect of current and trade investments, permanent diminution in case o
long term investments charge taken for stock options issued to employees, corporate expenses and finance cost.
Year endedJune 30 2007
Dividend yield 3.65%
Expected term Up to 35 months
Risk free interest rates 8.10%
Volatility 26.67%
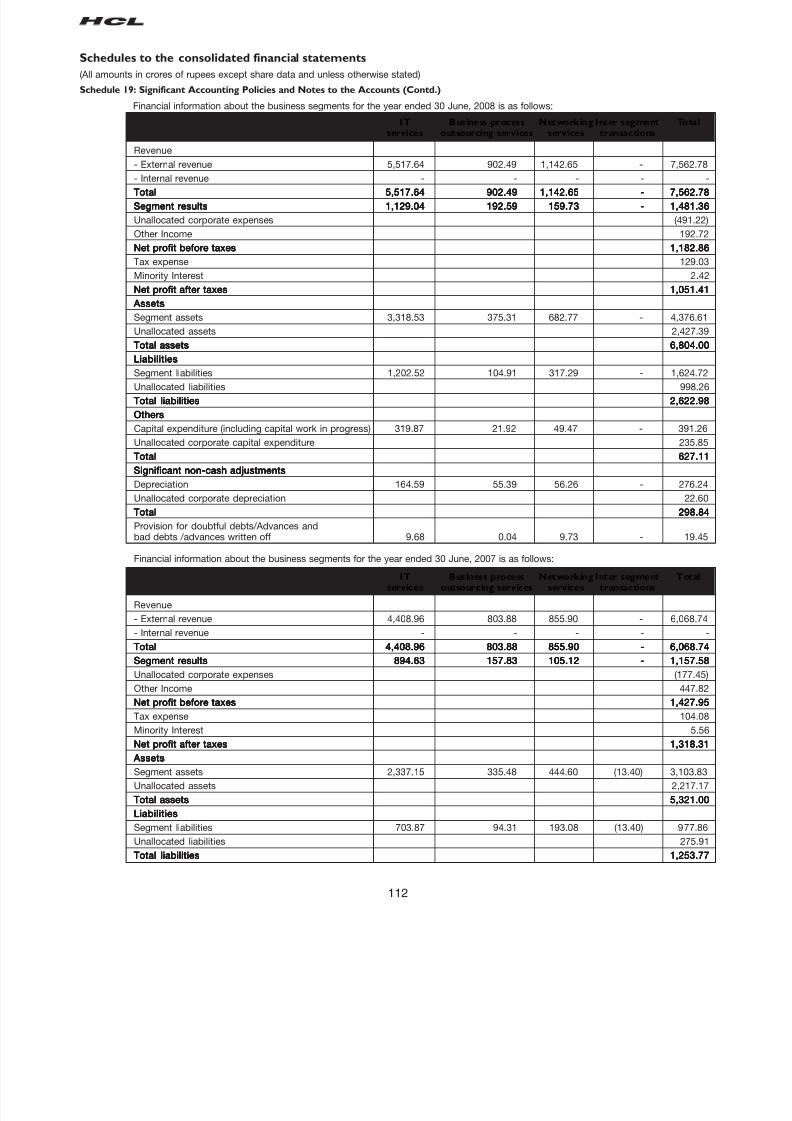
8/7/2019 Indian_GAAP_07-08
http://slidepdf.com/reader/full/indiangaap07-08 113/125
112
IT Business process Networking Inter segment Totalservices outsourcing services services transactions
Revenue
- External revenue 5,517.64 902.49 1,142.65 - 7,562.78
- Internal revenue - - - - -TotalTotalTotalTotalTotal 5,517.645,517.645,517.645,517.645,517.64 902.49902.49902.49902.49902.49 1,142.651,142.651,142.651,142.651,142.65 ----- 7,562.787,562.787,562.787,562.787,562.78
Segment resultsSegment resultsSegment resultsSegment resultsSegment results 1,129.041,129.041,129.041,129.041,129.04 192.59192.59192.59192.59192.59 159.73159.73159.73159.73159.73 ----- 1,481.361,481.361,481.361,481.361,481.36
Unallocated corporate expenses (491.22
Other Income 192.72
Net profit before taxesNet profit before taxesNet profit before taxesNet profit before taxesNet profit before taxes 1,182.861,182.861,182.861,182.861,182.86
Tax expense 129.03
Minority Interest 2.42
Net profit after taxesNet profit after taxesNet profit after taxesNet profit after taxesNet profit after taxes 1,051.411,051.411,051.411,051.411,051.41
AssetsAssetsAssetsAssetsAssets
Segment assets 3,318.53 375.31 682.77 - 4,376.61
Unallocated assets 2,427.39
Total assetsTotal assetsTotal assetsTotal assetsTotal assets 6,804.006,804.006,804.006,804.006,804.00
LiabilitiesLiabilitiesLiabilitiesLiabilitiesLiabilitiesSegment liabilities 1,202.52 104.91 317.29 - 1,624.72
Unallocated liabilities 998.26
Total liabilitiesTotal liabilitiesTotal liabilitiesTotal liabilitiesTotal liabilities 2,622.982,622.982,622.982,622.982,622.98
OthersOthersOthersOthersOthers
Capital expenditure (including capital work in progress) 319.87 21.92 49.47 - 391.26
Unallocated corporate capital expenditure 235.85
TotalTotalTotalTotalTotal 627.11627.11627.11627.11627.11
Significant non-cash adjustmentsSignificant non-cash adjustmentsSignificant non-cash adjustmentsSignificant non-cash adjustmentsSignificant non-cash adjustments
Depreciation 164.59 55.39 56.26 - 276.24
Unallocated corporate depreciation 22.60
TotalTotalTotalTotalTotal 298.84298.84298.84298.84298.84
Provision for doubtful debts/Advances andbad debts /advances written off 9.68 0.04 9.73 - 19.45
Financial information about the business segments for the year ended 30 June, 2007 is as follows:
IT Business process Networking Inter segment Totalservices outsourcing services services transactions
Revenue
- External revenue 4,408.96 803.88 855.90 - 6,068.74
- Internal revenue - - - - -
TotalTotalTotalTotalTotal 4,408.964,408.964,408.964,408.964,408.96 803.88803.88803.88803.88803.88 855.90855.90855.90855.90855.90 ----- 6,068.746,068.746,068.746,068.746,068.74
Segment resultsSegment resultsSegment resultsSegment resultsSegment results 894.63894.63894.63894.63894.63 157.83157.83157.83157.83157.83 105.12105.12105.12105.12105.12 ----- 1,157.581,157.581,157.581,157.581,157.58
Unallocated corporate expenses (177.45
Other Income 447.82
Net profit before taxesNet profit before taxesNet profit before taxesNet profit before taxesNet profit before taxes 1,427.951,427.951,427.951,427.951,427.95
Tax expense 104.08
Minority Interest 5.56
Net profit after taxesNet profit after taxesNet profit after taxesNet profit after taxesNet profit after taxes 1,318.311,318.311,318.311,318.311,318.31
AssetsAssetsAssetsAssetsAssets
Segment assets 2,337.15 335.48 444.60 (13.40) 3,103.83
Unallocated assets 2,217.17
Total assetsTotal assetsTotal assetsTotal assetsTotal assets 5,321.005,321.005,321.005,321.005,321.00
LiabilitiesLiabilitiesLiabilitiesLiabilitiesLiabilities
Segment liabilities 703.87 94.31 193.08 (13.40) 977.86
Unallocated liabilities 275.91
Total liabilitiesTotal liabilitiesTotal liabilitiesTotal liabilitiesTotal liabilities 1,253.771,253.771,253.771,253.771,253.77
Schedules to the consolidated financial statements
(All amounts in crores of rupees except share data and unless otherwise stated)
Schedule 19: Significant Accounting Policies and Notes to the Accounts (Contd.)
Financial information about the business segments for the year ended 30 June, 2008 is as follows:

8/7/2019 Indian_GAAP_07-08
http://slidepdf.com/reader/full/indiangaap07-08 114/125

8/7/2019 Indian_GAAP_07-08
http://slidepdf.com/reader/full/indiangaap07-08 115/125
114
c) Transactions with related parties in the normal course of business.
Particulars Fellow Jointly Others Keysubsidiaries controlled (Significant management
entities influence) personnelYear ended Year ended Year ended Year ended
30 June 30 June 30 June 30 June
2008 2007 2008 2007 2008 2007 2008 2007
Sale of materials and services – – 10.62 10.53 7.31 6.79 – –
Other Receipts – – 0.67 1.57 – – – –
Purchase of materials and services – 0.21 – – 25.36 27.53 – –
Payment for use of facilities – 0.50 0.18 – 1.63 0.97 – –
Loan (net of repayments) – – – – – – – –
Provision for doubtful debts/ advances – – – – – 0.23 – –
Purchase of capital equipments – 0.67 – – 40.67 53.70 – –
Remuneration – – – – – – 3.43 1.39
d) Outstanding balances
Particulars Fellow Jointly Others Keysubsidiaries controlled (Significant management
entities influence) personnelAs at As at As at As at
30 June 30 June 30 June 30 June
2008 2007 2008 2007 2008 2007 2008 2007
Debtors – – 1.67 3.55 2.91 1.73 – –
Other receivables – 0.04 0.15 0.26 4.92 2.93 – –
Creditors – 0.17 – – 6.22 11.83 – –
7. Leases
i) The future lease obligations in respect of vehicles taken on finance lease are as follows:
Total minimum Interest included Present valuelease payments in minimum lease of minimum
outstanding as on payments lease payments30 June 2008
Not later than one year 13.67 3.37 10.30
(8.80) (1.72) (7.08)
Later than one year and not later than 5 years 21.53 4.15 17.38
(13.51) (1.74) (11.77)
35.2035.2035.2035.2035.20 7.527.527.527.527.52 27.6827.6827.6827.6827.68
(22.31) (3.46) (18.85)
Previous year figures are in brackets.
ii) The Company’s significant leasing arrangements are in respect of operating leases for office space and accommodation for its employeeThe aggregate lease rental expense recognized in the profit and loss account for the year amounts to Rs. 211.50 crores (previous yeaRs. 123.19 crores). Future minimum lease payments and payment profile of non-cancellable operating lease are as follows:
Year ended 30 June2008 2007
Not later than one year 163.62 97.83
Later than one year and not later than 5 years 394 .31 242.67
Later than five years 419.47 53.48
Schedules to the consolidated financial statements
(All amounts in crores of rupees except share data and unless otherwise stated)
Schedule 19: Significant Accounting Policies and Notes to the Accounts (Contd.)

8/7/2019 Indian_GAAP_07-08
http://slidepdf.com/reader/full/indiangaap07-08 116/125
115
iii) The Company has given networking equipment to its customers on non-cancellable operating leases for a maximum period of three yearThe lease rental income recognized in the profit and loss account for the year is Rs. 0.48 crores (previous year Rs. 0.54 crores). The futuminimum lease receivables under such operating leases are as follows:
Schedules to the consolidated financial statements
(All amounts in crores of rupees except share data and unless otherwise stated)
Schedule 19: Significant Accounting Policies and Notes to the Accounts (Contd.)
Year ended 30 June2008 2007
Not later than one year - 0.38
Later than one year and not later than 5 years - 0.08
iv) The Company has given networking equipments to its customers on finance lease basis. The future lease payments in respect of assetgiven on finance lease on or after 1 April, 2001 are as follows:
Total minimum Interest included Present valuelease payments in minimum lease of minimumreceivable as on payments receivable lease payments
30 June 2008 receivable
Not later than one year 2.02 0.76 1.26
(2.03) (0.77) (1.26)
Later than one year and not later than 5 years 1.04 0.23 0.81
(1.26) (0.70) (1.56)
3.06 0.99 2.07
(3.29) (1.47) (1.82)
Previous year figures are in brackets.
v) During the year ended 30 June 2006, the Company has entered into a lease agreement for a plot of land and building under which on expirof five year period, lessor was bound to sell and company was required to purchase it. On getting possession of the same in the previouyear, the Company has capitalised the aforesaid property by treating the transaction as a finance lease and amount apportioned to freeholland and building on a fair value basis.
During the current year, the Company has purchased the said land and building at a value of Rs.22.76 crores which has resulted in aadjustment to the values of land and building capitalised earlier on the basis of fair values. Accordingly, addition to freehold land of Rs. 3.5crores (previous year Rs. Nil) and deletion from building of Rs. 4.60 crores (previous year Rs. Nil) has been made.
The total minimum lease payments and maturity profile of finance leases at the Balance Sheet date, the element of interest included in sucpayments, and the present value of the minimum lease payments as of 30 June 2008 are as follows:
Total minimum Interest included Present valuelease payments in minimum lease of minimumoutstanding as on payments lease payments
30 June 2008
Not later than one year - - -
(2.57) (1.38) (1.19)
Later than one year and not later than five years - - -
(25.17) (3.84) (21.33)
- - -
( 27.7427.7427.7427.7427.74) ( 5.225.225.225.225.22) ( 22.5222.5222.5222.5222.52)
Previous year figures are in brackets.
8. Research and Development Expenditure
Year ended Year endedJune 30, 2008 June 30, 2007
Revenue 23.05 12.07
Capital - -
23.0523.0523.0523.0523.05 12.0712.0712.0712.0712.07

8/7/2019 Indian_GAAP_07-08
http://slidepdf.com/reader/full/indiangaap07-08 117/125
116
9. Earnings Per Share (EPS)
The computation of earnings per share is as follows:
Schedules to the consolidated financial statements
(All amounts in crores of rupees except share data and unless otherwise stated)
Schedule 19: Significant Accounting Policies and Notes to the Accounts (Contd.)
Year ended Year endedJune 30, 2008 June 30, 2007
Net profit as per Profit and Loss Account for computation of EPS 1,051.41 1,318.31Weighted average number of equity shares outstanding in computation of basic EPS 664,424,330 652,626,782
Dilutive effect of stock options outstanding 20,528,490 24,760,964
Weighted average number of equity shares and equity equivalent shares outstanding in computing diluted EPS 684,952,820 677,387,746
Nominal value of equity shares (Rs.) 2 2
Earnings per equity shareEarnings per equity shareEarnings per equity shareEarnings per equity shareEarnings per equity share (Rs.)
Basic 15.82 20.20
Diluted 15.35 19.46
10. Employee Benefit Plans
The Company has calculated the various benefits provided to employees as under
A. Defined Contribution Plans and State Plans
Total contribution made by the Company and its subsidiaries during the year in respect of defined contribution and state plans is R47.59 crores.
B. Defined Benefit Plans
a) Gratuity
b) Employers Contribution to Provident Fund
Gratuity
The following table set out the status of the gratuity plan as required under AS 15 (Revised):
Year endedJune 30, 2008
ParticularsParticularsParticularsParticularsParticulars
Defined benefit obligations at period beginning 41.16
Service Cost 10.55
Interest cost 3.82
Actuarial (gain)/loss 5.18
Benefits paid (3.07)
Present value of plan assets -----
Defined benefit obligations at period endDefined benefit obligations at period endDefined benefit obligations at period endDefined benefit obligations at period endDefined benefit obligations at period end 57.6457.6457.6457.6457.64
Liability recognised in the balance sheet 57.6457.6457.6457.6457.64
Expense recognized in Profit and Loss account
Service cost 10.55
Interest cost 3.82
Expected return on plan assets -
Actuarial (gain)/loss 5.34
Net gratuity costNet gratuity costNet gratuity costNet gratuity costNet gratuity cost 19.7119.7119.7119.7119.71
Experience AdjustmentsExperience AdjustmentsExperience AdjustmentsExperience AdjustmentsExperience Adjustments
Plan Liabilities 5.09
AssumptionsAssumptionsAssumptionsAssumptionsAssumptions
Interest rate 8%
Estimated Rate of salary increases 6%-12%
Employers Contribution to Provident Fund
The Guidance on implementing AS 15 , Employee Benefits (revised 2005) issued by Accounting Standard Board (ASB) states benefitinvolving employer established provident funds, which requires interest shortfall to be recompensed are to be considered as definebenefits plans. Pending the issuance of the guidance note from the Actuarial Society of India, the Company’s actuary has expressed ainability to reliable measure provident fund liabilities. Accordingly the company is unable to exhibit the related information.
During the year ended 30 June 2008, the Company has contributed Rs. 36.93 crores towards Employers’ contribution to the ProvideFund.
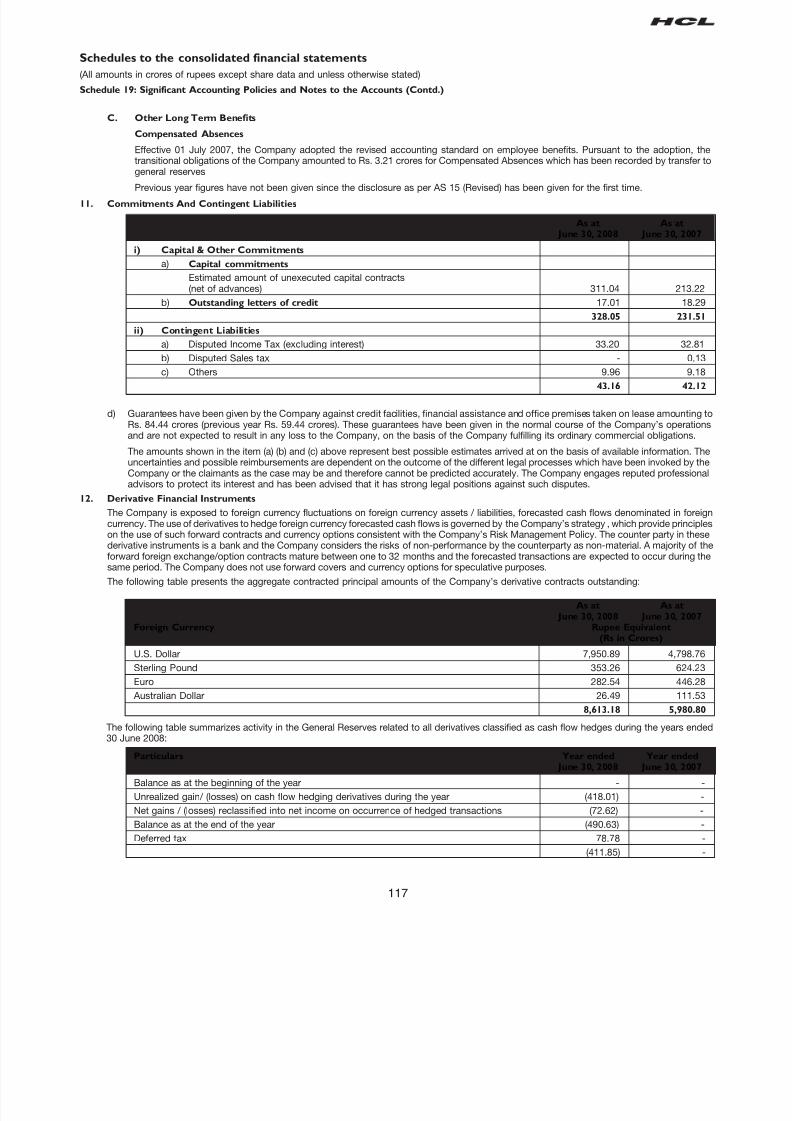
8/7/2019 Indian_GAAP_07-08
http://slidepdf.com/reader/full/indiangaap07-08 118/125
117
C. Other Long Term Benefits
Compensated Absences
Effective 01 July 2007, the Company adopted the revised accounting standard on employee benefits. Pursuant to the adoption, thtransitional obligations of the Company amounted to Rs. 3.21 crores for Compensated Absences which has been recorded by transfer tgeneral reserves
Previous year figures have not been given since the disclosure as per AS 15 (Revised) has been given for the first time.
11. Commitments And Contingent Liabilities
Schedules to the consolidated financial statements
(All amounts in crores of rupees except share data and unless otherwise stated)
Schedule 19: Significant Accounting Policies and Notes to the Accounts (Contd.)
As at As atJune 30, 2008 June 30, 2007
i) Capital & Other Commitments
a) Capital commitments
Estimated amount of unexecuted capital contracts(net of advances) 311.04 213.22
b) Outstanding letters of credit 17.01 18.29
328.05 231.51
ii) Contingent Liabilities
a) Disputed Income Tax (excluding interest) 33.20 32.81
b) Disputed Sales tax - 0.13
c) Others 9.96 9.18
43.16 42.12
d) Guarantees have been given by the Company against credit facilities, financial assistance and office premises taken on lease amounting Rs. 84.44 crores (previous year Rs. 59.44 crores). These guarantees have been given in the normal course of the Company’s operationand are not expected to result in any loss to the Company, on the basis of the Company fulfilling its ordinary commercial obligations.
The amounts shown in the item (a) (b) and (c) above represent best possible estimates arrived at on the basis of available information. Thuncertainties and possible reimbursements are dependent on the outcome of the different legal processes which have been invoked by thCompany or the claimants as the case may be and therefore cannot be predicted accurately. The Company engages reputed professionaadvisors to protect its interest and has been advised that it has strong legal positions against such disputes.
12. Derivative Financial Instruments
The Company is exposed to foreign currency fluctuations on foreign currency assets / liabilities, forecasted cash flows denominated in foreigcurrency. The use of derivatives to hedge foreign currency forecasted cash flows is governed by the Company’s strategy , which provide principleon the use of such forward contracts and currency options consistent with the Company’s Risk Management Policy. The counter party in thes
derivative instruments is a bank and the Company considers the risks of non-performance by the counterparty as non-material. A majority of thforward foreign exchange/option contracts mature between one to 32 months and the forecasted transactions are expected to occur during thsame period. The Company does not use forward covers and currency options for speculative purposes.
The following table presents the aggregate contracted principal amounts of the Company’s derivative contracts outstanding:
As at As atJune 30, 2008 June 30, 2007
Foreign Currency Rupee Equivalent(Rs in Crores)
U.S. Dollar 7,950.89 4,798.76
Sterling Pound 353.26 624.23
Euro 282.54 446.28
Australian Dollar 26.49 111.53
8,613.18 5,980.80
The following table summarizes activity in the General Reserves related to all derivatives classified as cash flow hedges during the years ende30 June 2008:
Particulars Year ended Year endedJune 30, 2008 June 30, 2007
Balance as at the beginning of the year - -
Unrealized gain/ (losses) on cash flow hedging derivatives during the year (418.01) -
Net gains / (losses) reclassified into net income on occurrence of hedged transactions (72.62) -
Balance as at the end of the year (490.63) -
Deferred tax 78.78 -
(411.85) -

8/7/2019 Indian_GAAP_07-08
http://slidepdf.com/reader/full/indiangaap07-08 119/125
118
Schedules to the consolidated financial statements
(All amounts in crores of rupees except share data and unless otherwise stated)
Schedule 19: Significant Accounting Policies and Notes to the Accounts (Contd.)
At 30 June 2008, the estimated net amount of existing gains/ (loss) that is expected to be reclassified into the income statement within the netwelve months is Rs. (78.72) crores.
13. Joint Venture
The Company has an interest in the following jointly controlled entity:
Name of the Company Shareholding Incorporated in
NEC HCL System Technologies Limited 49% India
The aggregate amounts of assets, liabilities, income and expenditure to the extent of the interest of the Company in the above jointly controlleentities are given hereunder:
Year ended Year endedJune 30, 2008 June 30, 2007
Revenue from software services 21.11 8.99
Other income 0.59 0.69
TotalTotalTotalTotalTotal 21.7021.7021.7021.7021.70 9.689.689.689.689.68
Personnel expenses 4.09 1.81
Other expenses 16.56 8.50
Depreciation and amortization 0.43 0.31
TotalTotalTotalTotalTotal 21.0821.0821.0821.0821.08 10.6210.6210.6210.6210.62
Profit/(loss) before TaxProfit/(loss) before TaxProfit/(loss) before TaxProfit/(loss) before TaxProfit/(loss) before Tax 0.620.620.620.620.62 (0.94)(0.94)(0.94)(0.94)(0.94)Provision for tax 0.09 0.05
Net profit/(loss) after taxNet profit/(loss) after taxNet profit/(loss) after taxNet profit/(loss) after taxNet profit/(loss) after tax 0.530.530.530.530.53 (0.99)(0.99)(0.99)(0.99)(0.99)
As at As atJune 30, 2008 June 30, 2007
AssetsAssetsAssetsAssetsAssets
Fixed assets 0.69 0.84
Investments 4.62 5.88
Sundry debtors 6.00 4.20
Cash and bank balances 1.12 0.24
Other Current assets 0.81 0.74
LiabilitiesLiabilitiesLiabilitiesLiabilitiesLiabilities
Current liabilities and provisions 3.27 2.44
Note: NEC HCL System Technologies Limited financial statements are for the period ending 31 March, 2008 and 2007 respectively.
Year ended Year endedJune 30, 2008 June 30, 2007
Statutory audit 3.13 2.08
Tax audit fee 0.32 0.27
Other services - -
3.453.453.453.453.45 2.352.352.352.352.35
Year ended Year endedJune 30, 2008 June 30, 2007
Opening provision 1.58 3.04
Additional provision made during the year 0.87 1.14
Utilisation during the year (1.06) (2.60)
Closing provisionClosing provisionClosing provisionClosing provisionClosing provision 1.391.391.391.391.39 1.581.581.581.581.58
15. Movement In Provision For Warranty
14. Auditor’s Remuneration

8/7/2019 Indian_GAAP_07-08
http://slidepdf.com/reader/full/indiangaap07-08 120/125
119
16. Closing Balance and Maximum balances outstanding with non scheduled banks are as follows:
Schedules to the consolidated financial statements
(All amounts in crores of rupees except share data and unless otherwise stated)
Schedule 19: Significant Accounting Policies and Notes to the Accounts (Contd.)
Closing balance Maximum balance
As at As at Year ended Year endedNon-scheduled Banks 30 June 30 June 30 June 30 June
2008 2007 2008 2007- On Current accountOn Current accountOn Current accountOn Current accountOn Current account
ABN Amro Bank, N.V., Netherlands 5.03 0.85 12.38 1.97
ANZ Bank, Sydney - 5.52 5.52 12.07
Australia and New Zealand Banking Group Ltd., Australia 12.69 7.99 12.69 12.07
Australia and New Zealand Banking Group Ltd., Wellington, New Zealand 8.71 5.20 8.71 7.20
Bank of America, Boston, United States of America 0.32 0.98 0.98 2.76
Bank of Bermud, Bermuda 0.05 0.05 0.05 0.36
Bank of Ireland - collection account, Belfast, Ireland 8.57 5.42 18.46 16.59
BOM, Canada - - - 0.02
Bank of Ireland - payment account, Belfast, Ireland 2.47 0.63 8.96 10.69
The Bank of Bermuda Limited 0.01 0.27 0.29 0.27
Bank of Tokyo - Mitsubishi Ltd., Tokyo, Japan 2.27 7.52 7.52 8.82
Bank of Tokyo - Mitsubishi Ltd., Tokyo, Japan, USD 13.25 4.35 18.28 4.35Bank Brussels Lambert, Brussels, Belgium 0.56 0.67 2.00 1.02
Banque St. Generale, France - 0.01 0.01 0.01
Bank Trust, New York USA - - - 0.44
Bank of Austria, Austria 0.19 0.19 1.49 0.84
Bank of America, CA 0.40 - 4.57 -
Citi Bank N.A. Singapore-SGD 0.23 0.19 0.23 0.21
Citi Bank N.A. Singapore-USD 0.22 0.21 0.22 0.24
Citi National Bank, EUR 0.02 0.01 0.02 0.01
Citi Bank, US $ IB Basic Account 0.00 - 1.60 -
Citi Bank, US $ IB Collection Account 0.22 - 0.49 -
Citi Bank, RMB IB Primary Account 0.28 - 1.14 -
Comercia Bank 8.26 - 21.33 -
Deutsche Bank, New York, United States of America 38.44 30.32 71.52 44.76Deutsche Bank, Singapore 1.26 1.53 2.29 2.73
Deutsche Bank, Singapore (2nd account) - 0.49 - 0.53
Deutsche Bank, London, United Kingdom 21.46 55.31 209.36 106.24
Deutsche Bank, Delaware - - - 37.24
Deutsche Bank, Franco -Euro - - - 0.04
Dresdner Bank, Frankfurt, Germany 4.31 1.33 6.59 5.11
DSL Bank, Frankfurt, Germany 0.03 0.03 0.04 2.67
Fleet Bank, United states of America - 0.12 - 0.28
HANDLOWY - Inco 0.29 0.33 11.50 0.33
Hong Kong & Shanghai Banking Corporation Limited, Hong Kong 0.31 0.39 4.95 5.96
Hong Kong & Shanghai Bank corporation Ltd, Hongkong-USD a/c 0.45 2.72 3.05 3.42
Hong Kong & Shanghai Banking Corporation Limited, Malaysia 0.05 0.02 0.12 0.64
Hong Kong & Shanghai Banking Corporation Limited, Sydney - - - -
Indian Overseas Bank, Singapore, SGD Account 1.46 2.16 14.54 6.44
Indian Overseas Bank, Singapore, USD Account 0.89 - 3.04 0.72
Industrial and Commercial Bank, Singapore, SGD Account 2.19 0.19 7.40 5.21
Kredyt Bank SA- Inco EUR - 0.09 0.10 0.09
Lloyds TSB, London, United Kingdom 3.29 6.47 52.19 29.28
Lloyds TSB, UK 0.76 - 20.65 3.61
PNC Bank 15.45 - 28.12 -
Public Bank Bhd, Malaysia 1.65 1.77 5.04 5.40
SBI International (Mauritius) Ltd., Mauritius - - - 0.01

8/7/2019 Indian_GAAP_07-08
http://slidepdf.com/reader/full/indiangaap07-08 121/125
120
Schedules to the consolidated financial statements
(All amounts in crores of rupees except share data and unless otherwise stated)
Schedule 19: Significant Accounting Policies and Notes to the Accounts (Contd.)
Scotia Bank, Winnipeg, Canada - - - -
South Shore Saving Bank, MA,USA - 1.59 1.59 10.59
Skandinaviska Enskilda Banken AB, Stockholm, Sweden 4.87 1.03 5.26 5.60
Skandinaviska Enskilda Banken AB, Stockholm, Sweden (USD account) 2.00 - 2.79 -
Silicon Valley Bank, CA, USA, United States of America 0.27 1.48 13.22 20.53
Sumitomo Bank limited, Tokyo, Japan 1.13 1.24 1.56 2.07
Suntrust Bank - - - 0.60
St George Bank 0.15 1.44 7.71 3.24
Wells Fargo Bank, CA, United States of America 13.36 25.72 26.89 25.72
Westpac 0.09 0.08 0.09 0.08
TotalTotalTotalTotalTotal 177.91177.91177.91177.91177.91 175.91175.91175.91175.91175.91
- On Deposit accounts- On Deposit accounts- On Deposit accounts- On Deposit accounts- On Deposit accounts
Australia and New Zealand Banking Group Limited, Sydney,Australia –USD account - - - 2.75
Australia and New Zealand Banking Group Limited, Wellington,New Zealand - Call Account - - - 2.12
Australia and New Zealand Banking Group Limited, Sydney,Australia - Cash Management - - - 3.29
Australia and New Zealand Banking Group Limited, Wellington,New Zealand- USD account - - - 0.01
Australia and NZ Banking group Ltd, Sydney, Australia-Term deposit 0.13 0.18 0.13 0.18
Industrial & Commercial bank ,Singapore - - - 0.16
Bank of Austria 2.44 4.22 4.16 5.08
Indian Overseas Bank, Singapore, SGD Account 38.57 12.51 38.57 15.71
Bank of Ireland, Ireland 15.11 13.65 29.12 24.67
South Shore Bank - - - 2.77
Public Bank Bhd, MA, USA 24.73 18.76 27.20 18.76PNC Bank - - 20.23 20.23 20.23
St. George Bank Australia - - - 2.82
Westpac 1.40 0.79 1.40 0.79
Lloyds TSB, UK - 19.39 19.39 19.39
TotalTotalTotalTotalTotal 82.3882.3882.3882.3882.38 89.7389.7389.7389.7389.73
Closing balance Maximum balance
As at As at Year ended Year endedNon-scheduled Banks 30 June 30 June 30 June 30 June
2008 2007 2008 2007
17. Micro, Small and Medium Enterprises
As per information available with the management, the dues payable to enterprises covered under “The Micro, Small and Medium EnterpriseDevelopment Act, 2006” are as follows:
Year ended Year endedJune 30, 2008 June 30, 2007
Particulars Principal Interest Principal Interest
Amount due to Vendor - - - -Principal amount paid beyond the appointed date 0.01 - - -
Interest under normal credit terms - - - - -
Accrued during the year - - - -
Unpaid - - - -
Total Interest payable - - - - -
Accrued during the year - - - -
Unpaid - - - -
This has been determined on the basis of responses received from vendors on specific confirmation sought by the Company in thisregard.
8/7/2019 Indian_GAAP_07-08
http://slidepdf.com/reader/full/indiangaap07-08 122/125
121
Schedules to the consolidated financial statements
(All amounts in crores of rupees except share data and unless otherwise stated)
Schedule 19: Significant Accounting Policies and Notes to the Accounts (Contd.)
18. The Company and its various subsidiaries are required to comply with the local transfer pricing regulations, which are contemporaneous inature. The Company appoints independent consultants annually for conducting a Transfer pricing study to determine whether transactionwith associate enterprises are undertaken, during the financial year, on an arms length basis. Adjustments, if any, arising from the transfepricing study in the respective jurisdictions shall be accounted for as and when the study is completed for the current financial year. Thmanagement is of the opinion that its international transactions are at arms length so that aforesaid legislation will not have any impact on thfinancial statements.
19. Previous year figures have been re-classified/re-grouped to conform to current year’s classifications.
For HCL Technologies Limited
Shiv Nadar T S R SubramanianChairman and Chief Strategy Officer Director
Vineet Nayar Ranjit NarasimhanCEO & Wholetime Director President & CEO - BPO Division
Anil Chanana Manish AnandExecutive Vice President -Finance Deputy Company Secretary
Place: Noida (UP), IndiaDate: 01 August 2008
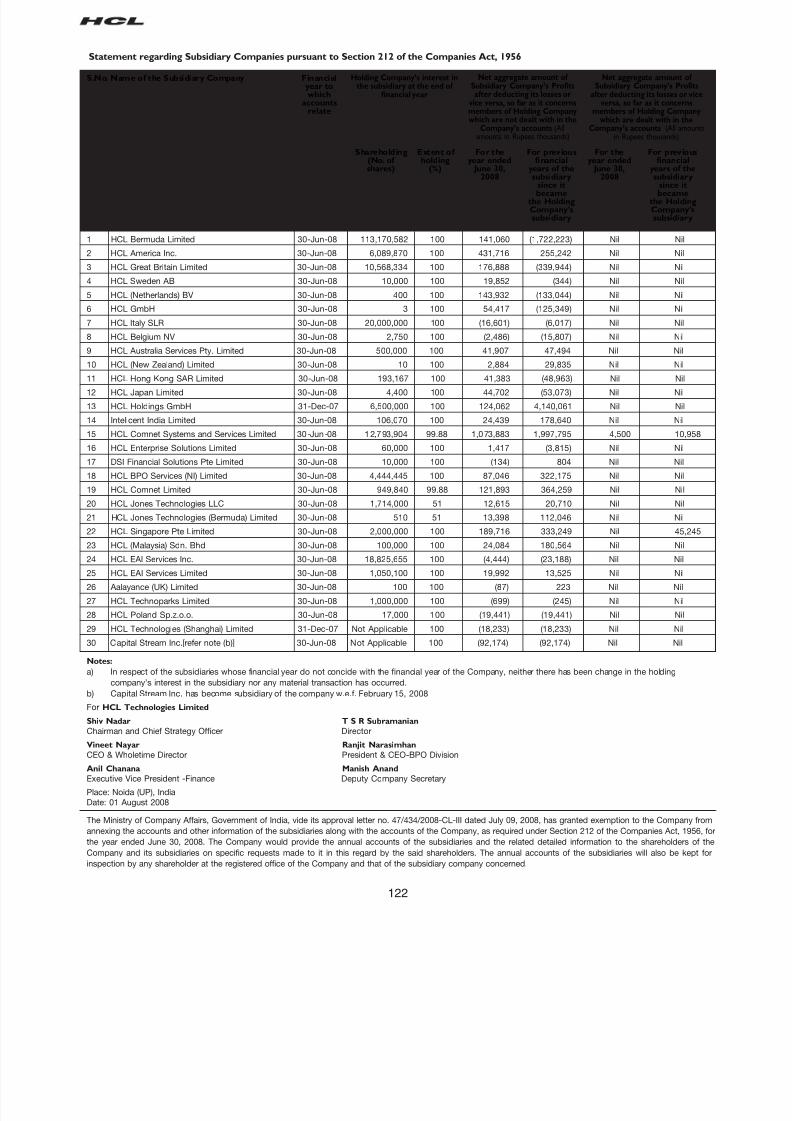
8/7/2019 Indian_GAAP_07-08
http://slidepdf.com/reader/full/indiangaap07-08 123/125
122
Statement regarding Subsidiary Companies pursuant to Section 212 of the Companies Act, 1956
S.No. Name of the Subsidiary Company Financialyear towhich
accountsrelate
Shareholding Extent of For the For previous For the For previous(No. of holding year ended financial year ended financialshares) (%) June 30, years of the June 30, years of the
2008 subsidiary 2008 subsidiarysince it since itbecame became
the Holding the HoldingCompany’s Company’ssubsidiary subsidiary
1 HCL Bermuda Limited 30-Jun-08 113,170,582 100 141,060 (1,722,223) Nil Nil
2 HCL America Inc. 30-Jun-08 6,089,870 100 431,716 255,242 Nil Nil
3 HCL Great Britain Limited 30-Jun-08 10,568,334 100 176,888 (339,944) Nil Nil
4 HCL Sweden AB 30-Jun-08 10,000 100 19,852 (344) Nil Nil
5 HCL (Netherlands) BV 30-Jun-08 400 100 143,932 (133,044) Nil Nil
6 HCL GmbH 30-Jun-08 3 100 54,417 (125,349) Nil Nil
7 HCL Italy SLR 30-Jun-08 20,000,000 100 (16,601) (6,017) Nil Nil
8 HCL Belgium NV 30-Jun-08 2,750 100 (2,486) (15,807) Nil Nil
9 HCL Australia Services Pty. Limited 30-Jun-08 500,000 100 41,907 47,494 Nil Nil
10 HCL (New Zealand) Limited 30-Jun-08 10 100 2,884 29,835 Nil Nil
11 HCL Hong Kong SAR Limited 30-Jun-08 193,167 100 41,383 (48,963) Nil Nil
12 HCL Japan Limited 30-Jun-08 4,400 100 44,702 (53,073) Nil Nil
13 HCL Holdings GmbH 31-Dec-07 6,500,000 100 124,062 4,140,061 Nil Nil
14 Intelicent India Limited 30-Jun-08 106,070 100 24,439 178,640 Nil Nil
15 HCL Comnet Systems and Services Limited 30-Jun-08 12,793,904 99.88 1,073,883 1,997,795 4,500 10,958
16 HCL Enterprise Solutions Limited 30-Jun-08 60,000 100 1,417 (3,815) Nil Nil
17 DSI Financial Solutions Pte Limited 30-Jun-08 10,000 100 (134) 804 Nil Nil
18 HCL BPO Services (NI) Limited 30-Jun-08 4,444,445 100 87,046 322,175 Nil Nil
19 HCL Comnet Limited 30-Jun-08 949,840 99.88 121,893 364,259 Nil Nil
20 HCL Jones Technologies LLC 30-Jun-08 1,714,000 51 12,615 20,710 Nil Nil
21 HCL Jones Technologies (Bermuda) Limited 30-Jun-08 510 51 13,398 112,046 Nil Nil
22 HCL Singapore Pte Limited 30-Jun-08 2,000,000 100 189,716 333,249 Nil 45,245
23 HCL (Malaysia) Sdn. Bhd 30-Jun-08 100,000 100 24,084 180,564 Nil Nil24 HCL EAI Services Inc. 30-Jun-08 18,825,655 100 (4,444) (23,188) Nil Nil
25 HCL EAI Services Limited 30-Jun-08 1,050,100 100 19,992 13,525 Nil Nil
26 Aalayance (UK) Limited 30-Jun-08 100 100 (87) 223 Nil Nil
27 HCL Technoparks Limited 30-Jun-08 1,000,000 100 (699) (245) Nil Nil
28 HCL Poland Sp.z.o.o. 30-Jun-08 17,000 100 (19,441) (19,441) Nil Nil
29 HCL Technologies (Shanghai) Limited 31-Dec-07 Not Applicable 100 (18,233) (18,233) Nil Nil
30 Capital Stream Inc.[refer note (b)] 30-Jun-08 Not Applicable 100 (92,174) (92,174) Nil Nil
Net aggregate amount of Subsidiary Company’s Profits
after deducting its losses or viceversa, so far as it concerns
members of Holding Companywhich are dealt with in the
Company’s accounts (All amountsin Rupees thousands)
Net aggregate amount of Subsidiary Company’s Profitsafter deducting its losses or
vice versa, so far as it concernsmembers of Holding Companywhich are not dealt with in the
Company’s accounts (Allamounts in Rupees thousands)
Holding Company’s interest inthe subsidiary at the end of
financial year
The Ministry of Company Affairs, Government of India, vide its approval letter no. 47/434/2008-CL-III dated July 09, 2008, has granted exemption to the Company fr
annexing the accounts and other information of the subsidiaries along with the accounts of the Company, as required under Section 212 of the Companies Act, 1956
the year ended June 30, 2008. The Company would provide the annual accounts of the subsidiaries and the related detailed information to the shareholders of
Company and its subsidiaries on specific requests made to it in this regard by the said shareholders. The annual accounts of the subsidiaries will also be kept
inspection by any shareholder at the registered office of the Company and that of the subsidiary company concerned.
Notes:
a) In respect of the subsidiaries whose financial year do not concide with the financial year of the Company, neither there has been change in the holding
company’s interest in the subsidiary nor any material transaction has occurred.
b) Capital Stream Inc. has become subsidiary of the company w.e.f. February 15, 2008
For HCL Technologies Limited
Shiv Nadar T S R Subramanian
Chairman and Chief Strategy Officer Director
Vineet Nayar Ranjit Narasimhan
CEO & Wholetime Director President & CEO-BPO Division
Anil Chanana Manish Anand
Executive Vice President -Finance Deputy Company Secretary
Place: Noida (UP), India
Date: 01 August 2008

8/7/2019 Indian_GAAP_07-08
http://slidepdf.com/reader/full/indiangaap07-08 124/125
123
Statement regarding Subsidiary Companies as required by the approval granted under Section 212(8) of the Companies Act, 1956(All amounts in Rupees thousand
S. No. Name of the Subsidiary Company Share Reserves Total Total Investments Turnover Prof it Provison Prof it ProposedCapital Assets Liabilities ( other than before for tax after tax dividend
in subsidiaries)* tax
1 HCL Bermuda Limited 4,870,296 (1,128,682) 3,902,242 160,628 - 271,750 141,060 - 141,060
2 HCL America Inc.[refer note (a) ] 1,208,848 1,177,466 12,917,996 10,531,683 139,045 27,757,829 509,114 77,398 431,716
3 HCL Great Britain Limited 905,452 112,813 7,943,776 6,925,511 - 11,136,041 238,670 61,782 176,888
4 HCL Sweden AB 717 24,048 402,867 378,102 - 334,097 19,852 - 19,852
5 HCL (Netherlands) BV 1,231 (24,362) 656,310 679,440 - 941,687 143,932 - 143,932
6 HCL GmbH 1,743 (83,501) 1,458,998 1,540,755 - 918,261 54,417 - 54,417
7 HCL Italy SLR 678 (24,154) 545 24,021 - 170 (16,601) - (16,601)
8 HCL Belgium NV 4,624 (22,018) 226,406 243,799 - 168,591 (2,486) - (2,486)
9 HCL Australia Services Pty. Limited 20,600 132,745 630,192 476,847 - 2,195,853 67,522 25,615 41,907
10 HCL (New Zealand) Limited 1,514 40,361 330,760 288,885 - 682,462 7,121 4,237 2,884
11 HCL Hong Kong SAR Limited 1,066 (10,561) 131,417 140,912 - 127,606 13,149 (28,235) 41,383
12 HCL Japan Limited 89,650 (6,480) 491,696 408,526 - 1,376,126 78,021 33,319 44,702 13 HCL Holdings GmbH 27,436 4,785,532 4,901,761 88,793 - 206,673 183,471 59,176 124,295
14 Intelicent India Limited 1,061 203,079 206,254 2,115 118,963 31,858 30,743 6,304 24,439
15 HCL Comnet Systems and Services Limited 578,094 3,264,749 5,868,205 2,025,362 207,300 4,953,705 1,121,575 41,897 1,079,678 4,500
16 HCL Enterprise Solutions Limited 2,582 (2,582) - - - 253,850 1,417 - 1,417
17 DSI Financial Solutions Pte Limited 316 4,008 5,098 774 - 146 (134) - (134)
18 HCL BPO Services (NI) Limited 342,789 475,244 1,348,281 530,248 - 2,865,773 140,508 53,462 87,046
19 HCL Comnet Limited 9,499 1,022,677 3,740,778 2,708,602 936,678 3,887,738 180,232 58,192 122,040
20 HCL Jones Technologies LLC 144,631 (28,552) 155,509 39,429 - 337,168 24,735 - 24,735 98,68
21 HCL Jones Technologies (Bermuda) Limited 516 7,513 31,923 23,894 - 81,182 26,270 - 26,270 125,85
22 HCL Singapore Pte Limited 63,231 549,926 965,388 352,230 - 1,575,031 231,148 41,432 189,716
23 HCL (Malaysia) Sdn. Bhd 1,318 274,040 385,308 109,949 - 254,679 31,335 7,251 24,084
24 HCL EAI Services Inc. 140,894 (101,270) 166,832 127,208 - 450,794 (4,444) - (4,444)
25 HCL EAI Services Limited 10,501 65,446 128,516 52,569 - 149,330 22,011 2,019 19,992
26 Aalayance (UK) Limited 9 173 2,237 2,055 - 89 (49) 39 (87)
27 HCL Technoparks Limited 10,000 (944) 167,091 158,035 - - (699) - (699)
28 HCL Poland Sp.z.o.o. 17,203 (24,681) 86,739 94,216 - 123,536 (19,441) - (19,441)
29 HCL Technologies (Shanghai) Limited 32,411 (18,233) 26,942 12,764 - 11,805 (18,233) - (18,233)
30 Capital Stream Inc. [refer note (b)] 1 (5,638) 2,013,269 2,018,907 - 393,105 (73,278) 18,896 (92,174)
Notes:
*All investments are in debt based mutual funds except investment of Rs. 3,880 by HCL America Inc. in the equity of a company.
a) Share capital includes Rs. 946,770,000 the share application money received pending allotment of shares.
b) Capital Stream Inc. has become subsidiary of the company w.e.f. February 15, 2008
For HCL Technologies Limited
Shiv Nadar T S R Subramanian
Chairman and Chief Strategy Officer Director
Vineet Nayar Ranjit Narasimhan
CEO & Wholetime Director President & CEO-BPO Division
Anil Chanana Manish Anand
Executive Vice President -Finance Deputy Company Secretary
Place: Noida (UP), India
Date: 01 August 2008

8/7/2019 Indian_GAAP_07-08
http://slidepdf.com/reader/full/indiangaap07-08 125/125