Embed Size (px)
Citation preview
An Overview Indiana’s Health Care Workforce
Jonathan Barclay, MA Zach Sheff, MPH
Indiana Medicaid Advisory Committee
Aug. 19, 2014

2
Indiana Health Workforce Reports • Methodology
- Survey offered during re-licensure (online) - Match survey response to license data - Inclusion/exclusion criteria
- Active/probationary license status - Responded to survey (& listed IN practice addr) - Reported active work status on survey
http://ahec.iupui.edu/hws
3
Indiana Health Workforce Reports
• Content of Reports - Demographic information - Professional characteristics - Education/credential background - Geographic distribution
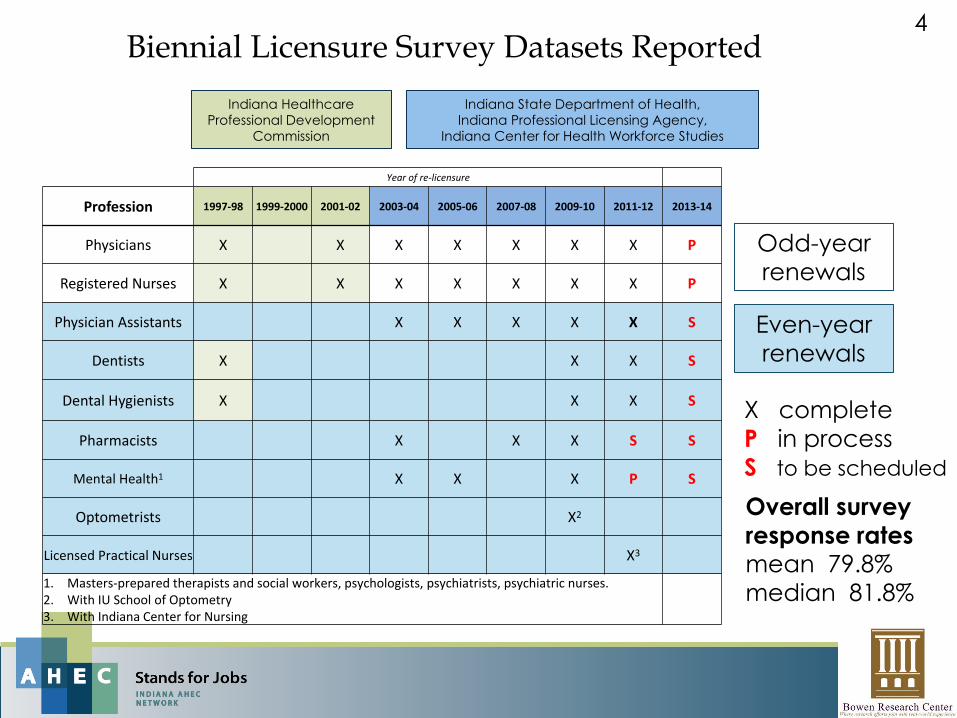
4 Biennial Licensure Survey Datasets Reported
Year of re-licensure
Profession 1997-98 1999-2000 2001-02 2003-04 2005-06 2007-08 2009-10 2011-12 2013-14
Physicians X X X X X X X P
Registered Nurses X X X X X X X P
Physician Assistants X X X X X S
Dentists X X X S
Dental Hygienists X X X S
Pharmacists X X X S S
Mental Health1 X X X P S
Optometrists X2
Licensed Practical Nurses X3
1. Masters-prepared therapists and social workers, psychologists, psychiatrists, psychiatric nurses. 2. With IU School of Optometry 3. With Indiana Center for Nursing
Odd-year renewals
Even-year renewals
X complete P in process S to be scheduled
Indiana Healthcare Professional Development
Commission
Overall survey response rates mean 79.8% median 81.8%
Indiana State Department of Health, Indiana Professional Licensing Agency,
Indiana Center for Health Workforce Studies
5
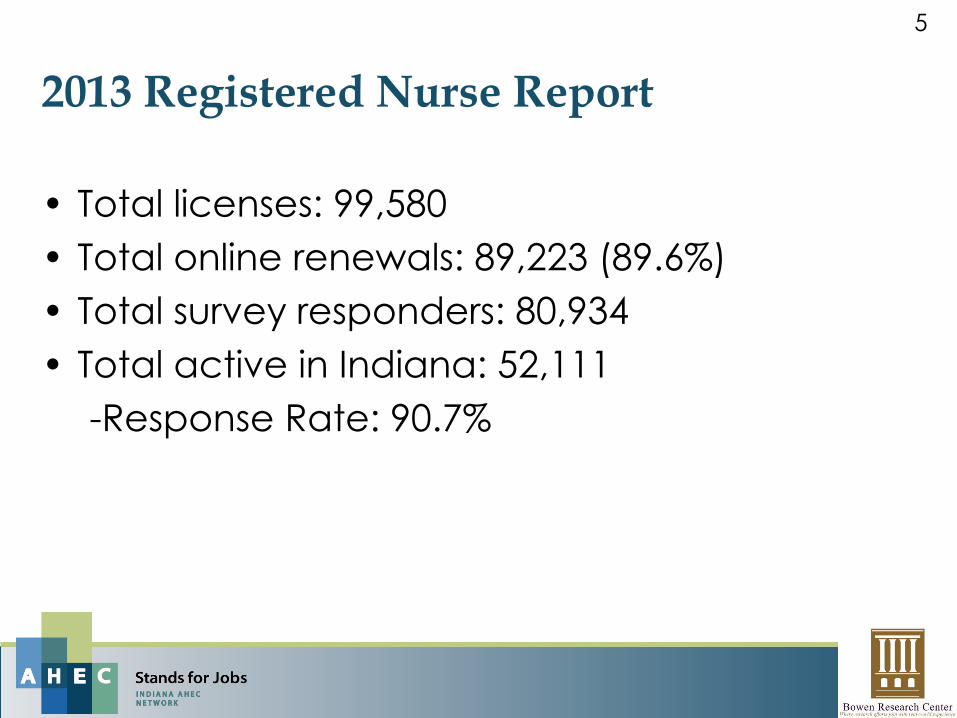
2013 Registered Nurse Report
• Total licenses: 99,580 • Total online renewals: 89,223 (89.6%) • Total survey responders: 80,934 • Total active in Indiana: 52,111
-Response Rate: 90.7%
6
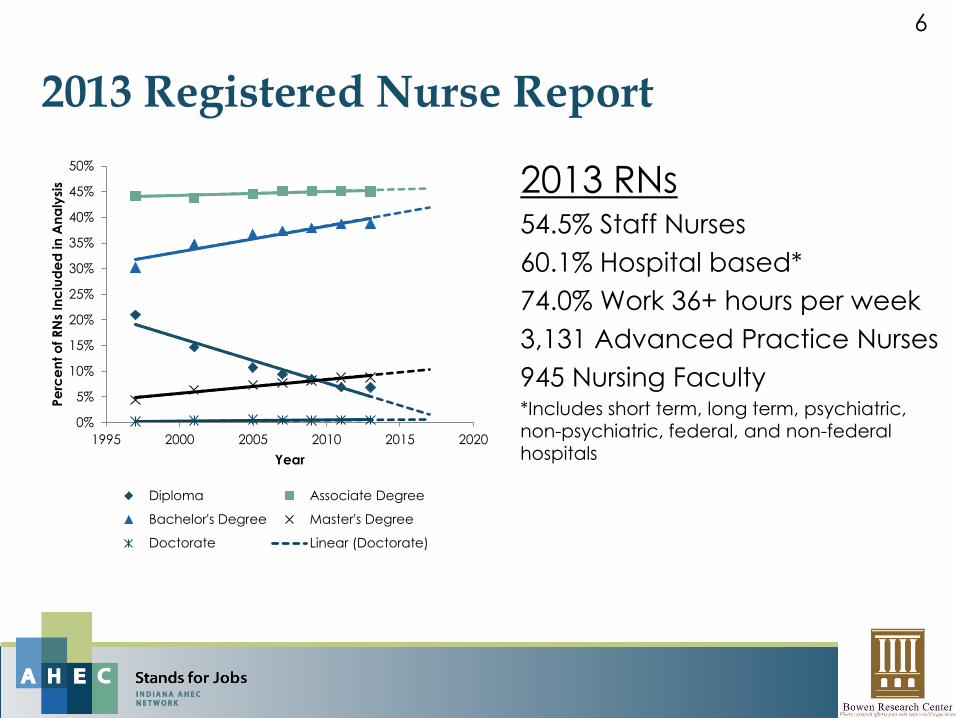
2013 Registered Nurse Report
2013 RNs 54.5% Staff Nurses 60.1% Hospital based* 74.0% Work 36+ hours per week 3,131 Advanced Practice Nurses 945 Nursing Faculty *Includes short term, long term, psychiatric, non-psychiatric, federal, and non-federal hospitals
0%
5%
10%
15%
20%
25%
30%
35%
40%
45%
50%
1995 2000 2005 2010 2015 2020
Perc
ent o
f RN
s Inc
lude
d in
Ana
lysis
Year
Diploma Associate Degree
Bachelor's Degree Master's Degree
Doctorate Linear (Doctorate)
7
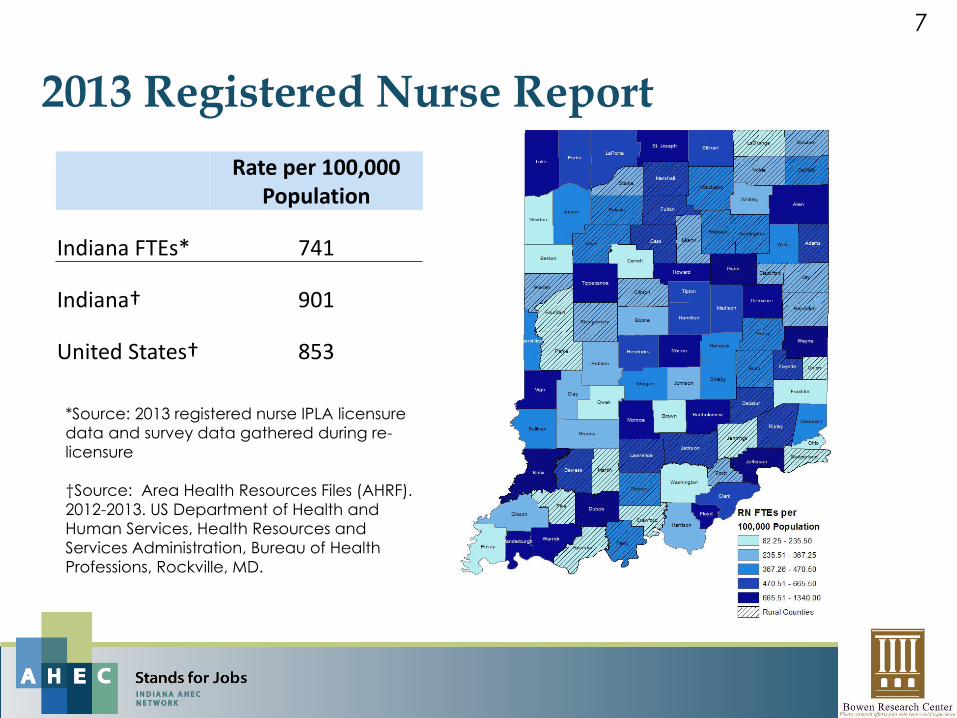
2013 Registered Nurse Report
Rate per 100,000
Population
Indiana FTEs* 741
Indiana† 901
United States† 853
*Source: 2013 registered nurse IPLA licensure data and survey data gathered during re-licensure †Source: Area Health Resources Files (AHRF). 2012-2013. US Department of Health and Human Services, Health Resources and Services Administration, Bureau of Health Professions, Rockville, MD.

8
2012 Dentist Report
• Total licenses: 3,748 • Total online renewals: 3,356 (89.5%) • Total survey responders: 3,025 • Total active in Indiana: 2,314
-Response Rate: 90.1%
9
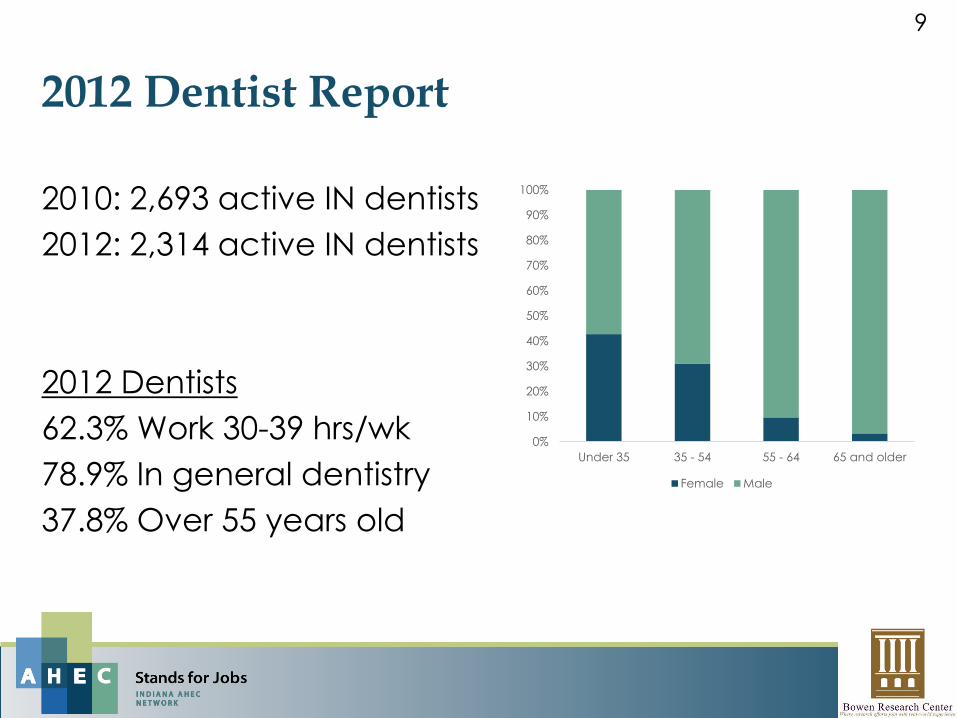
2012 Dentist Report 2010: 2,693 active IN dentists 2012: 2,314 active IN dentists 2012 Dentists 62.3% Work 30-39 hrs/wk 78.9% In general dentistry 37.8% Over 55 years old
0%
10%
20%
30%
40%
50%
60%
70%
80%
90%
100%
Under 35 35 - 54 55 - 64 65 and older
Female Male

10 Rural Counties Report Chronic Barriers to Access to Oral Health Services
Rate per 100,000
Population
Indiana FTEs* 38
Indiana† 24
United States† 30
*Source: 2012 dentist IPLA licensure data and survey data gathered during re-licensure †Source: Area Health Resources Files (AHRF). 2012-2013. US Department of Health and Human Services, Health Resources and Services Administration, Bureau of Health Professions, Rockville, MD.

11 HRSA Shortage Designations can increase access to federal workforce resources
Source: Indiana Primary Health Care Association; http://www.indianapca.org/?page=20

12
2012 Mental Health Report Professions included in report: • Clinical social workers, social workers, marriage
and family therapists, mental health counselors (Licensed Mental Health Professionals)
• Psychologists • Psychiatrists • Psychiatric/Mental Health Advanced Practice
Nurses
13
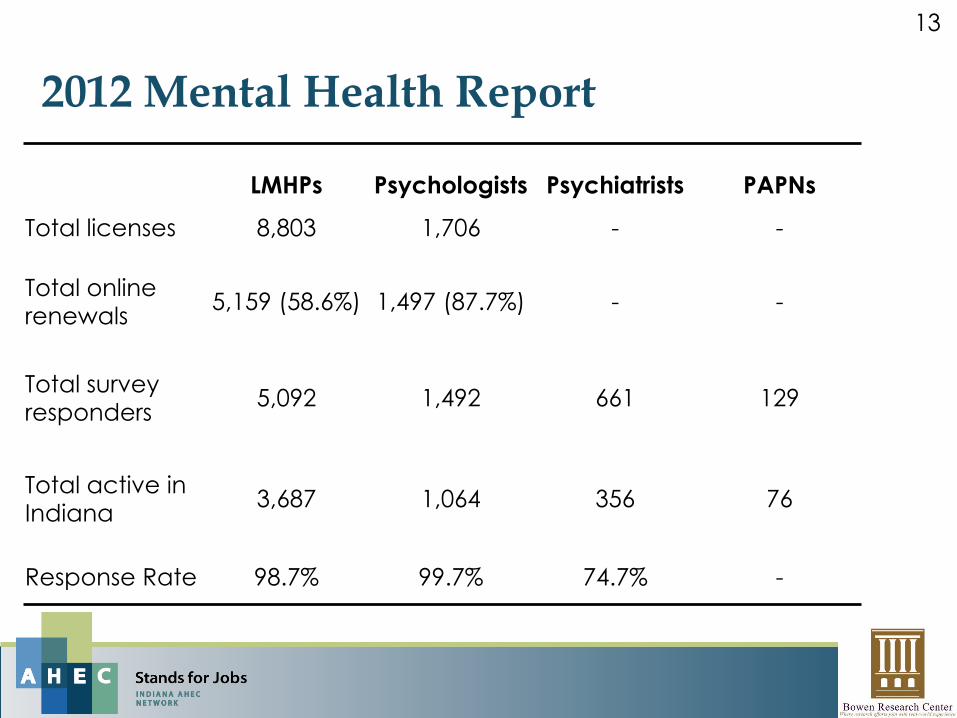
2012 Mental Health Report
LMHPs Psychologists Psychiatrists PAPNs
Total licenses 8,803 1,706 - -
Total online renewals 5,159 (58.6%) 1,497 (87.7%) - -
Total survey responders 5,092 1,492 661 129
Total active in Indiana 3,687 1,064 356 76
Response Rate 98.7% 99.7% 74.7% -
14
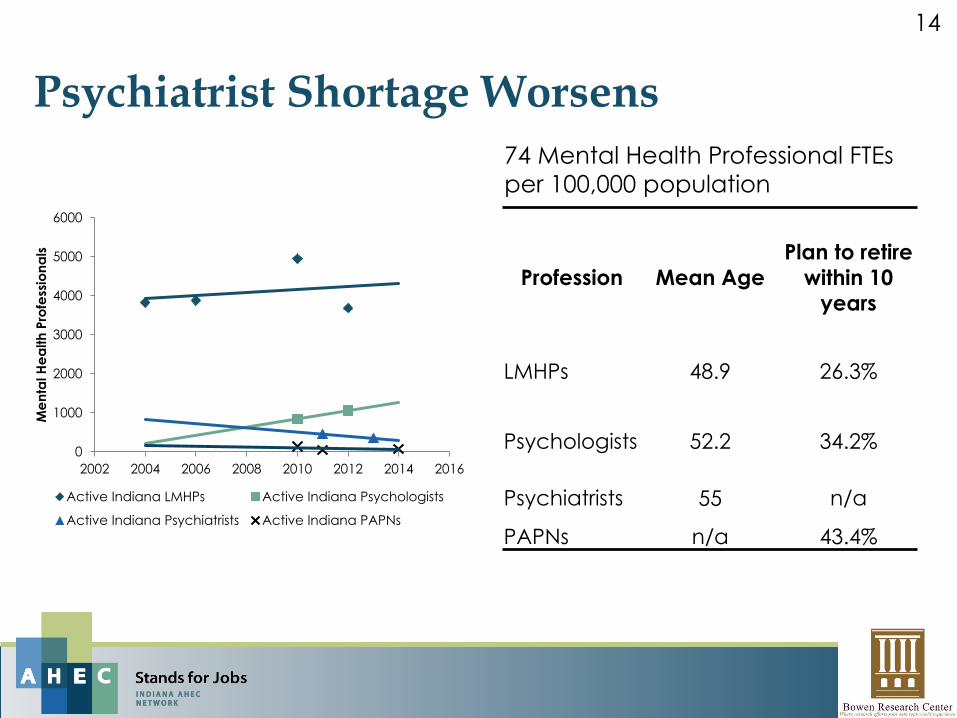
Psychiatrist Shortage Worsens
Profession Mean Age Plan to retire
within 10 years
LMHPs 48.9 26.3%
Psychologists 52.2 34.2%
Psychiatrists 55 n/a
PAPNs n/a 43.4%
74 Mental Health Professional FTEs per 100,000 population
0
1000
2000
3000
4000
5000
6000
2002 2004 2006 2008 2010 2012 2014 2016
Men
tal H
ealth
Pro
fess
iona
ls
Active Indiana LMHPs Active Indiana Psychologists
Active Indiana Psychiatrists Active Indiana PAPNs
15
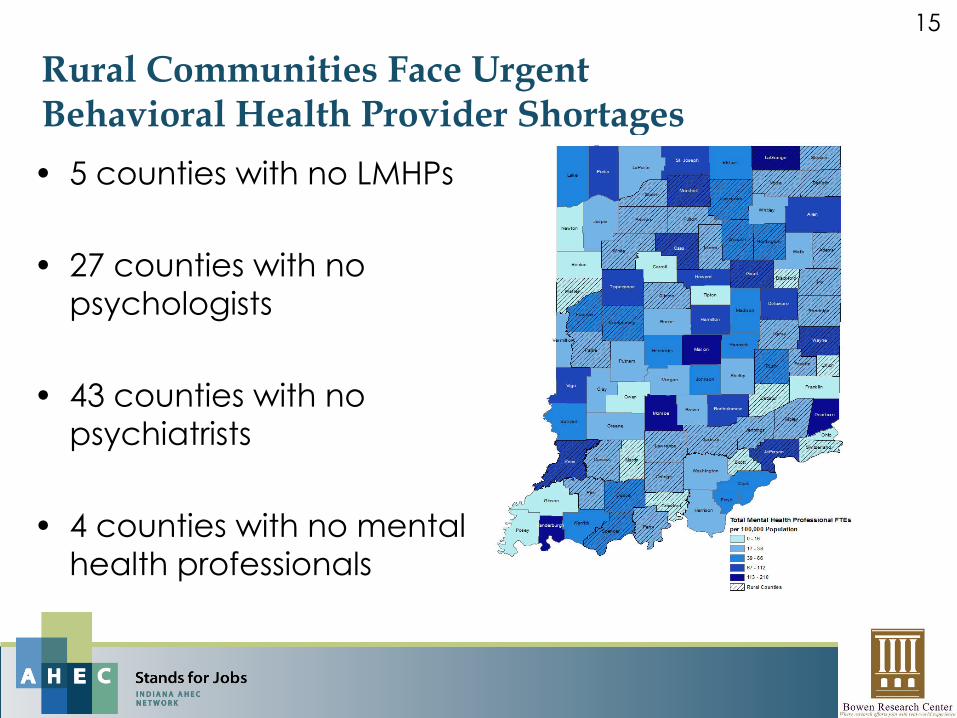
Rural Communities Face Urgent Behavioral Health Provider Shortages • 5 counties with no LMHPs • 27 counties with no
psychologists • 43 counties with no
psychiatrists
• 4 counties with no mental health professionals
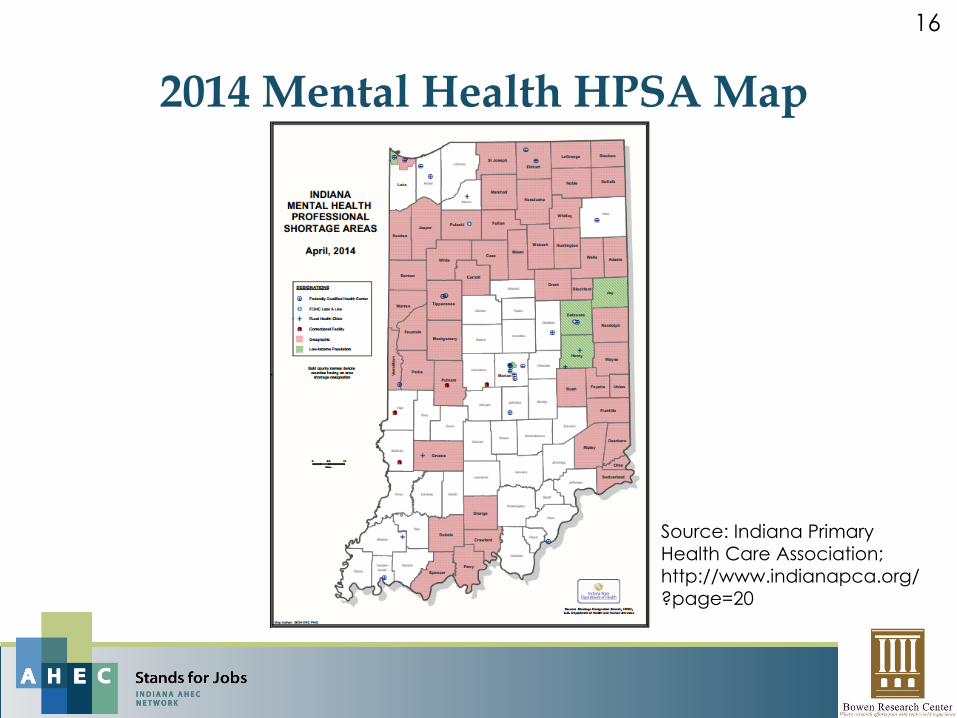
16
2014 Mental Health HPSA Map
Source: Indiana Primary Health Care Association; http://www.indianapca.org/?page=20
17
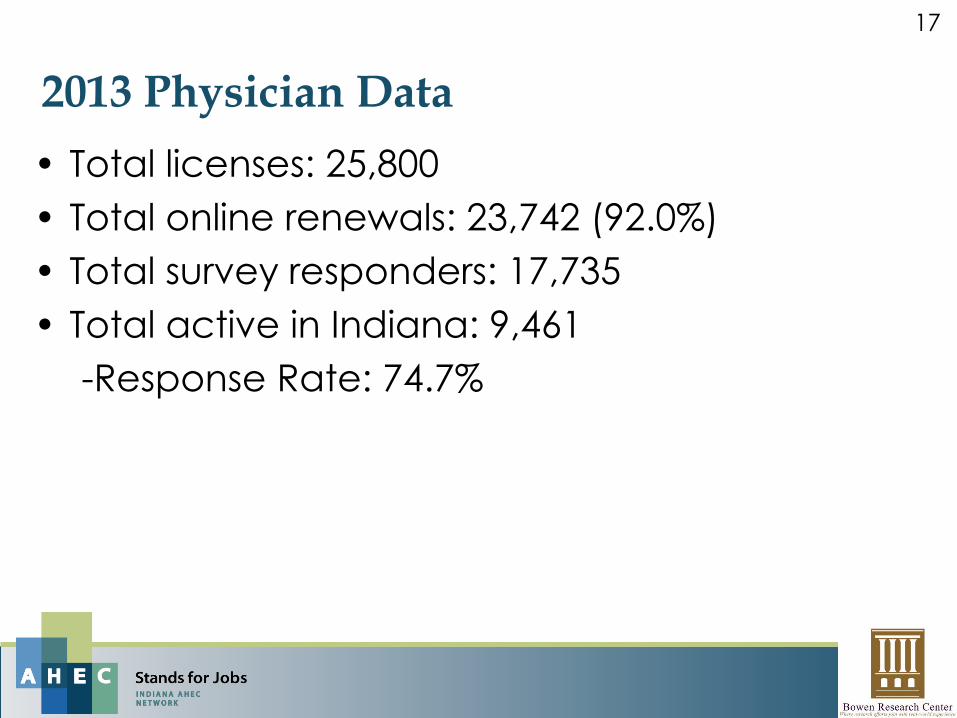
2013 Physician Data • Total licenses: 25,800 • Total online renewals: 23,742 (92.0%) • Total survey responders: 17,735 • Total active in Indiana: 9,461
-Response Rate: 74.7%
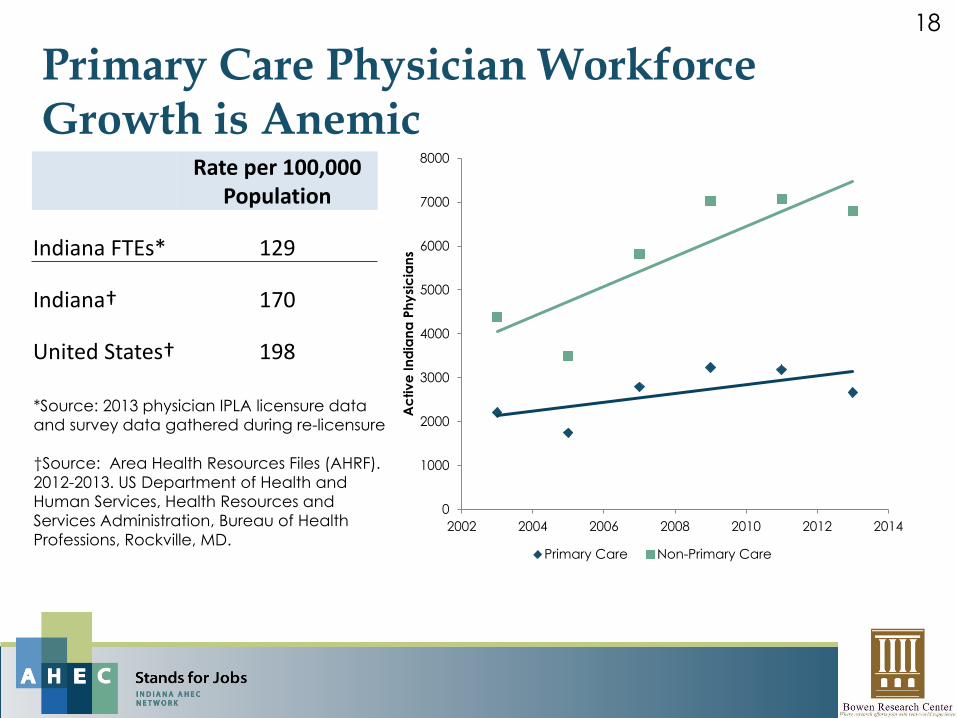
18
Primary Care Physician Workforce Growth is Anemic
0
1000
2000
3000
4000
5000
6000
7000
8000
2002 2004 2006 2008 2010 2012 2014
Act
ive
Indi
ana
Phys
icia
ns
Primary Care Non-Primary Care
Rate per 100,000
Population
Indiana FTEs* 129
Indiana† 170
United States† 198
*Source: 2013 physician IPLA licensure data and survey data gathered during re-licensure †Source: Area Health Resources Files (AHRF). 2012-2013. US Department of Health and Human Services, Health Resources and Services Administration, Bureau of Health Professions, Rockville, MD.
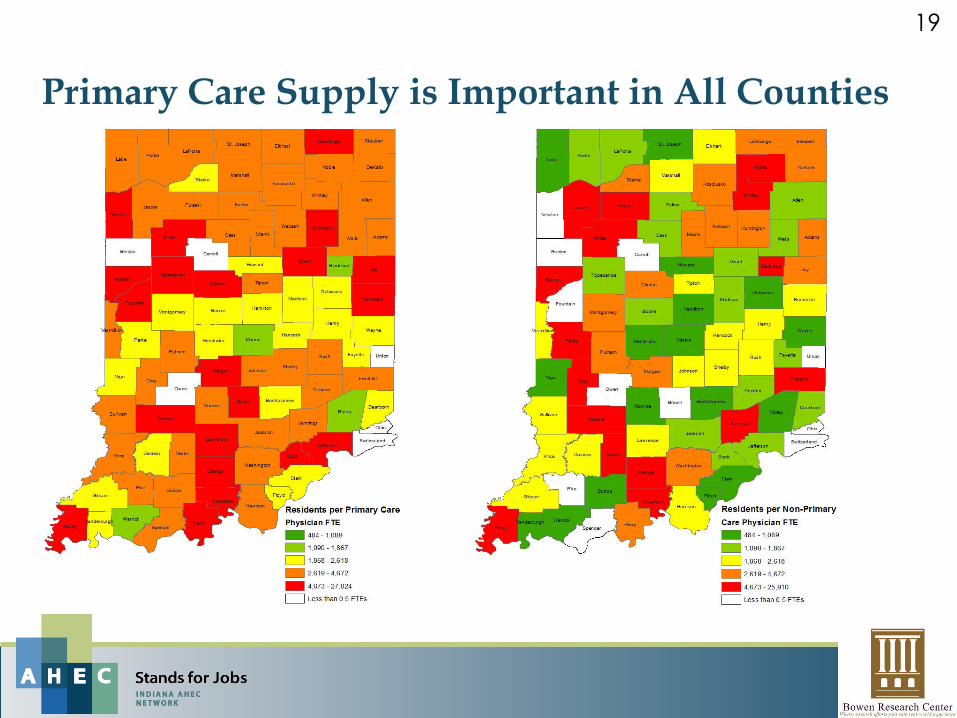
19
Primary Care Supply is Important in All Counties
20
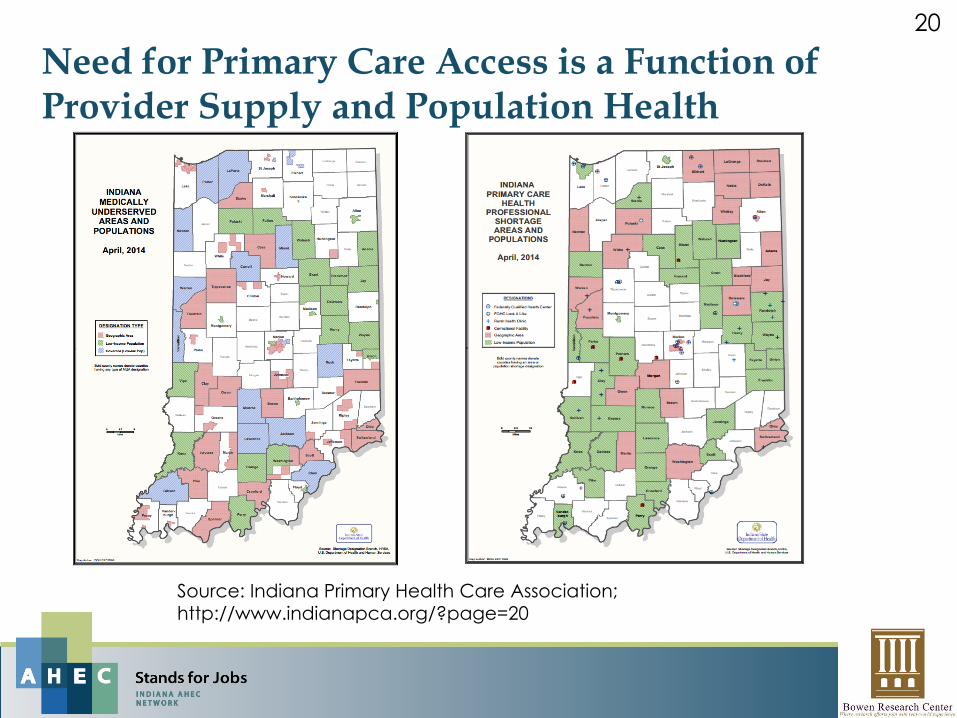
Need for Primary Care Access is a Function of Provider Supply and Population Health
Source: Indiana Primary Health Care Association; http://www.indianapca.org/?page=20
21
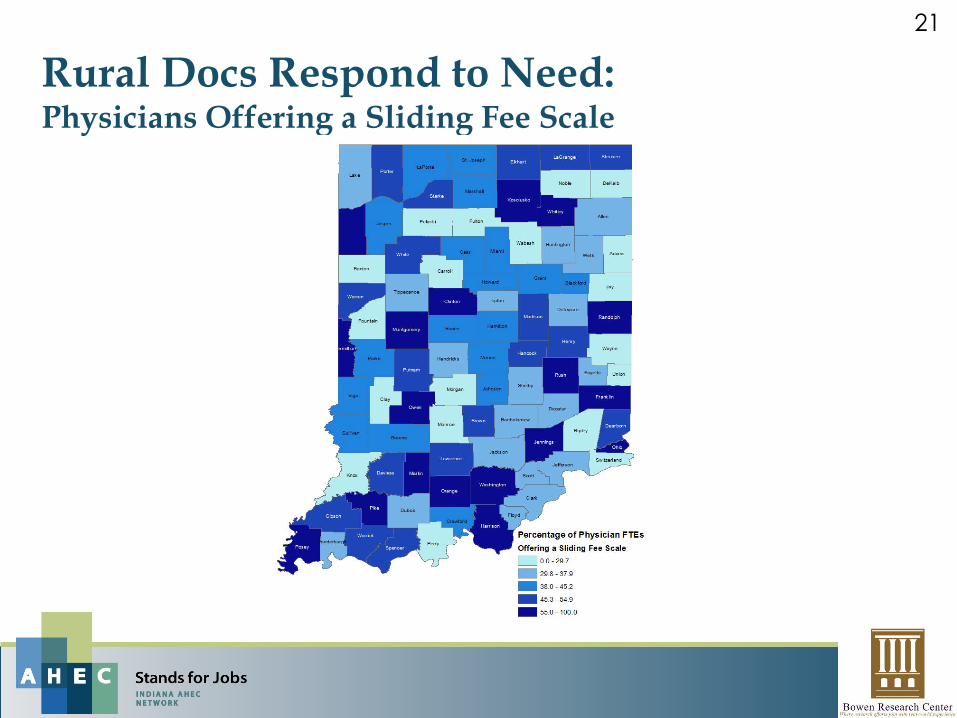
Rural Docs Respond to Need: Physicians Offering a Sliding Fee Scale
22
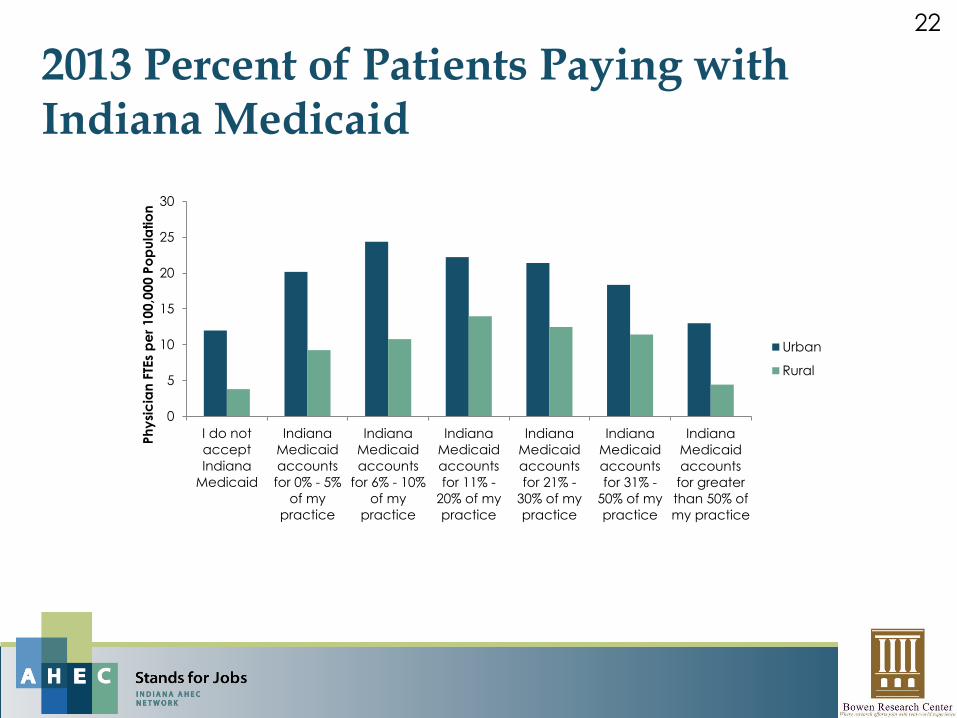
2013 Percent of Patients Paying with Indiana Medicaid
0
5
10
15
20
25
30
I do notacceptIndiana
Medicaid
IndianaMedicaidaccountsfor 0% - 5%
of mypractice
IndianaMedicaidaccounts
for 6% - 10%of my
practice
IndianaMedicaidaccountsfor 11% -
20% of mypractice
IndianaMedicaidaccountsfor 21% -
30% of mypractice
IndianaMedicaidaccountsfor 31% -
50% of mypractice
IndianaMedicaidaccounts
for greaterthan 50% ofmy practice
Phys
icia
n FT
Es p
er 1
00,0
00 P
opul
atio
n
Urban
Rural
23
Questions?
Health Workforce Studies Program Indiana AHEC Network Department of Family Medicine Indiana University School of Medicine
Jonathan Barclay, MA Associate Director (317) 278-8893 [email protected]
Zach Sheff, MPH Project Coordinator (317) 278-9284 [email protected]
Hannah Maxey, PhD Incoming Director [email protected]
http://ahec.iupui.edu/hws