Embed Size (px)
Citation preview
© Center for Business and Economic Research, Ball State University • 1 • www.bsu.edu/cber • www.cberdata.org
CENTER FOR BUSINESS AND ECONOMIC RESEARCH
OCTOBER 26, 2015
About the Author
Michael J. Hicks, PhD, is director of Ball State CBER and the George & Frances Ball distinguished professor of economics in the Miller College of Business. His research interest is in state and local public finance and the effect of public policy on the location, composition, and size of economic activity. Hicks earned doctoral and master’s degrees in economics from the University of Tennessee and a bachelor’s degree in economics from Virginia Military Institute. He is a retired army reserve infantryman.
About Ball State CBER
The Center for Business and Economic Research (CBER) conducts timely economic policy research, analysis, and forecasting for a public audience. We share our insight with the community through the Indiana Economic Outlook and the Ball State Business Roundtable. The CBER Data Center offers primary data sets, data resources for grant writers & economic developers, and a projects & publications library for the public at www.cberdata.org.
Center for Business and Economic Research2000 W. University Ave. (WB 149)Muncie, IN 47306765-285-5926 • [email protected]/cber • www.cberdata.orgfacebook.com/BallStateCBERtwitter.com/BallStateCBER
Center for Business and Economic Research, Ball State University
• Michael J. Hicks, PhD, director, CBER George & Frances Ball distinguished professor of economics, Miller College of Business
Tags: #Education #Indiana
In this study, we explore the question of whether or not there is a K-12 teacher shortage in Indiana by examining changes in both student enrollment patterns and teacher education trends.
Indiana’s Demand & Supply Issues for K-12 Educators
ContentsExecutive Summary . . . . . . . . . . . . . . . . . . . . . . . . . . 2
Introduction . . . . . . . . . . . . . . . . . . . . . . . . . . . . . . 3
Indiana’s Demand for Teachers . . . . . . . . . . . . . . . . . . . 3
Indiana’s Supply of Teachers. . . . . . . . . . . . . . . . . . . . . 7
Do We Have Equilibrium? . . . . . . . . . . . . . . . . . . . . . . 9
Summary and Policy Recommendations . . . . . . . . . . . . . 14
Credits . . . . . . . . . . . . . . . . . . . . . . . . . . . . . . . . 16

© Center for Business and Economic Research, Ball State University • 2 • www.bsu.edu/cber • www.cberdata.org
Executive SummaryKey Findings
Demand for teachers is static or declining.
• Public and private school enrollment in Indiana has been static, with increases in roughly 1/3rd of school corporations and declines in 2/3rds.
• Turnover among employees of primary and secondary schools is near historic lows, and there is no evidence that teachers are leaving due to changes to education policy.
• The peak of baby boom retirements occurred in the years 2012-2014, and does not represent and acute challenge to staffing schools.
There is evidence of an excess supply, not shortage of teachers overall.
• An excess supply of teachers college graduates emerged almost 15 years ago, which has naturally led to enrollment declines in colleges of education.
• There is a long history of alarmism over teacher shortages.
• Teacher employment in Indiana has been remarkably steady since the late 1980s, and the number of new degree holders of bachelor’s degrees from teachers colleges per 100 students in the US have been steady since the mid-1980s.
• For all teachers (not just public school teachers) the period 2010-2013 saw average declines of 3.7 percent, while the number of administrators rose.
• The school years 2013-2014 and 2014-2015 saw growth in both teachers and administrators in Indiana.
• There are 39,000 trained teachers working outside of the education field in Indiana, 16,00 of whom work in lower paid occupations than teaching.
• Teacher shortfalls across the nation appear in disciplines primarily educated outside traditional teachers colleges.
• Indiana’s own job bank from October 2015 suggests no shortage of teachers except perhaps in STEM and special education.
• Several studies identify shortfalls in the number of STEM and special education graduates.
• Teacher attrition is low (17 percent); studies suggest that a large share of trained teachers do not enter the profession after graduating.
• Overall, in Indiana’s school corporations, there is very little evidence of teacher shortfalls, and the hiring and loss of teachers is almost perfectly correlated with the change in enrollment across schools.
• Larger and growing schools seem to have the most difficulty maintaining lower student/teacher ratios as do schools with high administrator/teacher ratios and those with high rates of free and reduced lunch.
• Indiana may have an excess supply of teacher education programs in higher education.
Policy Recommendations • Indiana’s teacher pay ranks 35th in the nation, while per capita income in
Indiana is 38th, but tightening labor markets will require higher wages for Indiana teachers, as early as the 2016-2017 school year. This should be accompanied by compensation rules that allow for market based pay for key disciplines.
• State universities should counsel prospective education majors about the excess supply of teachers.
• Incentives to non-traditional students in STEM fields, technology education and special education may be warranted.
• Licensing restrictions discourage qualified individuals from entering and staying in the classroom, and therefore should be dramatically reduced. Indiana should introduce emergency licensing immediately in fields such as STEM, technology education, and special education.
• Additional resources to fast growing and large school districts may be warranted after future study.
• Small and shrinking school corporations should be incentivized to merge at the corporation level, and should be provided with planning and incentive funds to do so.

© Center for Business and Economic Research, Ball State University • 3 • www.bsu.edu/cber • www.cberdata.org
IntroductionRecent news reports have argued there is a shortage of teachers.
This worry is bolstered by anecdotal evidence from many school corporations that have seen fewer applications for open positions. Moreover, the widely publicized enrollment declines in teacher edu-cation programs that have swept the nation, along with a decline in reported new teacher licensing in Indiana all suggest that fewer men and women are going into teaching through the traditional route. This evidence warrants careful examination.
The common definition of a shortage is that there are fewer teach-ers than required, while the definition of a shortage used by econo-mists would be that something has constrained the labor market for teachers to levels beneath demand for teachers. This policy brief analyzes these conditions.
In this brief I examine the issue of a teacher’s shortage; discuss-ing the supply and demand for teachers using data from the Bureau of the Census, the National Center for Educational Statistics, the Bureau of Labor Statistics, and the Indiana Department of Educa-tion. I first examine the demand for teachers in Indiana, focusing on the geographic disparities in demand that are common in Indiana as in other states. This is followed by an examination of the supply of teachers in Indiana. The final section seeks to reconcile the demand for and supply of teachers in Indiana resolving some, but certainly not all of the questions surrounding the supply and demand for teachers in Indiana. The final section contains policy considerations to address the issue.
Indiana’s Demand for Teachers
In the most recent Census estimates, Indiana had 1.16 million school-aged children (aged 5-17). This was the fifth year of decline of that age group, though population projections have that total ris-ing to 1.23 million by the end of the next decade.[1] Students create the demand for teachers, support staff, and administrators within our public and private educational systems. So, changes to enroll-ment should result in changes in the number of teachers required to educate Hoosier children. Fewer students should mean a lower demand for teachers.
There is a great deal of geographic variation in student popula-tion decline. Across Indiana’s public schools, 93 corporations with more than 364,000 students enrolled in 2011 have seen student population growth. In contrast, 189 corporations enrolling more than 650,000 students (63.8 percent of the total) have declining enrollment. This enrollment mirrors the widely studied decline in population in many Indiana counties.
There are many reasons for declining population. Rapid urbaniza-tion and suburbanization of the US population, changes to the pat-tern of employment opportunities for middle-skilled workers, and regional differences in amenities are well documented reasons for migration.[2] A significant body of research has linked local popula-tion growth with high-quality schools, and particularly higher test scores to district population growth.[3]
1. See Stats Indiana, population projection, 2015-2050. 2. See Molloy, Smith, Wozniak, 2011 for a recent review. 3. See Barkley, Henry and Bao, 1998 for a review and analysis.
© Center for Business and Economic Research, Ball State University • 4 • www.bsu.edu/cber • www.cberdata.org
School Performance and Student Enrollment
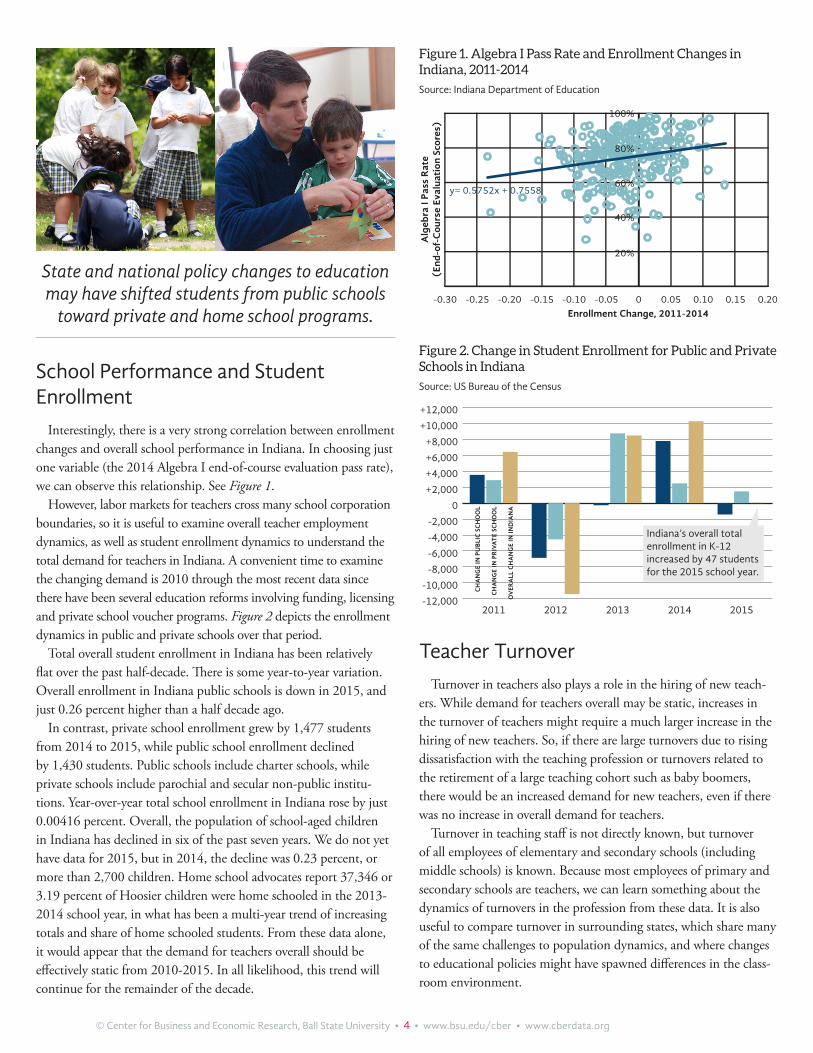
Interestingly, there is a very strong correlation between enrollment changes and overall school performance in Indiana. In choosing just one variable (the 2014 Algebra I end-of-course evaluation pass rate), we can observe this relationship. See Figure 1.
However, labor markets for teachers cross many school corporation boundaries, so it is useful to examine overall teacher employment dynamics, as well as student enrollment dynamics to understand the total demand for teachers in Indiana. A convenient time to examine the changing demand is 2010 through the most recent data since there have been several education reforms involving funding, licensing and private school voucher programs. Figure 2 depicts the enrollment dynamics in public and private schools over that period.
Total overall student enrollment in Indiana has been relatively flat over the past half-decade. There is some year-to-year variation. Overall enrollment in Indiana public schools is down in 2015, and just 0.26 percent higher than a half decade ago.
In contrast, private school enrollment grew by 1,477 students from 2014 to 2015, while public school enrollment declined by 1,430 students. Public schools include charter schools, while private schools include parochial and secular non-public institu-tions. Year-over-year total school enrollment in Indiana rose by just 0.00416 percent. Overall, the population of school-aged children in Indiana has declined in six of the past seven years. We do not yet have data for 2015, but in 2014, the decline was 0.23 percent, or more than 2,700 children. Home school advocates report 37,346 or 3.19 percent of Hoosier children were home schooled in the 2013-2014 school year, in what has been a multi-year trend of increasing totals and share of home schooled students. From these data alone, it would appear that the demand for teachers overall should be effectively static from 2010-2015. In all likelihood, this trend will continue for the remainder of the decade.
Teacher Turnover
Turnover in teachers also plays a role in the hiring of new teach-ers. While demand for teachers overall may be static, increases in the turnover of teachers might require a much larger increase in the hiring of new teachers. So, if there are large turnovers due to rising dissatisfaction with the teaching profession or turnovers related to the retirement of a large teaching cohort such as baby boomers, there would be an increased demand for new teachers, even if there was no increase in overall demand for teachers.
Turnover in teaching staff is not directly known, but turnover of all employees of elementary and secondary schools (including middle schools) is known. Because most employees of primary and secondary schools are teachers, we can learn something about the dynamics of turnovers in the profession from these data. It is also useful to compare turnover in surrounding states, which share many of the same challenges to population dynamics, and where changes to educational policies might have spawned differences in the class-room environment.
Figure 2. Change in Student Enrollment for Public and Private Schools in Indiana
Source: US Bureau of the Census
Figure 1. Algebra I Pass Rate and Enrollment Changes in Indiana, 2011-2014
Source: Indiana Department of Education
-0.30 -0.25 -0.20 -0.15 -0.10 -0.05 0 0.05 0.10 0.15 0.20
20%
40%
60%
80%
100%
y= 0.5752x + 0.7558
Alg
ebra
I P
ass
Rat
e(E
nd-o
f-C
ours
e Ev
alua
tion
Sco
res)
Enrollment Change, 2011-2014
-12,000
-10,000
-8,000
-6,000
-4,000
-2,000
0
+2,000
+4,000
+6,000
+8,000
+10,000
+12,000
CH
AN
GE
IN P
UB
LIC
SC
HO
OL
CH
AN
GE
IN P
RIV
AT
E SC
HO
OL
OV
ERA
LL C
HA
NG
E IN
IND
IAN
A
20152014201320122011
Indiana’s overall total enrollment in K-12 increased by 47 students for the 2015 school year.
State and national policy changes to education may have shifted students from public schools
toward private and home school programs.
© Center for Business and Economic Research, Ball State University • 5 • www.bsu.edu/cber • www.cberdata.org
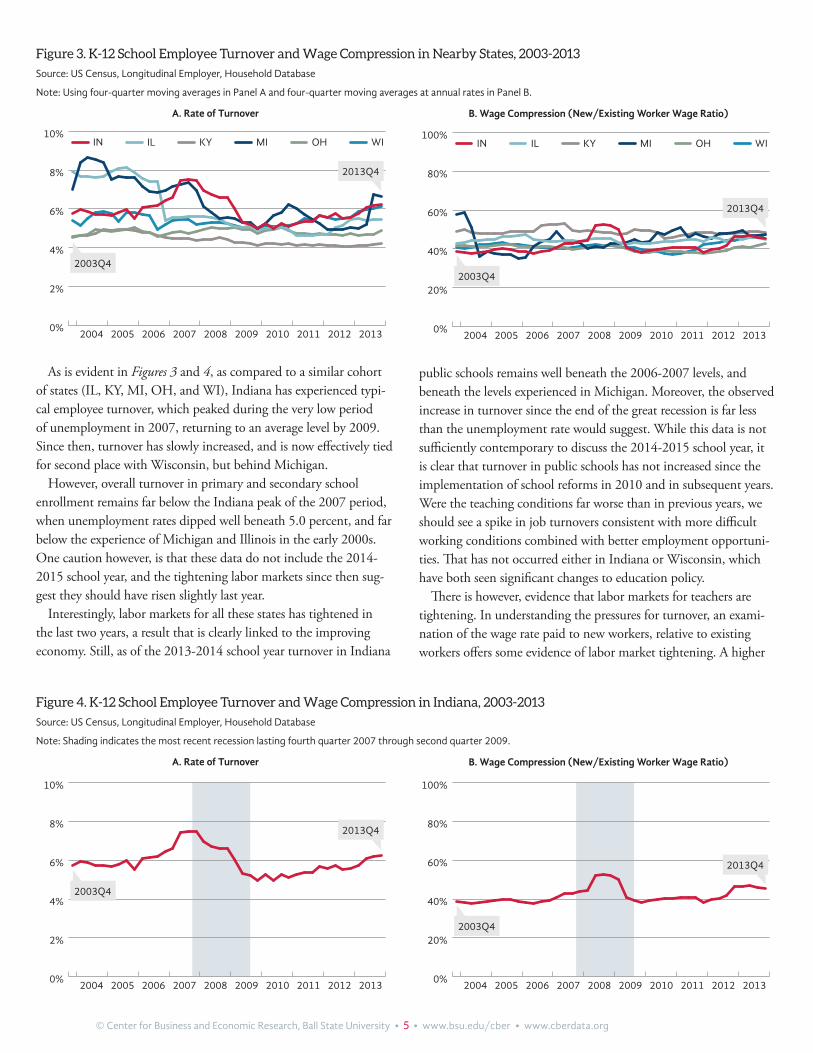
As is evident in Figures 3 and 4, as compared to a similar cohort of states (IL, KY, MI, OH, and WI), Indiana has experienced typi-cal employee turnover, which peaked during the very low period of unemployment in 2007, returning to an average level by 2009. Since then, turnover has slowly increased, and is now effectively tied for second place with Wisconsin, but behind Michigan.
However, overall turnover in primary and secondary school enrollment remains far below the Indiana peak of the 2007 period, when unemployment rates dipped well beneath 5.0 percent, and far below the experience of Michigan and Illinois in the early 2000s. One caution however, is that these data do not include the 2014-2015 school year, and the tightening labor markets since then sug-gest they should have risen slightly last year.
Interestingly, labor markets for all these states has tightened in the last two years, a result that is clearly linked to the improving economy. Still, as of the 2013-2014 school year turnover in Indiana
public schools remains well beneath the 2006-2007 levels, and beneath the levels experienced in Michigan. Moreover, the observed increase in turnover since the end of the great recession is far less than the unemployment rate would suggest. While this data is not sufficiently contemporary to discuss the 2014-2015 school year, it is clear that turnover in public schools has not increased since the implementation of school reforms in 2010 and in subsequent years. Were the teaching conditions far worse than in previous years, we should see a spike in job turnovers consistent with more difficult working conditions combined with better employment opportuni-ties. That has not occurred either in Indiana or Wisconsin, which have both seen significant changes to education policy.
There is however, evidence that labor markets for teachers are tightening. In understanding the pressures for turnover, an exami-nation of the wage rate paid to new workers, relative to existing workers offers some evidence of labor market tightening. A higher
Figure 4. K-12 School Employee Turnover and Wage Compression in Indiana, 2003-2013
Source: US Census, Longitudinal Employer, Household Database
Note: Shading indicates the most recent recession lasting fourth quarter 2007 through second quarter 2009.
Figure 3. K-12 School Employee Turnover and Wage Compression in Nearby States, 2003-2013
Source: US Census, Longitudinal Employer, Household Database
Note: Using four-quarter moving averages in Panel A and four-quarter moving averages at annual rates in Panel B.
A. Rate of Turnover
A. Rate of Turnover
B. Wage Compression (New/Existing Worker Wage Ratio)
B. Wage Compression (New/Existing Worker Wage Ratio)
0%
2%
4%
6%
8%
10%
2003Q4
2013Q4
20132012201120102009200820072006200520040%
20%
40%
60%
80%
100%
2013201220112010200920082007200620052004
2003Q4
2013Q4
0%
20%
40%
60%
80%
100%
2013201220112010200920082007200620052004
2003Q4
2013Q4
WIOHMIKYILIN
0%
2%
4%
6%
8%
10%
2003Q4
2013Q4
2013201220112010200920082007200620052004
WIOHMIKYILIN

© Center for Business and Economic Research, Ball State University • 6 • www.bsu.edu/cber • www.cberdata.org
turnover places pressure on schools to make higher initial salary offerings to teachers, thus causing wage compression, which is an increase in new hire salary relative to existing workers.
As clearer evidence of that, we can examine the changes to turnover rate as compared to the relative wages of new to existing employees. The higher ratio of new to existing workers is termed wage compression, and it is evidence of tightening labor markets for new workers. Higher turnover rates are also suggestive of tighter labor markets. Increased turnover signals a tightening of labor mar-kets, which in turn leads to an increase in wages for new workers.
Age Groups and Teacher Turnover
Finally, we can examine turnover by age in Indiana secondary and elementary schools. Turnover rates for younger workers, who are most likely not teachers, or entry-level teachers dominate the rank-ings. See Figure 5. Turnover rates for workers aged 25 and older are near the average of 6-8 percent in the most recent data. This suggests that most of the workers in these cohorts are indeed teachers, and that the observed higher rates of turnover among younger work-ers are in non-teaching staff positions. These data clearly show no evidence of higher turnover among the teaching staff in Indiana. In fact, current turnover rates of workers aged 25 and older in Indiana primary and secondary schools is as low as it has been in more than a decade. It is clear that experienced teachers are not leaving schools as a result of education reforms implemented in 2010 and later.
Employee replacement concerns for retiring baby boomers are common, but for many occupations, including teaching, the bulk of the baby boom generation has now retired, and millennials and Gen-Xers dominate the labor force. The youngest of the baby boom generation turned 53 this year, and the oldest turn 70. Teacher retire-ments suggest that the worst of the baby boom retirement wave has passed. As of the 2013-2014 school year, 29.6 percent of all school employees were aged 55 or older. This is higher than the national average of all workers, which is roughly 22 percent, but compares favorably to other sectors with a high share of college graduates such as higher education, where 31 percent of workers are 55 or older.
These data are imperfect in that they capture non-teaching staff. However, these data offer evidence of a mild tightening labor mar-kets in K-12 educational institutions, both public and private. This is unsurprising given the improvement in the US and Indiana econ-omies, but these data also offer fatal critiques to the most common concerns expressed about the teaching profession. Turnover among teachers is near historical lows, even with the changes to education policy and the emphasis on school performance in Indiana.
The demand side analysis suggests few problems in the staffing of Indiana schools, and none related to education reforms of the past decade. However, it is likely that with tightening labor markets in the coming years, increased salary and benefits will be required to maintain current quality standards among Indiana school corporations.
Figure 5. Turnover by Age Groups in Indiana Primary and Secondary Schools
Source: US Census, Longitudinal Employer, Household Database
0%
5%
10%
15%
20%
25%
30%
35%
40%
64+
45-5445-54
35-4425-34
22-24
19-21
14-18
2013201220112010200920082007200620052004200320022001
Turnover among teachers is near historical lows, even with the changes to education policy and
the emphasis on school performance in Indiana.
© Center for Business and Economic Research, Ball State University • 7 • www.bsu.edu/cber • www.cberdata.org
Indiana’s Supply of TeachersThe supply of teachers is tightly constrained in public schools
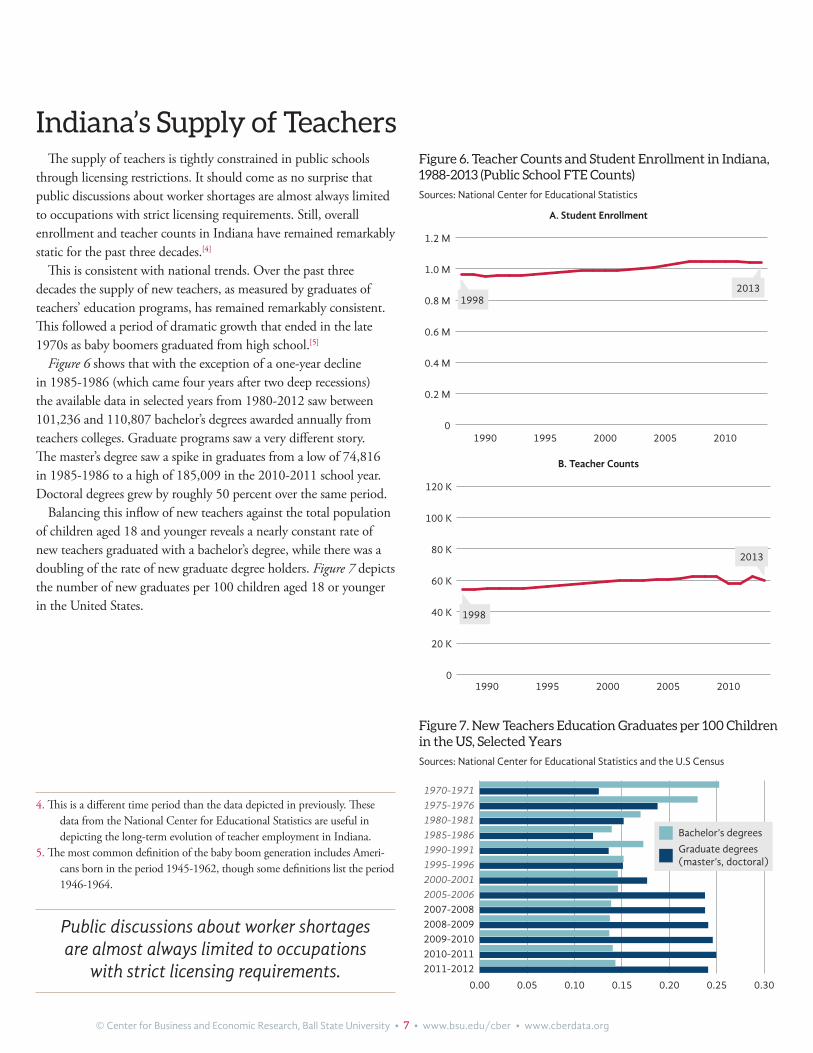
through licensing restrictions. It should come as no surprise that public discussions about worker shortages are almost always limited to occupations with strict licensing requirements. Still, overall enrollment and teacher counts in Indiana have remained remarkably static for the past three decades.[4]
This is consistent with national trends. Over the past three decades the supply of new teachers, as measured by graduates of teachers’ education programs, has remained remarkably consistent. This followed a period of dramatic growth that ended in the late 1970s as baby boomers graduated from high school.[5]
Figure 6 shows that with the exception of a one-year decline in 1985-1986 (which came four years after two deep recessions) the available data in selected years from 1980-2012 saw between 101,236 and 110,807 bachelor’s degrees awarded annually from teachers colleges. Graduate programs saw a very different story. The master’s degree saw a spike in graduates from a low of 74,816 in 1985-1986 to a high of 185,009 in the 2010-2011 school year. Doctoral degrees grew by roughly 50 percent over the same period.
Balancing this inflow of new teachers against the total population of children aged 18 and younger reveals a nearly constant rate of new teachers graduated with a bachelor’s degree, while there was a doubling of the rate of new graduate degree holders. Figure 7 depicts the number of new graduates per 100 children aged 18 or younger in the United States.
Figure 7. New Teachers Education Graduates per 100 Children in the US, Selected Years
Sources: National Center for Educational Statistics and the U.S Census
Figure 6. Teacher Counts and Student Enrollment in Indiana, 1988-2013 (Public School FTE Counts)
Sources: National Center for Educational Statistics
4. This is a different time period than the data depicted in previously. These data from the National Center for Educational Statistics are useful in depicting the long-term evolution of teacher employment in Indiana.
5. The most common definition of the baby boom generation includes Ameri-cans born in the period 1945-1962, though some definitions list the period 1946-1964.
0
0.2 M
0.4 M
0.6 M
0.8 M
1.0 M
1.2 M
20102005200019951990
19982013
0
20 K
40 K
60 K
80 K
100 K
120 K
20102005200019951990
1998
2013
0.00 0.05 0.10 0.15 0.20 0.25 0.30
2011-2012 2010-2011 2009-2010 2008-2009 2007-2008 2005-2006 2000-2001 1995-1996 1990-1991 1985-1986 1980-1981 1975-1976 1970-1971
Graduate degrees (master’s, doctoral)
Bachelor’s degrees
A. Student Enrollment
B. Teacher Counts
Public discussions about worker shortages are almost always limited to occupations
with strict licensing requirements.

© Center for Business and Economic Research, Ball State University • 8 • www.bsu.edu/cber • www.cberdata.org
Changes in Employment
In more recent years, public school employment has also remained relatively static, declining at a rate consistent with declines in public K-12 enrollment. Few US occupations have experienced the nearly static level of employment over the past few decades as have primary and secondary school teachers. See Figure 8.
However, public school enrollment and teacher counts omit private school teachers, staff, and students. Table 1 reports data on school-related occupations for Indiana from the U.S. Bureau of Labor Statistics 2010-2014 Occupational Employment Statistics. These data are collected in May and November, so they represent an average across school years. The most recent data are from Novem-ber 2014, the beginning of the 2014-2015 school year.
These data differ from the public-school-only data, which is important because nearly all of Indiana’s student enrollment growth has been in private schools. Examining subtotals offers a clearer pic-ture. See Table 2. From 2010-2013, there were significant declines in both teachers and staff. Teachers bore the brunt of this decline, with a loss of 3.7 percent per year, on average over that time. Administrators of schools saw employment growth of 0.8 percent per year. However, in the most recent year for which we have data, there was growth in administration and teachers.
Available data on the supply of teachers indicates no nationwide or statewide shortage. On the contrary, the stock of employed teachers and the flow of new teachers in Indiana remain fairly steady. Though teachers college enrollment has declined across the United States in the recent decade, the awarded degrees, and most importantly, the number of employed teachers shows no signs of a shortage.
With neither an increase in demand nor evidence of a short-fall of teachers evident in the aggregate data, there must be some unexplored issues surrounding the argument that we have a teacher shortage in Indiana. To that I now turn my attention.
Table 1. Public and Private K-12 Educational Employment in Indiana, 2010-2014
Source: Occupational Employment Statistics 2010-2014, U.S. Bureau of Labor Statistics
Teachers 2010 2011 2012 2013 2014 Change 2013-2014Average Annual
Change 2010-2014
Preschool teachers, except special education 5,270 5,050 4,820 4,560 4,500 -1.3% -3.7%
Kindergarten teachers, except special education 2,680 2,680 3,100 3,000 2,880 -4.0% 1.9%
Elementary school teachers, except special education 28,030 26,160 24,180 24,800 25,150 1.4% -2.6%
Middle school teachers, except special and career/technical 12,210 11,890 11,350 10,690 9,760 -8.7% -5.0%
Career/technical education teachers, middle school 300 290 290 250 260 4.0% -3.3%
Secondary school teachers, except special and career/technical 22,450 20,010 17,510 16,740 17,670 5.6% -5.3%
Career/technical education teachers, secondary school 1,920 1,550 1,530 1,440 1,460 1.4% -6.0%
Special education teachers, kindergarten and elementary school 3,600 3,340 2,700 2,880 2,870 -0.3% -5.1%
Special education teachers, middle school 1,730 1,580 1,420 1,420 1,290 -9.2% -6.4%
Special education teachers, secondary school 2,560 2,290 1,920 2,030 2,280 12.3% -2.7%
Self-enrichment education teachers 2,160 1,810 2,340 2,570 2,850 10.9% 8.0%
Teacher assistants 26,530 25,690 26,330 25,470 24,680 -3.1% -1.7%
Education administrators, preschool and childcare center/program 640 750 780 810 820 1.2% 7.0%
Education administrators, elementary and secondary school 4,200 4,100 4,020 4,020 4,170 3.7% -0.2%
Table 2. Aggregated Data on Teachers, Staff, and Administrators in Indiana, 2010-2014
Source: Occupational Employment Statistics 2010-2014, U.S. Bureau of Labor Statistics
Employees 2010 2011 2012 2013 2014 Change 2013-2014Average Annual
Change 2010-2014
Teachers and staff 116,290 109,201 104,302 102,693 102,654 0.0% -2.9%
K-12 teachers only 77,640 71,310 66,050 65,570 66,210 1.0% -3.7%
Administrators 4,840 4,850 4,800 4,830 4,990 3.3% 0.8%
Figure 8. Public School Enrollment and Teacher Employment in the US, 2011-2015
Source: Indiana Department of Education
0
20 K
40 K
60 K
80 K
100 K
0
0.2 M
0.4 M
0.6 M
0.8 M
1.0 M
20152014201320122011
Line Chart: Teacher Employment Bar Chart: Student Enrollment
© Center for Business and Economic Research, Ball State University • 9 • www.bsu.edu/cber • www.cberdata.org
Do We Have Equilibrium in the Supply of and Demand for Teachers?
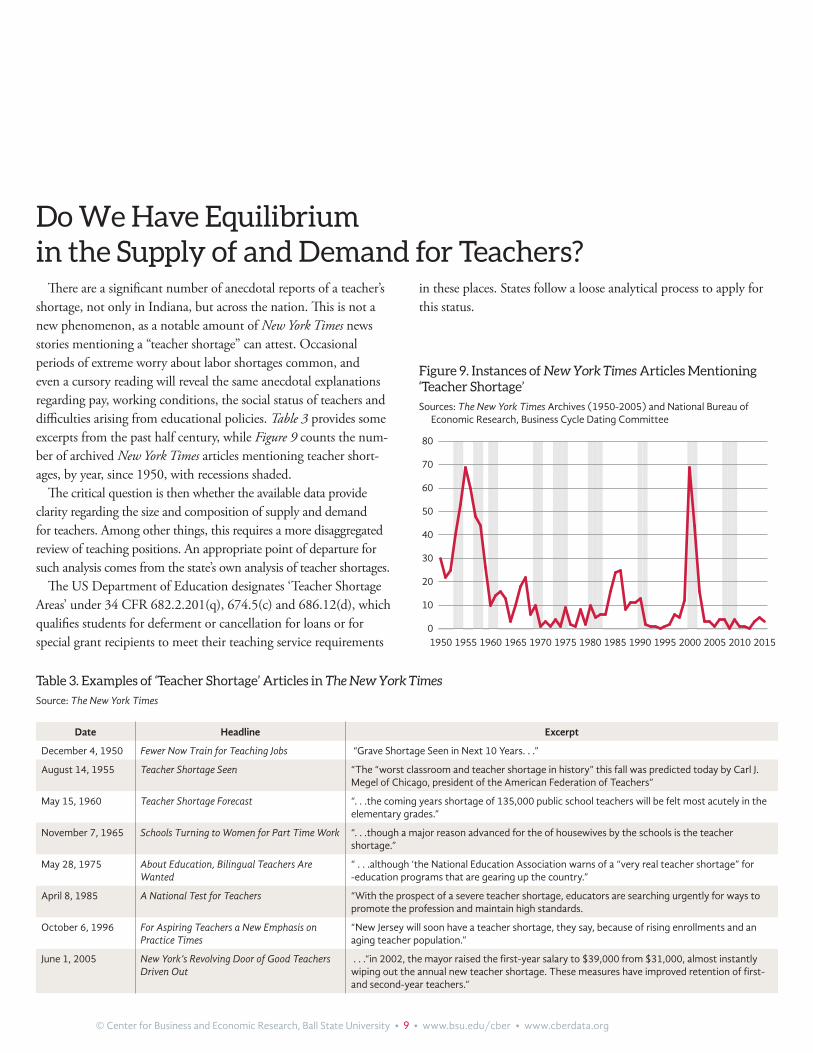
There are a significant number of anecdotal reports of a teacher’s shortage, not only in Indiana, but across the nation. This is not a new phenomenon, as a notable amount of New York Times news stories mentioning a “teacher shortage” can attest. Occasional periods of extreme worry about labor shortages common, and even a cursory reading will reveal the same anecdotal explanations regarding pay, working conditions, the social status of teachers and difficulties arising from educational policies. Table 3 provides some excerpts from the past half century, while Figure 9 counts the num-ber of archived New York Times articles mentioning teacher short-ages, by year, since 1950, with recessions shaded.
The critical question is then whether the available data provide clarity regarding the size and composition of supply and demand for teachers. Among other things, this requires a more disaggregated review of teaching positions. An appropriate point of departure for such analysis comes from the state’s own analysis of teacher shortages.
The US Department of Education designates ‘Teacher Shortage Areas’ under 34 CFR 682.2.201(q), 674.5(c) and 686.12(d), which qualifies students for deferment or cancellation for loans or for special grant recipients to meet their teaching service requirements
in these places. States follow a loose analytical process to apply for this status.
Table 3. Examples of ‘Teacher Shortage’ Articles in The New York Times
Source: The New York Times
Date Headline Excerpt
December 4, 1950 Fewer Now Train for Teaching Jobs “Grave Shortage Seen in Next 10 Years. . .”
August 14, 1955 Teacher Shortage Seen “The “worst classroom and teacher shortage in history” this fall was predicted today by Carl J. Megel of Chicago, president of the American Federation of Teachers”
May 15, 1960 Teacher Shortage Forecast “. . .the coming years shortage of 135,000 public school teachers will be felt most acutely in the elementary grades.”
November 7, 1965 Schools Turning to Women for Part Time Work “. . .though a major reason advanced for the of housewives by the schools is the teacher shortage.”
May 28, 1975 About Education, Bilingual Teachers Are Wanted
“ . . .although ‘the National Education Association warns of a “very real teacher shortage” for -education programs that are gearing up the country.”
April 8, 1985 A National Test for Teachers “With the prospect of a severe teacher shortage, educators are searching urgently for ways to promote the profession and maintain high standards.
October 6, 1996 For Aspiring Teachers a New Emphasis on Practice Times
“New Jersey will soon have a teacher shortage, they say, because of rising enrollments and an aging teacher population.”
June 1, 2005 New York’s Revolving Door of Good Teachers Driven Out
. . .“in 2002, the mayor raised the first-year salary to $39,000 from $31,000, almost instantly wiping out the annual new teacher shortage. These measures have improved retention of first- and second-year teachers.”
0
10
20
30
40
50
60
70
80
20152010200520001995199019851980197519701965196019551950
Figure 9. Instances of New York Times Articles Mentioning ‘Teacher Shortage’
Sources: The New York Times Archives (1950-2005) and National Bureau of Economic Research, Business Cycle Dating Committee
© Center for Business and Economic Research, Ball State University • 10 • www.bsu.edu/cber • www.cberdata.org
Indiana’s Balance
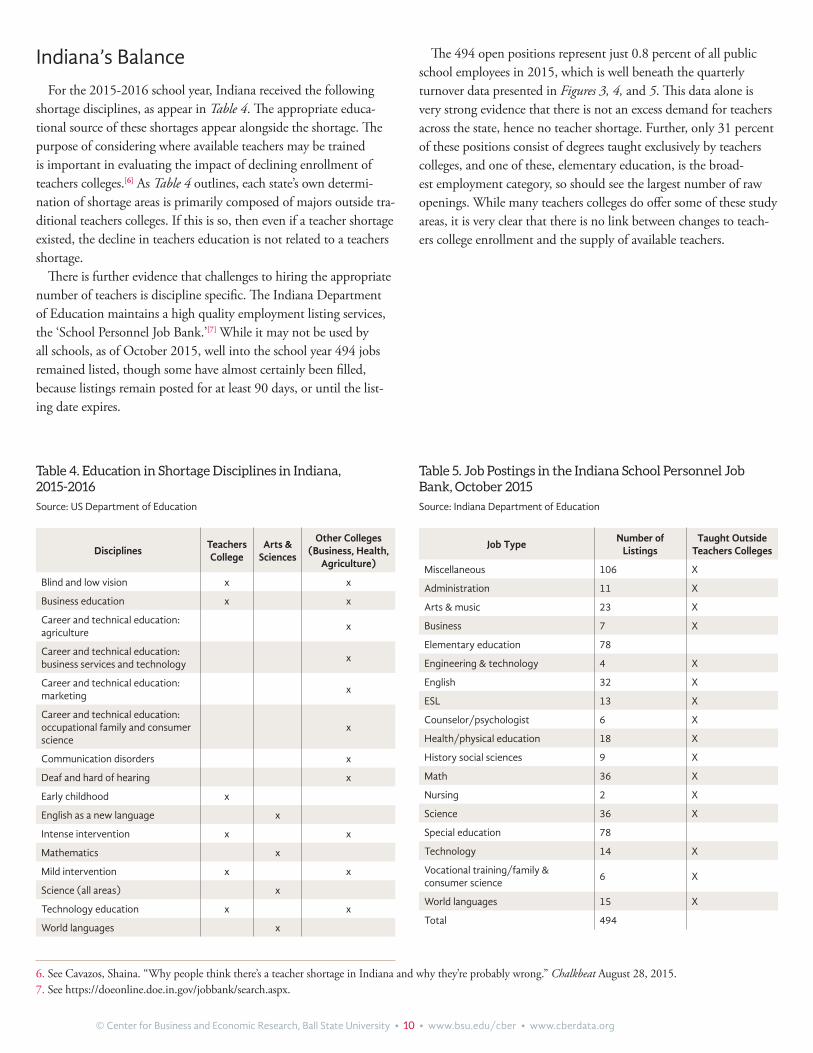
For the 2015-2016 school year, Indiana received the following shortage disciplines, as appear in Table 4. The appropriate educa-tional source of these shortages appear alongside the shortage. The purpose of considering where available teachers may be trained is important in evaluating the impact of declining enrollment of teachers colleges.[6] As Table 4 outlines, each state’s own determi-nation of shortage areas is primarily composed of majors outside tra-ditional teachers colleges. If this is so, then even if a teacher shortage existed, the decline in teachers education is not related to a teachers shortage.
There is further evidence that challenges to hiring the appropriate number of teachers is discipline specific. The Indiana Department of Education maintains a high quality employment listing services, the ‘School Personnel Job Bank.’[7] While it may not be used by all schools, as of October 2015, well into the school year 494 jobs remained listed, though some have almost certainly been filled, because listings remain posted for at least 90 days, or until the list-ing date expires.
The 494 open positions represent just 0.8 percent of all public school employees in 2015, which is well beneath the quarterly turnover data presented in Figures 3, 4, and 5. This data alone is very strong evidence that there is not an excess demand for teachers across the state, hence no teacher shortage. Further, only 31 percent of these positions consist of degrees taught exclusively by teachers colleges, and one of these, elementary education, is the broad-est employment category, so should see the largest number of raw openings. While many teachers colleges do offer some of these study areas, it is very clear that there is no link between changes to teach-ers college enrollment and the supply of available teachers.
Table 5. Job Postings in the Indiana School Personnel Job Bank, October 2015
Source: Indiana Department of Education
Job TypeNumber of
ListingsTaught Outside
Teachers Colleges
Miscellaneous 106 X
Administration 11 X
Arts & music 23 X
Business 7 X
Elementary education 78
Engineering & technology 4 X
English 32 X
ESL 13 X
Counselor/psychologist 6 X
Health/physical education 18 X
History social sciences 9 X
Math 36 X
Nursing 2 X
Science 36 X
Special education 78
Technology 14 X
Vocational training/family & consumer science
6 X
World languages 15 X
Total 494
Table 4. Education in Shortage Disciplines in Indiana, 2015-2016
Source: US Department of Education
DisciplinesTeachers College
Arts & Sciences
Other Colleges (Business, Health,
Agriculture)
Blind and low vision x x
Business education x x
Career and technical education: agriculture
x
Career and technical education: business services and technology
x
Career and technical education: marketing
x
Career and technical education: occupational family and consumer science
x
Communication disorders x
Deaf and hard of hearing x
Early childhood x
English as a new language x
Intense intervention x x
Mathematics x
Mild intervention x x
Science (all areas) x
Technology education x x
World languages x
6. See Cavazos, Shaina. “Why people think there’s a teacher shortage in Indiana and why they’re probably wrong.” Chalkbeat August 28, 2015.7. See https://doeonline.doe.in.gov/jobbank/search.aspx.
© Center for Business and Economic Research, Ball State University • 11 • www.bsu.edu/cber • www.cberdata.org
Competing Opportunities
Reconciling the widespread claims of a teacher shortage with overwhelming and compelling evidence to the contrary must be based upon a skills mismatch, not other factors such as increased turnover, declining teacher enrollment or the retirement of baby boom teachers.
Fortunately, a recent suite of studies have target the jobs mis-match between education majors and available employment within traditional education. A 2005 report by the National Center for Educational Statistics included these findings for teachers college graduates in the 1999-2000 college graduate cohort:
“Working as an educator was common among 1999–2000 gradu-ates: at the time of the 2001 interview, 18 percent of graduates who were working described their occupation as “educator,” a propor-tion exceeded only by the proportion who worked in business or management (Bradburn et al. 2003). However, “educator” was defined broadly, including those who taught at the preschool and postsecondary levels, educators who worked in nonschool settings (e.g, private music teachers, religious educators associated with places of worship), instructional aides, substitute teachers, as well as those who taught any of grades K–12 in an elementary, middle, secondary, or combined school. Defining “teacher” more narrowly, as those who taught any of grades K–12 excluding instructional aides and long- and short-term substitute teachers, 12 percent of gradu-ates had taught in a K–12 school at some point between receiving the 1999–2000 bachelor’s degree and the 2001 interview. This 12 percent of graduates includes 9 percent with state certification, 1 percent with preparation but no certification, and 3 percent with neither certification nor preparation. Another 3 percent of all gradu-ates were certified or had prepared to teach but had not taught.”
—NCES, 2005, pg. 5
This suggests that employment opportunities for graduates of teachers colleges were already far lower than the number of gradu-ates a decade ago. Indeed, fewer than one in five teachers college graduates worked in education (broadly defined) in the 1999-2000 cohort. This alone should have precipitated the resulting nation-wide reduction in teachers college graduates that has been heavily reported upon in recent years. Indeed, it is remarkable that many teachers colleges have not closed, with only one in five recipients of education degrees working as teachers.
This study also suggests, though not conclusively, that the high number of teachers graduates without a teaching job is due to initial entrance in to the ranks of teachers, not attrition. A more recent study reports that attrition from teaching is low, roughly 8 percent over a five-year period (NCES, 2014). This study offered a much fuller examination of new teacher employment dynamics than previous studies.
A 2014 Census study further extended the early graduate experi-ence, by matching data on degree holders and occupation from the American Community Survey. This analysis provided the clearest esti-mate of teachers college graduates, and others working in education.
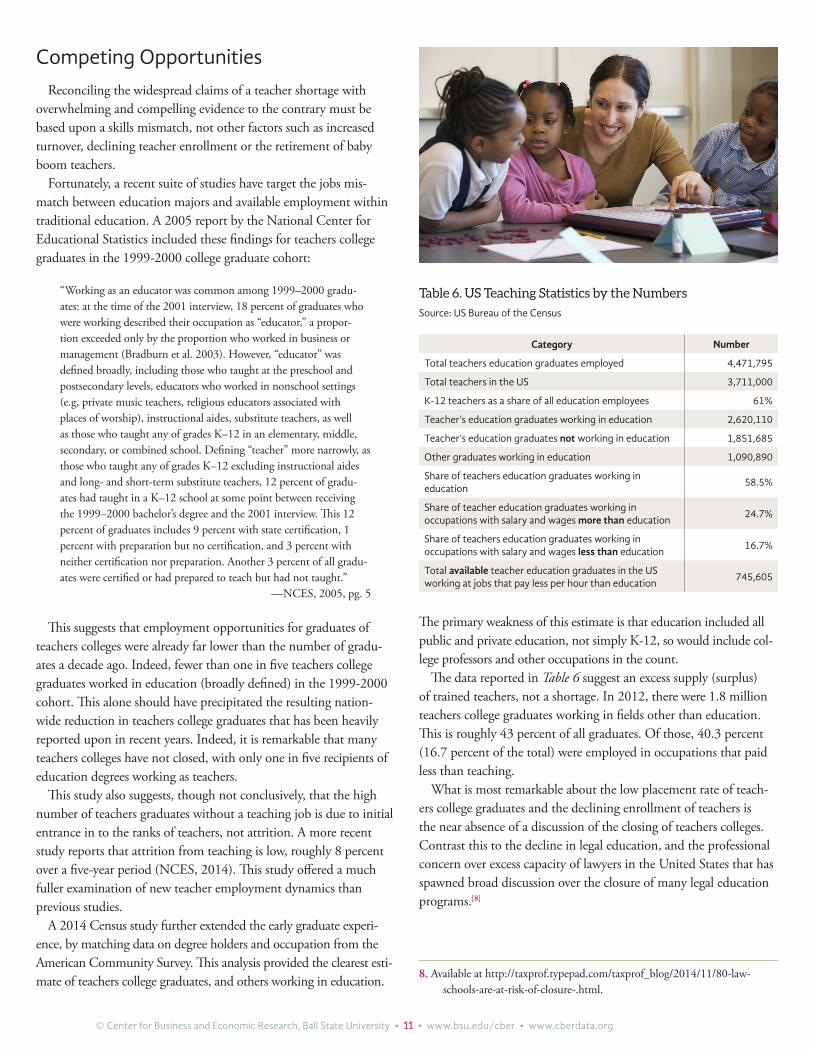
The primary weakness of this estimate is that education included all public and private education, not simply K-12, so would include col-lege professors and other occupations in the count.
The data reported in Table 6 suggest an excess supply (surplus) of trained teachers, not a shortage. In 2012, there were 1.8 million teachers college graduates working in fields other than education. This is roughly 43 percent of all graduates. Of those, 40.3 percent (16.7 percent of the total) were employed in occupations that paid less than teaching.
What is most remarkable about the low placement rate of teach-ers college graduates and the declining enrollment of teachers is the near absence of a discussion of the closing of teachers colleges. Contrast this to the decline in legal education, and the professional concern over excess capacity of lawyers in the United States that has spawned broad discussion over the closure of many legal education programs.[8]
Table 6. US Teaching Statistics by the Numbers
Source: US Bureau of the Census
Category Number
Total teachers education graduates employed 4,471,795
Total teachers in the US 3,711,000
K-12 teachers as a share of all education employees 61%
Teacher’s education graduates working in education 2,620,110
Teacher’s education graduates not working in education 1,851,685
Other graduates working in education 1,090,890
Share of teachers education graduates working in education
58.5%
Share of teacher education graduates working in occupations with salary and wages more than education
24.7%
Share of teachers education graduates working in occupations with salary and wages less than education
16.7%
Total available teacher education graduates in the US working at jobs that pay less per hour than education
745,605
8. Available at http://taxprof.typepad.com/taxprof_blog/2014/11/80-law-schools-are-at-risk-of-closure-.html.
© Center for Business and Economic Research, Ball State University • 12 • www.bsu.edu/cber • www.cberdata.org
There is actually broad evidence that there are too many work-ing adults with degrees in teaching who might have been better prepared in a different academic discipline. For example interpo-lating the national data to Indiana finds that our share of teachers college graduates, who are currently working outside the very broad definition of education, is roughly 39,000. Of these almost 16,000 are working in occupations that pay less than education. This figure represents more than thirty times the available job openings within Indiana’s School Personnel Job Bank, suggesting a broad oversupply of individuals trained as teachers.
At this time, there is more than ample evidence to strongly reject the presence of a teacher shortage across Indiana. Teacher turnover is relatively low, and shows no real sign of increasing after the educa-tion reforms of the past decade. Indiana has an excess supply of trained teachers across the state, 40 percent of whom are working in occupations that pay a lower salary than does teaching. Moreover, the presence of an excess supply of teachers in Indiana explains the decline in enrollment at teachers colleges across the state, in a trend that appears to be nationwide. Indeed, the low initial placement rate of teachers college graduates suggests that the nation is oversupplied by capacity in teacher’s education programs.
However, the very clear excess supply of teachers in Indiana is only in aggregate. There are surely unfilled positions at many schools. Moreover, as Tables 4 and 5 strongly indicate, there may be significant unmet demand for teachers in specialized disciplines. These are likely concentrated in mathematics, science, English, spe-cial education, and emerging STEM and occupation-related areas.
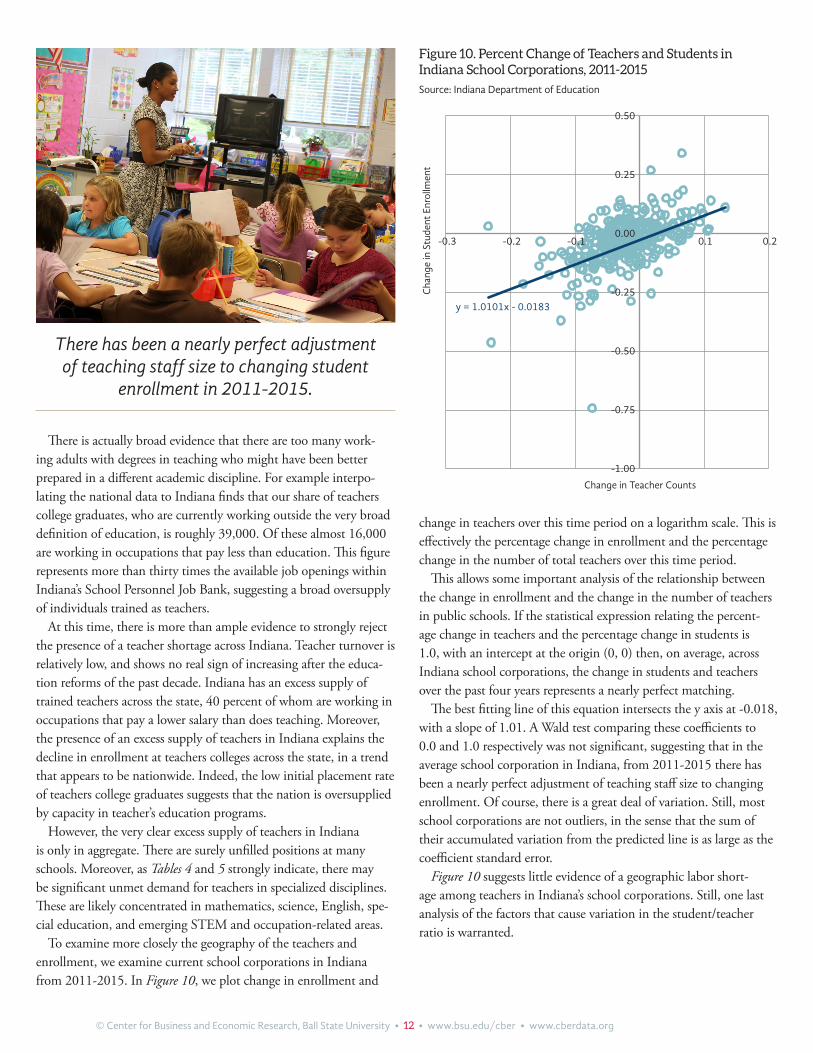
To examine more closely the geography of the teachers and enrollment, we examine current school corporations in Indiana from 2011-2015. In Figure 10, we plot change in enrollment and
change in teachers over this time period on a logarithm scale. This is effectively the percentage change in enrollment and the percentage change in the number of total teachers over this time period.
This allows some important analysis of the relationship between the change in enrollment and the change in the number of teachers in public schools. If the statistical expression relating the percent-age change in teachers and the percentage change in students is 1.0, with an intercept at the origin (0, 0) then, on average, across Indiana school corporations, the change in students and teachers over the past four years represents a nearly perfect matching.
The best fitting line of this equation intersects the y axis at -0.018, with a slope of 1.01. A Wald test comparing these coefficients to 0.0 and 1.0 respectively was not significant, suggesting that in the average school corporation in Indiana, from 2011-2015 there has been a nearly perfect adjustment of teaching staff size to changing enrollment. Of course, there is a great deal of variation. Still, most school corporations are not outliers, in the sense that the sum of their accumulated variation from the predicted line is as large as the coefficient standard error.
Figure 10 suggests little evidence of a geographic labor short-age among teachers in Indiana’s school corporations. Still, one last analysis of the factors that cause variation in the student/teacher ratio is warranted.
Figure 10. Percent Change of Teachers and Students in Indiana School Corporations, 2011-2015
Source: Indiana Department of Education
Change in Teacher Counts
Cha
nge
in S
tude
nt E
nrol
lmen
t
-0.3 -0.2 -0.1 0.1 0.2
-1.00
-0.75
-0.50
-0.25
0.00
0.25
0.50
y = 1.0101x - 0.0183
There has been a nearly perfect adjustment of teaching staff size to changing student
enrollment in 2011-2015.
© Center for Business and Economic Research, Ball State University • 13 • www.bsu.edu/cber • www.cberdata.org
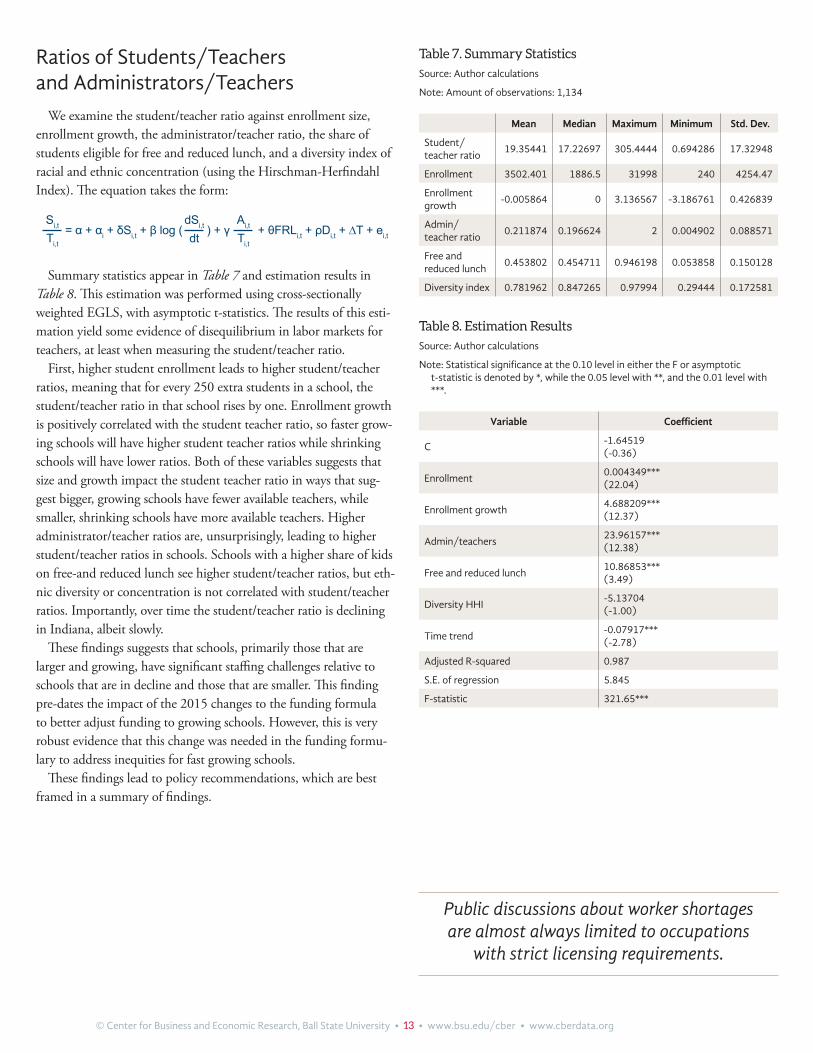
Ratios of Students/Teachers and Administrators/Teachers
We examine the student/teacher ratio against enrollment size, enrollment growth, the administrator/teacher ratio, the share of students eligible for free and reduced lunch, and a diversity index of racial and ethnic concentration (using the Hirschman-Herfindahl Index). The equation takes the form:
Si,t
Ti,t
= α + αi + δSi,t + β log (dSi,t
dt) + γ
Ai,t
Ti,t
+ θFRLi,t + ρDi,t + ∆T + ei,t
Summary statistics appear in Table 7 and estimation results in Table 8. This estimation was performed using cross-sectionally weighted EGLS, with asymptotic t-statistics. The results of this esti-mation yield some evidence of disequilibrium in labor markets for teachers, at least when measuring the student/teacher ratio.
First, higher student enrollment leads to higher student/teacher ratios, meaning that for every 250 extra students in a school, the student/teacher ratio in that school rises by one. Enrollment growth is positively correlated with the student teacher ratio, so faster grow-ing schools will have higher student teacher ratios while shrinking schools will have lower ratios. Both of these variables suggests that size and growth impact the student teacher ratio in ways that sug-gest bigger, growing schools have fewer available teachers, while smaller, shrinking schools have more available teachers. Higher administrator/teacher ratios are, unsurprisingly, leading to higher student/teacher ratios in schools. Schools with a higher share of kids on free-and reduced lunch see higher student/teacher ratios, but eth-nic diversity or concentration is not correlated with student/teacher ratios. Importantly, over time the student/teacher ratio is declining in Indiana, albeit slowly.
These findings suggests that schools, primarily those that are larger and growing, have significant staffing challenges relative to schools that are in decline and those that are smaller. This finding pre-dates the impact of the 2015 changes to the funding formula to better adjust funding to growing schools. However, this is very robust evidence that this change was needed in the funding formu-lary to address inequities for fast growing schools.
These findings lead to policy recommendations, which are best framed in a summary of findings.
Table 8. Estimation Results
Source: Author calculations
Note: Statistical significance at the 0.10 level in either the F or asymptotic t-statistic is denoted by *, while the 0.05 level with **, and the 0.01 level with ***.
Variable Coefficient
C-1.64519 (-0.36)
Enrollment0.004349*** (22.04)
Enrollment growth4.688209*** (12.37)
Admin/teachers23.96157*** (12.38)
Free and reduced lunch10.86853*** (3.49)
Diversity HHI-5.13704 (-1.00)
Time trend-0.07917*** (-2.78)
Adjusted R-squared 0.987
S.E. of regression 5.845
F-statistic 321.65***
Table 7. Summary Statistics
Source: Author calculations
Note: Amount of observations: 1,134
Mean Median Maximum Minimum Std. Dev.
Student/teacher ratio
19.35441 17.22697 305.4444 0.694286 17.32948
Enrollment 3502.401 1886.5 31998 240 4254.47
Enrollment growth
-0.005864 0 3.136567 -3.186761 0.426839
Admin/teacher ratio
0.211874 0.196624 2 0.004902 0.088571
Free and reduced lunch
0.453802 0.454711 0.946198 0.053858 0.150128
Diversity index 0.781962 0.847265 0.97994 0.29444 0.172581
Public discussions about worker shortages are almost always limited to occupations
with strict licensing requirements.
© Center for Business and Economic Research, Ball State University • 14 • www.bsu.edu/cber • www.cberdata.org
Summary and Policy RecommendationsThere is much rhetoric about a looming teacher shortage, but
beyond this anecdote there is no evidence of a teacher shortage in Indiana. Overall enrollment in K-12 schooling has been static over the past half-decade. There is not increased demand for teachers in Indiana, and the number of teachers in Indiana has been among the most stable occupations in the state over the past 30 years. Moreover, teacher turnover rates are near record lows and show no signs of a policy-related increase in quits or new hires. Indeed, turnover among teachers is lower than would be expected given the low unemployment rate in Indiana. However, labor markets are tightening and adjustments to the mechanism and amount of teacher salaries will be an inevitable challenge of public finance in the years to come.
Instead of a teacher shortage, the evidence points to an excess sup-ply of trained teachers in Indiana. It is likely that Indiana has nearly 39,000 trained teachers working outside public education, of which 16,000 are working in occupations that pay less than does teach-ing. Moreover, it seem clear from national studies that over the past generation, only a small share of education majors were working as teachers in the year after graduation. Not surprisingly, the number of students enrolled in teachers colleges has been much smaller in recent years as students seek out training and education with better career prospects.
There is minimal evidence of geographic inequities in teacher avail-ability. On average, each percentage change in student enrollment in Indiana from 2011-2015 has led to an equal percentage change in teacher employment. This outcome is predictable given the recent policy changes that insure dollars follow students, and is a remark-able testament to the geographic equity this policy has generated.
The last piece of analysis reports that higher student/teacher ratios are largely the result of larger, faster growing schools, and schools with higher administrator to teacher ratios along with schools with higher shares of free and reduced lunch. These issues were addressed by the 2015 General Assembly, so recent changes cannot be evaluated.
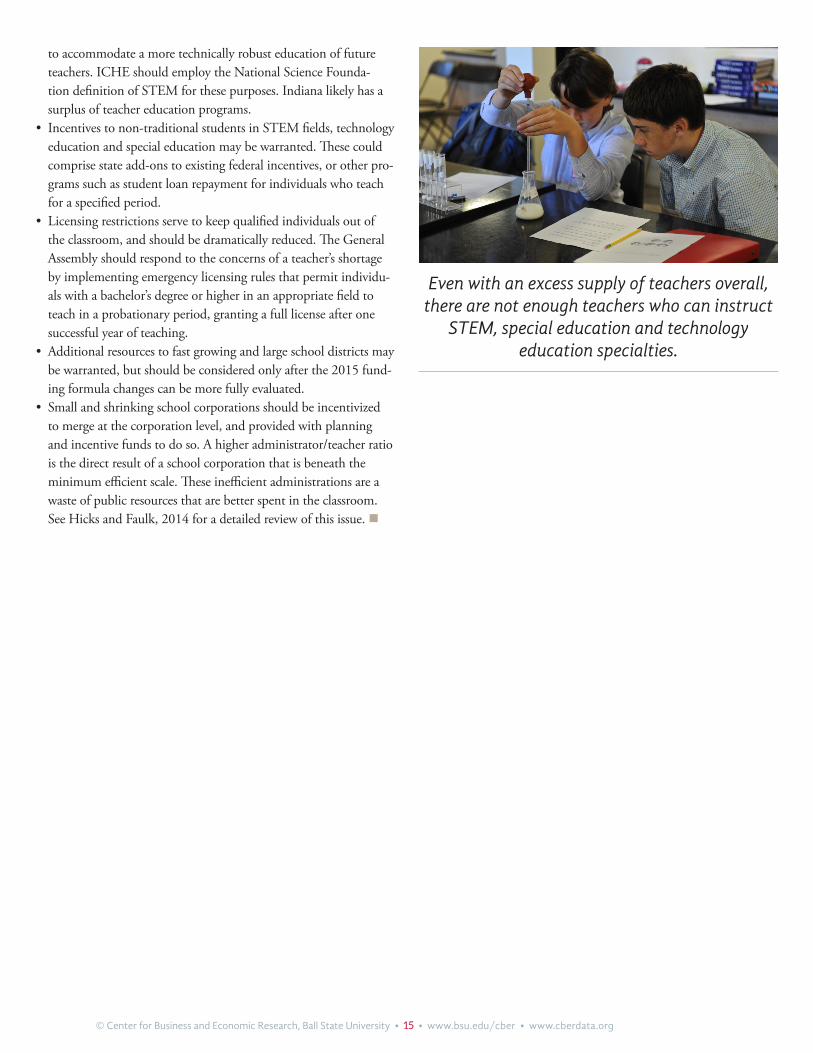
Finally, despite the excess supply of teachers overall, and the stability of teacher turnover, it is clear that there is a skill mismatch. Even with an excess supply of teachers overall, there are not enough teachers who can instruct STEM, special education and technology education specialties.
This leads to several policy considerations. • First, pay for Indiana teachers’ ranks 35th in the nation, while per
capita income in Indiana is 38th, so calls for broad teacher pay increases must face an ability to pay argument. However, tighten-ing labor markets will require higher wages for Indiana teachers, as early as the 2016-2017 school year. Any additional funds for higher teacher compensation should be accompanied by a less rigid pay formula that allows for market based differentials among disciplines. Labor markets set pay differentials for specific degrees and skills, and responding to those market based differentials are necessary to direct the best and brightest Americans into public education.
• No direct supply side interventions for traditional teaching positions are warranted, and may prove counter-productive, by directing students to occupations that are currently over supplied. Indiana’s public universities should be required to provide data to all new and existing college students seeking to enter teacher education programs of the employment statistics of recent gradu-ates in past five years.
• An increasing share of Indiana’s teachers should be recruited from outside traditional colleges of education, and the Indiana Commission for Higher Education (ICHE) should incentiv-ize state colleges and universities to expand their STEM and technology education related programs outside teachers colleges
Instead of a teacher shortage, the evidence points to an excess supply
of trained teachers in Indiana.
© Center for Business and Economic Research, Ball State University • 15 • www.bsu.edu/cber • www.cberdata.org
to accommodate a more technically robust education of future teachers. ICHE should employ the National Science Founda-tion definition of STEM for these purposes. Indiana likely has a surplus of teacher education programs.
• Incentives to non-traditional students in STEM fields, technology education and special education may be warranted. These could comprise state add-ons to existing federal incentives, or other pro-grams such as student loan repayment for individuals who teach for a specified period.
• Licensing restrictions serve to keep qualified individuals out of the classroom, and should be dramatically reduced. The General Assembly should respond to the concerns of a teacher’s shortage by implementing emergency licensing rules that permit individu-als with a bachelor’s degree or higher in an appropriate field to teach in a probationary period, granting a full license after one successful year of teaching.
• Additional resources to fast growing and large school districts may be warranted, but should be considered only after the 2015 fund-ing formula changes can be more fully evaluated.
• Small and shrinking school corporations should be incentivized to merge at the corporation level, and provided with planning and incentive funds to do so. A higher administrator/teacher ratio is the direct result of a school corporation that is beneath the minimum efficient scale. These inefficient administrations are a waste of public resources that are better spent in the classroom. See Hicks and Faulk, 2014 for a detailed review of this issue. n
Even with an excess supply of teachers overall, there are not enough teachers who can instruct
STEM, special education and technology education specialties.
CreditsReferences
Cavazos, Shaina. (2015). “Why people think there’s a teacher short-age in Indiana and why they’re probably wrong.” Chalkbeat, August 28.
Barkley, David L., Mark S. Henry, and Shuming Bao. (1998). “The role of local school quality in rural employment and population growth.” The Review of Regional Studies 28(1): 81-102.
Bradburn, E.M., Berger, R., Li, X., Peter, K., and Rooney, K. (2003). A Descriptive Summary of 1999–2000 Bachelor’s Degree Recipients 1 Year Later, With an Analysis of Time to Degree. (NCES 2003–165). U.S. Department of Education, National Center for Education Statistics. Washington, DC: U.S. Government Printing Office.
Hicks, Michael J. and Dagney Faulk. (2014). School Corporation Size and Cost of Education. Center for Business and Economic Research, Ball State University.
Molloy, Raven, Christopher L. Smith, and Abigail K. Wozniak. (2011). Internal migration in the United States. National Bureau of Economic Research. No. w17307.
National Center for Educational Statistics. (2005). Elementary/Secondary School Teaching Among Recent College Graduates: 1994 and 2001. Statistical Analysis Report, US Department of Education, Institute of Education Sciences, NCES 2005-161.
National Center for Educational Statistics. (2014). Teacher Attrition and Mobility: Results from the 2012-13 Teacher Follow-up Survey, US Department of Education, Institute of Education Sciences, NCES 2014-077.
US Bureau of the Census. (2014). Where Do College Graduates Work? A Special Focus on Science, Technology Engineering and Math. July 10.
US Department of Education. (2015). Teacher Shortage Areas Nationwide Listing 1990-1991 through 2015-2016. March 2015.
Photo Credits
All photos from Flickr users unless otherwise noted. Eaglebrook School (pg. 15), Karen Stint (pg. 2), USA G Hum-phreys (pg. 4), US Department of Education (pg. 1, 6, 11, 12), and Woodley Wonderworks (pg. 3). Unknown: pg. 3 (left), pg. 4 (left), pg. 14.
Production Credits
© Center for Business and Economic Research, Ball State University.
Author
Michael J. Hicks, PhD, director, Center for Business and Economic Research, Ball State University. George & Frances Ball distin-guished professor of economics, Miller College of Business, Ball State University.
Graphics
Victoria Meldrum, manager of publications and web services, Cen-ter for Business and Economic Research, Ball State University.
Gerrod Jones, publications undergraduate assistant, Center for Busi-ness and Economic Research, Ball State University.
Want more? Visit our Projects & Publications Library at http://projects.cberdata.org.
Center for Business and Economic Research2000 W. University Ave. (WB 149)Muncie, IN 47306765-285-5926 • [email protected]/cber • www.cberdata.orgfacebook.com/BallStateCBERtwitter.com/BallStateCBER
BALL STATE UNIVERSITY CENTER FOR BUSINESS AND ECONOMIC RESEARCHThe Center for Business and Economic Research (CBER) is an economic policy and forecasting research center at Ball State University in Muncie, Indiana.
The CBER Data Center (www.cberdata.org) offers a projects & publications library, primary-sourced economic data sets, weekly business commentary, and data resources for grant writers & economic developers.
In addition to research and data delivery, CBER facilitates community business discussions in Indiana’s east central region—holding the annual Indiana Economic Outlook and quarterly meetings of the Ball State University Business Roundtable.
CBER connects with its peers across the nation through memberships with the Association for University Business and Economic Research and the University Economic Development Association.