Embed Size (px)
Citation preview
SEPTEMBER 2020
Strategic Asset Management Plan
IndianaDepartment of Transportation
INDIANA DOT STRATEGIC ASSET MANAGEMENT PLAN 1
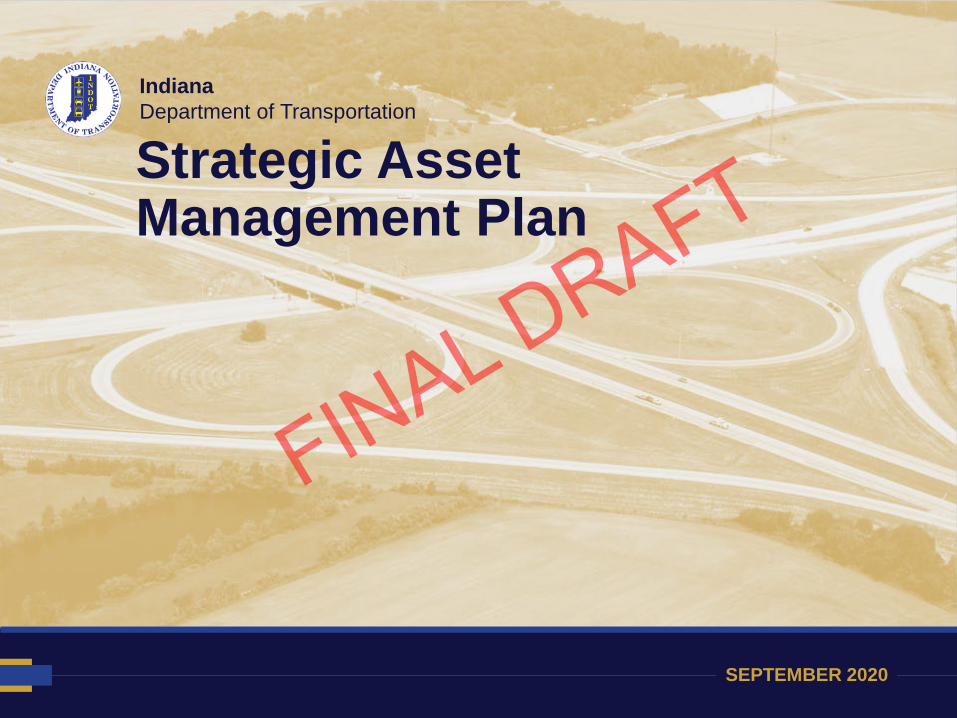
INDOT Strategic Asset Management PlanDocument History
Version Date Modified By Summary of Changes
SAMP v1 August 28, 2019 KPMG First draft of SAMP completed
Draft SAMP v2 September 2020 KPMGGraphical refresh, updates to asset lifecycle
strategies, inventory counts, financials, appendices
INDOT STRATEGIC ASSET MANAGEMENT PLAN

INDIANA DOT STRATEGIC ASSET MANAGEMENT PLAN 2INDIANA DOT STRATEGIC ASSET MANAGEMENT PLAN
Table of Contents
Executive Summary 3
Operating Context 4
Overview of the SAMP 7
Asset Portfolio 11
Strategic & Asset Management Objectives 22
Asset Portfolio Level Plan 31
Financial Plan To Achieve Asset Management Objectives 34
Decision-making Criteria 37
Asset Lifecycle Strategies & Other Functional Strategies 44
Capabilities & Competencies 48
Asset Management Roles & Responsibilities 51
Opportunities & Risks To Delivering The SAMP 55
Plans for Improving the Asset Management System 57
Monitoring Progress Of SAMP Implementation 59
Appendix 61
References 70

INDIANA DOT STRATEGIC ASSET MANAGEMENT PLAN 3
The Indiana Department of Transportation (“INDOT”, the “Agency”, or the “Department”), is responsible for the construction and maintenance of state roads, interstates, and U.S. routes, as well as for traffic control devices (signs and traffic signals) on its roadways. There are six District offices across Indiana that manage day-to-day operations, such as construction, detours, traffic signal operations, permits, maintenance operations, etc.1 INDOT owns or is responsible for maintaining approximately 11,000 centerline miles and over 5,700 bridges across the state.2
To account for INDOT’s plans for increased investments in infrastructure and ongoing changes in external environmental factors, INDOT has established a long-term approach for sustaining its infrastructure assets and effectively managing its investments. INDOT’s Strategic Asset Management Plan (SAMP) guides the processes, policies, and procedures related to INDOT’smanagement of roads and bridges to help the Department effectively manage its breadth of assets. The SAMP takes into account INDOT’s Strategic Plan and other policies to establish a coordinated approach for developing and maintaining good practice asset management, highlighting the role of the overall “asset management system” in the delivery of asset management goals and objectives.
INDOT’s goal is to achieve no more than 5% of pavement and 3% of bridges in poor condition by 2037. To achieve these condition targets, INDOT has developed 20-year statewide treatment plans for pavement and bridges to support steady and consistent improvement in these assets. With the passage of Next Level Indiana, INDOT plans to increase its annual investments to an average of $469 million in its pavement preservation plan and $481 million in its bridge preservation plan over the next ten years.3 With these investments, INDOT anticipates steady improvement in the conditions of its statewide roadway network, achieving 95% of overall pavement and 97% of statewide bridges in fair or better condition by year 2037.4
By creating a SAMP for INDOT’s transportation assets, this document helps ensure all stakeholders have a clear and common understanding of asset management within the INDOT organization, including asset management goals, objectives, policies, procedures, and business processes. Strategic asset management activities will guide how and where INDOT deploys resources and are critical in helping INDOT achieve its long-term vision and goals.5
Executive Summary
1 KPMG, “Asset Management Current Situation Analysis and Roadmap Report Indiana Department of Transportation,” version 10, October 3, 2018.
2 Indiana Department of Transportation, Transportation Asset Management Plan, August 20193 “Targets 6.24.20 vs. 9.20.19,” Excel spreadsheet of legislative funding targets for bridges and pavement. Indiana Department of Transportation, August 12, 2020. 4Indiana Department of Transportation, Transportation Asset Management Plan, August 20195 Indiana Department of Transportation, Indiana Department of Transportation 2019 Strategic Plan, version 6
EXECUTIVE SUMMARY

INDIANA DOT STRATEGIC ASSET MANAGEMENT PLAN 4INDIANA DOT STRATEGIC ASSET MANAGEMENT PLAN
Operating Context

INDIANA DOT STRATEGIC ASSET MANAGEMENT PLAN 5
OverviewThe Indiana Department of Transportation (INDOT) is responsible for the construction and maintenance of state roads, interstates, and U.S. routes, as well as for traffic control devices (signs and traffic signals) on its roadways. There are six District offices across Indiana that manage day-to-day operations such as construction/detours, traffic signal operations, permits, maintenance operations, etc. for approximately 11,000 centerline miles of roadways (including 13 interstate highways)6 and over 5,700 bridges.7
What is INDOT’s Operating Environment?
OPERATING CONTEXT
6 “INDOT Facts” website, https://www.in.gov/indot/2337.htm.7 “BIAS State Bridges No Culverts,” Excel spreadsheet of bridge inventory and conditions, Indiana Department of Transportation, July 26, 20198 Indiana Department of Transportation, Indiana Department of Transportation 2019 Strategic Plan, version 69 “Indiana Quick Facts,” website, US Census Bureau, https://www.censusbureau.gov/quickfacts/indiana/
Like many transportation agencies, INDOT has witnessed disruptive changes to its operating environment over the past several years:
The advancement of new technologies in the automotive industry has resulted in unprecedented changes to transportation and its related infrastructure, including the rise of autonomous, connected, and electric vehicles and advancements in multi-modal transit and “big data” analytics and solutions.8
New technologies
INDOT is also impacted by Indiana’s overall shifts in demographics and economic factors. From 2010 to 2018, Indiana’s population has grown approximately 3%,9 with increases expected in future years. Coupled with advances in technologies, INDOT will prepare for increased congestion on its roadways.
Social environment
INDIANA DOT STRATEGIC ASSET MANAGEMENT PLAN 6
INDOT’s InitiativesFactoring these disruptive changes in the technological, economic, and social environment, INDOT’s Strategic Plan has identified service objectives to drive INDOT’s planning and decision-making. Such service objectives include the need to ensure road safety, enhance mobility, and achieve asset sustainability.
The passage of Next Level Indiana legislation in 2017, championed by Governor Eric Holcomb, is a critical element in addressing these changes by
helping INDOT sustain the infrastructure supporting the transportation network. Recognizing the need to improve highway quality in the long-term to meet increased demand and technological advancements, Next Level Indiana plans for over $30 billion in funding over the next 20 years,10 establishing a sustainable plan to fund INDOT’s bridges and roads.
With INDOT’s plans for increased investments in infrastructure to address these environmental impacts, it is critical that INDOT establish a long-term approach for sustaining its infrastructure assets and effectively managing its investments.
Successful implementation of INDOT’s Asset Management Program will help the Department to effectively maintain its infrastructure in the long-term and ensure a safe, high-quality, and sustainable transportation network for Indiana’s citizens and travelers.
How is INDOT Addressing these Challenges?
OPERATING CONTEXT
10Indiana Constructors, Inc., “LF ICI PowerPoint” (program update, Indiana Department of Transportation, Indianapolis, IN, 2019)

INDIANA DOT STRATEGIC ASSET MANAGEMENT PLAN 7INDIANA DOT STRATEGIC ASSET MANAGEMENT PLAN
Overview of the SAMP
INDIANA DOT STRATEGIC ASSET MANAGEMENT PLAN 8
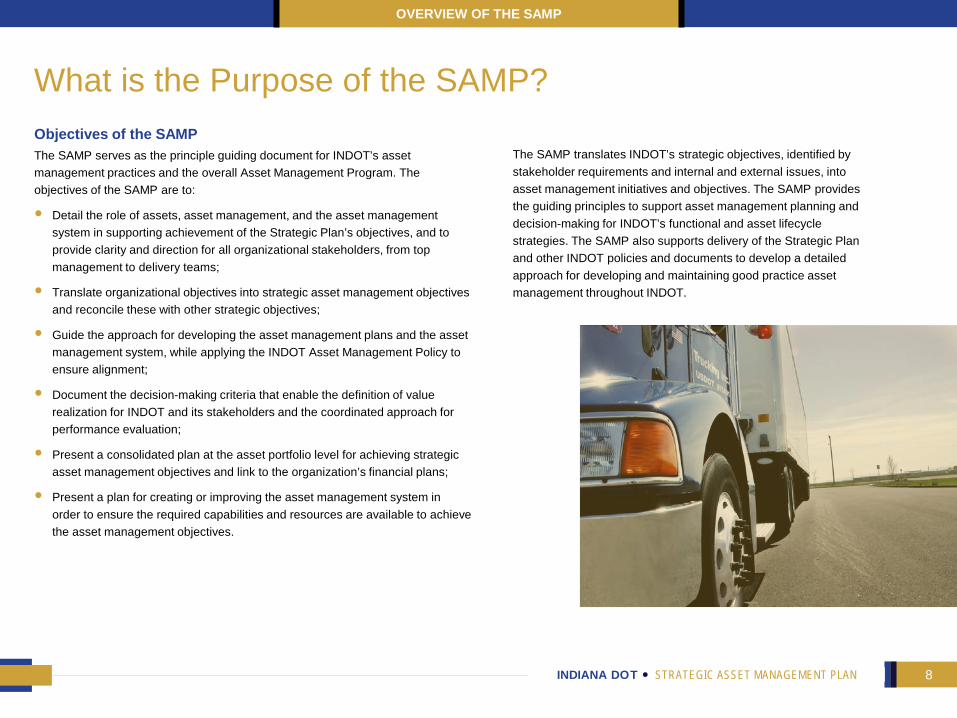
Objectives of the SAMPThe SAMP serves as the principle guiding document for INDOT’s asset management practices and the overall Asset Management Program. The objectives of the SAMP are to:
• Detail the role of assets, asset management, and the asset management system in supporting achievement of the Strategic Plan’s objectives, and to provide clarity and direction for all organizational stakeholders, from top management to delivery teams;
• Translate organizational objectives into strategic asset management objectives and reconcile these with other strategic objectives;
• Guide the approach for developing the asset management plans and the asset management system, while applying the INDOT Asset Management Policy to ensure alignment;
• Document the decision-making criteria that enable the definition of value realization for INDOT and its stakeholders and the coordinated approach for performance evaluation;
• Present a consolidated plan at the asset portfolio level for achieving strategic asset management objectives and link to the organization’s financial plans;
• Present a plan for creating or improving the asset management system in order to ensure the required capabilities and resources are available to achieve the asset management objectives.
What is the Purpose of the SAMP?
OVERVIEW OF THE SAMP
The SAMP translates INDOT’s strategic objectives, identified by stakeholder requirements and internal and external issues, into asset management initiatives and objectives. The SAMP provides the guiding principles to support asset management planning and decision-making for INDOT’s functional and asset lifecycle strategies. The SAMP also supports delivery of the Strategic Plan and other INDOT policies and documents to develop a detailed approach for developing and maintaining good practice asset management throughout INDOT.
INDIANA DOT STRATEGIC ASSET MANAGEMENT PLAN 9
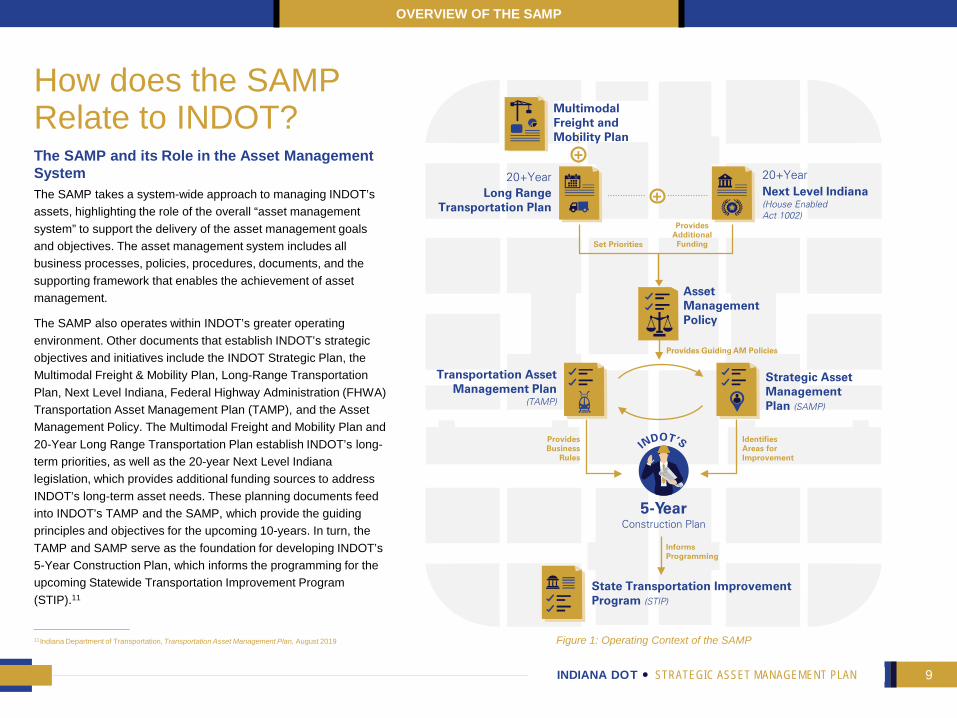
The SAMP and its Role in the Asset Management SystemThe SAMP takes a system-wide approach to managing INDOT’sassets, highlighting the role of the overall “asset management system” to support the delivery of the asset management goals and objectives. The asset management system includes all business processes, policies, procedures, documents, and the supporting framework that enables the achievement of asset management.
The SAMP also operates within INDOT’s greater operating environment. Other documents that establish INDOT’s strategic objectives and initiatives include the INDOT Strategic Plan, the Multimodal Freight & Mobility Plan, Long-Range Transportation Plan, Next Level Indiana, Federal Highway Administration (FHWA) Transportation Asset Management Plan (TAMP), and the Asset Management Policy. The Multimodal Freight and Mobility Plan and 20-Year Long Range Transportation Plan establish INDOT’s long-term priorities, as well as the 20-year Next Level Indiana legislation, which provides additional funding sources to address INDOT’s long-term asset needs. These planning documents feed into INDOT’s TAMP and the SAMP, which provide the guiding principles and objectives for the upcoming 10-years. In turn, the TAMP and SAMP serve as the foundation for developing INDOT’s 5-Year Construction Plan, which informs the programming for the upcoming Statewide Transportation Improvement Program (STIP).11
How does the SAMP Relate to INDOT?
OVERVIEW OF THE SAMP
Multimodal Freight and Mobility Plan
+
Long RangeTransportation Plan
20+YearNext Level Indiana(House Enabled Act 1002)
20+Year
Set Priorities
Provides Additional Funding
Provides Guiding AM Policies
Transportation AssetManagement Plan
(TAMP)
Strategic AssetManagement Plan (SAMP)
Provides Business
Rules
Identifies Areas forImprovement
5-YearConstruction Plan
Informs Programming
State Transportation ImprovementProgram (STIP)
+
Figure 1: Operating Context of the SAMP
AssetManagement Policy
11Indiana Department of Transportation, Transportation Asset Management Plan, August 2019

INDIANA DOT STRATEGIC ASSET MANAGEMENT PLAN 10
Scope of the SAMPWhile the SAMP is intended to provide guidance for managing INDOT’sentire portfolio of infrastructure assets, the current SAMP focuses on INDOT’s pavement and bridge portfolio inventory. Future versions of the SAMP may include details related to INDOT’s additional assets as more data becomes available.
Processes and plans outlined within the SAMP for bridges and pavement include INDOT’s 20-year plans, investment decision-making criteria, and lifecycle strategies. While the SAMP provides a summary overview of these business processes, the SAMP does not provide details on the calculations used to develop the scoring methodologies, nor does it provide specifics on the calculations used to develop lifecycle strategies. The SAMP is meant to provide a high-level overview of these processes; additional details can be found in INDOT’s operational policies for bridges and pavement, the INDOT Design Manual, and other policy and procedural guidelines.
While the SAMP includes 20-year bridge and pavement treatment plans, financial data for the SAMP is forecasted through FY30. As additional data becomes available, future versions of the SAMP should align the planning horizons for the asset strategies and associated financial plans to deliver the asset strategies.
What is Included in the SAMP?
OVERVIEW OF THE SAMP
INDIANA DOT STRATEGIC ASSET MANAGEMENT PLAN 11INDIANA DOT STRATEGIC ASSET MANAGEMENT PLAN
Asset Portfolio
INDIANA DOT STRATEGIC ASSET MANAGEMENT PLAN 12
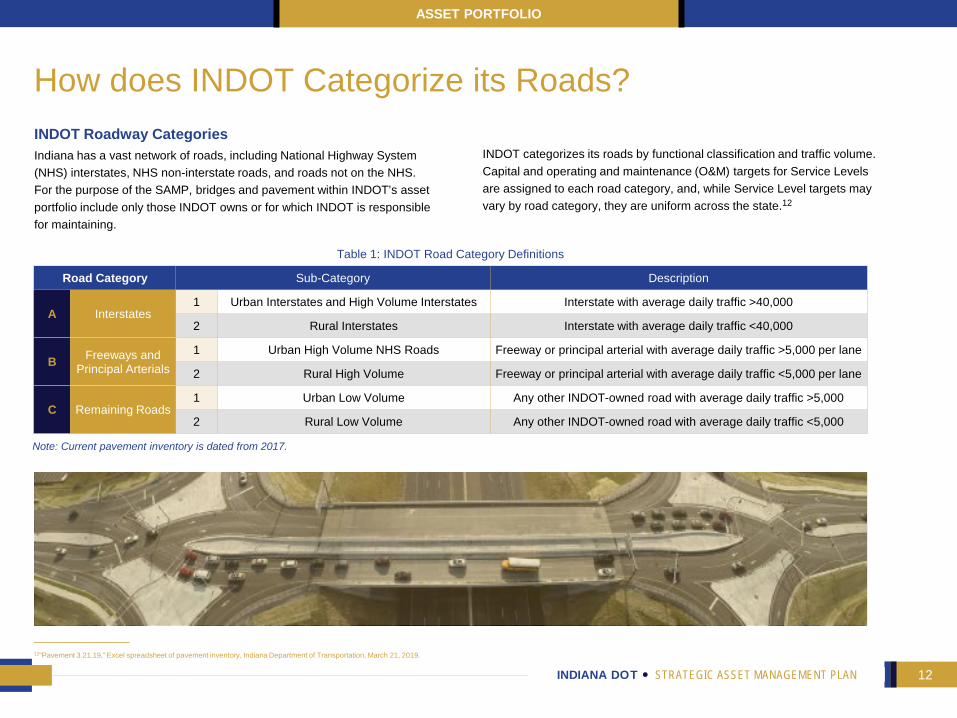
INDOT Roadway Categories Indiana has a vast network of roads, including National Highway System (NHS) interstates, NHS non-interstate roads, and roads not on the NHS. For the purpose of the SAMP, bridges and pavement within INDOT’s asset portfolio include only those INDOT owns or for which INDOT is responsible for maintaining.
INDOT categorizes its roads by functional classification and traffic volume. Capital and operating and maintenance (O&M) targets for Service Levels are assigned to each road category, and, while Service Level targets may vary by road category, they are uniform across the state.12
How does INDOT Categorize its Roads?
Table 1: INDOT Road Category Definitions
Road Category Sub-Category Description
A Interstates1 Urban Interstates and High Volume Interstates Interstate with average daily traffic >40,000
2 Rural Interstates Interstate with average daily traffic <40,000
B Freeways and Principal Arterials
1 Urban High Volume NHS Roads Freeway or principal arterial with average daily traffic >5,000 per lane
2 Rural High Volume Freeway or principal arterial with average daily traffic <5,000 per lane
C Remaining Roads1 Urban Low Volume Any other INDOT-owned road with average daily traffic >5,000
2 Rural Low Volume Any other INDOT-owned road with average daily traffic <5,000
Note: Current pavement inventory is dated from 2017.
ASSET PORTFOLIO
12“Pavement 3.21.19,” Excel spreadsheet of pavement inventory, Indiana Department of Transportation, March 21, 2019.
INDIANA DOT STRATEGIC ASSET MANAGEMENT PLAN 13
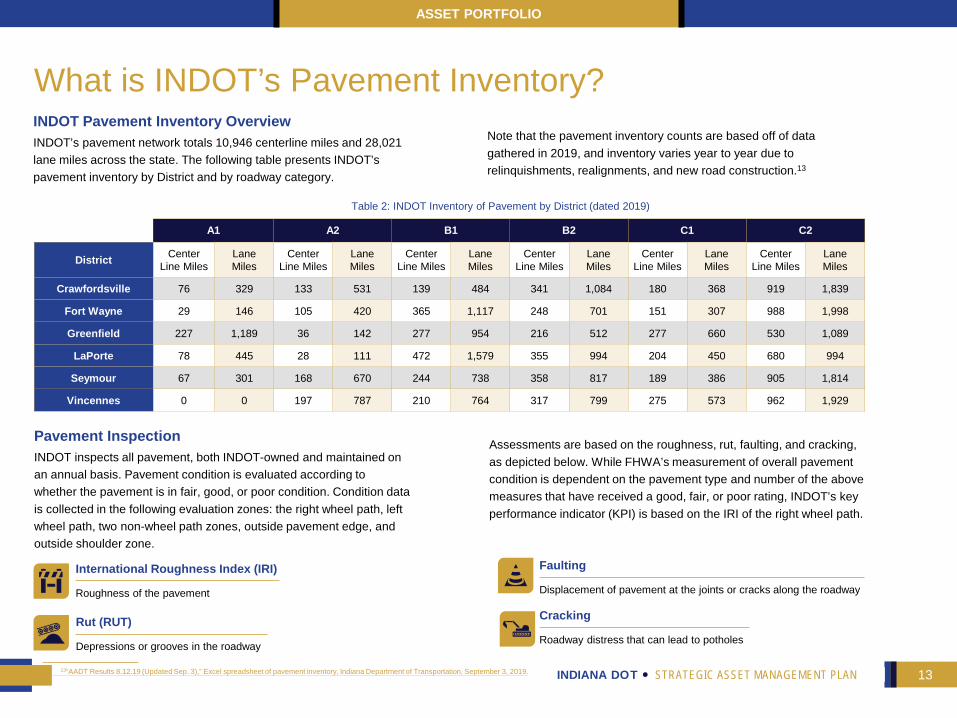
What is INDOT’s Pavement Inventory?
Table 2: INDOT Inventory of Pavement by District (dated 2019)
A1 A2 B1 B2 C1 C2
District Center Line Miles
Lane Miles
Center Line Miles
Lane Miles
Center Line Miles
Lane Miles
Center Line Miles
Lane Miles
Center Line Miles
Lane Miles
Center Line Miles
Lane Miles
Crawfordsville 76 329 133 531 139 484 341 1,084 180 368 919 1,839
Fort Wayne 29 146 105 420 365 1,117 248 701 151 307 988 1,998
Greenfield 227 1,189 36 142 277 954 216 512 277 660 530 1,089
LaPorte 78 445 28 111 472 1,579 355 994 204 450 680 994
Seymour 67 301 168 670 244 738 358 817 189 386 905 1,814
Vincennes 0 0 197 787 210 764 317 799 275 573 962 1,929
Pavement InspectionINDOT inspects all pavement, both INDOT-owned and maintained on an annual basis. Pavement condition is evaluated according to whether the pavement is in fair, good, or poor condition. Condition datais collected in the following evaluation zones: the right wheel path, left wheel path, two non-wheel path zones, outside pavement edge, and outside shoulder zone.
ASSET PORTFOLIO
International Roughness Index (IRI)
Roughness of the pavement
Rut (RUT)
Depressions or grooves in the roadway
Faulting
Displacement of pavement at the joints or cracks along the roadway
Cracking
Roadway distress that can lead to potholes
INDOT Pavement Inventory OverviewINDOT’s pavement network totals 10,946 centerline miles and 28,021 lane miles across the state. The following table presents INDOT’s pavement inventory by District and by roadway category.
13“AADT Results 8.12.19 (Updated Sep. 3),” Excel spreadsheet of pavement inventory, Indiana Department of Transportation, September 3, 2019.
Note that the pavement inventory counts are based off of data gathered in 2019, and inventory varies year to year due to relinquishments, realignments, and new road construction.13
Assessments are based on the roughness, rut, faulting, and cracking, as depicted below. While FHWA’s measurement of overall pavement condition is dependent on the pavement type and number of the above measures that have received a good, fair, or poor rating, INDOT’s key performance indicator (KPI) is based on the IRI of the right wheel path.
INDIANA DOT STRATEGIC ASSET MANAGEMENT PLAN 14
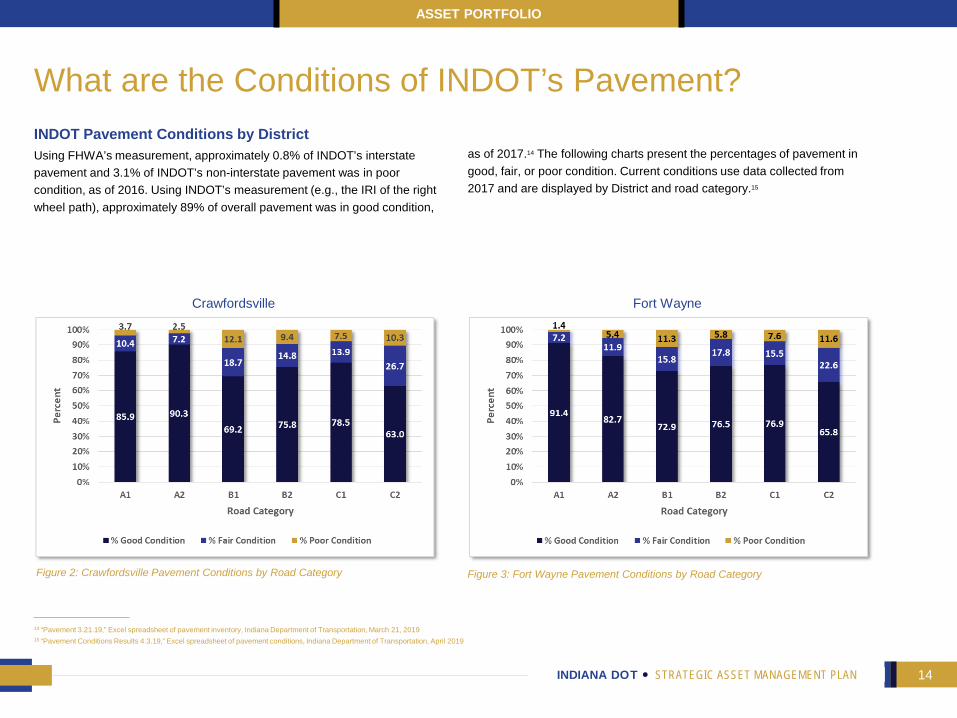
What are the Conditions of INDOT’s Pavement?INDOT Pavement Conditions by District Using FHWA’s measurement, approximately 0.8% of INDOT’s interstate pavement and 3.1% of INDOT’s non-interstate pavement was in poor condition, as of 2016. Using INDOT’s measurement (e.g., the IRI of the right wheel path), approximately 89% of overall pavement was in good condition,
Figure 3: Fort Wayne Pavement Conditions by Road Category
Fort WayneCrawfordsville
Figure 2: Crawfordsville Pavement Conditions by Road Category
ASSET PORTFOLIO
14 “Pavement 3.21.19,” Excel spreadsheet of pavement inventory, Indiana Department of Transportation, March 21, 201915 “Pavement Conditions Results 4.3.19,” Excel spreadsheet of pavement conditions, Indiana Department of Transportation, April 2019
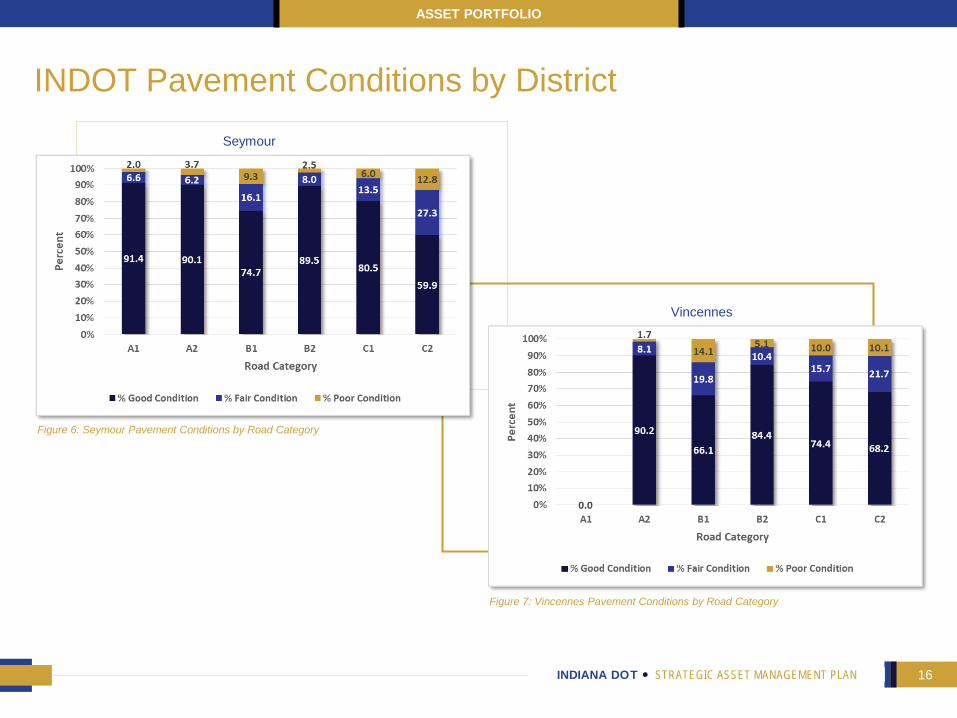
as of 2017.14 The following charts present the percentages of pavement in good, fair, or poor condition. Current conditions use data collected from 2017 and are displayed by District and road category.15

INDIANA DOT STRATEGIC ASSET MANAGEMENT PLAN 15
INDOT Pavement Conditions by District
ASSET PORTFOLIO
Figure 5: LaPorte Pavement Conditions by Road Category
LaPorte
Greenfield
Figure 4: Greenfield Pavement Conditions by Road Category
INDIANA DOT STRATEGIC ASSET MANAGEMENT PLAN 16
INDOT Pavement Conditions by District
ASSET PORTFOLIO
Figure 7: Vincennes Pavement Conditions by Road Category
Vincennes
Seymour
Figure 6: Seymour Pavement Conditions by Road Category

INDIANA DOT STRATEGIC ASSET MANAGEMENT PLAN 17
What is INDOT’s Bridge Inventory? INDOT Bridge Inventory by District and Road Category INDOT’s bridge network is comprised of 5,729 total bridges throughout the State of Indiana. This number includes all bridges within the National Bridge Inventory (NBI) that INDOT owns or is responsible for maintaining.16 The table below lists INDOT’s bridge inventory by District and roadway category. Note that inventory data is from 2019, and bridge inventory counts vary year to year due to relinquishments, realignments, and new road construction.
ASSET PORTFOLIO
16 “BIAS State Bridges No Culverts,” Excel spreadsheet of bridge inventory and conditions, Indiana Department of Transportation, July 26, 2019.17 National Performance Management Measures for Assessing Bridge Conditions,” Code of Federal Regulations, title 23, part 430, subpart D (2017)
District A1 A2 B1 B2 C1 C2 NA Total
Crawfordsville 61 111 93 174 109 366 2 916
Fort Wayne 27 136 175 103 58 269 0 768
Greenfield 443 32 211 77 221 205 6 1197
LaPorte 132 14 255 146 101 192 3 843
Seymour 90 151 142 140 102 338 3 966
Vincennes 0 270 147 130 111 369 12 1039
State Totals 753 716 1023 770 702 1739 26 5729
Table 3: INDOT Bridge Inventory by District (dated 2019)
INDOT assesses whether bridges are in good, fair, or poor condition, using both KPIs for INDOT and the FHWA. INDOT assesses the conditions of its bridges based on wearing surface, deck, superstructure, and substructure. While INDOT’s KPI for a bridge’s overall condition is based on the ratings of the four components, and all bridges are scored equally (e.g., no weighting), FHWA’s measurement for a bridge’s condition rating is based on the deck, superstructure, and substructure subsystem components, and scores are weighted to the deck area.17

INDIANA DOT STRATEGIC ASSET MANAGEMENT PLAN 18
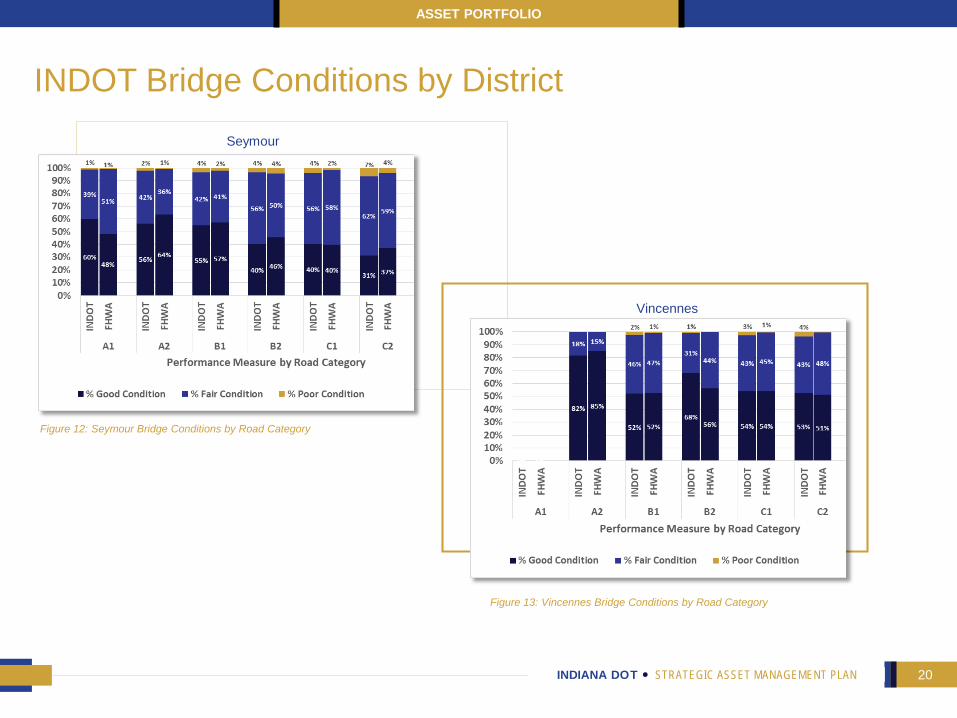
What are the Conditions of INDOT’s Bridges?INDOT Bridge Conditions by DistrictOverall, 96.35% of INDOT’s bridges were in good or fair condition as of 2019 according to INDOT’s KPI, and 97.97% of INDOT’s bridges were in good or fair condition in 2019 according to the FHWA measurement.
ASSET PORTFOLIO
Figure 9: Fort Wayne Bridge Conditions by Road Category
Fort WayneCrawfordsville
Figure 8: Crawfordsville Bridge Conditions by Road Category
18 “BIAS State Bridges No Culverts,” Excel spreadsheet of bridge inventory and conditions, Indiana Department of Transportation, July 26, 2019
The following charts summarize the current percentages of bridges in good, fair, or poor condition across the Districts and road categories, as of July 2019. The charts display both INDOT’s and FHWA’s KPIs for bridge conditions.18

INDIANA DOT STRATEGIC ASSET MANAGEMENT PLAN 19
INDOT Bridge Conditions by District
ASSET PORTFOLIO
Figure 11: LaPorte Bridge Conditions by Road Category
LaPorte
Greenfield
Figure 10: Greenfield Bridge Conditions by Road Category
INDIANA DOT STRATEGIC ASSET MANAGEMENT PLAN 20
INDOT Bridge Conditions by District
ASSET PORTFOLIO
Figure 13: Vincennes Bridge Conditions by Road Category
Vincennes
Seymour
Figure 12: Seymour Bridge Conditions by Road Category
INDIANA DOT STRATEGIC ASSET MANAGEMENT PLAN 21
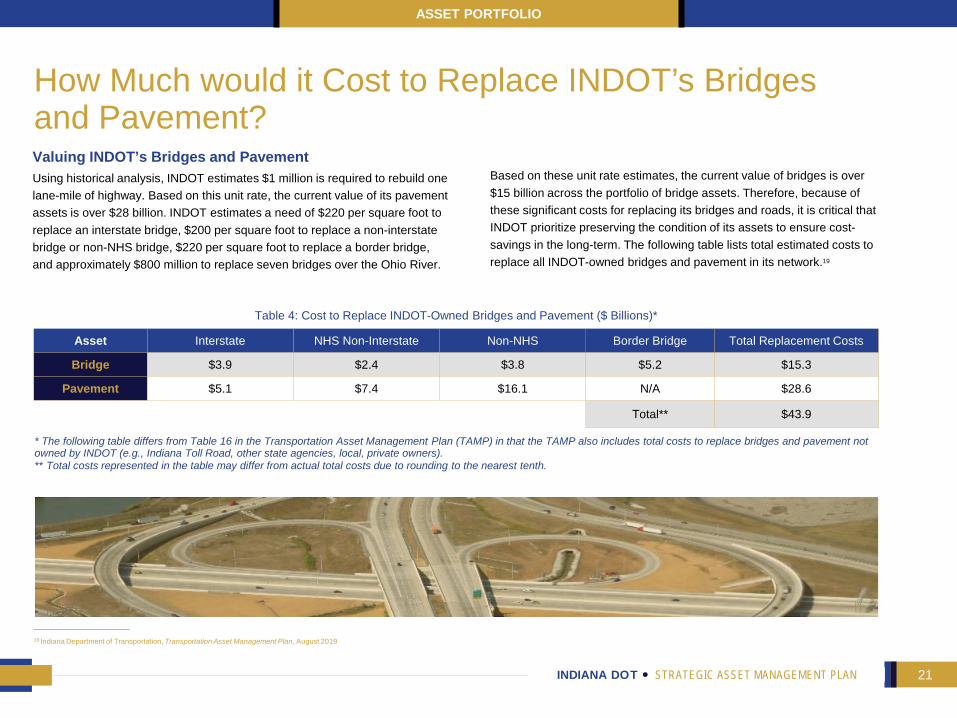
How Much would it Cost to Replace INDOT’s Bridges and Pavement? Valuing INDOT’s Bridges and PavementUsing historical analysis, INDOT estimates $1 million is required to rebuild one lane-mile of highway. Based on this unit rate, the current value of its pavement assets is over $28 billion. INDOT estimates a need of $220 per square foot to replace an interstate bridge, $200 per square foot to replace a non-interstate bridge or non-NHS bridge, $220 per square foot to replace a border bridge, and approximately $800 million to replace seven bridges over the Ohio River.
Table 4: Cost to Replace INDOT-Owned Bridges and Pavement ($ Billions)*
Asset Interstate NHS Non-Interstate Non-NHS Border Bridge Total Replacement Costs
Bridge $3.9 $2.4 $3.8 $5.2 $15.3
Pavement $5.1 $7.4 $16.1 N/A $28.6
Total** $43.9
ASSET PORTFOLIO
* The following table differs from Table 16 in the Transportation Asset Management Plan (TAMP) in that the TAMP also includes total costs to replace bridges and pavement not owned by INDOT (e.g., Indiana Toll Road, other state agencies, local, private owners). ** Total costs represented in the table may differ from actual total costs due to rounding to the nearest tenth.
19 Indiana Department of Transportation, Transportation Asset Management Plan, August 2019
Based on these unit rate estimates, the current value of bridges is over $15 billion across the portfolio of bridge assets. Therefore, because of these significant costs for replacing its bridges and roads, it is critical that INDOT prioritize preserving the condition of its assets to ensure cost-savings in the long-term. The following table lists total estimated costs to replace all INDOT-owned bridges and pavement in its network.19

INDIANA DOT STRATEGIC ASSET MANAGEMENT PLAN 22INDIANA DOT STRATEGIC ASSET MANAGEMENT PLAN
Strategic Objectives & Asset Management Objectives

INDIANA DOT STRATEGIC ASSET MANAGEMENT PLAN 23
SafetyEnsure road safety for citizens and personnel
MobilityEnhance end-to-end customer and freight journeys across all modes of transportation
Customer ServiceEnsure local engagement and timeliness of services and response
Economic CompetitivenessImprove economic outcomes for Indiana
Asset SustainabilityEnhance the ability to manage and maintain assets throughout their lifecycle
Organization and Workforce Provide employees with the tools, training, and information to succeed
Innovation and Technology Harness technology and innovation to develop more effective transportation solutions
INDOT’s Strategic Objectives INDOT’s Mission, Vision, and Service ObjectivesThe following are INDOT’s Mission, Vision, Core Values, and Service Objectives. INDOT’s strategic objectives are detailed within the INDOT Strategic Plan.20
STRATEGIC OBJECTIVES AND ASSET MANAGEMENT OBJECTIVES
Collaboratively plan, build, andmaintain safe and innovativetransportation infrastructure that enhances quality of life,drives economic growth,and accommodates newmodes of transport
INDOT Mission
Be a leading innovator intransportation, with an
exceptional workforce, thatis driven by connectingHoosiers with the world
INDOT Vision
Value the individual skills, experience, diversity and contribution of fellow employees
Take responsibility for actions and decisions to encourage a culture of ownership and pride
Empower our people to shareinformation and seek input frompartners to achieve goals
Focus on new, practical ideas andtechnology to continuously serve our Customer better and more efficiently
Trust
20 Indiana Department of Transportation, Indiana Department of Transportation 2019 Strategic Plan, version 6
Figure 14: INDOT’s Mission, Vision, Service Objectives
INDIANA DOT STRATEGIC ASSET MANAGEMENT PLAN 24
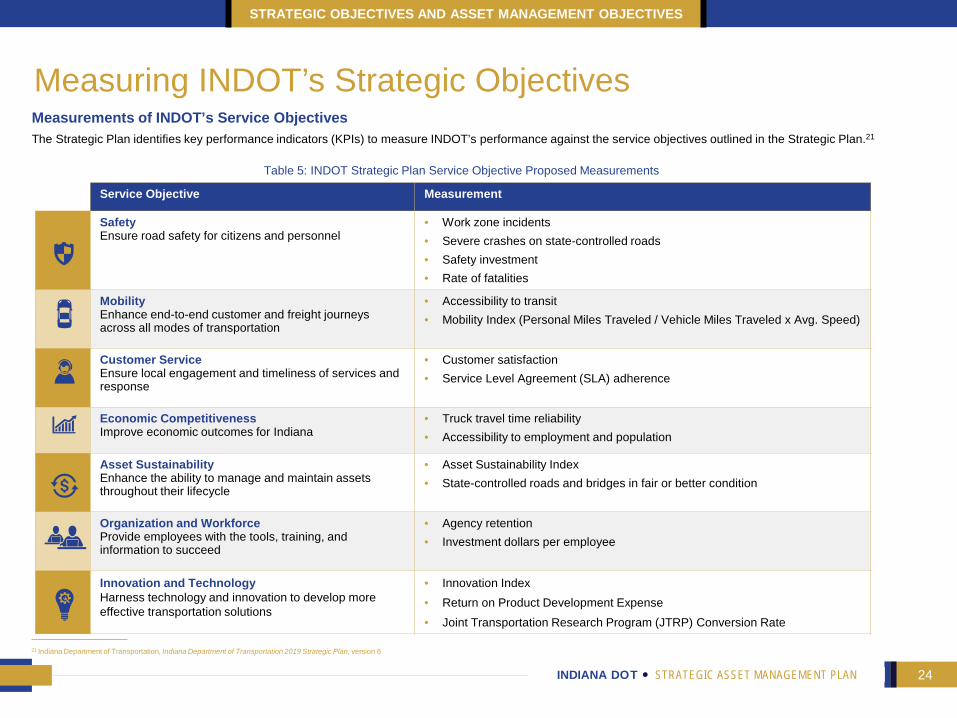
Service Objective Measurement
SafetyEnsure road safety for citizens and personnel
• Work zone incidents• Severe crashes on state-controlled roads• Safety investment • Rate of fatalities
MobilityEnhance end-to-end customer and freight journeys across all modes of transportation
• Accessibility to transit• Mobility Index (Personal Miles Traveled / Vehicle Miles Traveled x Avg. Speed)
Customer ServiceEnsure local engagement and timeliness of services and response
• Customer satisfaction• Service Level Agreement (SLA) adherence
Economic CompetitivenessImprove economic outcomes for Indiana
• Truck travel time reliability• Accessibility to employment and population
Asset SustainabilityEnhance the ability to manage and maintain assets throughout their lifecycle
• Asset Sustainability Index• State-controlled roads and bridges in fair or better condition
Organization and Workforce Provide employees with the tools, training, and information to succeed
• Agency retention• Investment dollars per employee
Innovation and Technology Harness technology and innovation to develop more effective transportation solutions
• Innovation Index• Return on Product Development Expense• Joint Transportation Research Program (JTRP) Conversion Rate
Measuring INDOT’s Strategic Objectives Measurements of INDOT’s Service ObjectivesThe Strategic Plan identifies key performance indicators (KPIs) to measure INDOT’s performance against the service objectives outlined in the Strategic Plan.21
STRATEGIC OBJECTIVES AND ASSET MANAGEMENT OBJECTIVES
21 Indiana Department of Transportation, Indiana Department of Transportation 2019 Strategic Plan, version 6
Table 5: INDOT Strategic Plan Service Objective Proposed Measurements
INDIANA DOT STRATEGIC ASSET MANAGEMENT PLAN 25
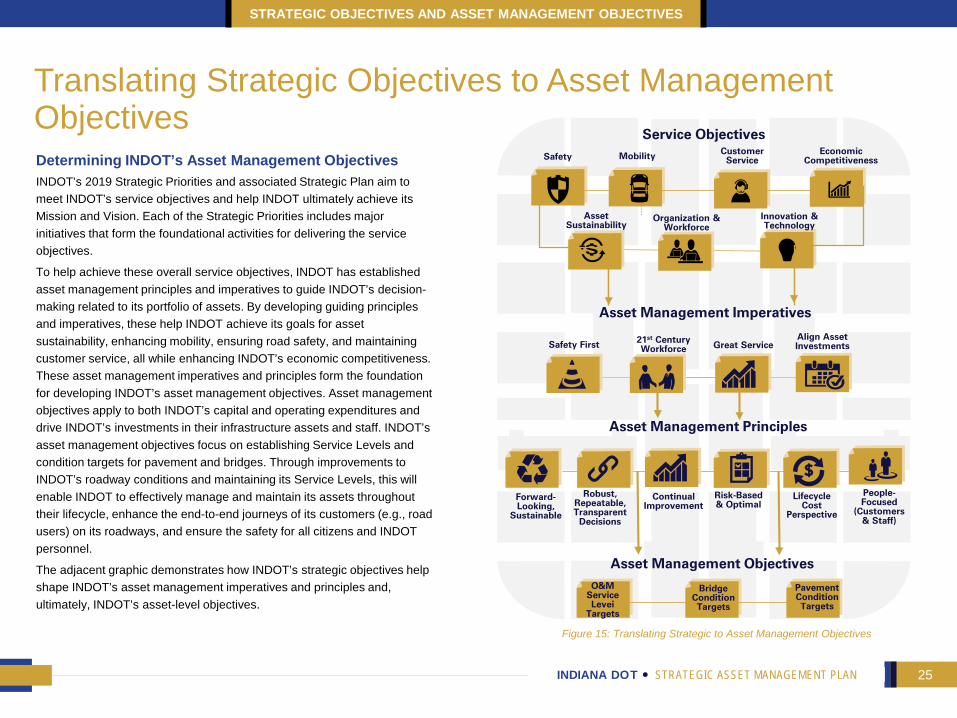
Translating Strategic Objectives to Asset Management Objectives Determining INDOT’s Asset Management Objectives INDOT’s 2019 Strategic Priorities and associated Strategic Plan aim to meet INDOT’s service objectives and help INDOT ultimately achieve its Mission and Vision. Each of the Strategic Priorities includes major initiatives that form the foundational activities for delivering the service objectives.
To help achieve these overall service objectives, INDOT has established asset management principles and imperatives to guide INDOT’s decision-making related to its portfolio of assets. By developing guiding principles and imperatives, these help INDOT achieve its goals for asset sustainability, enhancing mobility, ensuring road safety, and maintaining customer service, all while enhancing INDOT’s economic competitiveness. These asset management imperatives and principles form the foundation for developing INDOT’s asset management objectives. Asset management objectives apply to both INDOT’s capital and operating expenditures and drive INDOT’s investments in their infrastructure assets and staff. INDOT’s asset management objectives focus on establishing Service Levels and condition targets for pavement and bridges. Through improvements to INDOT’s roadway conditions and maintaining its Service Levels, this will enable INDOT to effectively manage and maintain its assets throughout their lifecycle, enhance the end-to-end journeys of its customers (e.g., road users) on its roadways, and ensure the safety for all citizens and INDOT personnel.
The adjacent graphic demonstrates how INDOT’s strategic objectives help shape INDOT’s asset management imperatives and principles and, ultimately, INDOT’s asset-level objectives.
STRATEGIC OBJECTIVES AND ASSET MANAGEMENT OBJECTIVES
Mobility CustomerService
Economic Competitiveness
Asset Sustainability
Organization & Workforce
Innovation & Technology
Service Objectives
Asset Management Imperatives
Safety First 21st Century Workforce Great Service
Align Asset Investments
Asset Management Principles
Safety
Forward-Looking,
Sustainable
Robust, Repeatable, Transparent
Decisions
People-Focused
(Customers & Staff)
Asset Management ObjectivesO&M
Service Level
Targets
Bridge Condition Targets
Pavement Condition Targets
Continual Improvement
Risk-Based & Optimal
Lifecycle Cost
Perspective
Figure 15: Translating Strategic to Asset Management Objectives
INDIANA DOT STRATEGIC ASSET MANAGEMENT PLAN 26
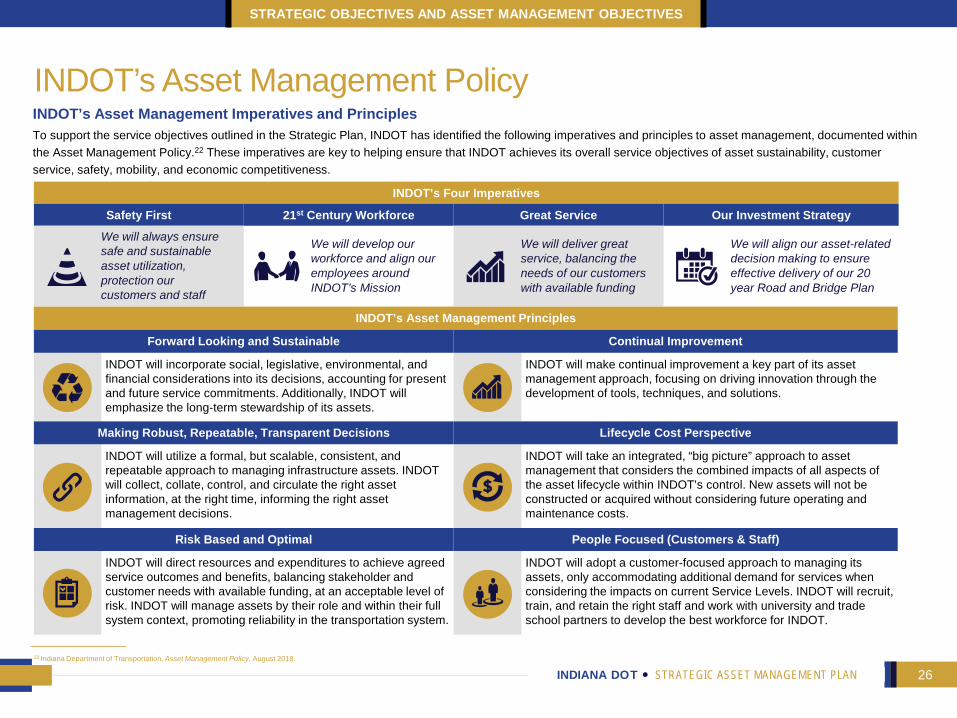
INDOT’s Asset Management PolicyINDOT’s Asset Management Imperatives and Principles To support the service objectives outlined in the Strategic Plan, INDOT has identified the following imperatives and principles to asset management, documented within the Asset Management Policy.22 These imperatives are key to helping ensure that INDOT achieves its overall service objectives of asset sustainability, customer service, safety, mobility, and economic competitiveness.
INDOT’s Four Imperatives
Safety First 21st Century Workforce Great Service Our Investment StrategyWe will always ensure safe and sustainable asset utilization, protection our customers and staff
We will develop our workforce and align our employees around INDOT’s Mission
We will deliver great service, balancing the needs of our customers with available funding
We will align our asset-related decision making to ensure effective delivery of our 20 year Road and Bridge Plan
INDOT’s Asset Management Principles
Forward Looking and Sustainable Continual Improvement
INDOT will incorporate social, legislative, environmental, and financial considerations into its decisions, accounting for present and future service commitments. Additionally, INDOT will emphasize the long-term stewardship of its assets.
INDOT will make continual improvement a key part of its asset management approach, focusing on driving innovation through the development of tools, techniques, and solutions.
Making Robust, Repeatable, Transparent Decisions Lifecycle Cost Perspective
INDOT will utilize a formal, but scalable, consistent, and repeatable approach to managing infrastructure assets. INDOT will collect, collate, control, and circulate the right asset information, at the right time, informing the right asset management decisions.
INDOT will take an integrated, “big picture” approach to asset management that considers the combined impacts of all aspects of the asset lifecycle within INDOT’s control. New assets will not be constructed or acquired without considering future operating and maintenance costs.
Risk Based and Optimal People Focused (Customers & Staff)
INDOT will direct resources and expenditures to achieve agreed service outcomes and benefits, balancing stakeholder and customer needs with available funding, at an acceptable level of risk. INDOT will manage assets by their role and within their full system context, promoting reliability in the transportation system.
INDOT will adopt a customer-focused approach to managing its assets, only accommodating additional demand for services when considering the impacts on current Service Levels. INDOT will recruit, train, and retain the right staff and work with university and trade school partners to develop the best workforce for INDOT.
STRATEGIC OBJECTIVES AND ASSET MANAGEMENT OBJECTIVES
22 Indiana Department of Transportation, Asset Management Policy, August 2018.

INDIANA DOT STRATEGIC ASSET MANAGEMENT PLAN 27
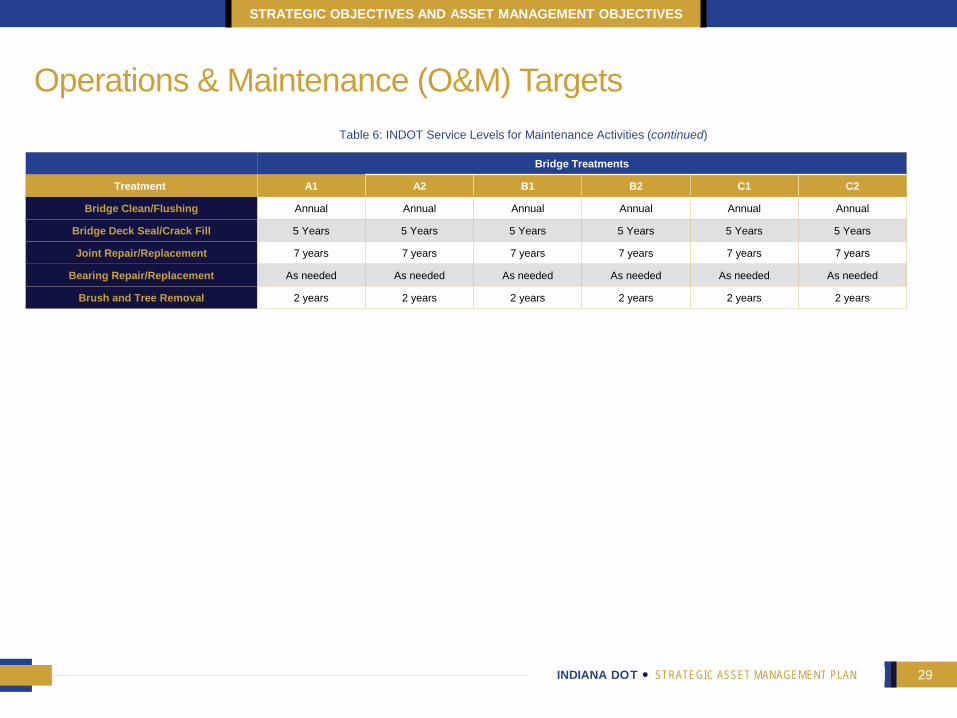
Operations and Maintenance (O&M) Service Level TargetsINDOT has established maintenance and customer response measures to meet their Service Levels for INDOT’s roadways and other assets. INDOT’s Service Level maintenance activities are categorized by the nature of activity and the cause for occurrence. The following tables represent INDOT’s cyclical maintenance activities, and their frequencies, that are programmed according to INDOT’s Maintenance Owner’s Manual. Interventions are categorized by Pavement, Roadside, Drainage, Traffic, and Bridge Treatments.23
Operations and Maintenance (O&M) Targets
23 “Maintenance Owner’s Manual 5-26-20,” Excel spreadsheet of maintenance activities, Indiana Department of Transportation, May 26, 2020.
STRATEGIC OBJECTIVES AND ASSET MANAGEMENT OBJECTIVES
Pavement Treatments
Roadway Type
Treatment A1 A2 B1 B2 C1 C2
Asphalt Crack Seal Every 3 years Every 3 years Every 3 years Every 3 years Every 3 years Every 3 years
Blading Shoulders Every 3 years Every 3 years Every 3 years Every 3 years
Clipping Shoulders Every 3 Years Every 3 years Every 3 years Every 3 years Every 3 years Every 3 years
Chip Seal Every 6 years
Roadside Treatments
Treatment A1 A2 B1 B2 C1 C2
Mowing 5 cycles 3 cycles 5 cycles 2 cycles 2 cycles 2 cycles
Herbicide Annual Annual Annual Annual Annual Annual
Attenuator Inspection Annual Annual Annual Annual Annual Annual
Guardrail End Treatment Inspection 4 Years 4 Years 4 Years 4 Years 4 Years 4 Years
Litter Removal Monthly 5x per Year Monthly As Needed As Needed As Needed
Sweeping (Urban Areas) Monthly N/A Monthly N/A 2x Year N/A
Table 6: INDOT Service Levels for Maintenance Activities

INDIANA DOT STRATEGIC ASSET MANAGEMENT PLAN 28
Operations & Maintenance (O&M) Targets
STRATEGIC OBJECTIVES AND ASSET MANAGEMENT OBJECTIVES
Drainage Treatments
Treatment A1 A2 B1 B2 C1 C2
Pipe Inspection 4 Years 4 Years 4 Years 4 Years 4 Years 4 Years
Drain Cleaning Annual Annual Annual
Underdrain Cleaning and Inspection Annual Annual Annual Annual Annual Annual
Traffic Treatments
Treatment A1 A2 B1 B2 C1 C2
Sign Modernization 20 Years 20 Years 20 Years 20 Years 20 Years 20 Years
Panel Sign Inspection 5 Years 5 Years 5 Years 5 Years 5 Years 5 Years
Delineator/Reflector Maintenance Annual Annual Annual Annual Annual Annual
Re-Striping (Paint Markings) Annual Annual Annual Annual Annual Annual
Special Markings Inspection Annual Annual Annual Annual Annual Annual
Signal PM 2x Year 2x Year 2x Year 2x Year 2x Year 2x Year
Flasher PM Annual Annual Annual Annual Annual Annual
Signal Indication Replacement 10 Years 10 Years 10 Years 10 Years 10 Years 10 Years
Signal Overhead Inspection 5 Years 5 Years 5 Years 5 Years 5 Years 5 Years
Lighting Surveillance Monthly Monthly Monthly Monthly Monthly Monthly
Lighting Re-Lamp (HPS) 2 Years 3 Years 2 Years 3 Years 3 Years 3 Years
Lighting Re-Lamp (LED) 15 Years 15 Years 15 Years 15 Years 15 Years 15 Years
Table 6: INDOT Service Levels for Maintenance Activities (continued)
INDIANA DOT STRATEGIC ASSET MANAGEMENT PLAN 29
Operations & Maintenance (O&M) Targets
STRATEGIC OBJECTIVES AND ASSET MANAGEMENT OBJECTIVES
Bridge Treatments
Treatment A1 A2 B1 B2 C1 C2
Bridge Clean/Flushing Annual Annual Annual Annual Annual Annual
Bridge Deck Seal/Crack Fill 5 Years 5 Years 5 Years 5 Years 5 Years 5 Years
Joint Repair/Replacement 7 years 7 years 7 years 7 years 7 years 7 years
Bearing Repair/Replacement As needed As needed As needed As needed As needed As needed
Brush and Tree Removal 2 years 2 years 2 years 2 years 2 years 2 years
Table 6: INDOT Service Levels for Maintenance Activities (continued)
INDIANA DOT STRATEGIC ASSET MANAGEMENT PLAN 30
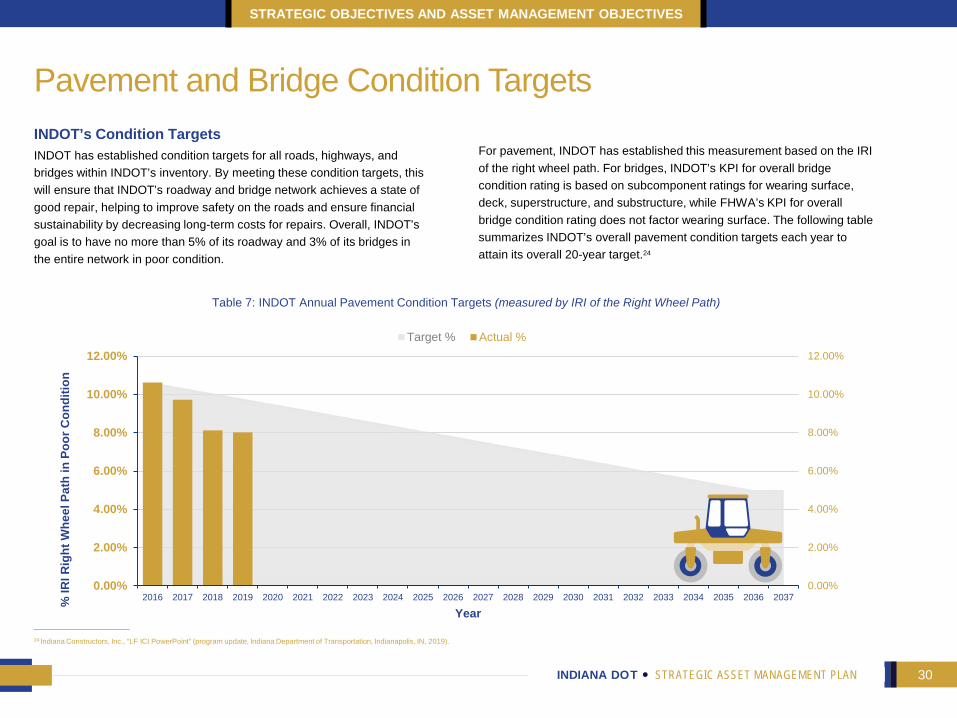
INDOT’s Condition TargetsINDOT has established condition targets for all roads, highways, and bridges within INDOT’s inventory. By meeting these condition targets, this will ensure that INDOT’s roadway and bridge network achieves a state of good repair, helping to improve safety on the roads and ensure financial sustainability by decreasing long-term costs for repairs. Overall, INDOT’s goal is to have no more than 5% of its roadway and 3% of its bridges in the entire network in poor condition.
0.00%
2.00%
4.00%
6.00%
8.00%
10.00%
12.00%
0.00%
2.00%
4.00%
6.00%
8.00%
10.00%
12.00%
2016 2017 2018 2019 2020 2021 2022 2023 2024 2025 2026 2027 2028 2029 2030 2031 2032 2033 2034 2035 2036 2037% IR
I Rig
ht W
heel
Pat
h in
Poo
r Con
ditio
n
Year
Target % Actual %
Pavement and Bridge Condition Targets
24 Indiana Constructors, Inc., “LF ICI PowerPoint” (program update, Indiana Department of Transportation, Indianapolis, IN, 2019).
Table 7: INDOT Annual Pavement Condition Targets (measured by IRI of the Right Wheel Path)
STRATEGIC OBJECTIVES AND ASSET MANAGEMENT OBJECTIVES
For pavement, INDOT has established this measurement based on the IRI of the right wheel path. For bridges, INDOT’s KPI for overall bridge condition rating is based on subcomponent ratings for wearing surface, deck, superstructure, and substructure, while FHWA’s KPI for overall bridge condition rating does not factor wearing surface. The following table summarizes INDOT’s overall pavement condition targets each year to attain its overall 20-year target.24

INDIANA DOT STRATEGIC ASSET MANAGEMENT PLAN 31INDIANA DOT STRATEGIC ASSET MANAGEMENT PLAN
Asset Portfolio-Level Plan
INDIANA DOT STRATEGIC ASSET MANAGEMENT PLAN 32
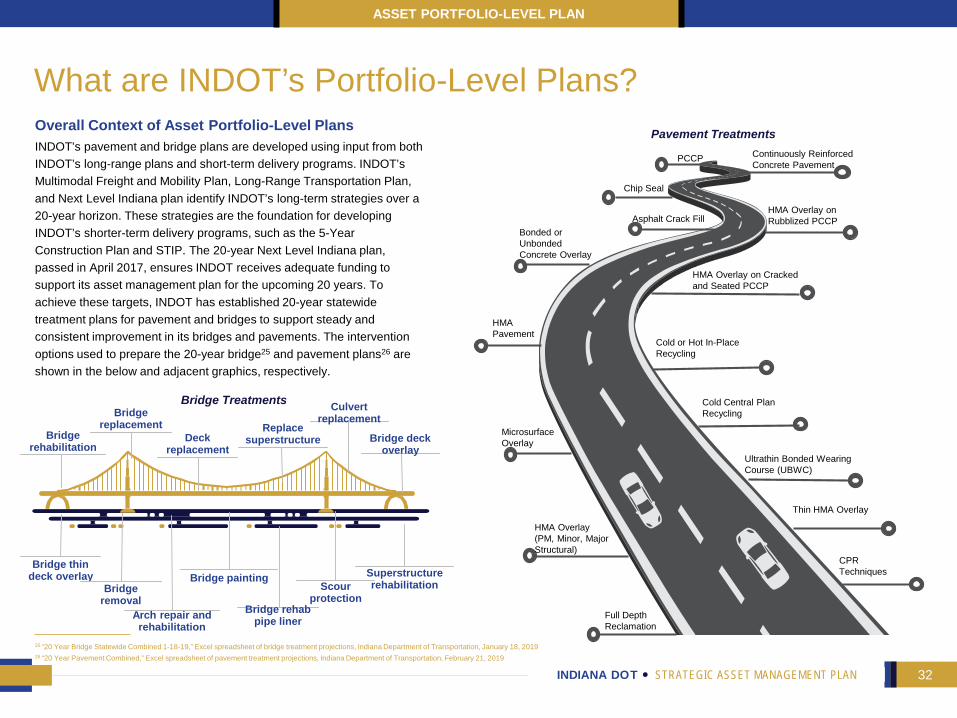
Overall Context of Asset Portfolio-Level PlansINDOT’s pavement and bridge plans are developed using input from both INDOT’s long-range plans and short-term delivery programs. INDOT’sMultimodal Freight and Mobility Plan, Long-Range Transportation Plan, and Next Level Indiana plan identify INDOT’s long-term strategies over a 20-year horizon. These strategies are the foundation for developing INDOT’s shorter-term delivery programs, such as the 5-Year Construction Plan and STIP. The 20-year Next Level Indiana plan, passed in April 2017, ensures INDOT receives adequate funding to support its asset management plan for the upcoming 20 years. To achieve these targets, INDOT has established 20-year statewide treatment plans for pavement and bridges to support steady and consistent improvement in its bridges and pavements. The intervention options used to prepare the 20-year bridge25 and pavement plans26 are shown in the below and adjacent graphics, respectively.
What are INDOT’s Portfolio-Level Plans?
ASSET PORTFOLIO-LEVEL PLAN
25 “20 Year Bridge Statewide Combined 1-18-19,” Excel spreadsheet of bridge treatment projections, Indiana Department of Transportation, January 18, 201926 “20 Year Pavement Combined,” Excel spreadsheet of pavement treatment projections, Indiana Department of Transportation, February 21, 2019
Bridge rehabilitation
Bridge replacement
Deck replacement
Replace superstructure
Culvert replacement
Bridge deck overlay
Bridge thin deck overlay
Bridge removal
Arch repair and rehabilitation
Bridge painting
Bridge rehab pipe liner
Scour protection
Superstructure rehabilitation
Continuously Reinforced Concrete Pavement
PCCP
Chip Seal
Asphalt Crack FillBonded or UnbondedConcrete Overlay
HMA Pavement
HMA Overlay on Rubblized PCCP
HMA Overlay on Cracked and Seated PCCP
HMA Overlay (PM, Minor, Major Structural)
Cold or Hot In-Place Recycling
Cold Central Plan Recycling
Ultrathin Bonded Wearing Course (UBWC)
Thin HMA Overlay
MicrosurfaceOverlay
CPR Techniques
Full Depth Reclamation
Pavement Treatments
Bridge Treatments

INDIANA DOT STRATEGIC ASSET MANAGEMENT PLAN 33
How do INDOT’s Portfolio Plans Translate to Bridges and Pavement? Role of the STIPINDOT’s 20-year bridge and pavement plans help inform and influence decision-making in INDOT’s preparation of its annual STIP. The STIP is a four-year fiscally constrained document that identifies all projects for which INDOT anticipates receiving Federal funding within the upcoming four years and all state projects that INDOT has identified as regionally significant.27 The STIP includes a list of INDOT’s planned state preservation and local initiated projects for the upcoming four years, forming the foundation of INDOT’s near-term capital program. The STIP includes each county’s list of planned projects and each project’s anticipated capital needs per fiscal year, as well as Federal aid and state matches and the estimated cost to complete the project, the latter of which may extend beyond the four-year scope of the STIP.
Impact of 20-Year Plans on Pavement and Bridge ConditionsThrough increased investment in its pavement and bridge preservation programs through Next Level Indiana, INDOT can expect to achieve its 20-year condition targets for its pavement and bridge portfolio of assets. With a planned average investment of $469 million annually in pavement preservation over the next ten years, INDOT anticipates steady improvement in the conditions of its statewide roadway network, achieving 95% of overall pavement in fair or better condition (INDOT KPI) within 20-years. Similarly, by investing an average of $481 million annually in bridge preservation, INDOT anticipates steady improvement in bridge conditions,28 achieving 97% of statewide bridges in fair or better condition (INDOT KPI) within 20-years. The following charts depict the positive impacts of INDOT’s investment in its bridge and pavement preservation programs on conditions, as well as the negative impacts that may result if taking no action to invest in bridge or pavement preservation.29
ASSET PORTFOLIO-LEVEL PLAN
27 Indiana Department of Transportation, Statewide Transportation Improvement Plan, 2018-202128 “Targets 6.24.20 vs. 9.20.19,” Excel spreadsheet of legislative funding targets for bridges and pavement. Indiana Department of Transportation, August 12, 2020.29Indiana Department of Transportation, Transportation Asset Management Plan, August 2019
84%
86%
88%
90%
92%
94%
96%
98%
100%
2015 2017 2019 2021 2023 2025 2027 2029 2031 2033 2035 2037 2039Perc
ent F
air o
r Bet
ter B
ridge
s
Bridge Preservation $481M/yr Do Nothing Baseline
Figure 16: INDOT Projected Bridge Conditions against Investments
72%
76%
80%
84%
88%
92%
96%
100%
2015 2017 2019 2021 2023 2025 2027 2029 2031 2033 2035 2037Perc
ent F
air o
r Bet
ter P
avem
ent
Pavement Preservation $469M/yr Do Nothing Baseline
Figure 17: INDOT Projected Pavement Conditions against Investments

INDIANA DOT STRATEGIC ASSET MANAGEMENT PLAN 34INDIANA DOT STRATEGIC ASSET MANAGEMENT PLAN
Financial Plan to Achieve Asset Management Objectives

INDIANA DOT STRATEGIC ASSET MANAGEMENT PLAN 35
What is INDOT’s Financial Plan for Bridges and Pavement?Overview of INDOT’s Investment Financial PlansTo achieve INDOT’s condition targets for its bridges and pavement, INDOT plans to spend an average of $481 million annually for its bridge preservation plan and $469 million annually for its pavement preservation plan from years FY20 to FY30.30 To support this investment, INDOT expects an increase in available revenue through additional funding from Next Level Indiana. Next Level Indiana dedicates more than $30 billion total from years 2017 to 2037 to improve the conditions of existing roads and bridges, finishing major state and local projects and building for the future.31 Next Level Indiana provides additional revenue to the State of Indiana through a fuel tax increase on gasoline, increase of special fuel tax, increase of motor carrier surcharge tax, transportation improvement fee for all vehicle registrations, supplemental registration fee for electric vehicles, and redirection of sales taxes on fuel from the state general fund to dedicated highway funds.
Year FY Funding Total
Estimated Funding for Pavement
Estimated Funding for Bridges
FY20 $859.2 $424.2 $435.0FY21 $833.2 $411.3 $421.9FY22 $873.1 $431.0 $442.1FY23 $901.4 $445.0 $456.4FY24 $920.7 $454.5 $466.2FY25 $946.0 $467.0 $479.0FY26 $971.3 $479.4 $491.8FY27 $997.8 $492.6 $505.2FY28 $1,022.2 $504.6 $517.6FY29 $1,047.5 $517.1 $530.4FY30 $1,068.5 $527.5 $541.0
FINANCIAL PLAN TO ACHIEVE ASSET MANAGEMENT OBJECTIVES
Table 8: INDOT Forecasted Total Available Funding for Bridges and Pavement, FY20-FY30 ($ Millions)*
*Note: All funding values in the table have been inflated using a projected rate.
30“Asset Targets 6.24.20 vs. 9.20.19,” Excel spreadsheet of legislative funding targets for bridges and pavement. Indiana Department of Transportation, August 12, 2020. 31 Indiana Constructors, Inc., “LF ICI PowerPoint” (program update, Indiana Department of Transportation, Indianapolis, IN, 2019)32 Asset Targets 6.24.20 vs. 9.20.19,” Excel spreadsheet of legislative funding targets for bridges and pavement. Indiana Department of Transportation, August 12, 2020.“
FY20-FY30 Financial Estimates INDOT has estimated its annual legislative funding for years FY20 through FY30 for its bridges, pavement, and safety. The following table below represents INDOT’s anticipated fiscal year total Federal and state funding available for bridges and pavement. INDOT anticipates a steady increase in its fiscal year funding from $859 million annually in FY20 to nearly $1.1 billion in FY30.32
INDIANA DOT STRATEGIC ASSET MANAGEMENT PLAN 36
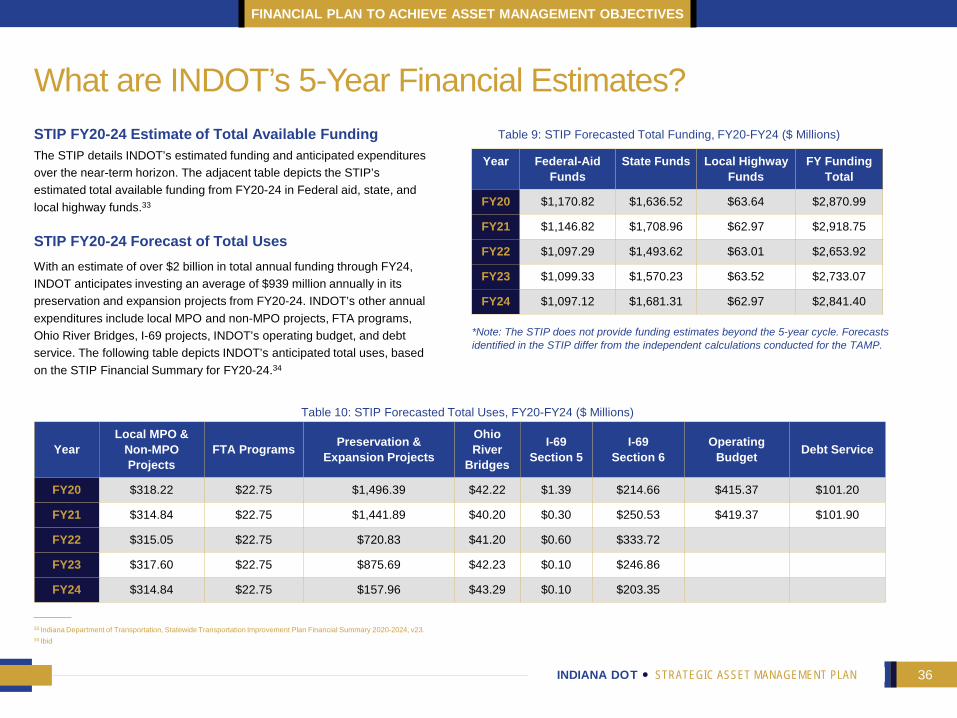
What are INDOT’s 5-Year Financial Estimates? STIP FY20-24 Estimate of Total Available FundingThe STIP details INDOT’s estimated funding and anticipated expenditures over the near-term horizon. The adjacent table depicts the STIP’s estimated total available funding from FY20-24 in Federal aid, state, and local highway funds.33
Year Federal-Aid Funds
State Funds Local Highway Funds
FY Funding Total
FY20 $1,170.82 $1,636.52 $63.64 $2,870.99
FY21 $1,146.82 $1,708.96 $62.97 $2,918.75
FY22 $1,097.29 $1,493.62 $63.01 $2,653.92
FY23 $1,099.33 $1,570.23 $63.52 $2,733.07
FY24 $1,097.12 $1,681.31 $62.97 $2,841.40
Table 9: STIP Forecasted Total Funding, FY20-FY24 ($ Millions)
*Note: The STIP does not provide funding estimates beyond the 5-year cycle. Forecasts identified in the STIP differ from the independent calculations conducted for the TAMP.
STIP FY20-24 Forecast of Total UsesWith an estimate of over $2 billion in total annual funding through FY24, INDOT anticipates investing an average of $939 million annually in its preservation and expansion projects from FY20-24. INDOT’s other annual expenditures include local MPO and non-MPO projects, FTA programs, Ohio River Bridges, I-69 projects, INDOT’s operating budget, and debt service. The following table depicts INDOT’s anticipated total uses, based on the STIP Financial Summary for FY20-24.34
33 Indiana Department of Transportation, Statewide Transportation Improvement Plan Financial Summary 2020-2024, v23.34 Ibid
FINANCIAL PLAN TO ACHIEVE ASSET MANAGEMENT OBJECTIVES
YearLocal MPO &
Non-MPOProjects
FTA Programs Preservation & Expansion Projects
Ohio River
Bridges
I-69Section 5
I-69Section 6
Operating Budget Debt Service
FY20 $318.22 $22.75 $1,496.39 $42.22 $1.39 $214.66 $415.37 $101.20
FY21 $314.84 $22.75 $1,441.89 $40.20 $0.30 $250.53 $419.37 $101.90
FY22 $315.05 $22.75 $720.83 $41.20 $0.60 $333.72
FY23 $317.60 $22.75 $875.69 $42.23 $0.10 $246.86
FY24 $314.84 $22.75 $157.96 $43.29 $0.10 $203.35
Table 10: STIP Forecasted Total Uses, FY20-FY24 ($ Millions)
INDIANA DOT STRATEGIC ASSET MANAGEMENT PLAN 37INDIANA DOT STRATEGIC ASSET MANAGEMENT PLAN
Decision-Making Criteria
INDIANA DOT STRATEGIC ASSET MANAGEMENT PLAN 38
How does INDOT Make Investment Decisions in its Bridges? Overview of Bridge and Culvert Decision-MakingINDOT’s Bridge Asset Management Team (BAMT) is responsible for establishing INDOT’s current practices for developing INDOT’s bridge investment strategy. The Bridge Asset Management Team uses data-driven decision-making to identify the most cost effective improvement projects for INDOT’s bridges, large culverts (4’-20’), and small culverts (<4’).
INDOT begins its investment decision-making process based on known budgetary constraints. Through Next Level Indiana, INDOT plans to invest an average of approximately $481 million annually for its bridge preservation plan from years FY20 to FY30.35 INDOT has also developed budgetary forecasts for the upcoming five years using projections within the STIP, as well as estimates through FY27 for the FHWA TAMP.
INDOT uses the 20-year plan as the basis for its overall bridge asset strategy. From the 20-year plan, INDOT then develops an initial list of its bridge treatment priorities from an optimized list of treatments provided by the Deighton Total Infrastructure Management System’s (dTIMS) bridge management system (BMS). The software uses simulation modeling to forecast the deterioration for each asset using condition and inventory data. The software forecasts deterioration, identifies potential performance gaps in relation to condition targets, and visualizes the impacts of various alternative treatment strategies on an asset’s condition. dTIMS considers all eligible treatment strategies to a produce a benefit-cost-effective strategy for improving the condition of the asset portfolio. dTIMS uses historical costs from the previous four years to develop cost estimates of treatments and produces a cost-effective strategy based on known budget constraints.36
DECISION-MAKING CRITERIA
35“Asset Targets 6.24.20 vs. 9.20.19,” Excel spreadsheet of legislative funding targets for bridges and pavement. Indiana Department of Transportation, August 12, 2020. 36ndiana Department of Transportation, Transportation Asset Management Plan, August 201937Indiana Department of Transportation, “Scoring Guidelines and Business Rules for Bridge and Large Culvert Asset Program,” August 23, 2018
Bridge Project Scoring Methodology After identifying candidate projects recommended during the lifecycle cost analysis process, the Bridge Asset Management Team uses a project scoring methodology to prioritize projects. The purpose of the scoring system is to demonstrate INDOT’s investment decision-making and better understand how projects should be prioritized for the capital program. Unique project scoring systems have been developed based on whether the candidate project falls into one of the following categories:37
Project addressing a unique bridge deficiency (e.g., paint and scour)
Bridge rehabilitation, major construction, or replacement project
Large culvert and structure project
Exceptions, any project that is an exception to the rules, including projects that fall within the Bridge and Culvert Preventative Maintenance Agreement (BCPMA).
INDOT’s Bridge Asset Engineers (BAEs) evaluate the recommended projects provided by dTIMS using the project scoring system and based on their field and engineering knowledge. Based on their recommendations, projects are then submitted for statewide deliberation for inclusion in the capital program.
INDIANA DOT STRATEGIC ASSET MANAGEMENT PLAN 39
Condition of the Asset
Cost-Effectiveness of the Project
Functional Classification Priority (e.g., roadway category and associated traffic of volume carried per the category)
Average Annual Daily Traffic (AADT)
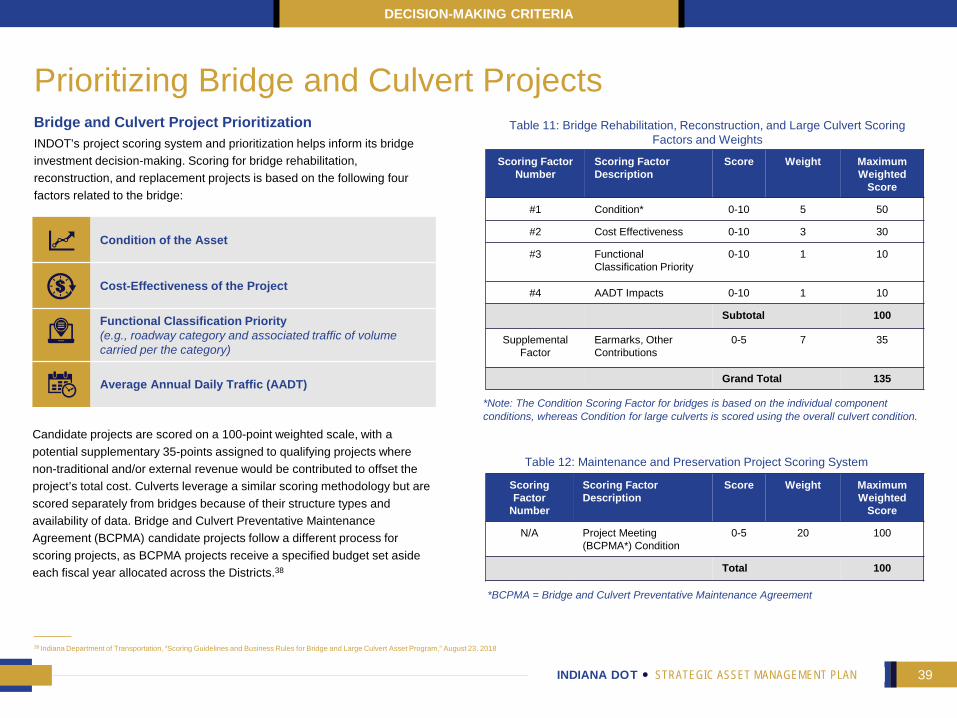
Prioritizing Bridge and Culvert ProjectsBridge and Culvert Project PrioritizationINDOT’s project scoring system and prioritization helps inform its bridge investment decision-making. Scoring for bridge rehabilitation, reconstruction, and replacement projects is based on the following four factors related to the bridge:
DECISION-MAKING CRITERIA
Candidate projects are scored on a 100-point weighted scale, with a potential supplementary 35-points assigned to qualifying projects where non-traditional and/or external revenue would be contributed to offset the project’s total cost. Culverts leverage a similar scoring methodology but are scored separately from bridges because of their structure types and availability of data. Bridge and Culvert Preventative Maintenance Agreement (BCPMA) candidate projects follow a different process for scoring projects, as BCPMA projects receive a specified budget set aside each fiscal year allocated across the Districts.38
38 Indiana Department of Transportation, “Scoring Guidelines and Business Rules for Bridge and Large Culvert Asset Program,” August 23, 2018
Scoring FactorNumber
Scoring Factor Description
Score Weight Maximum Weighted
Score
#1 Condition* 0-10 5 50
#2 Cost Effectiveness 0-10 3 30
#3 Functional Classification Priority
0-10 1 10
#4 AADT Impacts 0-10 1 10
Subtotal 100
SupplementalFactor
Earmarks, Other Contributions
0-5 7 35
Grand Total 135
Scoring Factor
Number
Scoring Factor Description
Score Weight Maximum Weighted
Score
N/A Project Meeting (BCPMA*) Condition
0-5 20 100
Total 100
*BCPMA = Bridge and Culvert Preventative Maintenance Agreement
*Note: The Condition Scoring Factor for bridges is based on the individual component conditions, whereas Condition for large culverts is scored using the overall culvert condition.
Table 11: Bridge Rehabilitation, Reconstruction, and Large Culvert Scoring Factors and Weights
Table 12: Maintenance and Preservation Project Scoring System
INDIANA DOT STRATEGIC ASSET MANAGEMENT PLAN 40
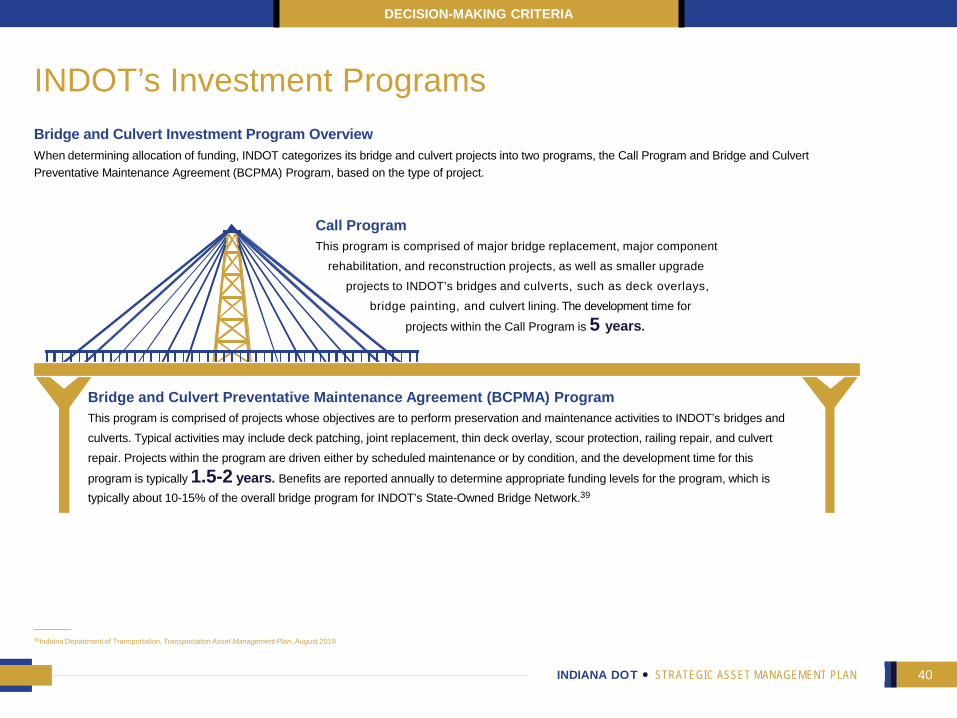
INDOT’s Investment ProgramsBridge and Culvert Investment Program OverviewWhen determining allocation of funding, INDOT categorizes its bridge and culvert projects into two programs, the Call Program and Bridge and Culvert Preventative Maintenance Agreement (BCPMA) Program, based on the type of project.
Bridge and Culvert Preventative Maintenance Agreement (BCPMA) Program This program is comprised of projects whose objectives are to perform preservation and maintenance activities to INDOT’s bridges and culverts. Typical activities may include deck patching, joint replacement, thin deck overlay, scour protection, railing repair, and culvert repair. Projects within the program are driven either by scheduled maintenance or by condition, and the development time for this
program is typically 1.5-2 years. Benefits are reported annually to determine appropriate funding levels for the program, which is typically about 10-15% of the overall bridge program for INDOT’s State-Owned Bridge Network.39
Call ProgramThis program is comprised of major bridge replacement, major component
rehabilitation, and reconstruction projects, as well as smaller upgrade projects to INDOT’s bridges and culverts, such as deck overlays,
bridge painting, and culvert lining. The development time for
projects within the Call Program is 5 years.
39Indiana Department of Transportation, Transportation Asset Management Plan, August 2019
DECISION-MAKING CRITERIA
INDIANA DOT STRATEGIC ASSET MANAGEMENT PLAN 41
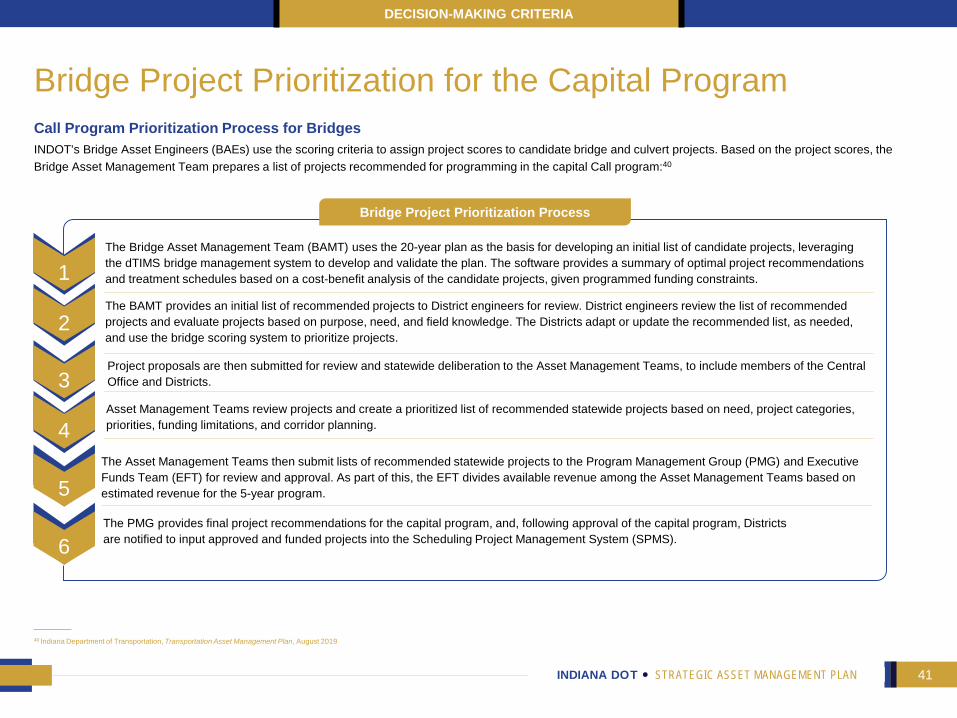
Bridge Project Prioritization for the Capital Program Call Program Prioritization Process for Bridges INDOT’s Bridge Asset Engineers (BAEs) use the scoring criteria to assign project scores to candidate bridge and culvert projects. Based on the project scores, the Bridge Asset Management Team prepares a list of projects recommended for programming in the capital Call program:40
DECISION-MAKING CRITERIA
40 Indiana Department of Transportation, Transportation Asset Management Plan, August 2019
Bridge Project Prioritization Process
The BAMT provides an initial list of recommended projects to District engineers for review. District engineers review the list of recommended projects and evaluate projects based on purpose, need, and field knowledge. The Districts adapt or update the recommended list, as needed, and use the bridge scoring system to prioritize projects.
Project proposals are then submitted for review and statewide deliberation to the Asset Management Teams, to include members of the Central Office and Districts.
Asset Management Teams review projects and create a prioritized list of recommended statewide projects based on need, project categories, priorities, funding limitations, and corridor planning.
The Asset Management Teams then submit lists of recommended statewide projects to the Program Management Group (PMG) and Executive Funds Team (EFT) for review and approval. As part of this, the EFT divides available revenue among the Asset Management Teams based on estimated revenue for the 5-year program.
The PMG provides final project recommendations for the capital program, and, following approval of the capital program, Districts are notified to input approved and funded projects into the Scheduling Project Management System (SPMS).
The Bridge Asset Management Team (BAMT) uses the 20-year plan as the basis for developing an initial list of candidate projects, leveraging the dTIMS bridge management system to develop and validate the plan. The software provides a summary of optimal project recommendationsand treatment schedules based on a cost-benefit analysis of the candidate projects, given programmed funding constraints. 1
2
3
4
6
5
INDIANA DOT STRATEGIC ASSET MANAGEMENT PLAN 42
How does INDOT Make Pavement Investment Decisions?Overview of Pavement Decision-MakingINDOT’s Roadway Asset Team is responsible for establishing INDOT’s current practices for developing the INDOT’s pavement investment strategy. INDOT uses data-driven decision making to identify cost-effective improvement projects for INDOT’s pavements, while meeting service levels and balancing the appropriate level of risk.
INDOT begins its pavement investment decision-making process based on known budgetary constraints. INDOT plans to invest an average of approximately $469 million annually for its pavement preservation plan from years FY20 to FY30.41 INDOT has also developed budgetary forecasts for the upcoming five years using projections within the STIP, as well as estimates through FY27 developed for the FHWA TAMP.
INDOT uses the 20-year plan as the basis for its overall pavement asset strategy. INDOT uses the dTIMS’ pavement management system to develop and validate the 20-year plan, preparing an initial list of candidate projects. The software uses simulation modeling to forecast pavement deterioration, identify potential performance gaps in relation to condition targets, and visualize the impacts of various alternative treatment strategies on the asset’s condition. The software considers all eligible treatment strategies to identify an optimal strategy for improving the condition of the portfolio. Based on user-defined costs, dTIMS develops cost estimates of treatments and produces a cost-effective strategy based on known budget constraints.42
DECISION-MAKING CRITERIA
41“Asset Targets 6.24.20 vs. 9.20.19,” Excel spreadsheet of legislative funding targets for bridges and pavement. Indiana Department of Transportation, August 12, 2020. 42Indiana Department of Transportation, Transportation Asset Management Plan, August 201943 Indiana Department of Transportation, “Roadway Asset Scoring Rules,” August 2019.
Pavement Project Scoring Methodology After identifying candidate projects recommended during the lifecycle cost analysis process, the Roadway Asset Team uses a project scoring methodology to prioritize projects. The purpose of the scoring system is to demonstrate INDOT’s investment decision-making and better understand how projects should be prioritized for the capital program. The project scoring system uses project-level data on condition and traffic and assesses projects based on pavement material (e.g., HMA or PCCP), accounting for differences in the performance and needs of the pavement types. Projects are scored based on the level of cracking, roughness, roadway category, truck volume, and cost effectiveness.43 INDOT reviews and updates its scoring methodology on an annual basis.
INDOT uses roadway condition data when evaluating roadway improvement projects. Data is collected annually by evaluation zones based on the location on the roadway and entered into the system for evaluation.
The output of the dTIMS model provides a list of candidate projects, with associated benefit-cost effectiveness, for inclusion in the capital program.
The dTIMS model considers four condition factors related to the deterioration of the pavement:
International Roughness Index (IRI)(roughness of the pavement)
RUT(depressions or grooves in the roadway; used for HMA only)
1
2
4
3
Distress Box Area (DBA)(percentage of cracking along the segmentation)
Faulting (Used for PCCP only; refers to displacement of pavement at the joints or cracks along the roadway).
INDIANA DOT STRATEGIC ASSET MANAGEMENT PLAN 43
Pavement Project Prioritization for the Capital Program
DECISION-MAKING CRITERIA
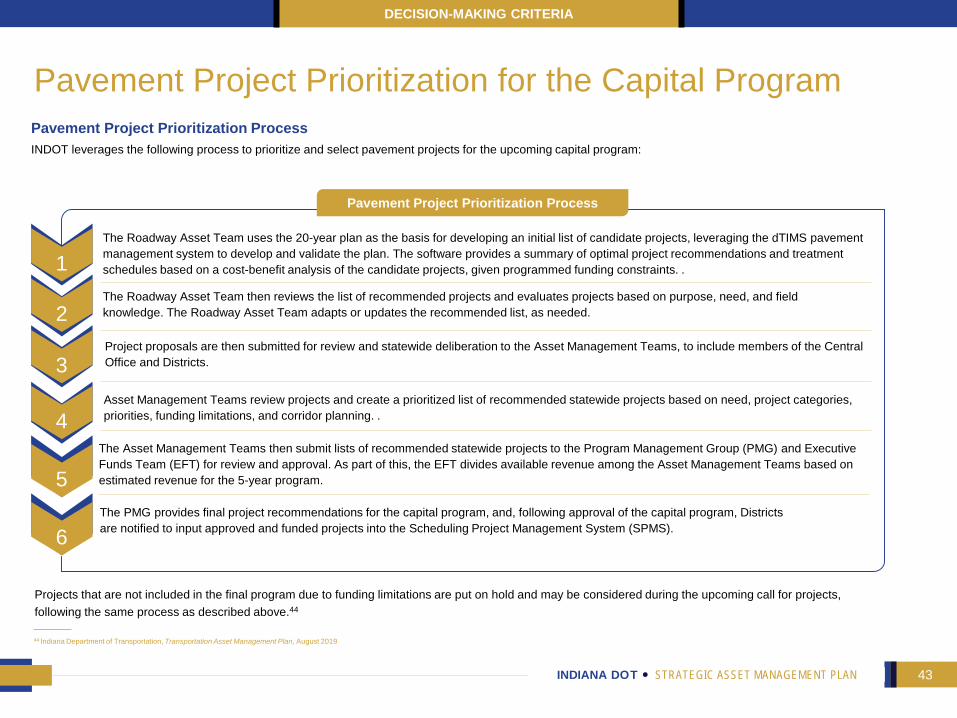
Projects that are not included in the final program due to funding limitations are put on hold and may be considered during the upcoming call for projects, following the same process as described above.44
Pavement Project Prioritization ProcessINDOT leverages the following process to prioritize and select pavement projects for the upcoming capital program:
Pavement Project Prioritization Process
The Roadway Asset Team then reviews the list of recommended projects and evaluates projects based on purpose, need, and field knowledge. The Roadway Asset Team adapts or updates the recommended list, as needed.
Project proposals are then submitted for review and statewide deliberation to the Asset Management Teams, to include members of the Central Office and Districts.
Asset Management Teams review projects and create a prioritized list of recommended statewide projects based on need, project categories, priorities, funding limitations, and corridor planning. .
The Asset Management Teams then submit lists of recommended statewide projects to the Program Management Group (PMG) and Executive Funds Team (EFT) for review and approval. As part of this, the EFT divides available revenue among the Asset Management Teams based on estimated revenue for the 5-year program.
The PMG provides final project recommendations for the capital program, and, following approval of the capital program, Districts are notified to input approved and funded projects into the Scheduling Project Management System (SPMS).
The Roadway Asset Team uses the 20-year plan as the basis for developing an initial list of candidate projects, leveraging the dTIMS pavement management system to develop and validate the plan. The software provides a summary of optimal project recommendations and treatment schedules based on a cost-benefit analysis of the candidate projects, given programmed funding constraints. . 1
2
3
4
6
5
44 Indiana Department of Transportation, Transportation Asset Management Plan, August 2019
INDIANA DOT STRATEGIC ASSET MANAGEMENT PLAN 44INDIANA DOT STRATEGIC ASSET MANAGEMENT PLAN
Asset Lifecycle Strategies & Other Functional Strategies

INDIANA DOT STRATEGIC ASSET MANAGEMENT PLAN 45
Bridge Thin Deck Overlay
Bridge Rigid Deck Overlay
Bridge Deck Replacement
Bridge Replacement
0 20 40 60 80 100 120 140Year
Goo
dFa
irPo
or
1 5 9 13 17 21 25 29 33 37 41 45 49 53 57 61 65Year
Fair
Goo
d
What is INDOT’s Process for Preparing Lifecycle Strategies for its Bridges and Pavement?
Overview of Asset Lifecycle Strategies
ASSET LIFECYCLE STRATEGIES & OTHER FUNCTIONAL STRATEGIES
45 Indiana Department of Transportation, “Asset Lifecycle Strategies, Bridges,” version 16, August 202046 Indiana Department of Transportation, “Asset Lifecycle Strategies, Pavement,” version 28, August 2020
Consistent with industry good practice, INDOT maintains bridge and pavement management systems to support management of the State’s bridges and roadways. INDOT’s bridge and pavement databases are known as BIAS and Roads and Highways, respectively. These store the asset inventory and condition data that then serve as the foundation for the lifecycle treatment modeling performed using Deighton’s Total Infrastructure Management System (dTIMS) software. The triggers, or criteria, used to determine treatment type and timing are captured in INDOT’s bridge and pavement treatment rules. Details surrounding the asset conditions and associated data attributes that trigger certain treatments are captured in these rules. Collectively, BIAS, Roads and Highways, dTIMS, and INDOT’s treatment rules form the Department’s bridge and pavement systems, which are required by Federal regulations.
Based on the bridge and pavement data stored in INDOT’s databases, and using the triggers and treatment logic, dTIMS software uses simulation modeling to forecast the deterioration for each asset and recommend treatments based on user-defined constraints, such as budgetary constraints and expected bridge and pavement performance. The dTIMSsoftware then considers all potential eligible treatment strategies per asset, for all assets, and identifies an optimal benefit and cost strategy that provides the most cumulative benefit to the network (portfolio) when considering the known budgetary constraints. The impacts of various alternative treatment strategies on an asset’s condition over time can be visualized in dTIMS as depicted in the adjacent figures.45, 46
Figure 18: Illustrative Bridge Decay Curve, Deck Condition (9,000 ft2) (northern Interstate)
Figure 19: Illustrative Asset Decay Curve, HMA A1 Pavement
Preferred
Alternative
Do Nothing
Preferred
Alternative
Do Nothing
Poor
PM Treatment
Minor Structural Treatment
Major Structural Treatment

INDIANA DOT STRATEGIC ASSET MANAGEMENT PLAN 46
What is INDOT’s Process for Bridge Lifecycle Strategies?Bridge Lifecycle Strategies
The 20-year plan outlines INDOT’s asset strategies for bridges. Bridge asset strategies vary by material to reflect the differing needs in the frequency and type of treatments performed based on the material and levels of service.
Based on the underlying deterioration models and the triggers captured in the bridge treatment rules, dTIMS then provides suggested alternative treatment strategies that would enable the asset to achieve a state of good repair, measured by whether INDOT has achieved the established condition target for the overall network, which is to have no more than 3% of bridges in poor condition. The software provides suggestions for both an initial treatment strategy that would address the performance gaps in the short-term and a subsequent long-term strategy to be applied after implementing the initial strategy. Recommended treatments also consider the costs and benefits of the strategies across all assets, using historical data on treatment costs from the previous four years. INDOT verifies and updates the costs within the system on an annual basis. Benefits of the treatments are determined by impacts the treatments may have on the BQI score of the deterioration curves modeled within dTIMS.
After evaluating all costs and impacts, the software produces a benefit-cost-effective list of recommended projects, given the programmed funding constraints. Outputs of dTIMS, in terms of recommended treatments, are then evaluated and verified by INDOT’s bridge engineers, who incorporate their local knowledge of the bridges to approve or update the dTIMS’ list of recommendations.47
INDOT’s bridge treatment rules used within dTIMS describe the eligible treatment types and triggers for each treatment type. The following treatment types are considered for bridges:
INDOT develops lifecycle strategies for bridges within INDOT’s inventory using
a 20-year analysis period. Bridge deterioration is modeled primarily using the following condition rating factors that
comprise the Bridge Quality Index (BQI):
Wearing Surface Deck Condition Superstructure
47 Indiana Department of Transportation, “Asset Lifecycle Strategies, Bridges,” version 16, August 2020
ASSET LIFECYCLE STRATEGIES & OTHER FUNCTIONAL STRATEGIES
Bridge Painting
Deck Overlay
Thin Deck Overlay
Superstructure Replacement
Deck Replacement
Bridge Replacement
Culvert Replacement
Bridge Treatment Types
Substructure Bridge Function Bridge Strength (load rating)
INDIANA DOT STRATEGIC ASSET MANAGEMENT PLAN 47
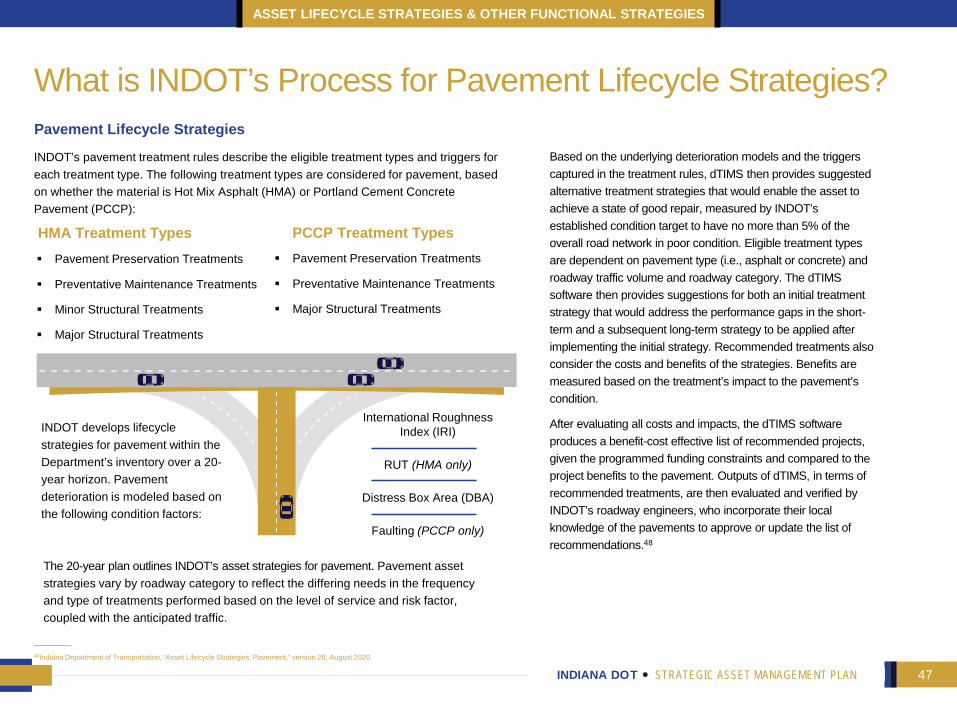
INDOT develops lifecycle strategies for pavement within the Department’s inventory over a 20-year horizon. Pavement deterioration is modeled based on the following condition factors:
International Roughness Index (IRI)
RUT (HMA only)
Distress Box Area (DBA)
Faulting (PCCP only)
Pavement Lifecycle Strategies
Based on the underlying deterioration models and the triggers captured in the treatment rules, dTIMS then provides suggested alternative treatment strategies that would enable the asset to achieve a state of good repair, measured by INDOT’s established condition target to have no more than 5% of the overall road network in poor condition. Eligible treatment types are dependent on pavement type (i.e., asphalt or concrete) and roadway traffic volume and roadway category. The dTIMSsoftware then provides suggestions for both an initial treatment strategy that would address the performance gaps in the short-term and a subsequent long-term strategy to be applied after implementing the initial strategy. Recommended treatments also consider the costs and benefits of the strategies. Benefits are measured based on the treatment’s impact to the pavement’s condition.
After evaluating all costs and impacts, the dTIMS software produces a benefit-cost effective list of recommended projects, given the programmed funding constraints and compared to the project benefits to the pavement. Outputs of dTIMS, in terms of recommended treatments, are then evaluated and verified by INDOT’s roadway engineers, who incorporate their local knowledge of the pavements to approve or update the list of recommendations.48
What is INDOT’s Process for Pavement Lifecycle Strategies?
INDOT’s pavement treatment rules describe the eligible treatment types and triggers for each treatment type. The following treatment types are considered for pavement, based on whether the material is Hot Mix Asphalt (HMA) or Portland Cement Concrete Pavement (PCCP):
48Indiana Department of Transportation, “Asset Lifecycle Strategies, Pavement,” version 28, August 2020
ASSET LIFECYCLE STRATEGIES & OTHER FUNCTIONAL STRATEGIES
Pavement Preservation Treatments
Preventative Maintenance Treatments
Minor Structural Treatments
Major Structural Treatments
HMA Treatment Types Pavement Preservation Treatments
Preventative Maintenance Treatments
Major Structural Treatments
PCCP Treatment Types
The 20-year plan outlines INDOT’s asset strategies for pavement. Pavement asset strategies vary by roadway category to reflect the differing needs in the frequency and type of treatments performed based on the level of service and risk factor, coupled with the anticipated traffic.

INDIANA DOT STRATEGIC ASSET MANAGEMENT PLAN 48INDIANA DOT STRATEGIC ASSET MANAGEMENT PLAN
Capabilities & Competencies

INDIANA DOT STRATEGIC ASSET MANAGEMENT PLAN 49
How does INDOT Identify the Necessary Skills and Competencies to Perform Asset Management? INDOT Asset Management Competency FrameworkThe INDOT Asset Management Competency Framework is a framework that identifies a standard set of skills and competencies needed to perform asset management activities within a staff member’s given position. The framework was developed using the Institute of Asset Management’s (IAM) Competencies framework and is therefore based on industry best practices. INDOT’s Competency Framework can be
CAPABILITIES & COMPETENCIES
Asset Management Implementation
Examines how the complete asset
lifecycle is managed, as well as planning and controlling the delivery of its main
components.
Asset Performance Monitoring
Ensures the organization
acknowledges, understands, and
manages risk effectively, and that
performance is reviewed and
improved over time. Risks include, safety, security, environment
(including climate change), reputation,
and finance.
Asset Management Planning
Focuses on the identification,
appraisal, optimization,
prioritization of asset investment options
and the development of effective asset
management plans to implement the
asset management strategy and deliver
on objectives.
Asset Information Management
Defines the asset information needed, how it is gathered
and analyzed, how it is interpreted and
managed, and how the knowledge
generated is applied.
Asset Management Capabilities
Manages or influences the processes that
support effective delivery of the asset
management strategy, objectives, and plans. Ensures
competence is developed and managed in the boardroom, the
workplace, and the supply chain.
Policy & Strategy Development
Ensures asset management
activities are aligned with and achieve the
organizational strategic plan.
Includes policy-making, identifying
strategic requirements,
demand analysis and forecasting, and
strategy development.
49KPMG, “INDOT Asset Management Phase 2 Steering Committee Meeting” (program update, Indiana Department of Transportation Asset Management Steering Committee, Indianapolis, IN, October 2018)
leveraged to optimize the delivery and performance of the Agency’s asset management personnel and will allows INDOT to review select positions related to asset management roles within the organization (e.g., bridge engineer) and accurately assign the competency levels needed for these positions.49 The framework is structured around the following key roles related to asset management:
Table 13: Skills and Competencies Framework Key Roles
INDIANA DOT STRATEGIC ASSET MANAGEMENT PLAN 50
How is INDOT Augmenting its Asset Management Capabilities? Select Positions Related to Asset ManagementThe following Central Office and District positions within INDOT have significant asset management activity competency requirements:50
CAPABILITIES & COMPETENCIES
Individuals who hold these positions qualify as candidates for the Asset Management Competency Framework and may leverage the framework to determine the required skills and competencies for these positions and identify any deficiencies between existing and desired competencies.
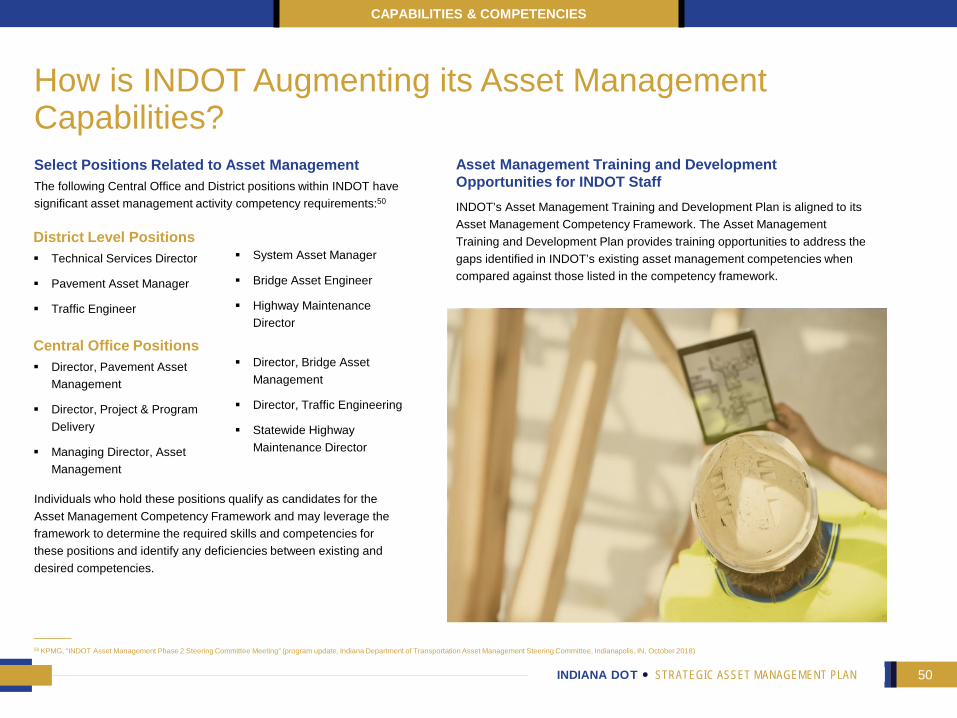
Asset Management Training and Development Opportunities for INDOT StaffINDOT’s Asset Management Training and Development Plan is aligned to its Asset Management Competency Framework. The Asset Management Training and Development Plan provides training opportunities to address the gaps identified in INDOT’s existing asset management competencies when compared against those listed in the competency framework.
District Level Positions Technical Services Director
Pavement Asset Manager
Traffic Engineer
System Asset Manager
Bridge Asset Engineer
Highway Maintenance Director
Central Office Positions Director, Pavement Asset
Management
Director, Project & Program Delivery
Managing Director, Asset Management
Director, Bridge Asset Management
Director, Traffic Engineering
Statewide Highway Maintenance Director
50 KPMG, “INDOT Asset Management Phase 2 Steering Committee Meeting” (program update, Indiana Department of Transportation Asset Management Steering Committee, Indianapolis, IN, October 2018)

INDIANA DOT STRATEGIC ASSET MANAGEMENT PLAN 51INDIANA DOT STRATEGIC ASSET MANAGEMENT PLAN
Asset Management Roles & Responsibilities

INDIANA DOT STRATEGIC ASSET MANAGEMENT PLAN 52
Where does Asset Management Fit in the Organization? Overview of the INDOT Organization The INDOT organization is structured by six District offices and one Central Office. Under INDOT’s organization structure, Asset Management falls under the Operations group. The Asset Management group is led by the Statewide Technical Services Director, who reports to the Deputy Commissioner of
ASSET MANAGEMENT ROLES & RESPONSIBILITIES
Figure 20: INDOT Operations Organization Structure
51 “Org Chart,” PDF file, Indiana Department of Transportation, September 2020
Operations. The Asset Management group is comprised of Statewide Technical Services, Pavement Asset Management, Bridge Management, and Inventory and Tracking. The following depicts INDOT’s Operations organization structure.51
Deputy Commissioner of Operations Operations
Operations System Administration & Innovation Dire
Op Process & System Mgmt.
Business Analytics & Visualization
Manager Bus. Analytics &
Visualization
Records ManagerResearch &
Document Library
Operations System Analyst(s)
Op Process & System Mgmt.
Managing Director for Asset ManagementAsset Management
Pavement Area Engineer
Pavement Asset Management
Statewide Technical
Services DirectorStatewide TechnicalServices
Bridge Management
DirectorBridge
Management
Road Inventory Manager
Inventory & Tracking
Highway Engineer(s)
Pavement Asset Management
MIS IT Director Business Information
Technology
Enterprise Applications
ManagerEnterprise & Web
Apps.
Business Operations
Manager Business Operations
ASAP Manager Highway
Management App.
MIS ManagerBusiness Information
Technology
Division Director Traffic Management
Traffic Operations
Director TMD Operations
Technology Support Director
Technology Support
Broadband Executive
Traffic Management
ITS Engineering
Director ITS Engineering
Admin Assistant
Traffic Management
Managing Director of Strategic Planning
Planning
ManagerPlanning
Director Technical
Planning and Programs
Multimodal Director
Modal & Inter-Modal Planning
Director of Traffic
Engineering Traffic
Engineering
Seasonal State Worker Planning
Highway Maintenance
Director Maintenance Mgmt. &
Dist. Supp.
Statewide Fleet Director
Fleet
Logistics Manager Logistical Support
Statewide Facilities Director Facilities
Q/A Manager Maintenance Mgmt. & Dist.
Supp.
Broadband Executive
Maintenance Mgmt. & Dist.
Supp.
Highway Engineer
Maintenance Mgmt. & Dist.
Supp.
Statewide Winter Ops.
Manager Maintenance Mgmt. & Dist.
Supp.
Broadband Executive Emergency
Planning
Roadside Maintenance
SpecialistMaintenance Mgmt. & Dist.
Supp.
Highway Engineer
Supervisor Maintenance Mgmt. & Dist.
Supp.
Seasonal State Worker
Maintenance Mgmt. & Dist.
Supp.
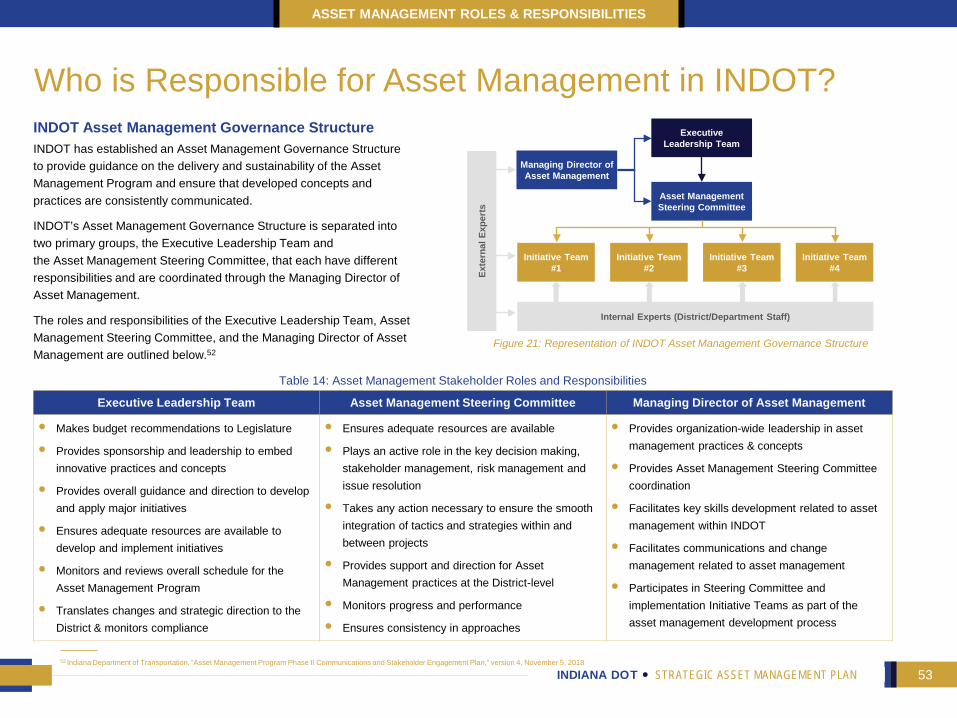
INDIANA DOT STRATEGIC ASSET MANAGEMENT PLAN 53
Who is Responsible for Asset Management in INDOT?
ASSET MANAGEMENT ROLES & RESPONSIBILITIES
INDOT Asset Management Governance Structure INDOT has established an Asset Management Governance Structure to provide guidance on the delivery and sustainability of the Asset Management Program and ensure that developed concepts and practices are consistently communicated.
INDOT’s Asset Management Governance Structure is separated into two primary groups, the Executive Leadership Team and the Asset Management Steering Committee, that each have different responsibilities and are coordinated through the Managing Director of Asset Management.
The roles and responsibilities of the Executive Leadership Team, Asset Management Steering Committee, and the Managing Director of Asset Management are outlined below.52
52 Indiana Department of Transportation, “Asset Management Program Phase II Communications and Stakeholder Engagement Plan,” version 4, November 5, 2018
Executive Leadership Team
Asset Management Steering Committee
Managing Director of Asset Management
Initiative Team #1
Initiative Team #2
Initiative Team #3
Initiative Team #4
Internal Experts (District/Department Staff)
Exte
rnal
Exp
erts
Figure 21: Representation of INDOT Asset Management Governance Structure
Executive Leadership Team Asset Management Steering Committee Managing Director of Asset Management
• Makes budget recommendations to Legislature
• Provides sponsorship and leadership to embed innovative practices and concepts
• Provides overall guidance and direction to develop and apply major initiatives
• Ensures adequate resources are available to develop and implement initiatives
• Monitors and reviews overall schedule for the Asset Management Program
• Translates changes and strategic direction to the District & monitors compliance
• Ensures adequate resources are available
• Plays an active role in the key decision making, stakeholder management, risk management and issue resolution
• Takes any action necessary to ensure the smooth integration of tactics and strategies within and between projects
• Provides support and direction for Asset Management practices at the District-level
• Monitors progress and performance
• Ensures consistency in approaches
• Provides organization-wide leadership in asset management practices & concepts
• Provides Asset Management Steering Committee coordination
• Facilitates key skills development related to asset management within INDOT
• Facilitates communications and change management related to asset management
• Participates in Steering Committee and implementation Initiative Teams as part of the asset management development process
Table 14: Asset Management Stakeholder Roles and Responsibilities
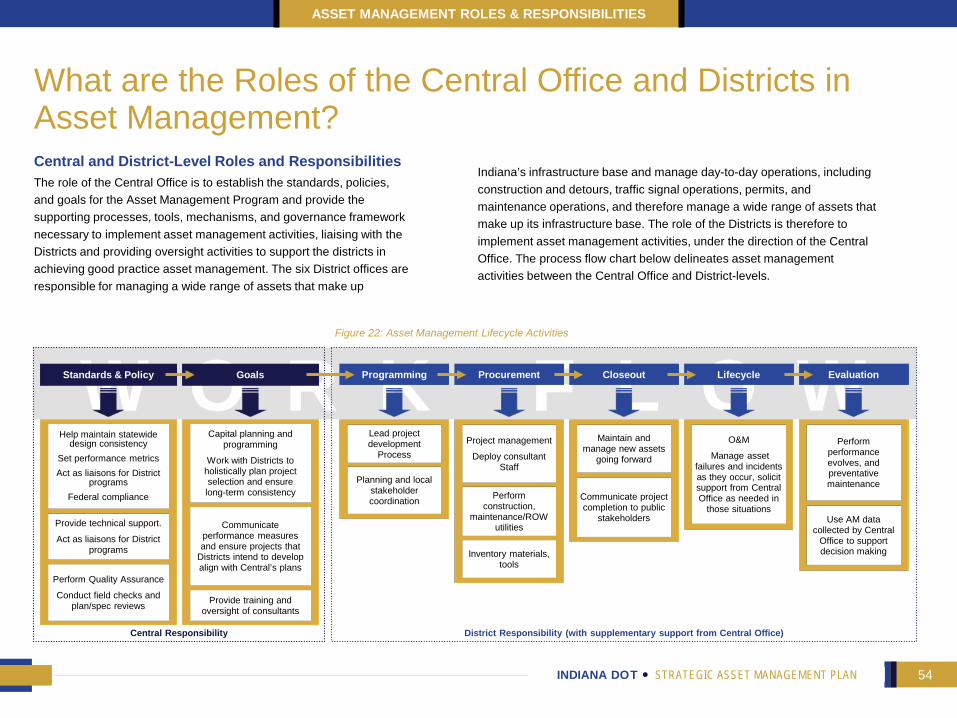
INDIANA DOT STRATEGIC ASSET MANAGEMENT PLAN 54
What are the Roles of the Central Office and Districts in Asset Management? Central and District-Level Roles and Responsibilities The role of the Central Office is to establish the standards, policies, and goals for the Asset Management Program and provide the supporting processes, tools, mechanisms, and governance framework necessary to implement asset management activities, liaising with the Districts and providing oversight activities to support the districts in achieving good practice asset management. The six District offices are responsible for managing a wide range of assets that make up
ASSET MANAGEMENT ROLES & RESPONSIBILITIES
Figure 22: Asset Management Lifecycle Activities
W O R K F L O W
Central Responsibility
Help maintain statewide design consistency
Set performance metricsAct as liaisons for District
programsFederal compliance
Provide technical support.
Act as liaisons for District programs
Perform Quality Assurance
Conduct field checks and plan/spec reviews
Standards & Policy
Provide training and oversight of consultants
Communicate performance measures and ensure projects that
Districts intend to develop align with Central’s plans
Capital planning and programming
Work with Districts to holistically plan project selection and ensure long-term consistency
Goals
Planning and local stakeholder coordination
Lead project development
Process
Programming
Perform construction,
maintenance/ROW utilities
Project management
Deploy consultant Staff
Inventory materials,tools
Procurement
Maintain and manage new assets
going forward
Communicate project completion to public
stakeholders
Closeout
O&M
Manage asset failures and incidents as they occur, solicit support from Central Office as needed in
those situations
Lifecycle
Perform performance evolves, and preventative maintenance
Use AM data collected by Central
Office to support decision making
Evaluation
District Responsibility (with supplementary support from Central Office)
Indiana’s infrastructure base and manage day-to-day operations, including construction and detours, traffic signal operations, permits, and maintenance operations, and therefore manage a wide range of assets that make up its infrastructure base. The role of the Districts is therefore to implement asset management activities, under the direction of the Central Office. The process flow chart below delineates asset management activities between the Central Office and District-levels.

INDIANA DOT STRATEGIC ASSET MANAGEMENT PLAN 55INDIANA DOT STRATEGIC ASSET MANAGEMENT PLAN
Opportunities & Risks in Delivering the SAMP
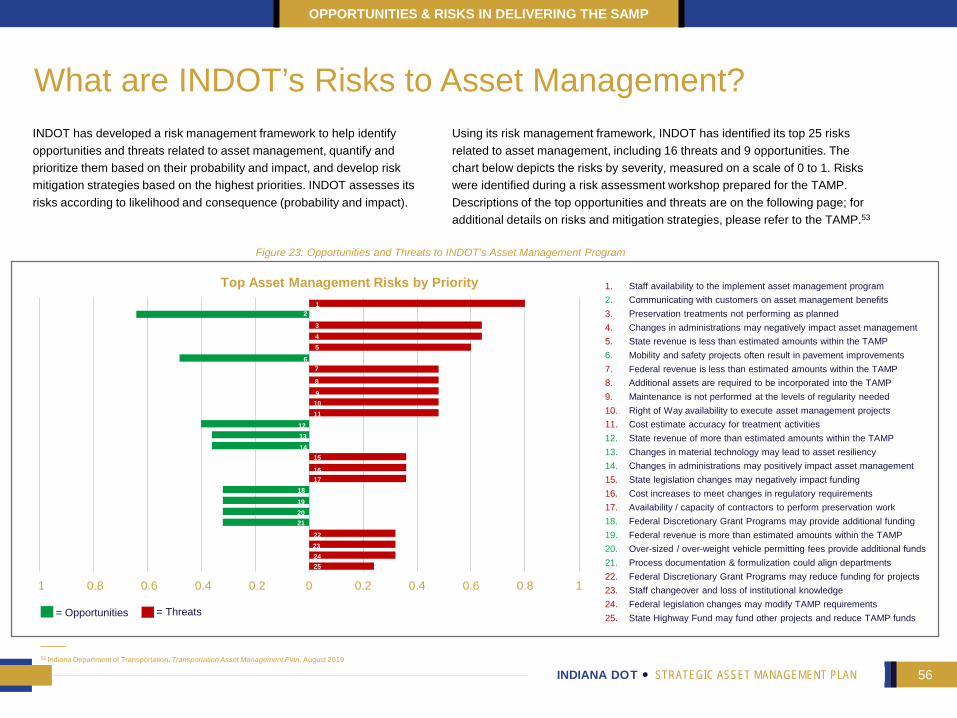
INDIANA DOT STRATEGIC ASSET MANAGEMENT PLAN 56
What are INDOT’s Risks to Asset Management? INDOT has developed a risk management framework to help identify opportunities and threats related to asset management, quantify and prioritize them based on their probability and impact, and develop risk mitigation strategies based on the highest priorities. INDOT assesses its risks according to likelihood and consequence (probability and impact).
OPPORTUNITIES & RISKS IN DELIVERING THE SAMP
53 Indiana Department of Transportation, Transportation Asset Management Plan, August 2019
Using its risk management framework, INDOT has identified its top 25 risks related to asset management, including 16 threats and 9 opportunities. The chart below depicts the risks by severity, measured on a scale of 0 to 1. Risks were identified during a risk assessment workshop prepared for the TAMP. Descriptions of the top opportunities and threats are on the following page; for additional details on risks and mitigation strategies, please refer to the TAMP.53
-1 -0.8 -0.6 -0.4 -0.2 0 0.2 0.4 0.6 0.8 1
Top Asset Management Risks by Priority 1. Staff availability to the implement asset management program2. Communicating with customers on asset management benefits3. Preservation treatments not performing as planned 4. Changes in administrations may negatively impact asset management5. State revenue is less than estimated amounts within the TAMP6. Mobility and safety projects often result in pavement improvements7. Federal revenue is less than estimated amounts within the TAMP8. Additional assets are required to be incorporated into the TAMP9. Maintenance is not performed at the levels of regularity needed10. Right of Way availability to execute asset management projects11. Cost estimate accuracy for treatment activities12. State revenue of more than estimated amounts within the TAMP13. Changes in material technology may lead to asset resiliency 14. Changes in administrations may positively impact asset management 15. State legislation changes may negatively impact funding16. Cost increases to meet changes in regulatory requirements17. Availability / capacity of contractors to perform preservation work 18. Federal Discretionary Grant Programs may provide additional funding 19. Federal revenue is more than estimated amounts within the TAMP20. Over-sized / over-weight vehicle permitting fees provide additional funds21. Process documentation & formulization could align departments22. Federal Discretionary Grant Programs may reduce funding for projects23. Staff changeover and loss of institutional knowledge24. Federal legislation changes may modify TAMP requirements 25. State Highway Fund may fund other projects and reduce TAMP funds
12
345
67
8
91011
121314
15
1617
18192021
22232425
Figure 23: Opportunities and Threats to INDOT’s Asset Management Program
= Opportunities = Threats

INDIANA DOT STRATEGIC ASSET MANAGEMENT PLAN 57INDIANA DOT STRATEGIC ASSET MANAGEMENT PLAN
Plans for Improving the Asset Management System
INDIANA DOT STRATEGIC ASSET MANAGEMENT PLAN 58
What are INDOT’s Future Asset Management Initiatives? Plans to Improve the Asset Management SystemAs INDOT continues efforts to enhance its Asset Management Program, INDOT will continue to improve and build upon its asset management system to support the successful implementation of the program. INDOT has identified several initiatives to augment the asset management system.
# Initiative Description
1 Asset Management Training Program
As INDOT further progresses to develop content for its asset management program, there is a need to further upskill staff with regard to asset management best practices, both within the Transportation industry and beyond. While there are a number a training courses currently available, this typically focuses on more tactical elements and does not provide a broader view ofthe asset management end to end process.
2 Business Process Development
This task is aimed at the creation of missing, high priority processes. These will be developed utilizing small process specificworking groups, who will be available to provide guidance.
3 Communications and Change Management
For this task, the Communications and Change Management Plan will move into implementation. Specific areas of focus include development of content for both the internal INDOT asset management webpage, along with the asset management webpage for the INDOT external internet site.
4Revise Bridge & Pavement Asset Lifecycle Strategies
This initiative includes the development of an owner’s manual that summarizes INDOT’s lifecycle strategies for bridges and pavement and further optimizes the strategies by incorporating data collected.
5Asset Information Strategy & Data Collection Plan
This initiative will develop a strategy that establishes INDOT’s data requirements, including the rationale for collecting data, at what granularity, timescale, return on investment, etc. The output is a prioritized plan for data collection.
6 Asset Risk Model This initiative further develops INDOT’s risk model and utilizes the risk model for select assets, such as Bridges.
7 Data Governance This initiative continues efforts to implement INDOT’s data governance processes, policies, and standards within asset management.
PLANS FOR IMPROVING THE ASSET MANAGEMENT SYSTEM
Table 15: INDOT Asset Management Program Initiatives
These efforts are either planned efforts or efforts in development. This list is not exhaustive, and additional efforts beyond those identified below may be required to fully develop an optimal asset management system.

INDIANA DOT STRATEGIC ASSET MANAGEMENT PLAN 59INDIANA DOT STRATEGIC ASSET MANAGEMENT PLAN
Monitoring Progress of SAMP Implementation
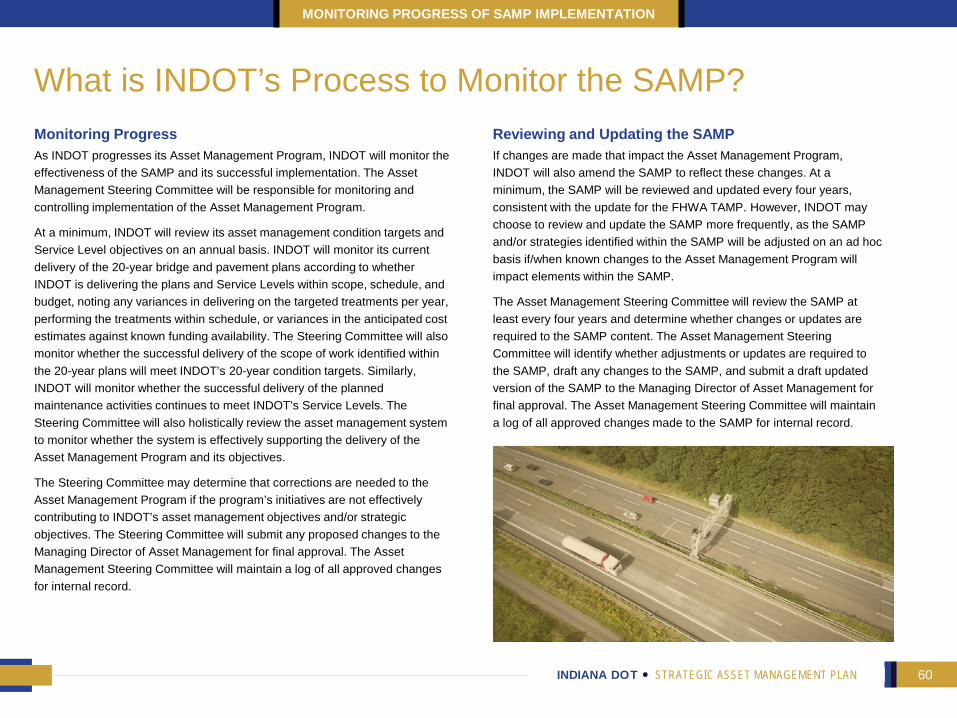
INDIANA DOT STRATEGIC ASSET MANAGEMENT PLAN 60
Monitoring Progress As INDOT progresses its Asset Management Program, INDOT will monitor the effectiveness of the SAMP and its successful implementation. The Asset Management Steering Committee will be responsible for monitoring and controlling implementation of the Asset Management Program.
At a minimum, INDOT will review its asset management condition targets and Service Level objectives on an annual basis. INDOT will monitor its current delivery of the 20-year bridge and pavement plans according to whether INDOT is delivering the plans and Service Levels within scope, schedule, and budget, noting any variances in delivering on the targeted treatments per year, performing the treatments within schedule, or variances in the anticipated cost estimates against known funding availability. The Steering Committee will also monitor whether the successful delivery of the scope of work identified within the 20-year plans will meet INDOT’s 20-year condition targets. Similarly, INDOT will monitor whether the successful delivery of the planned maintenance activities continues to meet INDOT’s Service Levels. The Steering Committee will also holistically review the asset management system to monitor whether the system is effectively supporting the delivery of the Asset Management Program and its objectives.
The Steering Committee may determine that corrections are needed to the Asset Management Program if the program’s initiatives are not effectively contributing to INDOT’s asset management objectives and/or strategic objectives. The Steering Committee will submit any proposed changes to the Managing Director of Asset Management for final approval. The Asset Management Steering Committee will maintain a log of all approved changes for internal record.
Reviewing and Updating the SAMPIf changes are made that impact the Asset Management Program, INDOT will also amend the SAMP to reflect these changes. At a minimum, the SAMP will be reviewed and updated every four years, consistent with the update for the FHWA TAMP. However, INDOT may choose to review and update the SAMP more frequently, as the SAMPand/or strategies identified within the SAMP will be adjusted on an ad hoc basis if/when known changes to the Asset Management Program will impact elements within the SAMP.
The Asset Management Steering Committee will review the SAMP at least every four years and determine whether changes or updates are required to the SAMP content. The Asset Management Steering Committee will identify whether adjustments or updates are required to the SAMP, draft any changes to the SAMP, and submit a draft updated version of the SAMP to the Managing Director of Asset Management for final approval. The Asset Management Steering Committee will maintain a log of all approved changes made to the SAMP for internal record.
What is INDOT’s Process to Monitor the SAMP?
MONITORING PROGRESS OF SAMP IMPLEMENTATION
INDIANA DOT STRATEGIC ASSET MANAGEMENT PLAN 61INDIANA DOT STRATEGIC ASSET MANAGEMENT PLAN
Appendix

INDIANA DOT STRATEGIC ASSET MANAGEMENT PLAN 62
Appendix AFHWA Performance Measurements for PavementINDOT’s key performance indicator (KPI) for pavement condition is based on the International Roughness Index (IRI) of the right wheel path. INDOT also uses FHWA’s performance measurements for pavement. For the FWHA’s measurement, pavement condition is evaluated according to whether the pavement is in fair, good, or poor condition. Condition data is collected in sixevaluation zones, including the right wheel path, left wheel path, two non-wheel path zones, outside pavement edge, and outside shoulder zone. Assessments are based on the following factors:
• International Roughness Index (IRI): Roughness of the pavement
• Rut (RUT): Depressions or grooves in the roadway
• Faulting: Displacement of pavement at the joints or cracks along the roadway
• Cracking: Roadway distress that can lead to potholes
APPENDIX
Performance Measure Good Fair Poor
IRI (inches/mile) <95 95-170 >170
RUT (inches) <0.20 0.20-0.40 >0.40
Faulting (inches) <0.10 0.10-0.15 >0.15
Cracking (percent) <5 5-20 (asphalt), 5-15 (JCP)*, 5-10 (CRCP)** >20 (asphalt), >15 (JCP), >10 (CRCP)
When assessing overall conditions, asphalt and JCP must receive a “good” rating in IRI, cracking, and RUT/faulting to be considered in overall good condition. CRCP must receive a “good” rating in both IRI and cracking to be considered in overall good condition. Conversely, asphalt and JCP must receive a “poor” rating in at least two measures to be considered in overall poor condition, and CRCP must receive a “poor” rating in both measures to be in overall poor condition. For all other combinations, pavement is considered in “fair” overall condition.54
*Joint Concrete Pavement**Continuously Reinforced Concrete Pavement
54 Indiana Department of Transportation, Transportation Asset Management Plan, April 2018

INDIANA DOT STRATEGIC ASSET MANAGEMENT PLAN 63
Appendix BFHWA Performance Measurements for BridgesAccording to the FHWA’s National Performance Management Measures for Assessing Bridge Conditions, a bridge’s overall condition is based on the deck, superstructure, and substructure subsystem components. Condition ratings are captured for the three subsystem components and are ranked on a 0 to 9 scale, with a lower scale indicating a greater level of deterioration.
• If any of the three ratings receive a 4 or below, the bridge is considered in overall poor condition.
• If all three ratings receive a 7 or above, the bridge is considered in overall good condition.
• For any other combination of ratings, the bridge is considered in fair condition.
The scores are then weighted to the deck area, so that a larger bridge receives a greater weighting than a smaller bridge.55
The following is the scale used to determine the condition ratings for the subsystem components:56
APPENDIX
55 Federal Highway Administration. “National Performance Management Measures for Assessing Bridge Conditions.” Code of Federal Regulations, title 23, part 430, subpart D (2017)56 Indiana Department of Transportation, Transportation Asset Management Plan, August 2018
Bridge Condition Ratings
Scal
e Excellent Very Good Good Satisfactory Fair Poor Serious Critical Imminent Failure Failed
9 8 7 6 5 4 3 2 1 0
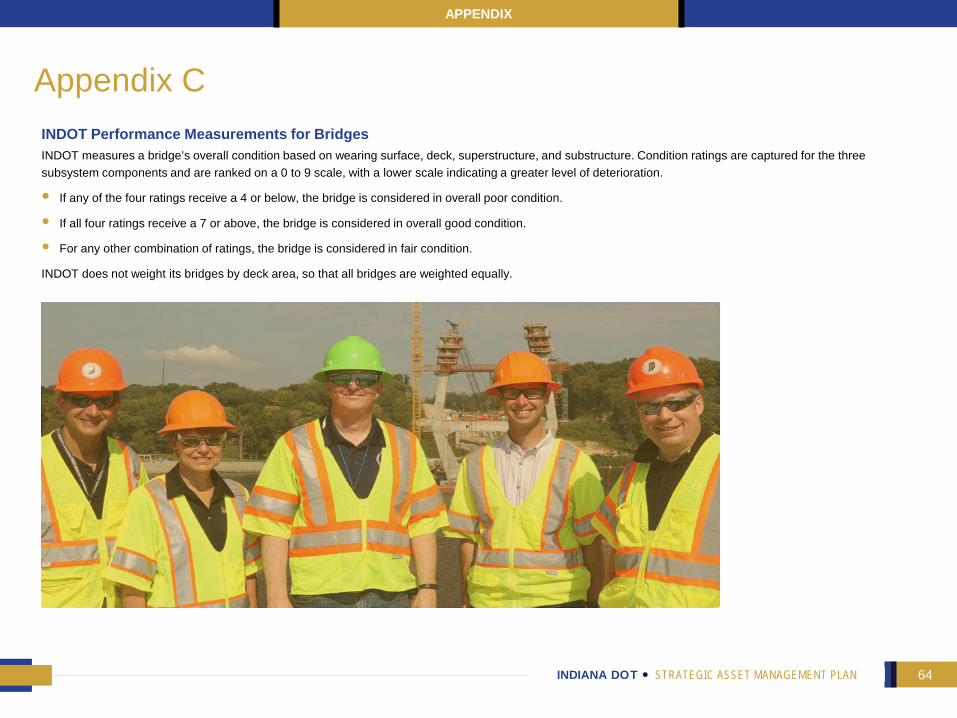
INDIANA DOT STRATEGIC ASSET MANAGEMENT PLAN 64
Appendix C
APPENDIX
INDOT Performance Measurements for BridgesINDOT measures a bridge’s overall condition based on wearing surface, deck, superstructure, and substructure. Condition ratings are captured for the three subsystem components and are ranked on a 0 to 9 scale, with a lower scale indicating a greater level of deterioration.
• If any of the four ratings receive a 4 or below, the bridge is considered in overall poor condition.
• If all four ratings receive a 7 or above, the bridge is considered in overall good condition.
• For any other combination of ratings, the bridge is considered in fair condition.
INDOT does not weight its bridges by deck area, so that all bridges are weighted equally.
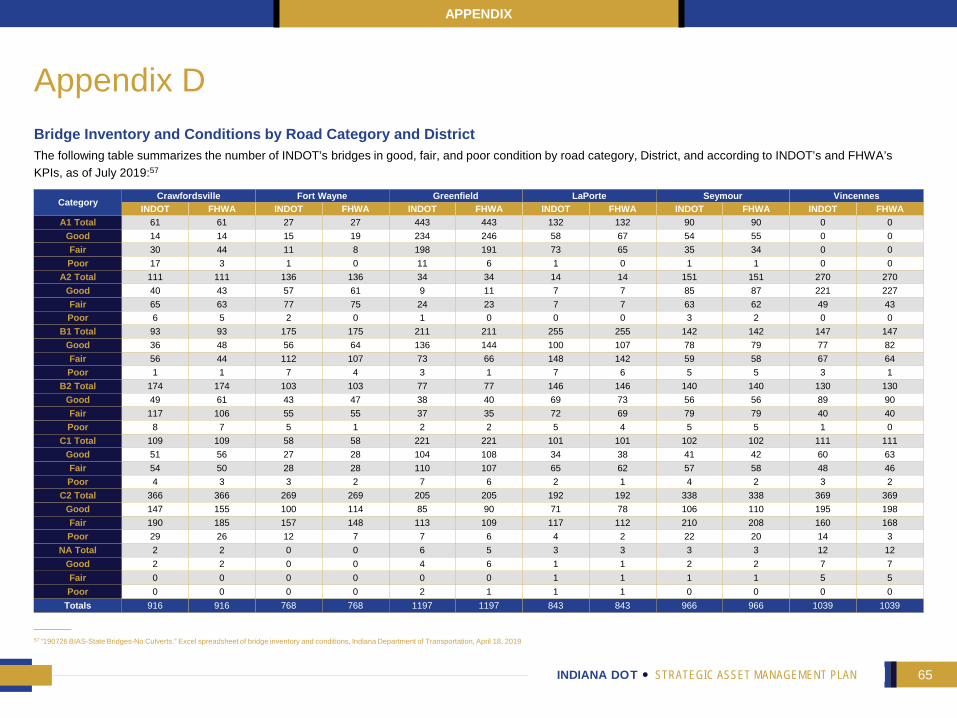
INDIANA DOT STRATEGIC ASSET MANAGEMENT PLAN 65
Appendix DBridge Inventory and Conditions by Road Category and District The following table summarizes the number of INDOT’s bridges in good, fair, and poor condition by road category, District, and according to INDOT’s and FHWA’s KPIs, as of July 2019:57
Category Crawfordsville Fort Wayne Greenfield LaPorte Seymour VincennesINDOT FHWA INDOT FHWA INDOT FHWA INDOT FHWA INDOT FHWA INDOT FHWA
A1 Total 61 61 27 27 443 443 132 132 90 90 0 0Good 14 14 15 19 234 246 58 67 54 55 0 0Fair 30 44 11 8 198 191 73 65 35 34 0 0Poor 17 3 1 0 11 6 1 0 1 1 0 0
A2 Total 111 111 136 136 34 34 14 14 151 151 270 270Good 40 43 57 61 9 11 7 7 85 87 221 227Fair 65 63 77 75 24 23 7 7 63 62 49 43Poor 6 5 2 0 1 0 0 0 3 2 0 0
B1 Total 93 93 175 175 211 211 255 255 142 142 147 147Good 36 48 56 64 136 144 100 107 78 79 77 82Fair 56 44 112 107 73 66 148 142 59 58 67 64Poor 1 1 7 4 3 1 7 6 5 5 3 1
B2 Total 174 174 103 103 77 77 146 146 140 140 130 130Good 49 61 43 47 38 40 69 73 56 56 89 90Fair 117 106 55 55 37 35 72 69 79 79 40 40Poor 8 7 5 1 2 2 5 4 5 5 1 0
C1 Total 109 109 58 58 221 221 101 101 102 102 111 111Good 51 56 27 28 104 108 34 38 41 42 60 63Fair 54 50 28 28 110 107 65 62 57 58 48 46Poor 4 3 3 2 7 6 2 1 4 2 3 2
C2 Total 366 366 269 269 205 205 192 192 338 338 369 369Good 147 155 100 114 85 90 71 78 106 110 195 198Fair 190 185 157 148 113 109 117 112 210 208 160 168Poor 29 26 12 7 7 6 4 2 22 20 14 3
NA Total 2 2 0 0 6 5 3 3 3 3 12 12Good 2 2 0 0 4 6 1 1 2 2 7 7Fair 0 0 0 0 0 0 1 1 1 1 5 5Poor 0 0 0 0 2 1 1 1 0 0 0 0
Totals 916 916 768 768 1197 1197 843 843 966 966 1039 1039
APPENDIX
57 “190726 BIAS-State Bridges-No Culverts.” Excel spreadsheet of bridge inventory and conditions, Indiana Department of Transportation, April 18, 2019
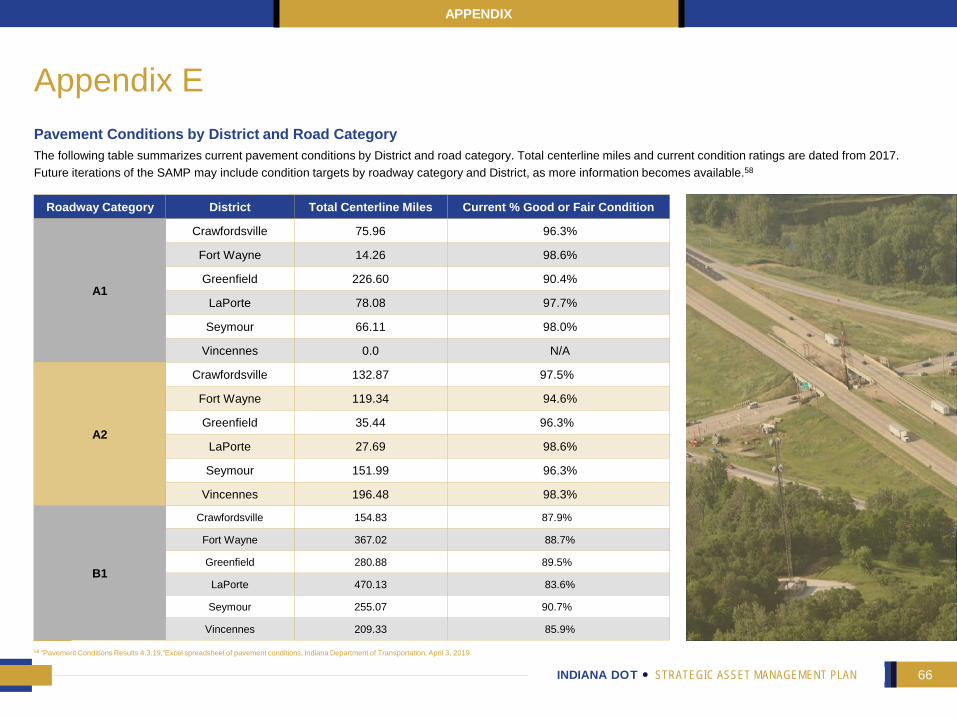
INDIANA DOT STRATEGIC ASSET MANAGEMENT PLAN 66
Appendix EPavement Conditions by District and Road CategoryThe following table summarizes current pavement conditions by District and road category. Total centerline miles and current condition ratings are dated from 2017. Future iterations of the SAMP may include condition targets by roadway category and District, as more information becomes available.58
Roadway Category District Total Centerline Miles Current % Good or Fair Condition
A1
Crawfordsville 75.96 96.3%
Fort Wayne 14.26 98.6%
Greenfield 226.60 90.4%
LaPorte 78.08 97.7%
Seymour 66.11 98.0%
Vincennes 0.0 N/A
A2
Crawfordsville 132.87 97.5%
Fort Wayne 119.34 94.6%
Greenfield 35.44 96.3%
LaPorte 27.69 98.6%
Seymour 151.99 96.3%
Vincennes 196.48 98.3%
B1
Crawfordsville 154.83 87.9%
Fort Wayne 367.02 88.7%
Greenfield 280.88 89.5%
LaPorte 470.13 83.6%
Seymour 255.07 90.7%
Vincennes 209.33 85.9%
APPENDIX
58 “Pavement Conditions Results 4.3.19,”Excel spreadsheet of pavement conditions, Indiana Department of Transportation, April 3, 2019

INDIANA DOT STRATEGIC ASSET MANAGEMENT PLAN 67
Appendix E (continued)
Roadway Category District Total Centerline Miles Current % Good or Fair Condition
B2
Crawfordsville 320.81 90.6%
Fort Wayne 249.01 94.2%
Greenfield 215.96 94.4%
LaPorte 355.10 94.6%
Seymour 360.55 97.5%
Vincennes 317.53 94.9%
C1
Crawfordsville 177.55 92.5%
Fort Wayne 149.51 92.4%
Greenfield 306.27 90.3%
LaPorte 203.22 86.7%
Seymour 195.41 94.0%
Vincennes 282.17 90.0%
C2
Crawfordsville 940.27 89.7%
Fort Wayne 995.80 88.4%
Greenfield 530.21 89.0%
LaPorte 679.86 88.7%
Seymour 909.30 87.2%
Vincennes 956.41 89.9%
APPENDIX
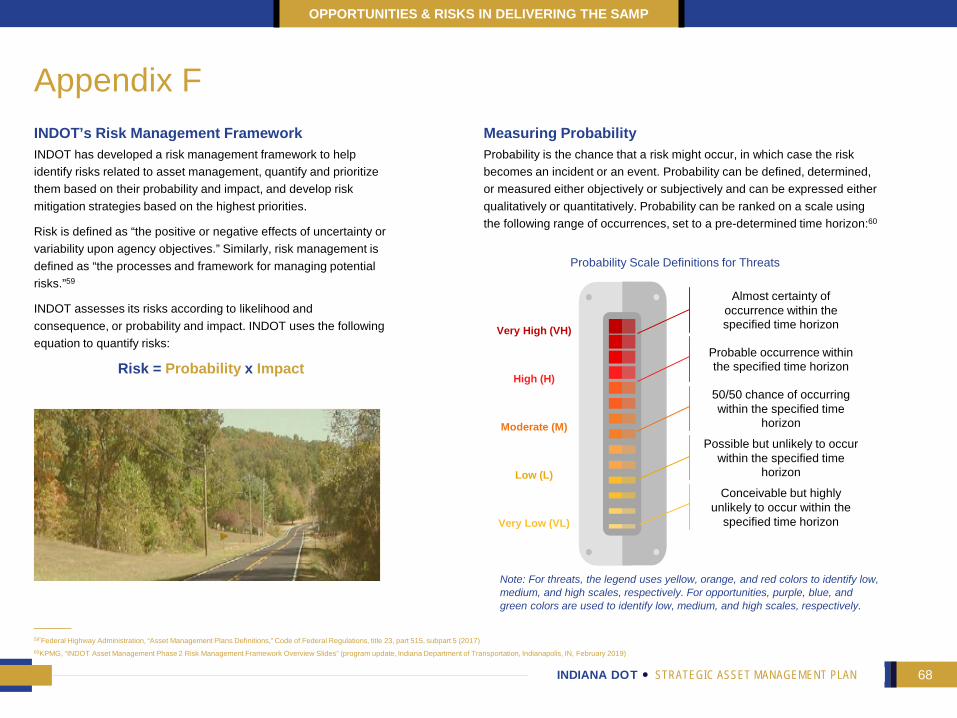
INDIANA DOT STRATEGIC ASSET MANAGEMENT PLAN 68
Appendix FINDOT’s Risk Management FrameworkINDOT has developed a risk management framework to help identify risks related to asset management, quantify and prioritize them based on their probability and impact, and develop risk mitigation strategies based on the highest priorities.
Risk is defined as “the positive or negative effects of uncertainty or variability upon agency objectives.” Similarly, risk management is defined as “the processes and framework for managing potential risks.”59
INDOT assesses its risks according to likelihood and consequence, or probability and impact. INDOT uses the following equation to quantify risks:
Risk = Probability x Impact
OPPORTUNITIES & RISKS IN DELIVERING THE SAMP
Note: For threats, the legend uses yellow, orange, and red colors to identify low, medium, and high scales, respectively. For opportunities, purple, blue, and green colors are used to identify low, medium, and high scales, respectively.
Probability Scale Definitions for Threats
Almost certainty of occurrence within the specified time horizon
Probable occurrence within the specified time horizon
50/50 chance of occurring within the specified time
horizon
Possible but unlikely to occur within the specified time
horizon
Conceivable but highly unlikely to occur within the
specified time horizonVery Low (VL)
Low (L)
Moderate (M)
High (H)
Very High (VH)
59”Federal Highway Administration, “Asset Management Plans Definitions,” Code of Federal Regulations, title 23, part 515, subpart 5 (2017)60KPMG, “INDOT Asset Management Phase 2 Risk Management Framework Overview Slides” (program update, Indiana Department of Transportation, Indianapolis, IN, February 2019)
Measuring ProbabilityProbability is the chance that a risk might occur, in which case the risk becomes an incident or an event. Probability can be defined, determined, or measured either objectively or subjectively and can be expressed either qualitatively or quantitatively. Probability can be ranked on a scale using the following range of occurrences, set to a pre-determined time horizon:60

INDIANA DOT STRATEGIC ASSET MANAGEMENT PLAN 69
Measuring Impact Impact is the outcome of an event that impacts INDOT’s objectives. Impact is also measured on a Very Low to Very High scale.
Risks that are identified may fall into specific categories based on the type of risk posed to the organization and how it impacts the organization. INDOT categorizes its risks by the following:
Appendix F (continued)
Probability and Impact Scores for Opportunities and Threats
OPPORTUNITIES & RISKS IN DELIVERING THE SAMP
61 “INDOT TAMP Risk Register,” PDF file, Indiana Department of Transportation, February 20, 2019
Threats
Prob
abili
ty
VH 0.2 0.4 0.6 0.8 1
H 0.16 0.32 0.48 0.64 0.8
M 0.12 0.24 0.36 0.48 0.6
L 0.08 0.16 0.24 0.32 0.4
VL 0.04 0.08 0.12 0.16 0.2
VL L M H VH
Impact
Opportunities
Prob
abili
ty
VH 0.2 0.4 0.6 0.8 1
H 0.16 0.32 0.48 0.64 0.8
M 0.12 0.24 0.36 0.48 0.6
L 0.08 0.16 0.24 0.32 0.4
VL 0.04 0.08 0.12 0.16 0.2
VL L M H VH
Impact
LegendThreat Opportunities
High HighMedium Medium
Low Low
Quantifying Opportunities and Threats For each identified risk, scores are assigned to both the risk’s probability and impact, and the total risk score is the product of the likelihood score and the consequence score. The total scores of the risks can be used to rank and prioritize risks to determine the greatest risks to INDOT’s ability to manage its bridges and roads.61
+ +
+ +
Institutional Management, and Agency Leadership
Program and Project Delivery
Physical Assets
Maintenance
+ +
+ +
Public Perception/External
Impacts52
Changing Rules/Guidelines
+ +
+ +
Revenue, Funding, and Market Conditions

INDIANA DOT STRATEGIC ASSET MANAGEMENT PLAN 70INDIANA DOT STRATEGIC ASSET MANAGEMENT PLAN
References
INDIANA DOT STRATEGIC ASSET MANAGEMENT PLAN 71
References• “19076 BIAS-State Bridges-No Culverts.” Excel spreadsheet of bridge inventory and conditions. Indiana Department of Transportation. July 26, 2019.
• “20 Year Bridge Statewide Combined 1-18-19.” Excel spreadsheet of treatment projections. Indiana Department of Transportation. January 18, 2019.
• “20 Year Pavement Combined.” Excel Spreadsheet of treatment projections. Indiana Department of Transportation. February 21, 2019.
• “AADT Results 8.12.19 (Updated Sep. 3).” Excel spreadsheet of pavement inventory, Indiana Department of Transportation. September 3, 2019.
• “Asset Management Project Prioritization Process & Schedule.” Visio graphic. Indiana Department of Transportation. Revised October 29, 2018.
• “Asset Targets 6.24.20 vs. 9.20.19.” Excel spreadsheet of legislative funding targets for bridges and pavement. Indiana Department of Transportation. August 12, 2020.
• “Construction & Materials Management Org Chart.” PDF file. Indiana Department of Transportation. April 2019.
• “dTIMS Bridge Treatments.” Excel spreadsheet. Indiana Department of Transportation. Data from April 2018.
• “dTIMS Pavement Rules.” Excel spreadsheet. Indiana Department of Transportation. October 2018 version.
• “Engineering and Asset Management Realignment” organization charts. PDF file. Indiana Department of Transportation. Revised February 2019.
• Federal Highway Administration. Asset Sustainability Index Quick Guide – Proposed Metrics for the Long-Term Financial Sustainability of Highway Networks, April 2013.
• Federal Highway Administration. “Minimum Standards for Developing and Operating Bridge and Pavement Management Systems.” Code of Federal Regulations, title 23, part 515, subpart 17 (2017).
• Federal Highway Administration. “Asset Management Plans Definitions.” Code of Federal Regulations, title 23, part 515, subpart 5 (2017).
• Federal Highway Administration. “National Performance Management Measures for Assessing Bridge Conditions.” Code of Federal Regulations, title 23, part 430, subpart D (2017).
• Indiana Constructors, Inc. “LF ICI PowerPoint.” Next Level Roads program update to Indiana Department of Transportation, Indianapolis, IN, 2019.
REFERENCES
INDIANA DOT STRATEGIC ASSET MANAGEMENT PLAN 72
References (continued)
• Indiana Constructors, Inc. “Sources of INDOT’s Revenue.” Program update to Indiana Department of Transportation, Indianapolis, IN, August 23, 2018.
• Indiana Department of Transportation. “Asset Lifecycle Strategies, Bridges.” Version 16. August 2020.
• Indiana Department of Transportation. “Asset Lifecycle Strategies, Pavement.” Version 28. August 2020.
• Indiana Department of Transportation. Asset Management Policy. August 2018.
• Indiana Department of Transportation. “Asset Management Program Phase II Communications and Stakeholder Engagement Plan,” version 4. November 5, 2018.
• Indiana Department of Transportation. “Chapter 412 Bridge Preservation.” In Indiana 2013 Design Manual, February 2019.
• Indiana Department of Transportation. Indiana Department of Transportation 2019 Strategic Plan, version 6. Dated 2019.
• Indiana Department of Transportation. “INDOT Roadway Asset Team Operation Policy.” October 2017.
• Indiana Department of Transportation. “Roadway Asset Scoring Rules.” August 2019.
• Indiana Department of Transportation. “Scoring Guidelines and Business Rules for Bridge and Large Culvert Asset Program.” August 23, 2018.
• Indiana Department of Transportation. “Scoring Guidelines for INDOT Traffic Mobility Program.” September 2, 2014.
• Indiana Department of Transportation. Statewide Transportation Improvement Plan 2018-2021.
• Indiana Department of Transportation. Statewide Transportation Improvement Plan Financial Summary 2020-2024.
• Indiana Department of Transportation. Transportation Asset Management Plan. August 2019.
• Indiana Department of Transportation. Transportation Asset Management Plan. June 2019.
• Indiana Department of Transportation. “Traffic Safety Asset Team Business Rules.” October 2015.
• Indiana General Assembly, “State Offices and Administration,” Indiana Code, title 4, part 20.5-6-3.
• “Indiana Quick Facts” United States Census Bureau website. 2019. http://www.census.gov.quickfacts/indiana/
REFERENCES

INDIANA DOT STRATEGIC ASSET MANAGEMENT PLAN 73
References (continued)
• “INDOT Facts.” Indiana Department of Transportation website. 2019. https://www.in.gov/indot/2337.htm.
• “INDOT TAMP Risk Register.” PDF file. Indiana Department of Transportation. February 20, 2019.
• Indiana State Board of Accounts. “Chapter 8 Capital Asset Accounting.” In Accounting and Uniform Compliance Guidelines Manual for State and Quasi Agencies.
• KPMG. “Asset Management Current Situation Analysis and Roadmap Report Indiana Department of Transportation,” version 10. October 3, 2018.
• KPMG. “Indiana Department of Transportation Asset Management Program – Phase II Roles & Responsibilities Initiative Memorandum.” November 15, 2018.
• KPMG. “INDOT Asset Management Phase 2 Steering Committee.” Monthly program update to the Indiana Department of Transportation Asset Management Steering Committee, Indianapolis, IN, October 2019.
• KPMG. “INDOT Asset Management Phase 2 March 2019 Steering Committee.” Monthly program update to the Indiana Department of Transportation Asset Management Steering Committee, Indianapolis, IN, March 2019.
• KPMG. “INDOT Asset Management Phase 2 Risk Management Framework Overview Slides.” Program update to the Indiana Department ofTransportation Asset Management Steering Committee, Indianapolis, IN, February 2019.
• KPMG. “INDOT Asset Management Program Business Rules Summary.” Presentation to the Indiana Department of Transportation, Indianapolis, IN, February 7, 2019.
• “Maintenance Owner’s Manual 5-26-20.” Excel spreadsheet of maintenance activities. Indiana Department of Transportation, May 2020.
• “Org Chart.” PDF file. Indiana Department of Transportation. September 2020.
• “Pavement 3.21.19.”Excel spreadsheet of pavement inventory. Indiana Department of Transportation. March 21, 2019.
• “Pavement Conditions Results 4.3.19.” Excel spreadsheet of pavement conditions. Indiana Department of Transportation, April 2019.
REFERENCES

INDIANA DOT STRATEGIC ASSET MANAGEMENT PLAN 74
IndianaDepartment of Transportation