Embed Size (px)
Citation preview
2012-13 School Accountability Report Card — Published During the 2013-14 School Year
Indian Valley Elementary SchoolWalnut Creek SD
Susan Drews, Principal E-mail: [email protected]
551 Marshall Drive Walnut Creek, CA 94598 Phone: (925) 944-6828
CDS Code: 07-61812-6005177 Grades: TK-5
www.walnutcreeksd.org/iv
Principal’s MessageAt Indian Valley (IV) School, we believe school should be a place where children are valued. They are our future. Every person is respected, supported, and safe. Children experience success and feel good about learning. The diversity of our community is valued – staff members work in partnership with parents and the community to reach our educational goals. Indian Valley’s Site Plan aligns the school’s efforts to maintain the focus on addressing the academic, social, and emotional development of all children. The two major focus areas of the Plan are: 1) We will meet the needs of all students by implementing a Standards-based curriculum at all grade levels to develop enthusiastic lifelong learners. 2) We will create a community of parents, teachers, and students to provide a positive school climate for all children and adults and foster students’ successful development academi-cally, socially, and emotionally. During the 2011-12 school year, we introduced the social curriculum program, Second Step. During the 2012-13 school year, we fully implemented this program to teach students empathy, anger management, and self-control. This year, we celebrated our first Grandpar-ent’s Day, and we had almost 200 grandparents join us. We look forward to many of them becoming regular volunteers.
Indian Valley School is located in Walnut Creek, bordering the open space with its trails which lead to the top of Mt. Diablo. This California Distinguished School is the focal point of the community, enrolling 478 students in grades K-5. Our school is unique because despite our increase in size, students and adults are known and valued.
Our school staff consists of a principal, 21 credentialed teachers, a half-time literacy coach, one SDC teacher, a school secretary, a part-time clerk, one part-time and one full-time custodian, a resource specialist, a speech therapist, one part-time English-Language Development (ELD) specialist, one re-source specialist paraprofessional, three special day class paraprofessionals, one part-time school psychologist, one part-time counselor, a cafeteria manager and assistant, noon supervisors, and one part-time occupational therapist. We also employ specialists in science, art, music, PE, and in media/the library. In addition to District support personnel, IV has a District music teacher that coordinates the band program for grades 4-5. The District also has a school nurse.
Parental InvolvementIndian Valley School has an active Parent-Teacher Organization, with membership including both par-ents and staff who play a major role in site-based decision making. The Parent-Teacher Organization has raised over $100,000 from various fundraising activities, including the Innisbrook gift wrap fund-raiser, e-Scrip sales, and the annual auction. These funds help support the library/media center, the science program, the visual and performing arts program, the computer program, the PE program, the counseling position, the enrichment assemblies, the LifeSkills Program, supplementary classroom ma-terials/equipment/books, publication of the school newsletter Smoke Signals, playground equipment, and furniture.
The Parent-Teacher Organization organizes family oriented activities such as the yearly auction, the Book Faire, Numberama, Spell-a-bration, Family Involvement Nights, International Night, Visiting Author and Artist Days, Book Exchanges, Welcome Back Days, and the Fall Carnival. Parents generously vol-unteer their time while striving endlessly to support the school’s educational environment.
In addition to our parent community, Indian Valley School has partnerships with other community busi-nesses and government agencies. Our school has a collaborative and ongoing alliance with the city of Walnut Creek. The city of Walnut Creek also provides the DARE program. Community agencies are involved in a wide range of activities, including tutoring by the Diablo Valley Assistance League, and donating books by the Rotarians, City Council, and Accenture – IV’s Junior Achievement sponsor. Over 200 businesses donate to our school fundraisers.
Parents may also participate on our Indian Valley Academic Advisory Council (IVAAC), which meets monthly. Parents and staff members oversee the site plan and guarantee that school improvement funds are aligned with the plan. We address all components of our plan and target ways to increase and sustain academic gains for all students.
For more information on how to become involved at the school, contact PTO President Marci Winer at (925) 944-6828 or [email protected].
Walnut Creek School District
Patricia Wool, Ed.D., Superintendent E-mail: [email protected]
960 Ygnacio Valley Road Walnut Creek, CA 94597 Phone: (925) 944-6850
www.walnutcreeksd.org
Mission Statement
In a student-centered, academically challenging
environment, which cultivates character, celebrates learning,
and fosters collaboration, the staff, families and greater community of the WCSD, as
partners, will develop creative, lifelong learners with the skills
and enthusiasm to shape a changing world.
“A community of learners building knowledge, skills and character.”
Indian Valley Mission StatementThrough the efforts of staff and with the support of parents, we dedicate ourselves to providing a stimu-lating environment that promotes intellectual, academic, social, and personal growth for all children.
2Indian Valley Elementary School • 2012-13 SARC
2012-13 School YearDemographics
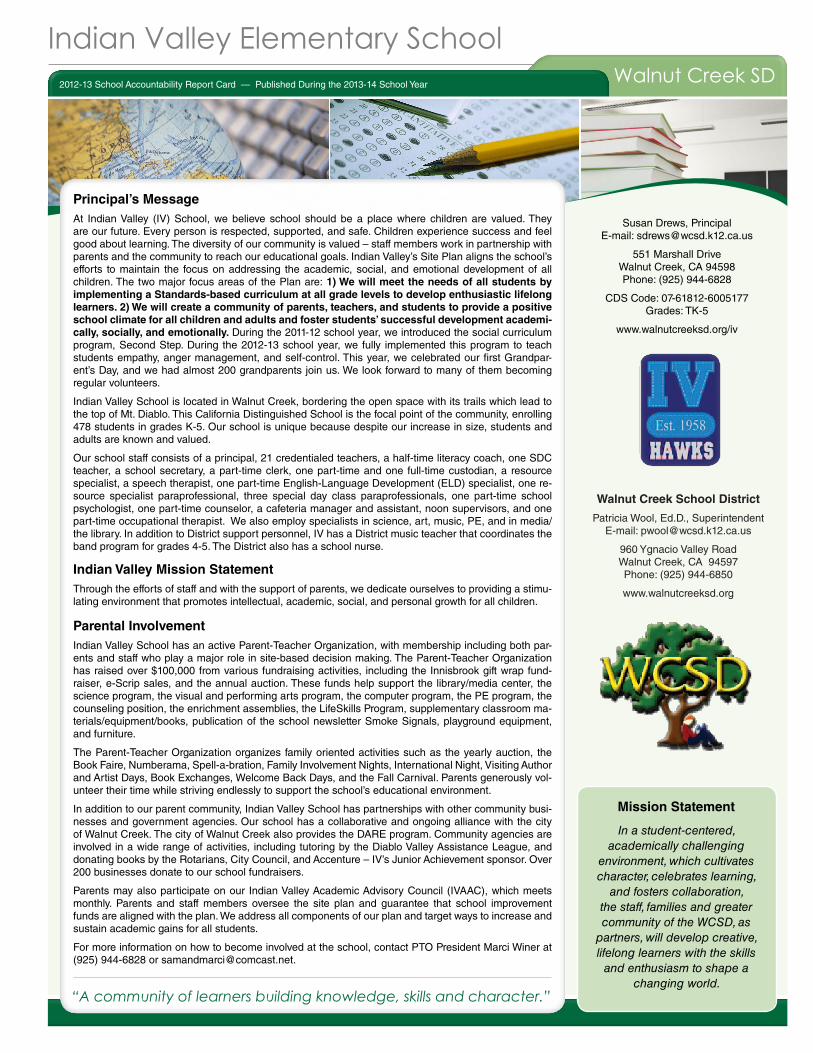
Enrollment by Student GroupThe total enrollment at the school was 477 students for the 2012-13 school year. The pie chart displays the percentage of students enrolled in each group.
2012-13 Enrollment by Grade
Enrollment by Grade LevelThe bar graph displays the total number of students enrolled in each grade for the 2012-13 school year.
Socioeconomically Disadvantaged 8.40%English Learners 9.90%
Students with Disabilities 6.90%
Three-Year Data ComparisonAverage Class Size
10-11 11-12 12-13
Class Size DistributionThe bar graph displays the three-year data for average class size and the table displays the three-year data for the number of classrooms by size.
Three-Year Data ComparisonNumber of Classrooms by Size
10-11 11-12 12-13
Grade 1-20 21-32 33+ 1-20 21-32 33+ 1-20 21-32 33+
K 2 2 3 3
1 4 4 4
2 3 4 2 2
3 1 3 1 3 3
4 2 1 3 2 3
5 1 3 1 2 1 3
Suspension and Expulsion Rates
Indian Valley ES
10-11 11-12 12-13
Suspension Rates 1.2% 2.7% 1.4%
Expulsion Rates 0.0% 0.0% 0.0%
Walnut Creek SD
10-11 11-12 12-13
Suspension Rates 4.6% 4.0% 3.4%
Expulsion Rates 0.0% 0.0% 0.0%
Suspensions and ExpulsionsThis table shows the school and district suspension and expulsion rates for the most recent three-year period. Please note, a new method for calculating sus-pension and expulsion rates was imple-mented starting in the 2011-12 school year – the rates in 2011-12 and beyond cannot be truly compared to previous rates since they are calculated differently.
Hispanic or Latino15.3%
American Indian or Alaska Native
0.2%
Asian14.9%
Native Hawaiian or Pacific Islander
0.4%Filipino3.1%
Black or African American
3.1%
White56.2%
Two or More Races6.3%
No Response 0.4%
K 1 2 3 4 5
2325 25
22
27
17
25
20
25
19
23 2122 21 21
26
18 19
K
1
2
3
4
5
67
84
82
79
89
76
3Indian Valley Elementary School • 2012-13 SARC
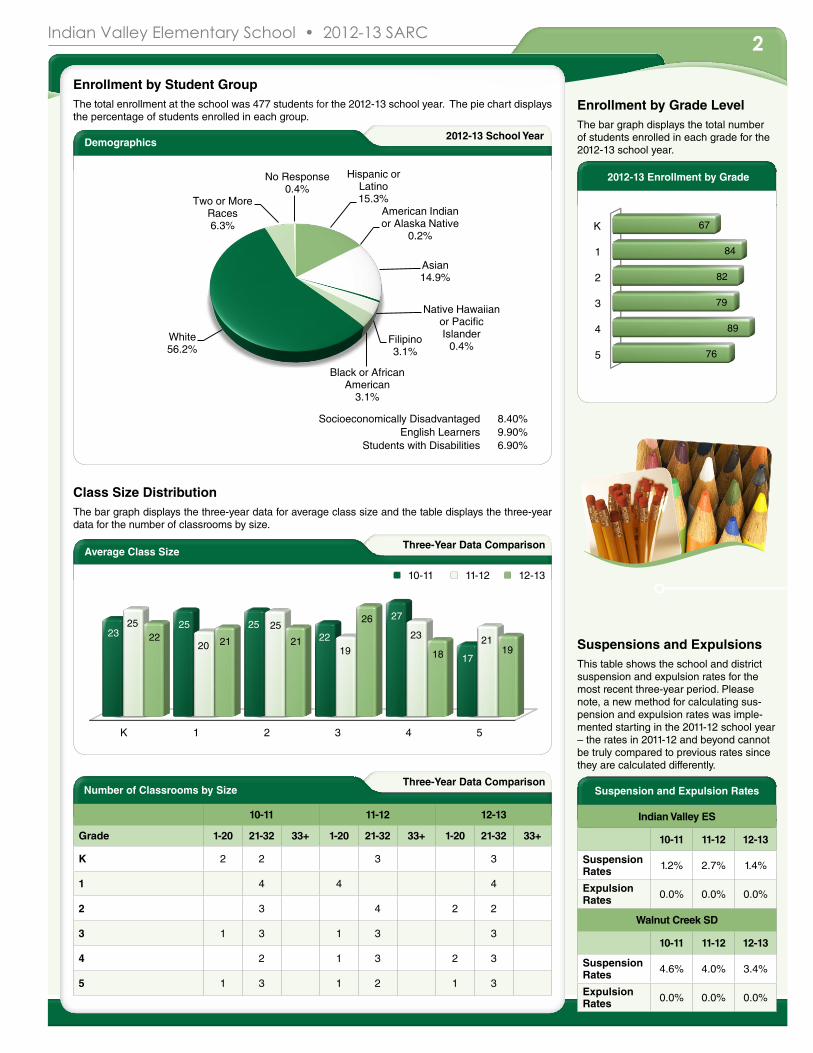
Spring 2013 ResultsStudents Scoring at Proficient or Advanced Levels
Group English- Language Arts Mathematics Science
All Students in the District 79% 80% 83%
All Students at the School 81% 82% 91%
Male 78% 84% 92%
Female 85% 81% 89%
Black or African American 73% 55% v
American Indian or Alaska Native v v v
Asian 86% 95% v
Filipino v v v
Hispanic or Latino 61% 61% 77%
Native Hawaiian or Pacific Islander v v v
White 87% 87% 93%
Two or More Races 72% 83% v
Socioeconomically Disadvantaged 59% 66% v
English Learners 48% 68% v
Students with Disabilities 59% 49% v
Students Receiving Migrant Education Services v v v
v Scores are not shown when the number of students tested is 10 or less, either because the number of students tested in this category is too small for statistical accuracy or to protect student privacy.
Three-Year Data ComparisonStudents Scoring at Proficient or Advanced Levels
Indian Valley ES Walnut Creek SD California
Subject 10-11 11-12 12-13 10-11 11-12 12-13 10-11 11-12 12-13
English-Language Arts 84% 85% 81% 80% 82% 79% 54% 56% 55%
Mathematics 85% 87% 82% 79% 81% 80% 49% 50% 50%
Science 97% 88% 92% 84% 86% 83% 57% 60% 59%
STAR Results for All StudentsThe Standardized Testing and Reporting Program (STAR) results are evaluated and compared to state content standards using the following five performance levels: Advanced (exceeds state standards), Proficient (meets state standards), Basic, Below Basic, and Far Below Basic. Students scoring at the Proficient or Advanced level meet state standards in that content area. The tables show the percentage of students who scored at Proficient or Advanced levels in English-language arts, mathematics, and science.
STAR Results by Student Group: English-Language Arts, Mathematics, and Science
Standardized Testing and Reporting ProgramThe Standardized Testing and Reporting Program (STAR) aims to identify strengths and weaknesses to improve student learn-ing. The STAR consists of several key tests that are designed for the student’s age and individual needs. These tests in-clude the California Standards Test (CST), California Modified Assessment (CMA), and California Alternate Performance As-sessment (CAPA).
The CSTs are multiple choice tests in English-language arts, mathematics, science, and history-social science for varying grade levels. Some grade levels also participate in an essay writing test. The CSTs are used to determine students’ achievement of the California Academic Content Standards. These standards describe the knowledge and skills that students are expected to learn at each grade level and subject.
The CMA is a modified assessment for students with disabilities who have an Individualized Education Plan. It is designed to assess those students whose disabilities prevent them from achieving grade-level proficiency on an assessment of the content standards with or without accommodations.
The CAPA is an alternate assessment for students with significant cognitive disabili-ties who are unable to take the CST with accommodations or modifications or the CMA with accommodations.
For more information on the STAR includ-ing tests, participation, groups, and scores by grade level, please visit star.cde.ca.gov.
4Indian Valley Elementary School • 2012-13 SARC
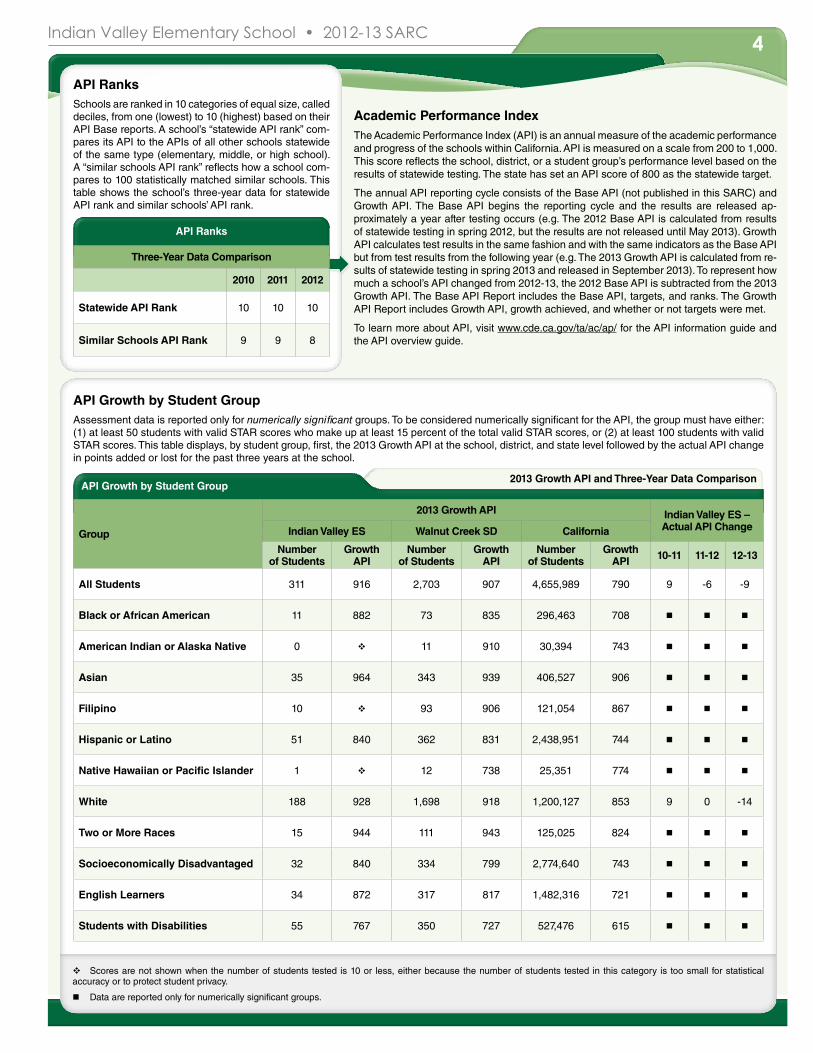
Academic Performance IndexThe Academic Performance Index (API) is an annual measure of the academic performance and progress of the schools within California. API is measured on a scale from 200 to 1,000. This score reflects the school, district, or a student group’s performance level based on the results of statewide testing. The state has set an API score of 800 as the statewide target.
The annual API reporting cycle consists of the Base API (not published in this SARC) and Growth API. The Base API begins the reporting cycle and the results are released ap-proximately a year after testing occurs (e.g. The 2012 Base API is calculated from results of statewide testing in spring 2012, but the results are not released until May 2013). Growth API calculates test results in the same fashion and with the same indicators as the Base API but from test results from the following year (e.g. The 2013 Growth API is calculated from re-sults of statewide testing in spring 2013 and released in September 2013). To represent how much a school’s API changed from 2012-13, the 2012 Base API is subtracted from the 2013 Growth API. The Base API Report includes the Base API, targets, and ranks. The Growth API Report includes Growth API, growth achieved, and whether or not targets were met.
To learn more about API, visit www.cde.ca.gov/ta/ac/ap/ for the API information guide and the API overview guide.
API Ranks
Three-Year Data Comparison
2010 2011 2012
Statewide API Rank 10 10 10
Similar Schools API Rank 9 9 8
nData are reported only for numerically significant groups.
v Scores are not shown when the number of students tested is 10 or less, either because the number of students tested in this category is too small for statistical accuracy or to protect student privacy.
2013 Growth API and Three-Year Data ComparisonAPI Growth by Student Group
Group
2013 Growth API Indian Valley ES – Actual API ChangeIndian Valley ES Walnut Creek SD California
Number of Students
Growth API
Number of Students
Growth API
Number of Students
Growth API 10-11 11-12 12-13
All Students 311 916 2,703 907 4,655,989 790 9 -6 -9
Black or African American 11 882 73 835 296,463 708 n n n
American Indian or Alaska Native 0 v 11 910 30,394 743 n n n
Asian 35 964 343 939 406,527 906 n n n
Filipino 10 v 93 906 121,054 867 n n n
Hispanic or Latino 51 840 362 831 2,438,951 744 n n n
Native Hawaiian or Pacific Islander 1 v 12 738 25,351 774 n n n
White 188 928 1,698 918 1,200,127 853 9 0 -14
Two or More Races 15 944 111 943 125,025 824 n n n
Socioeconomically Disadvantaged 32 840 334 799 2,774,640 743 n n n
English Learners 34 872 317 817 1,482,316 721 n n n
Students with Disabilities 55 767 350 727 527,476 615 n n n
API Growth by Student GroupAssessment data is reported only for numerically significant groups. To be considered numerically significant for the API, the group must have either: (1) at least 50 students with valid STAR scores who make up at least 15 percent of the total valid STAR scores, or (2) at least 100 students with valid STAR scores. This table displays, by student group, first, the 2013 Growth API at the school, district, and state level followed by the actual API change in points added or lost for the past three years at the school.
API RanksSchools are ranked in 10 categories of equal size, called deciles, from one (lowest) to 10 (highest) based on their API Base reports. A school’s “statewide API rank” com-pares its API to the APIs of all other schools statewide of the same type (elementary, middle, or high school). A “similar schools API rank” reflects how a school com-pares to 100 statistically matched similar schools. This table shows the school’s three-year data for statewide API rank and similar schools’ API rank.
5Indian Valley Elementary School • 2012-13 SARC
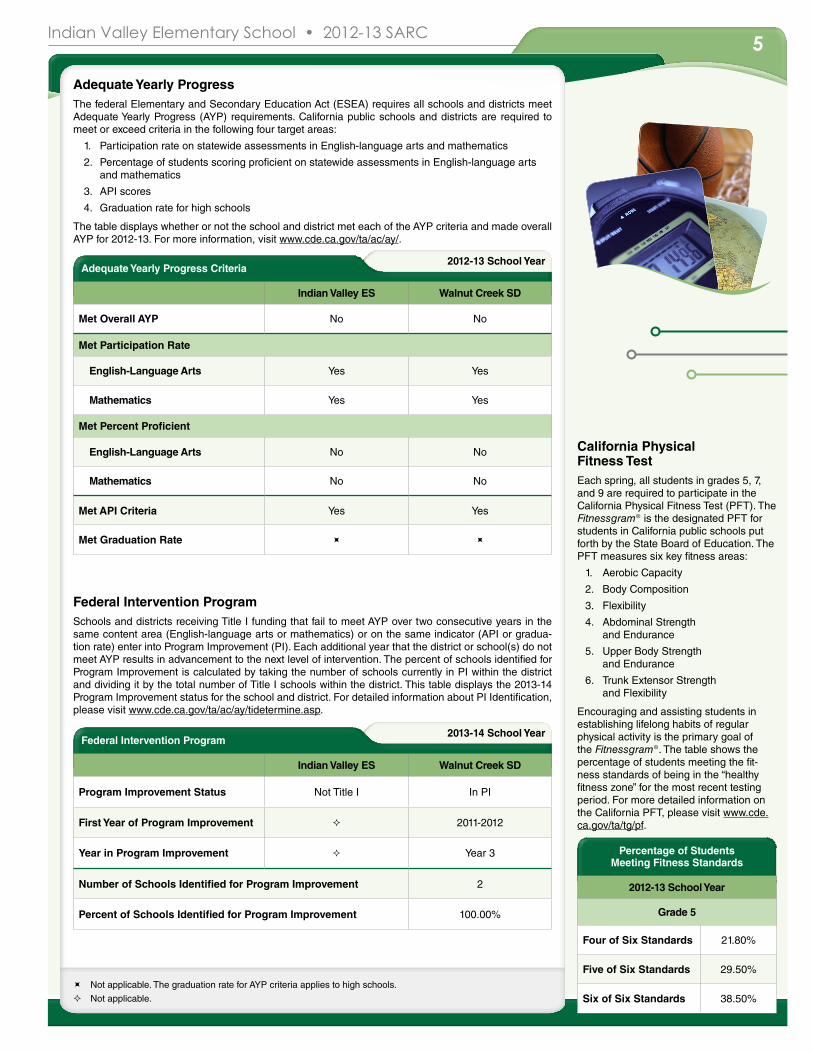
2013-14 School Year
2012-13 School YearAdequate Yearly Progress Criteria
Indian Valley ES Walnut Creek SD
Met Overall AYP No No
Met Participation Rate
English-Language Arts Yes Yes
Mathematics Yes Yes
Met Percent Proficient
English-Language Arts No No
Mathematics No No
Met API Criteria Yes Yes
Met Graduation Rate ÷ ÷
Federal Intervention Program
Indian Valley ES Walnut Creek SD
Program Improvement Status Not Title I In PI
First Year of Program Improvement ² 2011-2012
Year in Program Improvement ² Year 3
Number of Schools Identified for Program Improvement 2
Percent of Schools Identified for Program Improvement 100.00%
² Not applicable.
Adequate Yearly ProgressThe federal Elementary and Secondary Education Act (ESEA) requires all schools and districts meet Adequate Yearly Progress (AYP) requirements. California public schools and districts are required to meet or exceed criteria in the following four target areas:
1. Participation rate on statewide assessments in English-language arts and mathematics
2. Percentage of students scoring proficient on statewide assessments in English-language arts and mathematics
3. API scores
4. Graduation rate for high schools
The table displays whether or not the school and district met each of the AYP criteria and made overall AYP for 2012-13. For more information, visit www.cde.ca.gov/ta/ac/ay/.
Federal Intervention ProgramSchools and districts receiving Title I funding that fail to meet AYP over two consecutive years in the same content area (English-language arts or mathematics) or on the same indicator (API or gradua-tion rate) enter into Program Improvement (PI). Each additional year that the district or school(s) do not meet AYP results in advancement to the next level of intervention. The percent of schools identified for Program Improvement is calculated by taking the number of schools currently in PI within the district and dividing it by the total number of Title I schools within the district. This table displays the 2013-14 Program Improvement status for the school and district. For detailed information about PI Identification, please visit www.cde.ca.gov/ta/ac/ay/tidetermine.asp.
÷ Not applicable. The graduation rate for AYP criteria applies to high schools.
Percentage of Students Meeting Fitness Standards
2012-13 School Year
Grade 5
Four of Six Standards 21.80%
Five of Six Standards 29.50%
Six of Six Standards 38.50%
California Physical Fitness TestEach spring, all students in grades 5, 7, and 9 are required to participate in the California Physical Fitness Test (PFT). The Fitnessgram® is the designated PFT for students in California public schools put forth by the State Board of Education. The PFT measures six key fitness areas:
1. Aerobic Capacity
2. Body Composition
3. Flexibility
4. Abdominal Strength and Endurance
5. Upper Body Strength and Endurance
6. Trunk Extensor Strength and Flexibility
Encouraging and assisting students in establishing lifelong habits of regular physical activity is the primary goal of the Fitnessgram®. The table shows the percentage of students meeting the fit-ness standards of being in the “healthy fitness zone” for the most recent testing period. For more detailed information on the California PFT, please visit www.cde.ca.gov/ta/tg/pf.
6Indian Valley Elementary School • 2012-13 SARC
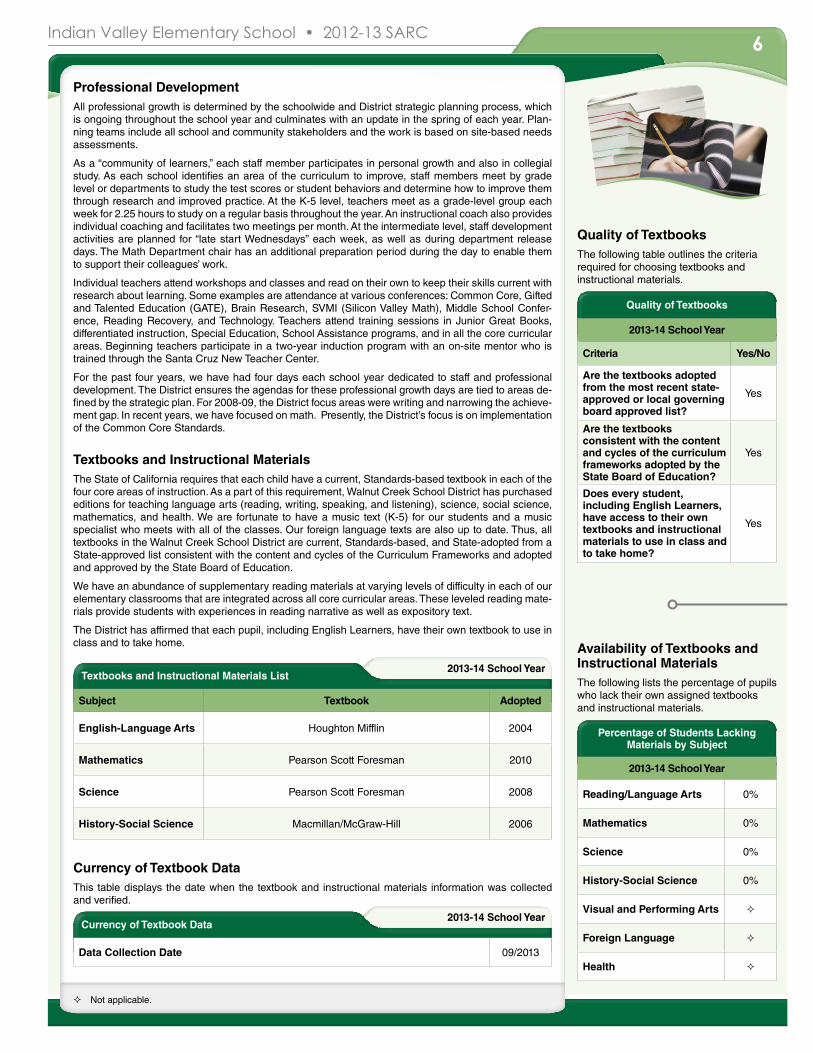
2013-14 School YearTextbooks and Instructional Materials List
Subject Textbook Adopted
English-Language Arts Houghton Mifflin 2004
Mathematics Pearson Scott Foresman 2010
Science Pearson Scott Foresman 2008
History-Social Science Macmillan/McGraw-Hill 2006
Textbooks and Instructional MaterialsThe State of California requires that each child have a current, Standards-based textbook in each of the four core areas of instruction. As a part of this requirement, Walnut Creek School District has purchased editions for teaching language arts (reading, writing, speaking, and listening), science, social science, mathematics, and health. We are fortunate to have a music text (K-5) for our students and a music specialist who meets with all of the classes. Our foreign language texts are also up to date. Thus, all textbooks in the Walnut Creek School District are current, Standards-based, and State-adopted from a State-approved list consistent with the content and cycles of the Curriculum Frameworks and adopted and approved by the State Board of Education.
We have an abundance of supplementary reading materials at varying levels of difficulty in each of our elementary classrooms that are integrated across all core curricular areas. These leveled reading mate-rials provide students with experiences in reading narrative as well as expository text.
The District has affirmed that each pupil, including English Learners, have their own textbook to use in class and to take home.
Percentage of Students Lacking Materials by Subject
2013-14 School Year
Reading/Language Arts 0%
Mathematics 0%
Science 0%
History-Social Science 0%
Visual and Performing Arts ²
Foreign Language ²
Health ²
Availability of Textbooks and Instructional MaterialsThe following lists the percentage of pupils who lack their own assigned textbooks and instructional materials.
Professional DevelopmentAll professional growth is determined by the schoolwide and District strategic planning process, which is ongoing throughout the school year and culminates with an update in the spring of each year. Plan-ning teams include all school and community stakeholders and the work is based on site-based needs assessments.
As a “community of learners,” each staff member participates in personal growth and also in collegial study. As each school identifies an area of the curriculum to improve, staff members meet by grade level or departments to study the test scores or student behaviors and determine how to improve them through research and improved practice. At the K-5 level, teachers meet as a grade-level group each week for 2.25 hours to study on a regular basis throughout the year. An instructional coach also provides individual coaching and facilitates two meetings per month. At the intermediate level, staff development activities are planned for “late start Wednesdays” each week, as well as during department release days. The Math Department chair has an additional preparation period during the day to enable them to support their colleagues’ work.
Individual teachers attend workshops and classes and read on their own to keep their skills current with research about learning. Some examples are attendance at various conferences: Common Core, Gifted and Talented Education (GATE), Brain Research, SVMI (Silicon Valley Math), Middle School Confer-ence, Reading Recovery, and Technology. Teachers attend training sessions in Junior Great Books, differentiated instruction, Special Education, School Assistance programs, and in all the core curricular areas. Beginning teachers participate in a two-year induction program with an on-site mentor who is trained through the Santa Cruz New Teacher Center.
For the past four years, we have had four days each school year dedicated to staff and professional development. The District ensures the agendas for these professional growth days are tied to areas de-fined by the strategic plan. For 2008-09, the District focus areas were writing and narrowing the achieve-ment gap. In recent years, we have focused on math. Presently, the District’s focus is on implementation of the Common Core Standards.
Quality of Textbooks
2013-14 School Year
Criteria Yes/No
Are the textbooks adopted from the most recent state-approved or local governing board approved list?
Yes
Are the textbooks consistent with the content and cycles of the curriculum frameworks adopted by the State Board of Education?
Yes
Does every student, including English Learners, have access to their own textbooks and instructional materials to use in class and to take home?
Yes
Quality of TextbooksThe following table outlines the criteria required for choosing textbooks and instructional materials.
2013-14 School YearCurrency of Textbook Data
Data Collection Date 09/2013
Currency of Textbook DataThis table displays the date when the textbook and instructional materials information was collected and verified.
² Not applicable.
7Indian Valley Elementary School • 2012-13 SARC
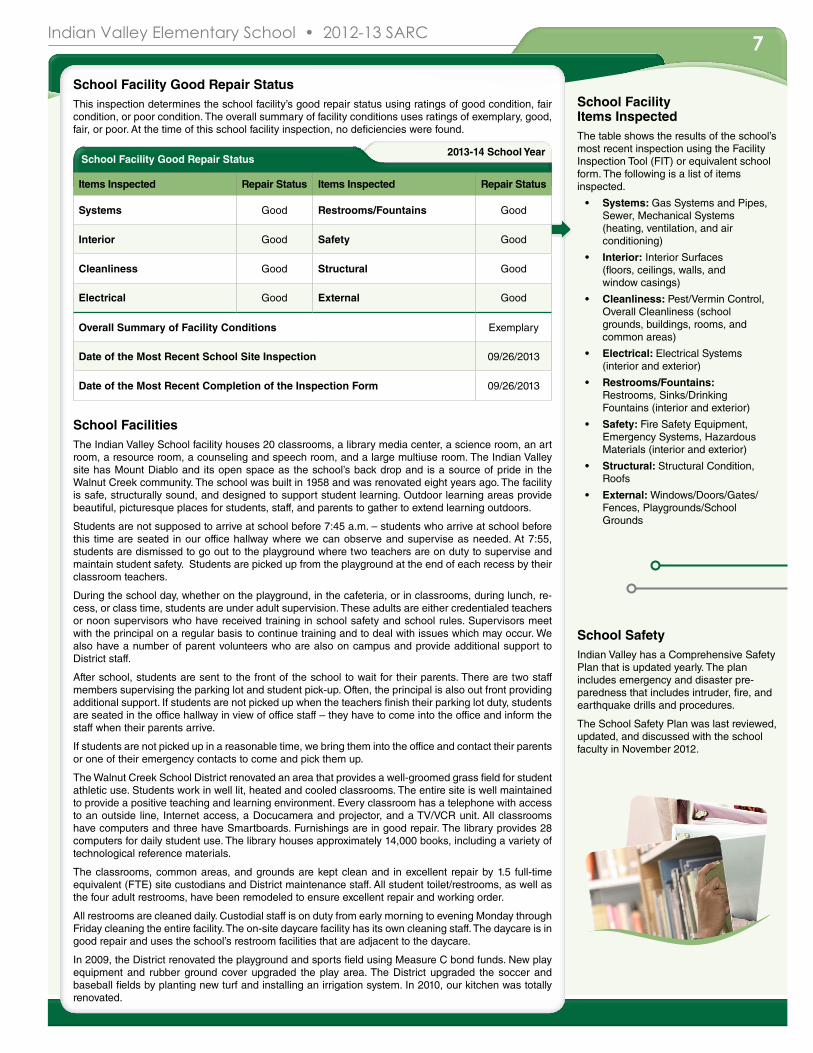
2013-14 School Year
School Facility Good Repair Status This inspection determines the school facility’s good repair status using ratings of good condition, fair condition, or poor condition. The overall summary of facility conditions uses ratings of exemplary, good, fair, or poor. At the time of this school facility inspection, no deficiencies were found.
School Facility Good Repair Status
Items Inspected Repair Status Items Inspected Repair Status
Systems Good Restrooms/Fountains Good
Interior Good Safety Good
Cleanliness Good Structural Good
Electrical Good External Good
Overall Summary of Facility Conditions Exemplary
Date of the Most Recent School Site Inspection 09/26/2013
Date of the Most Recent Completion of the Inspection Form 09/26/2013
School FacilitiesThe Indian Valley School facility houses 20 classrooms, a library media center, a science room, an art room, a resource room, a counseling and speech room, and a large multiuse room. The Indian Valley site has Mount Diablo and its open space as the school’s back drop and is a source of pride in the Walnut Creek community. The school was built in 1958 and was renovated eight years ago. The facility is safe, structurally sound, and designed to support student learning. Outdoor learning areas provide beautiful, picturesque places for students, staff, and parents to gather to extend learning outdoors.
Students are not supposed to arrive at school before 7:45 a.m. – students who arrive at school before this time are seated in our office hallway where we can observe and supervise as needed. At 7:55, students are dismissed to go out to the playground where two teachers are on duty to supervise and maintain student safety. Students are picked up from the playground at the end of each recess by their classroom teachers.
During the school day, whether on the playground, in the cafeteria, or in classrooms, during lunch, re-cess, or class time, students are under adult supervision. These adults are either credentialed teachers or noon supervisors who have received training in school safety and school rules. Supervisors meet with the principal on a regular basis to continue training and to deal with issues which may occur. We also have a number of parent volunteers who are also on campus and provide additional support to District staff.
After school, students are sent to the front of the school to wait for their parents. There are two staff members supervising the parking lot and student pick-up. Often, the principal is also out front providing additional support. If students are not picked up when the teachers finish their parking lot duty, students are seated in the office hallway in view of office staff – they have to come into the office and inform the staff when their parents arrive.
If students are not picked up in a reasonable time, we bring them into the office and contact their parents or one of their emergency contacts to come and pick them up.
The Walnut Creek School District renovated an area that provides a well-groomed grass field for student athletic use. Students work in well lit, heated and cooled classrooms. The entire site is well maintained to provide a positive teaching and learning environment. Every classroom has a telephone with access to an outside line, Internet access, a Docucamera and projector, and a TV/VCR unit. All classrooms have computers and three have Smartboards. Furnishings are in good repair. The library provides 28 computers for daily student use. The library houses approximately 14,000 books, including a variety of technological reference materials.
The classrooms, common areas, and grounds are kept clean and in excellent repair by 1.5 full-time equivalent (FTE) site custodians and District maintenance staff. All student toilet/restrooms, as well as the four adult restrooms, have been remodeled to ensure excellent repair and working order.
All restrooms are cleaned daily. Custodial staff is on duty from early morning to evening Monday through Friday cleaning the entire facility. The on-site daycare facility has its own cleaning staff. The daycare is in good repair and uses the school’s restroom facilities that are adjacent to the daycare.
In 2009, the District renovated the playground and sports field using Measure C bond funds. New play equipment and rubber ground cover upgraded the play area. The District upgraded the soccer and baseball fields by planting new turf and installing an irrigation system. In 2010, our kitchen was totally renovated.
School Facility Items Inspected The table shows the results of the school’s most recent inspection using the Facility Inspection Tool (FIT) or equivalent school form. The following is a list of items inspected.
• Systems: Gas Systems and Pipes, Sewer, Mechanical Systems (heating, ventilation, and air conditioning)
• Interior: Interior Surfaces (floors, ceilings, walls, and window casings)
• Cleanliness: Pest/Vermin Control, Overall Cleanliness (school grounds, buildings, rooms, and common areas)
• Electrical: Electrical Systems (interior and exterior)
• Restrooms/Fountains: Restrooms, Sinks/Drinking Fountains (interior and exterior)
• Safety: Fire Safety Equipment, Emergency Systems, Hazardous Materials (interior and exterior)
• Structural: Structural Condition, Roofs
• External: Windows/Doors/Gates/Fences, Playgrounds/School Grounds
School SafetyIndian Valley has a Comprehensive Safety Plan that is updated yearly. The plan includes emergency and disaster pre-paredness that includes intruder, fire, and earthquake drills and procedures.
The School Safety Plan was last reviewed, updated, and discussed with the school faculty in November 2012.
8Indian Valley Elementary School • 2012-13 SARC
²Not applicable.
Three-Year Data ComparisonTeacher Credential Information
Walnut Creek SD Indian Valley ES
Teachers 12-13 10-11 11-12 12-13
With Full Credential 171 23 22 23
Without Full Credential 0 0 0 0
Teaching Outside Subject Area of Competence 0 0 0
Three-Year Data ComparisonTeacher Misassignments and Vacant Teacher Positions
Indian Valley ES
Teachers 11-12 12-13 13-14
Teacher Misassignments of English Learners 0 0 0
Total Teacher Misassignments 0 0 0
Vacant Teacher Positions 0 0 0
2012-13 School YearNo Child Left Behind Compliant Teachers
Percent of Classes in Core Academic Subjects
Taught by Highly Qualified Teachers
Not Taught by Highly Qualified Teachers
Indian Valley ES 100.00% 0.00%
All Schools in District 99.19% 0.81%
High-Poverty Schools in District ² ²
Low-Poverty Schools in District 99.19% 0.81%
“Every person is respected, supported,
and safe.”
Teacher QualificationsThis table shows information about teacher credentials and teacher qualifications. Teachers without a full credential include teachers with district and university internships, pre-internships, emergency or other permits, and waivers. For more information on teacher credentials, visit www.ctc.ca.gov/.
Teacher Misassignments and Vacant Teacher PositionsThis table displays the number of teacher misassignments (positions filled by teachers who lack legal authorization to teach that grade level, subject area, student group, etc.) and the number of vacant teacher positions (not filled by a single designated teacher assigned to teach the entire course at the beginning of the school year or semester). Please note total teacher misassignments includes the num-ber of teacher misassignments of English Learners.
Core Academic Classes Taught by Highly Qualified TeachersThe No Child Left Behind Act (NCLB) extended ESEA to require that core academic subjects be taught by Highly Qualified Teachers, defined as having at least a bachelor’s degree, an appropriate California teaching credential, and demonstrated competence for each core academic subject area he or she teaches. The table displays data regarding highly qualified teachers from the 2012-13 school year.
High-poverty schools are defined as those schools with student participation of approximately 40 per-cent or more in the free and reduced priced meals program. Low-poverty schools are those with student participation of approximately 39 percent or less in the free and reduced priced meals program. For more information on teacher qualifications related to NCLB, visit www.cde.ca.gov/nclb/sr/tq.
Academic Counselors and School Support Staff Data
2012-13 School Year
Academic Counselors
FTE of Academic Counselors 0.00
Ratio of Students Per Academic Counselor ²
Support Staff FTE
Social/Behavioral or Career Development Counselors 0.00
Library Media Teacher (Librarian) 0.00
Library Media Services Staff (Paraprofessional) 1.00
Psychologist 0.22
Social Worker 0.00
Nurse 0.17
Speech/Language/Hearing Specialist 0.25
Resource Specialist (non-teaching) 0.00
Academic Counselors and School Support StaffThis table displays information about aca-demic counselors and support staff at the school and their full-time equivalent (FTE).
School Accountability Report CardIn accordance with State and federal requirements, the School Accountability Report Card (SARC) is put forth annually by all public schools as a tool for parents and interested parties to stay informed of the school’s progress, test scores, and achievements.
9Indian Valley Elementary School • 2012-13 SARC
Data for this year’s SARC was provided by the California Department of Education (CDE), school, and district offices. For additional information on California schools and districts, please visit DataQuest at http://data1.cde.ca.gov/dataquest. DataQuest is an online resource that provides reports for accountability, test data, enrollment, graduates, dropouts, course enrollments, staffing, and data regarding English Learners. For further information regarding the data elements and terms used in the SARC see the 2012-13 Academic Performance Index Reports Information Guide located on the CDE API Web page at www.cde.ca.gov/ta/ac/ap. Per Education Code Section 35256, each school district shall make hard copies of its annually updated report card available, upon request, on or before February 1 of each year.
All data accurate as of December 2013.
School Accountability Report Card
PubliShed by:
www.sia-us.com | 800.487.9234
2011-12 Fiscal YearDistrict Salary Data
Walnut Creek SD Similar Sized District
Beginning Teacher Salary $44,078 $41,327
Mid-Range Teacher Salary $65,413 $63,903
Highest Teacher Salary $83,555 $81,573
Average Elementary School Principal Salary $121,304 $103,887
Average Middle School Principal Salary $120,999 $107,439
Superintendent Salary $195,572 $155,551
Teacher Salaries — Percent of Budget 46% 41%
Administrative Salaries — Percent of Budget 5% 6%
2011-12 Fiscal YearFinancial Data Comparison
Expenditures Per Pupil From
Unrestricted Sources
Annual Average Teacher
Salary
Indian Valley ES $5,586 $70,860
Walnut Creek SD $5,587 $71,873
California $5,537 $66,594
School and District — Percent Difference -0.0% -1.4%
School and California — Percent Difference +0.9% +6.4%
Financial Data The financial data displayed in this SARC is from the 2011-12 fiscal year. The most current fiscal infor-mation available provided by the state is always two years behind the current school year, and one year behind most other data included in this report. For detailed information on school expenditures for all districts in California, see the CDE Current Expense of Education & Per-pupil Spending Web page at www.cde.ca.gov/ds/fd/ec/. For information on teacher salaries for all districts in California, see the CDE Certificated Salaries & Benefits Web page at www.cde.ca.gov/ds/fd/cs/. To look up expenditures and salaries for a specific school district, see the Ed-Data Web site at www.ed-data.org.
District Financial DataThis table displays district teacher and administrative salary information and compares the figures to the state averages for districts of the same type and size based on the salary schedule. Note the district salary data does not include benefits.
Financial Data ComparisonThis table displays the school’s per pupil expenditures from unrestricted sources and the school’s aver-age teacher salary and compares it to the district and state data.
School Financial Data
2011-12 Fiscal Year
Total Expenditures Per Pupil $8,462
Expenditures Per Pupil From Restricted Sources $2,875
Expenditures Per Pupil From Unrestricted Sources $5,586
Annual Average Teacher Salary $70,860
School Financial DataThe following table displays the school’s average teacher salary and a breakdown of the school’s expenditures per pupil from unrestricted and restricted sources.
Expenditures Per PupilSupplemental/Restricted expenditures come from money whose use is controlled by law or by a donor. Money that is designated for specific purposes by the district or governing board is not considered re-stricted. Basic/Unrestricted expenditures are from money whose use, except for general guidelines, is not controlled by law or by a donor.
Types of Services FundedThe following Federal and State funded programs are provided to schools in the Walnut Creek School District:
• Title I (Helping Disadvantaged Students Meet Standards)
• Two reading full-time equivalent (Buena Vista/Murwood)
• Title II (Improving Teacher Quality)
• Title II (Technology)
• Title III (Limited English Proficient students)
• Economic Impact Aid/Limited English Proficient (EIA/LEP)
• Gifted and Talented Education (GATE)
• Beginning Teacher Support and Assessment (BTSA)
• Class Size Reduction (CSR)
• English Language Acquisition Program (ELAP)
• School Improvement Program (SIP)
• Art, Music, PE (ongoing funds)
• Instructional Materials Funds (IMF)
• Safety funds