Embed Size (px)
Citation preview

Indian Steel Industry
Chetan Phalke
June 2018

Steel Sector In India - Overview
Installed Capacity 132 MT
Production 104 MT
Export 10 MT
IMPORT 8 MT
Domestic Consumption 90 MT
Source : JPC
[CATEGO
RY NAME],
[VALUE]
[CATEGO
RY NAME],
[VALUE]
Flat, 42%
Longs,
58%
Top 5 Producers - SAIL, JSPL, Tata Steel, JSW, RINL – 55% of the capacity , 50% of the production
Consumption Production
2

Longs
52%
Alloy
8%
HRC
18%
CRC
5%
GP / GC
Sheets
7%
Plates
6%
Other Flats
4%
3
Infrastructure Moves The Needle
Constructio
n & Infra
62% Automotive
13%
Engineering
&
Fabrication
22%
Others
3%
Majority of the steel demand comes from
Infrastructure and construction sector. Infrastructure, auto are doing well. Engineering & fabrication too should improve as private sector capex picks up.
Nearly 52% demand comes from long products i.e. wire rods, TMT bars which are
used in infrastructure & construction. Flat products are used mainly in auto, capital goods, consumer goods etc.
FY 18 Steel Consumption
~90 Million Tons

4
The Beginning Of Massive Infrastructure Spends
181000
251000 221000
396000
597000
2014 2015 2016 2017 2018
Budget Allocation To Infrastructure ( in crores )
• Government has stepped up its overall spend on infrastructure projects.
• With a clear objective to create more
jobs, improve infrastructure & boost domestic demand along with private sector capex.
• Above spend is cumulative spend for
smart cities, Amrut + railways ( 1.48 lakh
cr ) + roads & highways ( 1.2 lakh cr ) + bharatmala, sagarmala etc.
• As the economy grows & budget size grows, expect more acceleration towards infrastructure spends.
Source : FICCI
5
GDP Multiplier Back Above 1x
Year 2015 2016 2017 2018 2021 Est
Consumption ( MT ) 77 81.5 84 ~90 ~115
Consumption Growth % 3.90% 5.90% 3% ~7.1% ~8%
GDP Growth % 7.90% 7% 7.20% ~6.5% ~7.5%
GDP Multiplier (x) 0.5 0.8 0.4 ~1.1 ~1.1
# Source : JPC report. 2018 Estimates based on available
consumption data for April 2017 to February 2018.
• Significant increase in infrastructure spends has led to bounce back in steel demand. • Steel consumption growth has bounced back to 7.1% during FY 18. GDP multiplier is back above 1.1x for the
first time since 2013.
• Historically GDP multiplier has always been more than 1. Even in the so called ‘hindu rate of growth’ era prior
to 1990’s. GDP is expected to bounce back towards 7.5% in the financial year 2019 as per the Economic Survey Of India 2018. After absorbing the Demonetization shock, economy is expected to continue to grow at 7-8% going forward.
• With GDP multiplier getting back above 1.1x, steel consumption will continue to grow at 8-10% or even more in the coming years.
While demand is
expected to pick up,
supply is likely to remain
tight. Very few new
capacities are coming
online by 2021. Most of
the existing integrated
steel producers will run at
full production capacities
by 2021 & domestic prices
too shall remain firm.

6
India’s Steel Sector – The Troubled Years
7
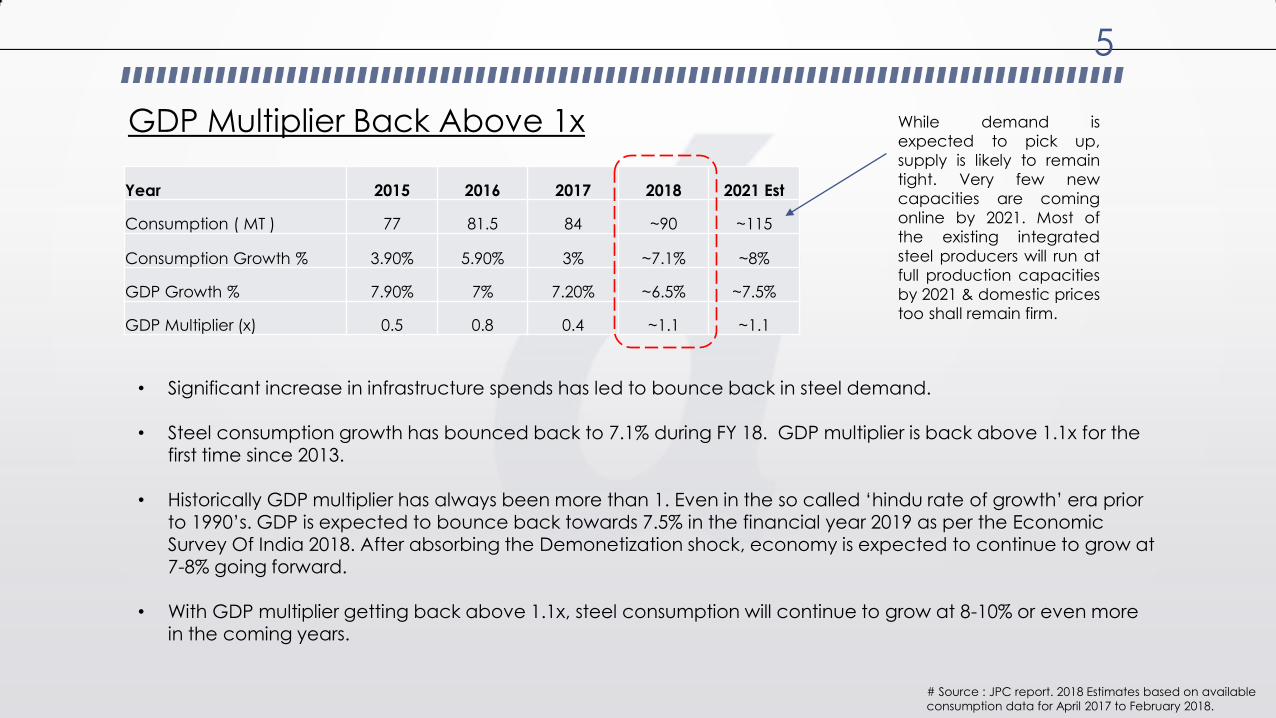
Lower Capacity Utilizations
Year 2010 2011 2012 2013 2014 2015 2016 2017
Capacity ( MT ) 75 80.3 90.8 97 102 109 122 125
Production ( MT ) 65.8 70.6 74.2 78.4 81.6 88.9 89.7 97.3
Utilization % 88% 88% 82% 81% 80% 81% 74% 78%
Consumption ( MT ) 59.3 66.4 71 73.4 74 77 81.5 84
Consumption Growth % 13.30% 11.90% 6.90% 3.50% 0.80% 3.90% 5.90% 3%
GDP Growth % 8.90% 5.50% 5.60% 6.60% 7.20% 7.90% 7% 7.20%
GDP Multiplier (x) 1.5 2.1 1.2 0.5 0.1 0.5 0.8 0.4
Exports ( MT ) 3.2 3.6 4.5 5.3 5.9 5.5 4 8.2
Imports ( MT ) 7.3 6.6 6.8 7.9 5.4 9.3 11.7 7.4
Net Imports ( MT ) 4.1 3 2.2 2.5 -0.5 3.7 7.6 -0.8
Significant capacities were commissioned
during 2010-2014. Mostly funded via debt.
Slowing growth plus influx of cheap
Chinese imports resulted in lower
capacity utilizations across the
industry. Steelmakers with weak
balance-sheets started going
bankrupt.
Government starts responding with
Excise duties & Minimum import
prices. Eventually leading to anti
dumping duties in early 2017.

8
China…400 MT Excess Capacity !

9
Chinese Steel Exports…Just Dump It !

10
China…Course Correction
11
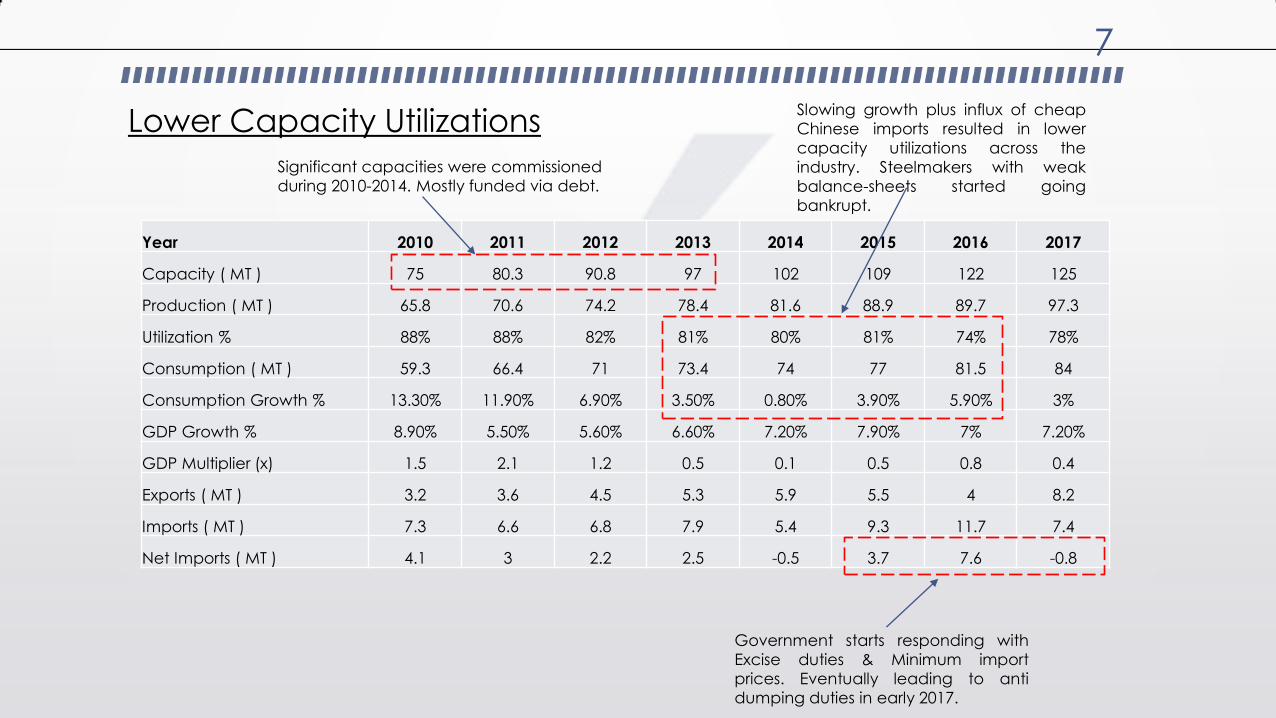
Controlling Imports – Effective Government Intervention
• Steel ministry started with safe guard duties. Followed by minimum import prices.
• Due to rampant circumvention, finally anti dumping duties were imposed in early 2017. Source : CRISIL
12
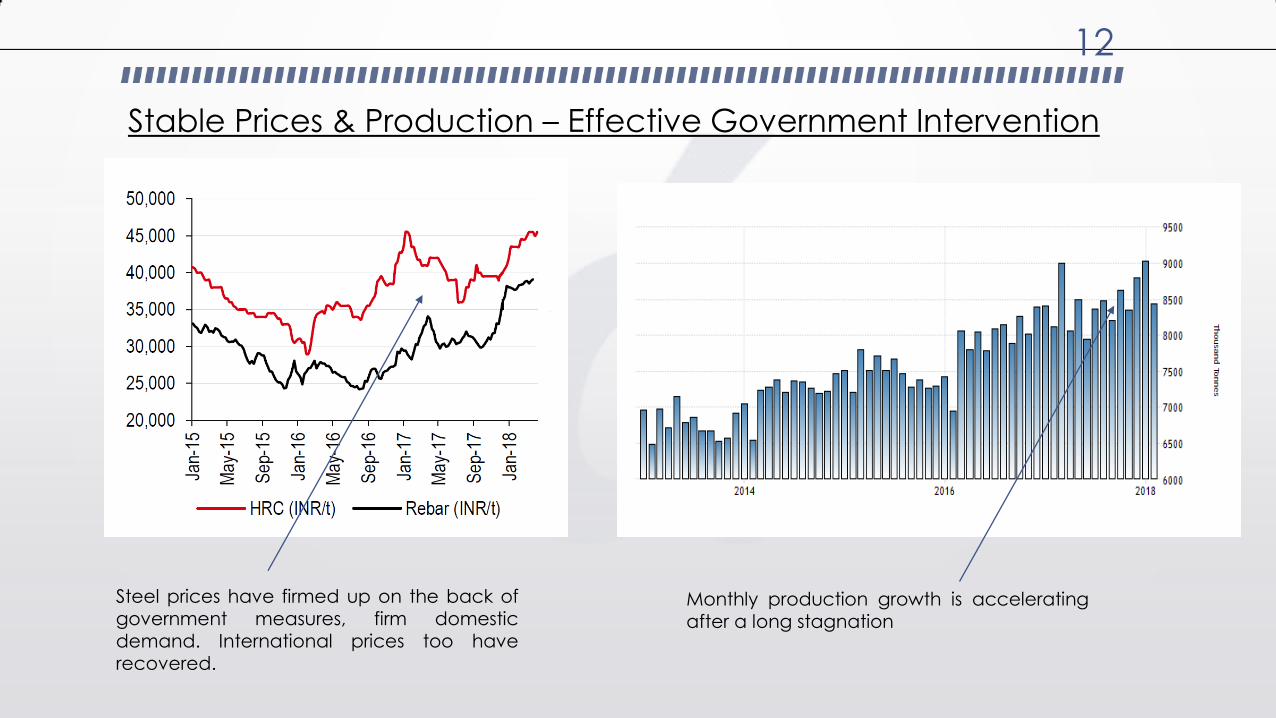
Stable Prices & Production – Effective Government Intervention
Steel prices have firmed up on the back of
government measures, firm domestic demand. International prices too have recovered.
Monthly production growth is accelerating after a long stagnation

13
National Steel Policy

14
National Steel Policy – 300 MT Target Is Not A Big Deal !
10 30
132
300
1980 2000 2018 2030
India’s Installed Steel Capacity ( MT )
CAGR - 6.6%
CAGR – 8.5%
Expected CAGR - 7%

15
Can India’s Steel Demand Breakout On The Higher Side ?
Source : World Steel Association
Year Production
1970 21 MT
1975 25 MT
1982 27 MT
1989 61 MT
1996 112 MT
2003 210 MT
2009 580 MT
2016 800 MT

16
India’s Steel Supply – Existing Capacities To Hit Full Production
SAIL
16%
Tata Steel
14%
JSW Steel
15% JSPL
7%
RINL
5%
Essar + Bhushan
Steel + Monnet +
Electrosteel &
Others
43%
132 MT Capacity As On March 2018

17
No New Capex Till 2021
• 5 companies constitute nearly 55% of India’s overall steel production capacity of 131 MT as of FY18. • New capacity expansion plans are likely to be announced only after 2021. It takes 3 years to set up a
steel plant & stabilize the operation from the zero date. • Even if new capex is announced in 2021-2022, new capacities are unlikely to get commissioned before
2024.
# numbers in MT ( million tons )
# JSW & Tata Steel est production adjusted
for Monnet & Bhushan acquisition.
Company Existing
Capacity Production ( FY 18 )
Upcoming Capex
Steel Authority Of India 21.4 ~15 None
No capex plans. Priority to ramp up existing capacity & deleverage the stretched balance sheet. New capex to come only after 2022. SAIL's capex is complete & hot metal capacity has moved up from 17 MT to 21.4 MT from April 2018.
JSW Steel 19.5 ~16.5 5 MT
5 MT brownfield expansion is underway at Dolvi. Expected to get commissioned by the end of 2020. New capex to come only after Dolvi production ramps up i.e. after 2021. Post acquisition of Monnet Ispat, JSW's capacity has moved from 18 MT to 19.5 MT. JSW may try for another acquisition via NCLT.
Tata Steel 18.3 ~15 6 MT
5 MT at Kalinganagar, expected to get completed by the end of 2021. New capex to come after 2022 once kalinganagar ramps up. Post Bhushan Steel's acquisition via NCLT, Tata Steel's India capacity has moved up from 12.7 MT to 18.3 MT. Might try for another acquisition.
Jindal Steel & Power 9.6 5.2 None
No. Priority to ramp up existing capacity & deleverage the balance sheet. New capex to come only after 2021-2022. JSPL has commissioned its integrated steel complex at Angul. Its India capacity stands at 9.6 MT.
RINL 6.3 4.5 1 MT 1 MT by the end of FY 19. Has a stretched balance sheet. New capex not possible for the next 2-3 years.

18
Bankruptcy Code & NCLT Resolutions
• Nearly 21 MT of 132 MT capacity went in stress, eventually became NPA’s.
• Banks are more than willing to take haircuts & resolve at the earliest. • Out of 21 MT in stress, only ~9 MT is being actively producing steel. These facilities are either shut down or
underutilized due to working capital crunch. • ~12 MT of idle capacity in these companies will be ramped up once resolutions are in place, and new
owners take control.
Company Capacity
9M FY18
Production Balance Ramp Up
NCLT Status
Bhushan Steel 5.6 MT 2.7 MT 2.2 MT
Acquired by Tata Steel for 36400 Cr
Bhushan Power & Steel 3.2 MT NA 3.2 MT
Resolution In Progress
Electrosteel Steel 2.51 MT 0.6 MT 2 MT
Acquired By Vedanta For 5200 Cr
Essar Steel 10 MT 6.3 MT 3 MT
Resolution In Progress
Monnet Ispat 1.8 MT 0.2 MT 1.5 MT
Acquired By JSW Steel For 3700 Cr
# numbers in MT ( million tons )

19
Good Days Ahead
75 90.8 109 132 150 65.8 74.2 88.9 104 130
88%
82% 81%
78.8%
90%
72%
74%
76%
78%
80%
82%
84%
86%
88%
90%
92%
0
20
40
60
80
100
120
140
160
2010 2012 2015 2018 2021Capacity ( MT ) Production ( MT ) Utilization
Capacity addition – 57 MT
Incremental production – 38 MT
Capacity addition – 14 MT
Incremental production – 26 MT
# New Capacities Coming Up by 2021 : Tata Steel Kalinganagar 5 MT + JSW Steel Dolvi 5 MT + RINL 1 MT + NMDC 3 MT
# 2018 capacity of 132 MT includes NCLT company capacities. Utilization likely to cross 90% in FY 21 even if balance
capacity of NCLT companies is ramped up fully.

20
Consolidation & De-leveraging Of Steel Sector
• New capacity expansion plans are likely to be announced only after 2021. It takes 3 years to set up a steel plant & stabilize the operation.
• Even if new capex is announced in 2021-2022, new capacities are unlikely to get commissioned before
2024-2025. Very high probability to have 88-90% or more utilization for next 4-5 years.
Tight supply + Strong Demand
Strong domestic steel prices
Capacity utilizations should move up
De-leveraging of the balance sheets
Banks wont lend further till balance sheets are repaired
Governments anti-dumping duties to continue till 2022. And will be extended further.
All integrated steel companies are going to make profits. ALL !

Steel Sector Re-rating On Cards ?
• Industry will be protected
• 10 MT of steel import adds 50000 cr to import bill. Unlikel !
• Tight Supply
• Greenfield capex viable at 10000 rs EBIDTA per ton ( ROE of 9.5% on a 60 : 40 debt to equity, 6500 cr per
MT )
• Brownfield capex viable at 7000 rs EBIDTA per ton ( ROE of 9.5% on a 60 : 40 debt to equity, 4500 cr per
MT )
• Companies with brownfield expansion capabilities should do well
• Domestic consumption story
21

22
Thank You