Embed Size (px)
Citation preview

1~* <S
INDIAN POINT UNIT NO. 2 CYCLE 3
STARTUP PHYSICS TEST REPORT
0
CONSOLIDATED EDISON COMPANY OF NEW YORK INC.
AUGUST 1978
1\ .7f .
IL I~t~ L . u h '
,/fv~cc e.6-r
8111020539 780831 PDR ADOCK 05000247 P PDR

II
ABSTRACT
This report summarizes the results of the Startup Physics
Tests for Cycle 3 of the Indian Point Unit No. 2 Reactor
performed at Hot Zero Power condition, and during reactor
power level escalation. Results of these tests demonstrate
ad-equate conservatism of the Cycle 3 design for safe operation
in accordance with the Indian Point Unit No. 2 Technical
Specifications.

TABLE OF CONTENTS
PAGE NO.
ABSTRACT i
LIST OF TABLES LIST OF FIGURES iv
1. INTRODUCTION 1
2. REACTOR CORE DESCRIPTION 3
2.1 REACTOR CORE CONTROL 3
2.2 REACTOR CORE INSTRUMENTATION 3
2.3 CYCLE 3 CORE LOADING 4
3. MEASUREMENT METHODS 8
3.1 REACTIVITY MEASUREMENT 8
3.2 CORE POWER DISTRIBUTION MEASUREMENT 9
3.3 THERMAL POWER MEASUREMENT 9
4. HOT ZERO POWER TESTS 12
4.1 INITIAL CRITICALITY 12
4.2 END POINT BORON CONCENTRATIONS 13
4.3 RCC BANK DIFFERENTIAL AND INTEGRAL WORTHS 13
4.4 ISOTHERMAL TEMPERATURE COEFFICIENTS 14 4.5 DIFFERENTIAL BORON WORTH 15
5. AT POWER TESTS 22
5.1 CORE POWER DISTRIBUTIONS 22
5.2 POWER COEFFICIENT 24
5.3 REACTOR COOLANT FLOW DETERMINATION 26
6. REACTOR INSTRUMENTATION CALIBRATION 34
6.1 EXCORE-INCORE DETECTOR CALIBRATION 34
6.2 INCORE T/C and WIDE RANGE RTD CALIBRATION 34
7. REFERENCES 41

LIST OF TABLES
TABLES TITLE PAGE NO.
1.1 IP-2 Cycle 3
Startup Physics Tests Program 2
3.1 Period to Reactivity Comparison 10
3.2 Delayed Neutron Data 10
4.1 End Point Boron Concentrations 16
4.2 Control Rod Bank Integral Worth 17 Summary
4.3 Isothermal Temperature Coefficient 18
5.1 Summary of Results of Incore Analysis, 27 IP-2 Cycle 3 Startup Maps
5.2 Power Coefficient 28A )
5.3 Total Measured RC Flow Rate 29
6.1 RTD Correction Factors 36
iii

LIST OF FIGURES
FIGURE TITLE PAGE NO.
2.1 Control Rod Locations 5
2.2 In-Core Instrumentation 6 Thermocouples and Movable Detectors
2.3 IP- 2 Cycle 3 Core Loading Pattern 7
3.1 Process Instrumentation Arrangements 11 for Reactivity Measurements
4.1 Inverse Count Rate Ratio vs hilution 19 Water Addition
4.2 Inverse Count Rate Ratio vs RCC 20 Bank Position
4.3 Diffirrehtlh Rod Worth vs Neutron 21 Flux
5.1 IP-2 Cycle 3, BOL and HZP Condition 30 Power Map
5.2 IP-2 Cycle 3, BOL,-40% Power Map 31
5.3 IP-2 Cycle 3, BOL,'-9O% Power Map 32
5.4 IP-2 Cycle 3, BOL,A190% Power Map 33
6.1 Excore Detector Current vs. 37 Axial Offset Channel N-41.
6.2 Excore Detector Current vs Axial 38 Offset channel N-42.
6.3 Excore Detector Current vs Axial 39 Offset Channel N-43.
6.4 Excore Detector Current vs 40 Axial Offset Channel N-44.
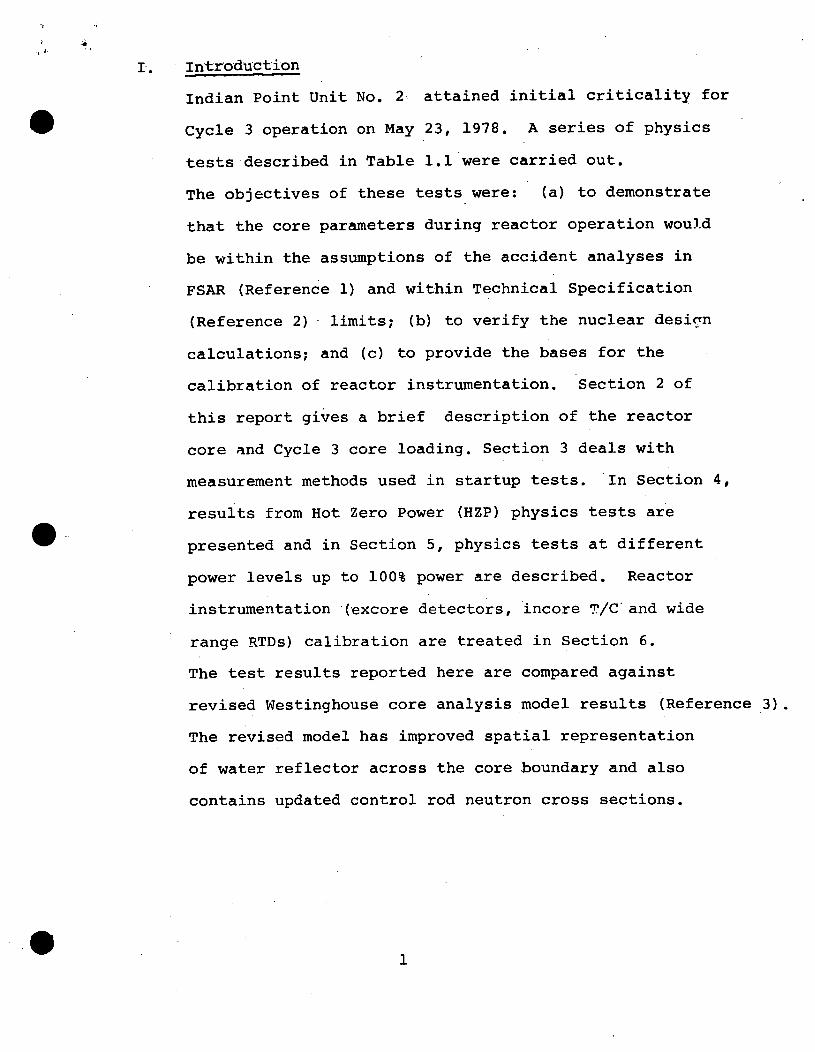
i. Introduction
Indian Point Unit No. 2 attained initial criticality for
SCycle 3 operation on May 23, 1978. A series of physics
tests described in Table 1.1 were carried out.
The objectives of these tests were: (a) to demonstrate
that the core parameters during reactor operation woul~d
be within the assumptions of the accident analyses in
FSAR (Reference 1) and within Technical Specification
(Reference 2)- limits; (b) to verify the nuclear desigrn
calculations; and (c) to provide the bases for the
calibration of reactor instrumentation. Section 2 of
this report gives a brief description of the reactor
core and Cycle 3 core loading. Section 3 deals with
measurement methods used in startup tests. *In Section 4,
results from Hot Zero Power (HZP) physics tests are
5 presented and in Section 5, physics tests at different
power levels up to 100% power are described. Reactor
instrumentation '(excore detectors, incore T/C and wide
range RTDs) calibration are treated in Section 6.
The test results reported here are compared against
revised Westinghouse core analysis model results (Reference 3).
The re vised model has improved spatial representation
of water reflector across the core-boundary and also
contains updated control rod neutron cross sections.

Table 1.1 Indian Point Unit No. 2 Cycle 3 Startup Physics Tes-t Program
1. Pre-criticality Measurements
Incore Thermocouple and Wide Range RTD Calibration.
2. Hot Zero Power (HZP) No Xenon Condition Tests
2.1 Initial Criticality
2.2 Isothermal Temperature Coefficient at Control rod configurations given below.
(i) All Rods Out (ii) Control Bank D In
(iii) Control Banks, C and D In (iv) Control Banks D, C & B at HZP Insertion Limit
2.3 End Point Boron Concentrations for Control rod configurations given below.
(i) All Rods Out (ii) Control Bank D In
(iii) Control Banks D and C In (iv) Control Banks D, C & B at HZP Insertion Limit
2.4 Control Rod Worth (Integral and Differential) Measurements
(i) Control Bank D (ii) Control Bank C with Control Bank D In
(iii) Control Bank D, C and B in overlap up to HZP Insertion Limit.
3. Power Ascension Tests
3.1 Ex-core Detectors Calibration at-90% of reactor power.
3.2 Power Coefficient Measurements at-90% of reactor power.
3.3 Movable Incore Detector Flux Maps at power levels 4(5%,-40%,-90% and-100% of reactor power.
3.4 Reactor Coolant Flow Measurement.

2. Reactor 'Core Description
Indian Point Unit No. 2 core consists of 193 fuel
Sassemblies of slightly enriched uranium dioxide. Each
fuel assembly contains 204 fuel rods with zirconium
alloy cladding, 20 stainless steel rod cluster control (RCC) guide
tubes for inserting control rods, and a central stainless
steel instrumentation thimble. Fourteen twice depleted
burnable poison rods, coupled to the Sb-Be secondary
sources were inserted in assembly locations H-3 and H-13.
To ensure quarter core symmetry similar burnable poison
configurations were placed in locations C-8 and N-S.
2.1 Reactor Core Control
In addition to the chemical shim control by boric
acid dissolved in the coolant water, control and
shutdown of the reactor is accomplished by 53
O full-length Rod Cluster Control Assemblies (RCCA's).
The latter consist of four control and four shutdown
banks. Figure 2.1 is an X-Y cross-section of
the reactor core describing RCC bank positions.
2.2 Reactor Core Instrumentation
The reactor core instrumentation consists of four
ex-core detectors, six moveable in-core
detectors (M/D) capable of scanning up to 50
fuel assemblies through their central thimble
guide tubes, 65 in-core thermocouples (T/C) to
monitor exit coolant temperatures. Figure 2.2
shows the in-core instrumentation.
2.3 Cycle 3 Core, 'Loading
The Indian Point Unit No. 2 Cycle 3 core loading
as shown in Figure 2.3., was completed by April 20,
1978. The final core loading was in agreement
with the core loading pattern as developed by
Westinghouse and described on Westinghouse drawing
#1448EB8, with the exception of a switch in the
core location of symmetrical fuel assemblies D-44 and
D-40. During the removal of burnable poison rods
from D-44 assembly a small portion of a broken burnable
poison rodlet could not be removed from the assembly.
This precluded its placement in core location L-7
due to the presence of a control rod at this position.
D-44 was subsequently loaded into core position L-9 and D- 40
into L-7. This change was reviewed and approved by
Westinghouse.

15 14 13 12 II 10 9 8 7 6 5 4 3 2 1
I9100 R
L P (D .
AA
C SD
E A SA
SB . B
S O-c ("1 C c I
A A A
D FA] F
Biur .1Cnto Co Loain
A
2700
BANK SYMBOL NUMBER OF ROD CLUSTERS
SA 8 so 0 8
A 78
C 0 8
Figure 2.1 Control Rod Locations

15 14 13 12 II 10
0@ R I@Io -o9
101 01 10
0©0@01 0-® @1 @ 0 01 1 o10
(B)tC5l~ a K A@I Q 0K~AO
@I0l0k~AOI0l0I * IQ
cO©M 10
01N0 0 C K) 0101 ® ( 0o@000, oo@ 10
00
-1800
2700 LEGEND:
I THERMOCOUPLE
] MOVABLE DETECTOR
FLOW-MIXING DEVICE
]J FIXED DETECTOR
Figure 2-2 In-Core Instrumentation Thermocouples and Movable Detectors
010
K
H -00
E
D
0~Io@0101E 0 IQ
91 01600(§
.... A
wv v
0@ 00 ,0o@o0O @- ® @; O -[0 M [] ® 0
Of O) 01 14 isIl 0 10
S0 @ 0 O O0
(0

15 14 13 12 11 10 9 8
EAST
E56 101
[05 21
[25 38
£28 56
013 36
C36 58
D15 R44
006 43
030 39
D35 40
C29 R23
7 6 5 4 "3
E43 87
E45 67
I *1'-1 IE12 E37 109 I 86
C40 R19
238 841 E33 C42 211 R24 120 R38
£03 99
E35 119
E24 129 2106
[01 [42 C25 C13 C47 C44 I26I C48 C57 C2 of C22 [22 [14
1 110 R21 57 R48 j72 R51 B6 PI0 R12 77 ROB 5 R34 a
[ 50 105
C35 R04
034 7
[151 [44 1-7 C C21 C50 I C64 0DI C53 C43 C17 C26 E34 [53 94 R28 47 R06 102 R29 B6 P9 ARlI 80 RO2 50 R45
D16 R33
E16 91
E23 90
EIS 75
018 8
C5! R50
05 1
E09 89
E04 E02 14 73
648 R40
043 6
EO8 85
E21 71
C45 R22
E17 82
ES? E55 70 112
V- Ass. D44 contains broken Rodlet from 12P33
E41 E 54 81 1 79
.1~~~~~~
ASSMLY ID INSERT ID BURNUP
270P SYMBOLS
Fi gure 2-3 I(NOIAN POINT 2 CYCLE 3 LADING PAIRN
.D55 41
D41 2
003 42
D35 3
067 35
021 4
056 R49
020 ARI8
C30 49
C34 46
M
L
K K
I F
E40 [60 C15 D45 C19 D48 044 " D53 040 D29 C33 063 cis 09 E36 98 68 R26 24 12 76 44 5S3 R27 108 62 25 R1 209 208
E47 C60 C62 01? D57 C06 046 D65 D32 C05 014 038 C58 C54 [13 207 R16 130 26 104 ROI 123 R52 31 R42 ill 27 114 R06 206
[52 Ell CS? 060 062 072 D27 C31 059 049 D71 DOI C39 E26 [46 205 204 R17 19 R20 29 32 51 10 30 78 20 R36 203 202
019 B49 00? C41 070 D54 Co9 B53 C31 031 008 C46 D52 B62 050 14 R30 552 R47 P2 R41 45 R37 113 R05 48 R32 SSI R53 28
E31 E49 C49 022 011 010 051 C14 004 09 D23 037 C56 [51 [59 201 12 R31 22 I0 12 33 55 PI 13 R39 23 RIO 1 125
E06 C59 C63 036 039 COl D69 D61 D47 C23 DI? 042 C61 C5 *-1 124 AR48 101 15 100 R1 11 R09 5 RI5 96 16 88 R3 122
[0 E19 C16 064 C32 066 068 D58 D25 D24 C2 028 C24 [10 [2 121 l R35 17 34 66 R46 118 84 65 64 i8 ROF 116 115
2

3. Measurement Methods
The reactor was maintained at the just critical state during
the physics measurements and the reactor power was held
constant via control rod/boron exchanges and/or control
rod/coolant temperature exchanges. Small changes in
core reactivity during the tests were indicated by a
reactivity trace provided by a reactivity computer.
The axial power distribution in the instrumented assemblies
were obtained using the moveable in-core detectors.
3.1 Reactivity Measurement
The absolute measurement of small changes in
reactivity was provided by the on-line solution of
the point-reactor kinetics equations using an
analog reactivity computer. The computer was
checked out by comparing the reactivity obtained
from the reactor period with that given directly
by the reactivity computer. This comparison is
shown in Table 3.1. A good agreement between
reactivities obtained from two sources demonstrated
the reliability of delayed neutron data, given in
Table 3.2. This data was used as an input to the
solution of neutron kinetics equations by the
reactivity computer.
During HZP tests, an output signal from an ex-core
detector Channel N-42, as shown in Figure 3.1, was
fed into the reactivity computer. During the power
coefficient test, signals from the top and bottom
sections of all four ex-core detectors were first
summed and then fed into the reactivity Computer

3.2 Core Power Distribution Measurement
The Movable Detector (M/D) Flux Mapping System. was
used to collect power .distribtuion data during
start up tests at various power levels. Data
from the M/D system was input to the INCORE 2
code (Reference 4) to generate three dimensional
core power profiles. The INCORE 2 code combines
measured flux distributions with calculated (design)
flux distributions to yield measured hot channel
factors NF and FQ, quadrant tilt, core average
axial offset, relative assembly power distributions,
etc.
3.3 Thermal Power Measurement
Core thermal power was determined by performing a
heat balance across each of the steam generators.
This measurement required the accurate determination
of steam generator pressure, feedwater inlet
temperature, feedwater flow, steam generator blowdown
and other parameters.

Table 3.1
Period to Reactivity Comparison
Doubling Time Reactor Period Reactivity Reactivity Difference (sec) (sec) Pred. (pcm) Meas. (pcm) (M-P)pcm
79 114 47.8 48.3 0.5
184 266 23.2 23.5 0.3
Table 3.2
Delayed Neutron Data Bol Cycle 3 -1
Group Pi Ai (sec )
1 0.00018 0.013
2 0.00124 0.031
3 0.00112 0.118
4 0.00230 0.315
5 0.00080 1.253
6 0.00028 3.341
4" = 17.21ttsec (Prompt eutrin Life Time)
I = 0.970 (Delayed Neutron, Importanee Factor)
pi= (Delayed Neutron. Fraction for ith group.)

Zero Power Tests At-Po,,er Tests
A - Summing Junction B = Picoammeter C - Reactivity Computer D - Strip Chart Recorder
A = Isolation Amplifier B - Summing Junction C - Reactivity Computer D - Strip Chart Recorder
Figure 3.1 Process Instrumentation Arrangements for
Reactivity Measurements
0
A C43 I

4. Hot Zero Power (HZP) Tests
4.1 Initial Criticality
The Indian Point Unit No. 2 Cycle 3 attained
initial criticality on May 23, 1978. The criticality,
at beginning of cycle (BOC) and HZP condition, was
obtained by the sequential withdrawal of RCC
shutdown and control banks and by subsequently
diluting the borated reactor coolant. During the
approach to criticality, ICRR (Inverse Count
Rate Ratio) plots versus integrated primary water
addition and control rod position (Figures 4.1 and
4.2) were maintained. Measured critical boron concentration,
at no xenon1 BOL, HZP and ARO (All Rods Out) core condition,
was equal to 1378 ppm compared to the design prediction
of 1372 ppm (Reference 3). The difference
of 6 ppm between measured and design boron concentrations
was well within (+ 50 ppm of design) the acceptance limit for
this measurement. At the time of attainment of criticality,
neutron flux level as indicated by the calibrated picoammeter
(Keithley) was 3X10- 9 Amps.
Neutron flux range for HZP tests was determined by the
following method. The upper flux limit was determined by
observing the effect of nuclear heating which decreases
reactivity and increases reactor coolant temperature.
The upper flux limit for testing was set below the flux value
at which nuclear heating was observed. The nuclear
heating was determined to be above 3X10 -6 Amps, as shown in
Figure 4.3. The lower limit was governed by the background
noise level. In the presence of background noise, reactivity
0

computer underestimates-changes in core reactivity.
The lower limit was determined by measuring
the differential worth of control bank "D" at vafious
neutron flux levels. As shown in Figure 4.3, above the lower
limit of zero power physics range(10- 7 Amp) differential
rod worth is independent of flux level. HZP Physics
tests were carried out at a neutron flux level
between 10. 7and 10-6 Amps. on the Keithley picammeter,
as over this flux range the effects of nuclear heating and
background noise are absent.
4.2 End Point Boron Concentrations
End point boron concentrations for ARO condition, control bank D
in, control banks D and C in, and control banks D,
C and B in HZP insertion limit bank overlap configuration
cases were obtained. In Table 4.1,
measured end-point boron concentration for the
four control RCC bank configurations are presented.
The corresponding design results are also listed.
The maximum deviation, as shown in Table 4.1 is 11
ppm. Measured end-point boron concentrations met
the acceptance criteria.
4.3 RCC Bank Differential and Integral Worths
Measurements of the differential and integral
worths of individual RCC control banks C and D and
of D, C and B in the bank overlap configuration above the
HZP insertion limit were carried out via boron/RCC
exchange, with the reactor critical. The reactivity
computer trace provided indication of the change

in reactivity during insertion/withdrawal of a RCC
bank. The differential worth of a bank, 4 P/Ah,
is defined as the amount of change in reactivity
per unit step of bank position, about an average
bank position. The integral control bank worth
was obtained by summing the differential worths
for the bank positions obtained during the insertion
or withdrawal of the RCC bank.
In Table 4.2, the integral worths of individual
control bank and overlapped banks are presented
along with the design values. Measured integral worths in
all cases are within +10% of expected values, as shown
in Table 4.2. Also, the sum of the maximum measured
differential rod worth of RCC banks C and D is within the
assumed value used in the safety analyses of Indian Point Unit
No. 2 (Reference 1). Thus measured integral and
differential rod worths met the acceptance criteria
for the rod worths.
4.4 Isothermal Temperature Coefficients
Isothermal temperature coefficient measuremments
were carried out for four (All Rods Out, Control
bank D in, control banks D and C in, and Control banks D,
C and B at HZP insertion limit) RCC bank configurations.
This involved reactivity measurements during heatup and
cooldown of the reactor coolant. In Table 4.3, measured as
well as design values of isothermal temperature coefficients
for the above four RCC bank configurations are presented.
Measured values are obtained from the reactivity versus
temperature curves provided by an X-Y plot recorder and

the design values are from Reference 3. Measured
isothermal temperature coefficients were all negative
and within the acceptance criteria of + 3pcm/OF of
design value.
4.5 Differential Boron Worth
Based upon measured end-point boron concentrations
and control rod worth data given in Tables 4.1 and
4.2, differential boron worth was -9.5 pcm/ppm
compared to the design value of -9.5 pcm/ppm at
1300 ppm boron concentration.

Table 4.1
End-Point Boron Concentrations
Configuraition(1)
Measured (pPm)
(2) Design Appm)
(l)-(2) Deviation
(ppm)
All Rods Out
D ,In
D and C In
B, C and D at HZP Insertion Limit
1378
1312
1199
1230
1372
1301
1194
1228

0TABLE 4.2
CONTROL ROD BANK INTEGRAL WORTH SUMMARY
CONFIGURATION MEASURED
(2)
EXPECTED
(1) - (2)
DIFFERENCE
Worth (pcm)
630
Worth (pcm)
661+66
Difference (pcm)
-31
D IN
D In C at 80 steps B at 210 steps
HZP Insertion Limit
1073
1436
1002+100
1346+135
Note: Expected Value = Design Value +10% of Design Value
BANK
ARO
+71
+90

TABLE 4.3
ISOTHERMAL TEMPERATURE COEFFICIENTS
Configuration
ARO
D In, C Out
D and C In
B,C and D at HZP Insertion Limit
(1) Measured (PCM/°F)
-0.44
-1.07
-3.57
-3.14
(2) Expected (PCM/OF)
-0.33+3
-1.96+3
-4.18±3
-3.44+3
(1)-(2) Difference (PCM/OF)
-0.11
+0.89
+0.61
+0.30
Note: Expected Value * Design Value + 3pcm/°F

4-
11 -Ph •
T:4 Tj
w.1
2K' 7;
II
-H-4. *1
'I
p
--, T -- 44
... .....
K~- rw.w
.7 77: .1: I.
7: a;
~.~1!
,A, : _ ~7.7 i :7 ;
.......
...... ...
.......
ii ::+ fh 4T
'I
.
....
.
I J 1
0 . ....
U ..
1 "
..... t~iI ' 'L " .J1
1! ....
so . :"I,
d T
7. 1. ... ..... .... j I
4± ,t .. . .._
I:
T
IT- ,JRiA
Ii *1
1.-~.~ No~
17
-. L i
I, .1,, *..
'IT' ..
.. .
LI I I
ZIPI... .
I; 7, 1 . :11
It-i~
- IL
I.
,jL~44V~!.
in: 1.12
4'.
7t
-T7... ...
II]1II........... I([':;1
tdtL tj
( ,;:I;T 1 , r'm 1 T T
"
I'; It I . ... ... . . iI
: [ I
II
I . L , , I l m l I I I I[1
I '. I L I . " I . , I I , I ' , * Ii . ' ) ' ; ] I I ' l l , i I J 1 I N I l i l i l m i i m " : ) [ : ?I ( ( 1 1 1 . . . . [I
: J" .

.1i ' A
It'' -' !
. . .I
-4
* . ~-I.
yr~i --
A 1
2 7 otf " -'-.
I,,'
-~---4-~- 4 -~~-~-4- q - 4 -~
147
1!
II I ~t I
dl F; .;j ii' fi-j I-
~i1iK 4..
~Ii
1..'
t:
f'4J0.
I.7, 1
*i .1Li
±1
' ' !t
' . . . . . . . . : . . .
7i -+4+
... . . . . .
--4
-4 ~ 4-- -------4-i-- 4 + - --- 4----- + - 4--
:1
L!i44l i241.
t;7
44 ii 4
11
:71
, 7 . I
JiI, i
A I . . . I I I iI
4-- --------
L4 - f t ,I 1 4 1 1
77 7. ... .-
[
;J - :-14 N -14i
t .,:T-

hn] i IIII It I
7 i u Ye I)IFPt N T/AL RO WO R TI- VS NC~rRONV IL V,
dfji I
111 JII
it jt : t
Vtt i'H ri

5. AT POWER TESTS
The power measurement tests consisted of: (a) relative
assembly power distributions at HZP ( 5%),.-90%
and'l00% of full power; and (b) determination of power
coefficient versus reactor power. Although not part of the
official startup physics test program an additional map was
taken during the power escalation at -40% of full power.
5.1 Core Power Distributions
Measurements of the core power distributions were
carried out with the moveable incore detectors.
The INCORE code 2 (Reference 4) was employed to
analyze the in core flux maps to provide the
relative assembly power, hot channel factors,
quadrant tilt and axial offset. The analysis
required: (i) the calculated ratio between the
* power and the fission reaction rate at the locations
of the moveable incore detectors, and (ii) calculated
(X-Y) power distributions for the All Rods Out
(ARO) condition and the D bank in case. Item (ii) was
employed to obtain the power distribution
of the partially rodded core by the flux synthesis
method. Results from the analyses of four incore
full-core flux maps taken at HZP (45%),-40%,-90%
and100% of full power are presented in Table 5.1.
N Measured values of F and FQ, including appropriate
measurement uncertainty and engineering factors* and
quadrant tilt for all four cases were within Technical
Specification limits.
* * N (4 %measurement uncertainty for ,5% measurement uncertainty and 3% engineering factor for FQJ1.
22

Relative assembly power distributions derived for four
incore full-core flux maps taken at HZP ( -5%),Ei40%,
,90% and-100% of full power, are given in Figures 5-1
through 5-4, respectively. Maps taken at HZP ((5%),
"90% and-100% of full power met the acceptance criteria
(measured relative assembly power Pi + 10% of design
value for Pi) 0.9 and + 15% for Pi< 0.9). However,
measured power distribution of four assemblies (P-12,
P-II, N-11 and D-14) for the additional map taken at
N 40% power differed from the design value by 10.4, 11.0, 11.0 and
10.2% (and from the acceptance criteria by 0.4, 1.0, 1.0
and 0.2% ), respectively. All the other assemblies'power
distribution were within the test acceptance criteria.
This additional map (not part of the startup physics test
program) was taken immediately after the attainment of 40%
of full power when the xenon equilibrium condition had not
been established. Also, during the period when this map
was being taken, a 120F change in RC temperature (Tavg)
occurred. In the light of the above uncertainties the
deviation of the measured power distributions from the
acceptance value, for four assemblies, was found acceptable.
As previously mentioned the hot channel factors and the
quadrant tilt were within the Technical Specification limits
(Reference 2) for this map. In addition to the four full core
maps discussed above additional full core and quarter-core maps
were taken atN9o% of full power during the Excore/Incore
..calibration test. Results of this test are presented in section
6.
5.2 Power Coefficient
The "differential" power coefficient, ( ) at
a specific power level, Q, is defined as the
change in reactivity, ( ), per percent change in
reactor power, Q, at that power level.
Measurement of the power coefficient involved:
(a) Determination of reactivity compensation
by control bank movement during the increase and the decrease
of reactor power. This was obtained from the output
of the reactivity computer.
(b) Determination of reactor power level changes from
the recording of primary coolant X T across the 3actor
vessel and secondary plant calorimetric data
steam pressure, feedwater temperatures, and feedwater
flow rates. Steam pressure was obtained directly
from the local gauges. Feedwater temperatures
were obtained from a precision thermometer
installed at the feedwater header, and the feedwater
flow from manometers installed across the feedwater
line venturi elements.
In addition to the above data, the analysis of power
coefficient measurements included corrections due
to xenon changes caused by power level variations,
moderator temperature changes during the test, and
reactor coolant boron concentration changes.

Power Coefficient is given by ) +< ('s + ('
where
= reactivity Compensation due to Control Rod CA reactivity change due to Xenon Change
C&O = reactivity change due to Boron Change
Reactivity change due to Moderator Temperature
Change
( ) = Change in Reactor Power
Table 5.2 gives the measured Dower coefficients
from data taken during power decrease froms'90% to
N50% and increase from50% toN70%, and the design
power coefficients (Reference 3). The measured
values are within the acceptance criteria of '
+ 2 pcm/%Q. A least square fit of measured power
coefficient data versus reactor power was undertaken
to generate coefficients of a polynomial fit. Total
power defect from zero to 100% power conditions,
calculated using the results of polynomial coefficients,
is equal to 865 pcm compared to the design value of
980 pcm.

5.3 Reactor Coolant Flow Determination
Based on elbow tap differential pressure measurements,
the total Reactor Coolant Flow Rate was verified
to be greater than the- design value (358,800 gpm),
provided in the Indian Point Unit No. 2 Technical
Specification. Table 5.3 provides the power levels
and the measured coolant flow rate as a percentage
of design reactor coolant flow rate. These results
demonstrate compliance with Technical Specification
criteria on Reactor Coolant System Total Flow Rate.
Also, individual loop flow rates were found to be
above the respective loop design flow rate.

Table 5.1
Summary of Results of INCORE Analysis, IF2 Cycle 3 Startup Maps
Full - core Map 1
Approximate Power (%) HZP (45%)
Run Number 3FCIR6
Axial Offset (%) 26.867
Quadrant Tilt% 1.64 N Measured Peak F H 1.463
Measured Peak FH Location H11DF
Peak F 2.340 Q Peak F Location N13JL
Max % Diff. of Assembly 4H 9.2 between measured and predicted
Core Location of Max. D-14 Assembly F N
I H
2
40
3FC2R7
22.460
1.52
1.468
N13JL
2.233
N13JL
11.7
B-13
3
90
3FC3R3
4.424
1.05
1.427
N13JL
1.905
N13JL
8.0
B-13
4
100
3FC6R2
3.591
0.81
1.4 26
HIDF
1.873
N13JL
7.5
B-3

Average Power
70.2
56.4
TABLE 5.2
Power Coefficient £4P/AQ) , (1) (2)
Measured Design xpcm/qQ) (pcm/%/Q)
-7t,3 -9.3
-9.3 -9.7
(1) -(2) Difference
(pcm/AQ)
2.0
0.4
*Average power over the test power range
S

Table S. 3
Total Measured Reactor Coolant Flow Rate
(Measured PC Flow Rate X 100)
% Reactor Power Design RC Flow Rate
0 .106.4
35 106.0
51 106.2
61 105.8
72 105.8
80 105.7
90 105.7 Avg. 105.9

I V2 CY-3, 3i.'2 16,;5.-.:5-..2,( ,'O, IA.';r r!.c.A J.r :r. ' * L ,', (-18,8 Fi~'Q 1('.
,.7.L .Z ) AVr,,V., AXI ;, c./E MFigureC5.1E COW YP-..ycle3,')./HZ
.. . .. . .. . .. . .. . X. Y'. .. . . . . . . . . .I. . . . . . . T .. . . . . . . ( .. . .. .. .
READY ? FA/'-EA:NUE9AD PERCENT. DIF OF FD1;!/ C;IATC8!(S) FOR :/A'EASNRED MID PECEIT. DItn OF !FDi'I/ 'q!7 :)Y ? SS:/EA,3U3ED AD IF'RC ;T. DIFF. OF FD111/ .' DY ? P;2rU
!1UASUTh !21D PERCMIT. DIFF. OF FlYIN !P2 CY-3, 3FC!16,5-26-7-,!IZP, APO, LAST 1 1
6. 'I,
3.9.
1.7.
1•285. 1.6.
3. 1.6.
1.1.
1. l7 r C- .
1. C5
.71f
-972 3.6
1J1i
.
1. (-V> 2 .2
1.3 I -!.
1.2r
2.
2.
1. (36
-1
'.
5.3.
_2.£i.
1.2.
1r.2
1.2.
1. 12.
27.
7.3.
P
.671.
L * 6.'.
. 3.2.
J . 1.6.
" .7(1. * 1.7.
E 5.2.
% 637. .;3............ * 1.C. -. 5. -2.2. -2.2. -.2.
. .. .- . .. .2 -. .. * 132. "7,. 1.2Cr. .703 "C11.
1.C. -. (. -2.2. -2.?. -1.3.
9 .- 9 - . . - . . .- .3. -. .. 3.-. 1 . .915. 1.05. 9 6 .
-2.2. . -.!.2.. . - 2.
... .I . .... .. . ..
. 1 . 1. 13. 1.7 . 2 1.13
3. -1. .69.- -. 2. -2 .
2. 1.17. .17;. 1.17. 1.3. 1.162,
2. 2.1. 3.C. 2.2. 1-4.. 1.?.
7 .. .- . .. -2 . . -. 8. -. ..
7. 1.313. 1 2. .F6. .675. .1. 3 .. 2.--. 1.7. 1.1. 2.2,.
r .* .
5 7 .9 1, 2. 1~lr*
3. 1.3. -1.L. -. 6. -.9. -.j.
7. -2.5. -3.4. -2.(. -1.7. -1.1.
. .6..6 .. .:5 .8 1 ,9. . . . .
1. 1. 17 . 1. 1 :I. 1. ( ". 1. 1C. 7. -2.5. -3.3. -2.9. -3.4I. -3.r3.
7. .5.. .3.. -.. -. . -... ..
7. . . .. . . 1. . .79. .7.
0 .03 .3115. .861. .695. .824.
.1.
-1.7.
1. 1 35. -2.8.
.3. -* .¢.
1.112.
1.7.
-. 0.
-2.1I.
1. 1 j6. -4.3.
*.378.
-1.6.
.-35.
Figure 5.1 IP-2 Cycle 3, BOL, HZP <, Condition Power Map
TRACE J-ICt DEL. & CORR rDQ 'WCK
1.(22.
1.9.
-1.2.
1.12..
39: -1 .6.
1. 13 9. -2.6.
2.2
1.13:
.6.
rr. -3.7.
1.16,. -3.7.
"'.8. -4.II
-. '74.
.947., .9.
.966
1.2.
1. L7I'
-2.. -. 8.
1.9.
-1.7.
1.6.
.2.
I.t]
. 9).
-1 .7.
!,C '8. -2.8.
-. 91.
.91 3. -3.'!.
.759. .597.
-5I. . -5.3.
3.1.
3.1.
.95. 3.6.
-1.7.
-2 .7.
.2.
1.3.
;. I12.
-2.9'.
-2..•
'IIAS
0. . . . . . . . . . . .
.7(6G.
. C,.
7.6.
.9.
2.1.
-1.7.
• 1
-. 8.
- . C..
.620. -1.7.
1.1.
2.7.
.7.
.7.
".'C;5
.7.
dl: I .. I.- .. .- - -I.-,.,, + j.

.661, 4.1.
.854. 5.4.
4 +
.905. 6.7.
.747. 6,6.
.894. 5*4*
.843. 4.0.
.680. 7.2. 7,2.
.721. 9.5.
.980. 5.6. 56,#
1*118. 1.6.
.900. 3.4.
1.280. 6.7.
.867. 6.6.
1.264. 5,3,
.904. 3*.
1.180, 7.2.
1.022* 10.2.
.730. 10.9.
4
I
1
1
4
1
.721. 1.024. 9.5, 10.4.
.229. 1.048. 9.5. 9.7,
.013. 1.125. 6.0. 4.4.
.864. 1.176. -1.8. -1.9.
# f * 4 4
.935. 1+188. .9. -2.0. * * f4 4
*.959. 1.211. 2.1. 1.1.
4 # f 4 *
.137. 1.052. 1,2. ,5.
.938+ 1,198. -.1. .0.
* . * 0 +
.927. 1+159. *1. -4.3.
.918. 1.180+ 4.3. -1.5.
* +4 4 *
.997. 1.061. 4,3. -1.5.
.199* 1,003. 6.9. 4.9,
- • • 4 • .
.735. 1.025. 11.7. 10.5.
• • •
.7044 11.0.
4 4 #
1.222. 11.0.
.977. 11.0.
1*123. -6.3,
.995, -4.6.
# 4 #
1*108. -4.6.
1,208, -*8#
1.262, -.9,
1.223. #,5
1.111* -4.3.
1*002. -4.0.
1,150. -4.0.
.845. -4.0.
1.201. 9.10
.862, 6*5.
.925. 6.2.
.941. 1.6.
1135. -6.3*
1.088. -6.3.
0 4 *
,914. -5.6.
1,174. -*2* -. 2•
1.122. -2*2* 0 . 4 4
1.163. -1.1.
.910. -6.0.
10096. -5.6.
1.142. -5.7*
.866. -6.5.
.926. 6.4.
• 877. 3.3,
1.237. 3.1
.955. 1*6.
1.150, -4.0.
1.169. -4.0.
1.125, -4.4,
.993. -4,9.
.837. -5,7.
.976. -6.6.
1,107. -5.9*
1•131. -7.0.
1.106. -7.6.
.887, -5.6
# #
1.230. 2.5,
# 0. #
2+ .872. 3. 7.6.
.688. 8.4.
.725. 3,4,
.840. 3.3,
1.'094. -2.6.
1*002. -4,3,
1.222. -4.0*
1.100. =4,1.
.840. -5.4,
.662. -6.1.
.842. -5*2.
1089. -5.00
1.195s -6.2.
.968. -7.5,
1,066. -5*2.
.813. -00
. # f 4
.692. .861# .871. .718. .859. .819. .642.
9*1. 6.4* 2.6. 2.5# 1,3. 101. 1.1.
'P4A,. 5.±2 P -2 CyCle *3,9Lfw4% Pow-er M a
1
4
1
1
4
4
I
I
,90 6•
.21 1
-6*
L.12
-5
*1 -5 t,.1
-4
-3
.0 1 -2
11
-3
1.1 -6
10 -8
.9 -3
1il
.2. .860. 1.129. .985.
.0. -1.1. 2.6. 6.3.
# # . # # 4 # # ,
2. .849. .886. 1.011. 3. -8.4. .7. 5.8.
0 4 * 4 # f * 4
25# 1#112o 1#160. I.III,* 41. -8.2. -3.2. 3.1.
19. 1.072# .956. 1.235. .6# -7.7. -8.4# 3.1.
15. .898. 1#064. 1,231. .3# -7.2. -8.4. 1,6* . * 4 # ,# * 4 0 # #
P8. 1.128. 1.176. 1.155. .4. -4.1. -3.4, -3.6.
62. 1#124. 1.254. 1.013. .0. -2.0. -1.5, -3.2. # .0 0 • 0 .0 0 # 0 #
23. 1.164. 1.197. 1.166. .i. -1.1. -1.6. -2.6.
30# .943# 1.128. 1#186. .9. -2.6* -2.8. -2*1 f # 0 . * # # . # 4 *
38. 1.134. 1+018. 1.191. .5. -2.4, -2.5. -. 7,
97. 1.164. 1,169, 1.065, .4. -3.9. -2.5. -1.2.
, , 4 4 * , 4 , , f #
05. .906. .873, .965. #6# -2*2* -. 8# 1#0#
89. #852# 1.093. #943, .9. -2.2. -97# 1.7.
o706. 7.2.
. . 4
1,202. 7.2.
1.016. 6.3.
.894. 1.6.
*941# 1.5.
.922. -1.9.
1.084. -3.5,
.913. -2.8.
.913. -1.5+
.874.
-.7,
,957. .1.
1.154. 2.9.
0 4 ,
,695* 5.6.
0 0 #
.721. 9.6.
. e.
1.017. 9.6.
1,116* 1.4.
0916. 5.3.
1.232. 2.7.
.834. 2.6.
1.215. 1.2.
.903. 3.7.
1.129, 2.6.
4 * 4
.928.
.677, 2,9,
.643.
1.4. 1•4,
57
.875, 3.1.
# 0
.724. 3,3,
.874. 2.9. ,
(".)
.884. 9.1.
,692. 9.1.
4
MEAS #
DIFF .
.9: ... ,--'•

* ... !EASUREP ¢,N! P;E.NT. DI0FF' 0IF F'iFN 11::2 2Y3,.3FC3R3,91.*1% rOWU.R, B'ANIK=2!'7v CLO R P'L(1 B:ECN
R 1 1i
c''
S. . .836.
KS • 3.5. . 0 .
. .866. * 2.1.
• .715• H * 2.2.
.873. 0.• 3.0.
F * 3.3. . . &..
.6L2. E • 4.5.
C
B
.701. C.5.
.965.
4.1.
1 .118.
1.7.
.3, 1.7.
1.224. 2.1.
8.30. 2.1.
1.235. 3.0.
.895. 3.1.
1,149.
4.5.
.702. 6.7.
.700. 6.4.
1.194. 6.4.
990. 3.6.
.921.
.941.
1.127. .3.
.951. 1.2.
.938. 1.3.
.896. 1.9.
.964. .9.
1.160. 3.3.
".711. 8.0.
.990 6.8
1.009
• •'C
1 . 099 1.9
-1.7
1.192
,207
1 . 058
1.20
1.19
-3. 115. -3..
1~ *
.97 2.
.99 7.
. .04.
. . • 0.
).1.187.
91 00 . .5 .
. 850.
. 1.146. . 4•4.
1.013.
1.136. .. --2.3.
.1.
S. 1.21.
2 .-. 2. 3.•1.201. 6+ . .
3. 1 .230.
8. 1.0.
3. 1.149. 2. -1.2.
&.. 1.009. 6. -3.4.
9•. 1.159. 6. -3.4.
5. .850. 0. -3.3.
3. 1.167. i• 4.2.
.247. 4.7.
.907. 4.*
.938. 1.3.
1.159. -4.4.
. * 1.o
-4.4.
.943. -2.7.
1.18g. .9.
1 *152. .3.
1.139. .9.
.939. -3.1.
1.1i6. -4.0.
1.164. -3.9.
.097. -3..
.907. 4.5.
2.1.
2.0. . . V -.
.952.
1.163. -3.0.
1.153. -2.1.
1.031. -1 .3.
.877. -1.3.
1.022. - . ,.
1.141.
-3.8.
1.152. -3.8.
.926. -1.4.
1 230. 2.6.
.715.
.2.
.c30. ,
2.1.
I.iio
.86B. 1.114.
-. 5
1.021.
-. 4..
1.101.
-1.9.
870. -2.1.
.690. -1.9.
.868. -2. 3.
1 *114.
-3.0.
1.•230. -3.5.
1.001. -4.4.
1. 101. -2.0.
".914"
-4.4. • *. .4•
-2.4.
1.027.
-1.8.
-1.1.
-1.6.
1 " "
-3.0.
1.147. -4.*3.
919.
-2.3.
1.7.
-1.7.
• • @ • • e .- . .# ,
.840. 3. 9.
.062.
.7.
-4.5.
1 *158.
-4.4.
1.*120. -3.6.
.9.30. -3.2.
1.*157. -1.8.
1.164. -1.2.
-1.2.
.947. -2.3.
.136. - 3.
1.170. -3.5.
.897. -3.1.
.40. -3.2.
4.2.
1.110.
. , ,
.Ji79.
1.*172.
-23. 1.*00,5k
1 *120.
-3.7. * . .
1 . 209. -. 7.
1.2 1:
1.213t -. 4.
1 • 135.• -2.3.
1 * 026. -1.8.
1.177. -1.8.6
-2.1.
.952. 2.6.
2.4.
1 .0 036 .7.
1 .207. .7.
1.193. -1.5,
1.205.
.6.
1 .040. -. 7.
1.180. -1.5,
1.180. -2.6.
1.*174.
-2.1.
1.061.
.967. 1.2.
1.076. .952. -2.2. 2.7.
.615. 4.1.
I • 168, 4.1.
.994. 4.0.
866. -1.6.
.910. -1.7.
•930.•
.6.
934, -. 6.
.900. -2,*8.
.061. -2.1.
.943. -1.3.
1,154. 2.8.
.704. 7.0.
. , . . 4 .. .. *.-- 4--*~-~* * ~
.673. .845. .870. .71. .047. .789. .613.
6.2. 4.5. 2.6. 2.6. -. 0. -2.4. -2.4.
IP2 CY3,3FC3R3,91.1% POWERD BANK=217PC O RR PDO DECKS
Figure 5-3 IP-2 Cycle 3, BOL,f900/fWer Map
.706. 7.3.
.996, 7.4.
-1.8.
.879. 1.3.
1.215. 1.13.
.834. 2.7.
1.207.
.7.
.875. .8.
.100. .1.
.915. -1.3.
.677. 2.8.
.622. -1.3.
1.7.
.861.
7.6.
.720.
2.9.
.869.
.644. 4.4.
.461. 4.4.
. MEAS .....
DIFF.

**VALIDITY STATUS - I MEANS SYMMETRIC THIMBLE TEST FAILED
IMLASURFD AND PERCENT. DIFF. OF FDIIN IP2 CYCLE 3, 3FCbR2, 6-8-78, POWER-100%, D BANK-210, NV.4 PDQ CONSTANTS R 1 1
P
L• 6.0.
.825. V, 3.0.
.850. J. .8.
.704.
H. 1.0.
3.0.
.834. F * 4.6.
.654. E• 3.8.
C
.699. 6.0.
•913.
3.9.
1.6.
.865.
1-201• -8.
.817. .9.
1.229. 3.1.
.869. 3.7.
1.136. 3.8.
.957. 3.2.
.687. 4.1.
.b98. 5.9.
1.1;1: 5.9.
.986.
W34. -1.8.
.913: -1.2.
.935.
1.115. -. 7.
.953. 1.5.
.940. 1.6.
•.892.•
1.4.
.955. -.2.
1.143. 1.6.
.694. 5.2.
.96I • 5.8.
1.009• 5.4.
1.096. 1.4.
1'.1DL•
-1.7.
1.196, -1.6.
1.208. .5.
1.053. .2.
1.203. .1.
1.199.
-1.3.
1.159. -3.6.
1.042. -3.6.
•.964.•
.7.
.979. 5.6.
.6b8.
6.1.
1.162.
6.1.
•934.
6.1.
1.159.
I .uL:)
-2.2.
1.149.
1.226. .2.
1.281.
.1.
1.*226.
32.
1.152. -1.3.
1.013•
-3.4.
1.0: -3.4.
.850.
-3.3.
1.161. 6.1.
3.2.
•.882,
3.0.
.925.•
-1.
1.172.
1.125. -3.6.
.954. -2.1.
1.189. .5.
1.158. .4.
1.193. .8.
.948. -2.6.
1.119. -4.2.
I. 166. -4. 1.
.896. -3.1.
.t95. 4.5.
1.7.
1.211.
1.6.
.939. .1•
1. 165.
-. I.
1.186. -3.1.
1.169.
-1.3.
.6.
•.893.•
-3.
1.046. -. 2.
1.161. -1.9.
1.192•
-2.5.
1.165. -3.0.
.932. -.7.
1.218. 2.2.
.71U. 1.9.
.824. 1.7.
1.116: -. 7.
1.030.
1.2;4 -2.1.
1.145: -. 7.
.893.
.3.
.698. .0.
.882. -.9.
1.131. -1.9.
1.252• -2.2.
1.023. -2.7.
1.118. -.5.
.815. .7
3.3.
1.197. .4.
.907. -3.4.
1.166.
1.196.
-2.2.
1.169.
-1.2.
1.043: -.6.
.891. .1.
1.039. -.9.
1.167. -1.4.
1. 209.
-1.2.
1.182. -1.6.
.929. -1.0.
1.179. -11
.827. 3.2.
.846. -1.3.
.891. -3.6.
1.114. -3.4.
1.143. -2.1.
-2.0.
168. -1-3.
1.141.
1.166. -1.5.
.952. -2.2.
1•141.
-2.2.
1.188. -2.2.
•904. -2.2.
.- 36. -2.5.
.649.
3.1.
1.096.
-1 .. -•
-I•U•
1.020. -2.7.
1.16: -2.7.
1.2 21. -.2.
1.280. -.0.
1.221. -. 2.
1.142. -2.2.
i1.028. -1 .9.
1.179. -2-0.
.862.
-2.0.
1.071. -2.1.
.939. 1.3.
.967. 1.1.
:.U/b:
1. 197. -. 4.
1.199.
-1.4.
1.227. 2.1.
1.052. .2.
1.189. -1 *1
1.182. -2.7.
1.i69. -2.7.
1.058. -2.1.
.967.
.9542.9.
.678. 2.8.
1.156. 2.8.
.964.
.8(). -1.5.
.910.
-1.6.
.948. -9.
1.148. Z.2.
.941. .3.
.893. -3.3.
.856. -2.7.
.936. -2.2.
1 • 154. 2.6.
.709. 7.5.
.699.
6.1.
b.L.
1.076. -1.7.
.860. .3.
1.207. 1.2.
.832. 2.7.
1.199.
.853.
1.085. -. 9.
.907. -2.2.
.677. 2.6.
.6(68. .837. .801. . 7 12 . .839o .782. .615.
6.1. 4.5. 2.2. 2.2. -.4. -2.4. -2.3.
.6 18. -1.8.
.807. .7.
.854. 1.3.
.716. 2.7.
.663. 2.5.
.824. 2.8.
.647. 2.7.
• EAS .
DIFF .
IP2 CYCLE 3. 3FC6112, 6-8-78, tOWER-100Z, 0 BANK-210, NEW PDQ CONSTANTS
LATED POWER TILTS (NORMALIZED TO 1.000)
Figure 5-4 IP-2 Cycle, BOL,#wlQ/o Power Map
* N

6. Reactor Instrumentation Calibration
The calibration of excore Dower ranae detectors, reactor
coolant looD resistance temperature detectors (RTD's) and
incore thermocouples are presented in this section.
6.1 Excore Detector Calibration
An excore detector calibration using movable incore
detectors was performed atv90% of full power. A range
of axial offsets were obtained by an axial xenon oscillation
induced by rod insertion and subsequent withdrawal following
fnon buildup in the upper portion of the core. Full
core maps were taken at the equilibrium conditions prior
to the onset of the oscillation and also at its maxima
and minima. Quarter core (partial) maps were also taken
at various axial offsets between the full core maps.
The full power total excore detector currents were
* extrapolated from the currents obtained at reduced power
levels. For each map, top and bottom detector currents
for each detector were normalized to the extrapolated
full power current. Plots of detector current versus
the axial offset calculated by the INCORE 2 code are
given in Figures 6.1 through 6.4. A linear least
square fit using the axial offset data was performed.
The results of least square fit for top and bottom detector
current vs axial offset were used to calibrate the Delta
Flux (A I) Meters and Overpower Delta T and Overtemperature
Delta T setpoints.
6.2 Incore T/C and Wide Range RTD Calibration.
During the Reactor Coolant System heatup electrical
resistance of RTDs (including spares), along with their

lead wire resistance, core exist thermocouple outputs
and wide range RTD amplifier outputs were monitored at
approximately 50°F intervals above 3000 F. RTD resistances.
were converted into temperature using factory supplied
calibration tables and plotted against the time. The
RTDs with maximum correction factors less than +0.5OF
were selected for use in the protection and process
circuits. Table 6.1 shows the deviation of such RTDs
from the average temperature for data taken over 300OF
to 5470 F temperature range. Incore thermocouples provide a
continuous on-line monitoring of assembly power distribution
of 65 assemblies which are about evenly distributed
throughout the core. This requires calibration of incore
thermocouples and wide range resistance temperature
detectors (RTDs). Thermocouple (PRODAC and Honeywell) and
wide range RTD correction factors were obtained by
comparing their temperature readings with the narrow
range RTD readings taken during the heatup of the
primary system.
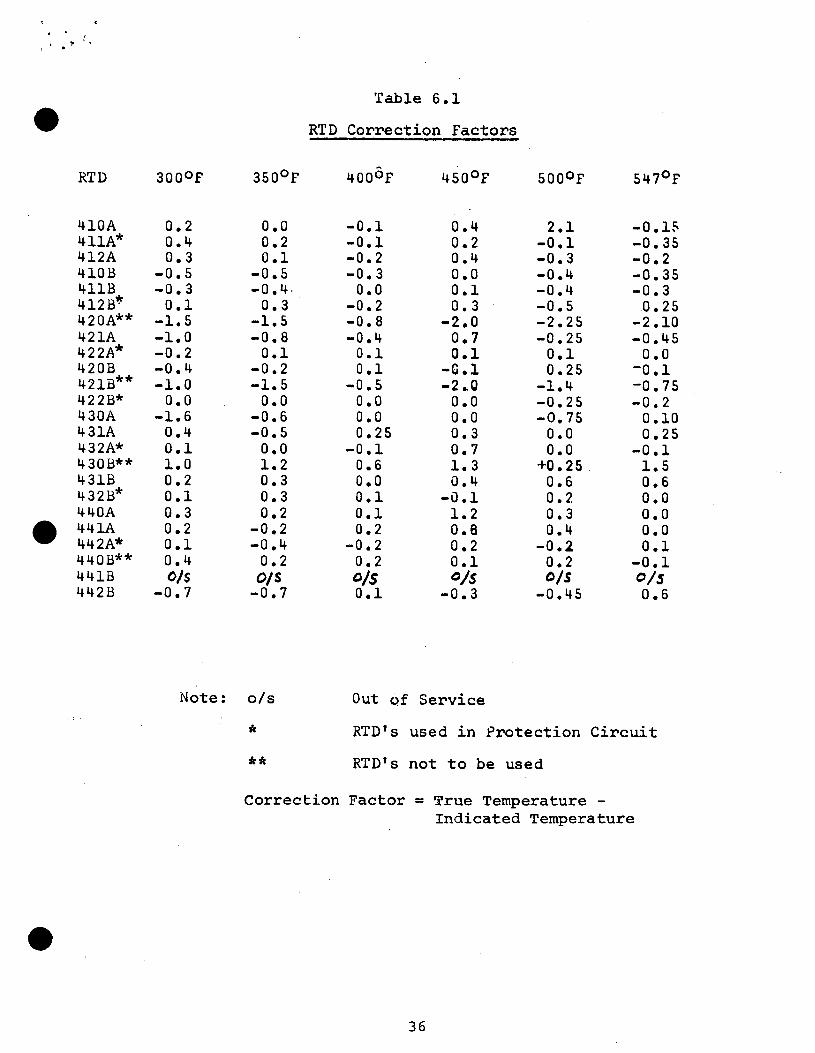
Table 6.1
RTD Correction Factors
RTD 300OF 350°F 400OF 450OF 500OF 547 0 F
410A 0.2 0.0 -0.1 0.4 2.1 -0.15 411A* 0.4 0.2 -0.1 0.2 -0.1 -0.35 412A 0.3 0.1 -0.2 0.4 -0.3 -0.2 410B -0.5 -0.5 -0.3 0.0 -0.4 -0.35 411B -0.3 -0.4. 0.0 0.1 -0.4 -0.3 412B* 0.1 0.3 -0.2 0.3 -0.5 0.25 420A** -1.5 -1.5 -0.8 -2.0 -2.25 -2.10 421A -1.0 -0.8 -0.4 0.7 -0.25 -0.45 422A* -0.2 0.1 0.1 0.1 0.1 0.0 420B -0.4 -0.2 0.1 -0.1 0.25 -0.1 421B** -1.0 -1.5 -0.5 -2.0 -1.4 -0.75 422B* 0.0 0.0 0.0 0.0 -0.25 -0.2 430A -1.6 -0.6 0.0 0.0 -0.75 0.10 431A 0.4 -0.5 0.25 0.3 0.0 0.25 432A* 0.1 0.0 -0.1 0.7 0.0 -0.1 430B** 1.0 1.2 0.6 1.3 +0.25, 1.5 431B 0.2 0.3 0.0 0.4 0.6 0.6 432B* 0.1 0.3 0.1 -0.1 0.2 0.0 440A 0.3 0.2 0.1 1.2 0.3 0.0 441A 0.2 -0.2 0.2 0.8 0.4 0.0 442A* 0.1 -0.4 -0.2 0.2 -0.2 0.1 440B** 0.4 0.2 0.2 0.1 0.2 -0.1 441B 0/s O/S s 0/S 0/,5 442B -0.7 -0.7 0.1 -0.3 -0.45 0.6
Note: o/s Out of Service
*RTD's used in Protection Circuit
** RTD's not to be used
Correction Factor = True Temperature Indicated Temperature

. -0 I
- I
~2~T4 ~ L iifT * O
-. 77I
17
I L"V
I t 7
4 4 FTI
T i I
-r' T
I I
4 L~L
~~2J LLV- -. I
4 r
7~
________F Figure 1 -7- 771 777-W
.1~Q~ I'I
78tetir xo____ Currn-t P~i offset
- - - -- IChannel: N 14
L ~- Data taken: i-/'3 1/78-61~
I~~~ -: +.-~~
-Ki 3-3 O- §L7) (2;6 07)~ AO 0
--- -- -. -FI - -t V V - -L 7_
-I ~ r I* I*_
W, 7
7 7. I
-'4--K~4 '0 1~ -F T
Botto c6nt: o To
L
7
+
J., i
17
L
+i
H-t -i r 4- m
4- I
Li14W

:1Dotector *oe WL236 86; --Serij-4 -1-2 0401--Mate, placed An. service:
[ t
4V
FrEd
t 7 7 -T.
3/13
38C
330
Figure 2 I -OW -2-237
r/ i Excore Detector Current Vs--Axial -off set
- - ~ . Channel 4 42.
Data'taken 5/31/78 -. 6/1,148
Top: I=331.86. + (.1 ..
Ho 0t to m-: 1 (371-.14) -k2.14) X-O.
A
-- .L~ 1a1~fs~t(%K 2-
...... ..a !7
_ _4 _ +~~~ + _I
__al Offs.:'

Det~odtor. 4e1 # WL23686
-flte, p C ns .laced. iservi*c: 8/7/7
4*a
q I-
U.
0 .1 1 '0j
3SO
- -Boo
Figure 3
'I0NF22398.
FIG. C 3 Excore Detector Current Vs-Ail.of~
dia 'Ne M4-3
Top:I=329.:64; +I (2.17)W.O:
Bottom: 1'= 364.36 -(2. 17) A-O0
flata~~S ae 5 /78 -617
. 0
I --
-I-
~ -j~
I~-l
Da T7
A~id4 0 ffset iY -,*1

r F;
r 71
*1 4. I I
I I Ip
I .. .
TIt
-7-
.- F .. .- .....
ILLI
Figure 4
_Hi~A xco retq or 13ur6nt.._ .Axla1 -o
Clannel
W7. 777:~o'
-- ---
I L
71
__ I Bqttomj
W~-i 4-1
Li I IT . I 4
7i j
II - ~ Aia~ ffse (, 4 rV77-I7
___ __ 77 A ii, 4
_ _i t .

7. References
1. Docket No. 50-247 Final Facility Description and Safety Analysis Report, Consolidated Edison company of New York Inc., Indian Point Nuclear Generating Unit No. 2.
2. Docket No. 50-247 Technical Specifications as amended through Amendment No. 40 to Facility Operating License No. DPR-26 (Appendix A), COnsolidated Edison Company of New York, Inc., Indian Point Nuclear Generating Unit No. 2
3. Private Communication from Westinghouse via P. A. Loftus, J. J. Sommerville, D. N. Deardorff and R. D. Jordan (August 1978)
4. Private Communication from Westinghouse via A. J. Harris et al., (July, 1972).