Embed Size (px)
Citation preview

INDIAN PHARMACEUTICAL MARKET IN A NEW PARADIGM
Tapan Ray Director General
Organisation of Pharmaceutical Producers of India
Presentation to the Quebec Medec Delegation January 31, 2011 - Mumbai

India Today
Pharmaceutical Industry – a snapshot
Policy and Regulatory Framework
Key Growth Drivers
Issues and Concerns
Content

India Today

28 Years of High Growth
1.0
3.5
8.9
Average Annual GDP Growth
0
2
4
6
8
10
1900-19500 1950-1980 1980-2002 2002-2007
(%)

Source: Census of India (2001)
17
52
65
80
0
20
40
60
80
100
1950 1990 2000 2010 (proj.)
(%)
Literacy is Rising

Source: Monitoring the World Economy, 1990-2000:Census of India (2001)
1.0
2.2 2.1
1.8
1.5
0
0.5
1.0
1.5
2.0
2.5
1901-1950 1951-1980 1981-1990 1991-2000 2001-2010
(%)
Population Growth is Slowing Down

Source: The Consuming Class, National Council of Applied Economic Research, 2002
65
220
368 8% 22% 32%
0
100
200
300
400
1980 2000 2010
(Mn)
Middle Class : Growing

India growing by 6% + despite the current global recession
Indian growth story is still intact
Deloitte : Pharmaceutical Market Entry in India
Emerging Market GDP Growth
India : GDP Growth

Globalization of economy
Dismantling ‘license’ regime
Lowering tariffs / taxes
Breaking public sector monopolies
Indigenous R&D
New IPR Regime
Goods and Services Tax (GST)*
Direct Tax Code (DTC)*
* Yet to be implemented
Key Reforms
Healthcare Environment and Pharmaceutical Industry

YESTERDAY
• Slow rate of growth
• Bureaucratic
• Protected
• Small markets
• Under-developed infrastructure
• No Product Patent
TODAY
• One of the fastest growing world economies
• Less impacted by financial meltdown
• Significant outsourcing opportunities
• Fast growing markets
• Significant investment in infrastructure creation for industry
• Product patent regime / R&D
India is Changing Fast
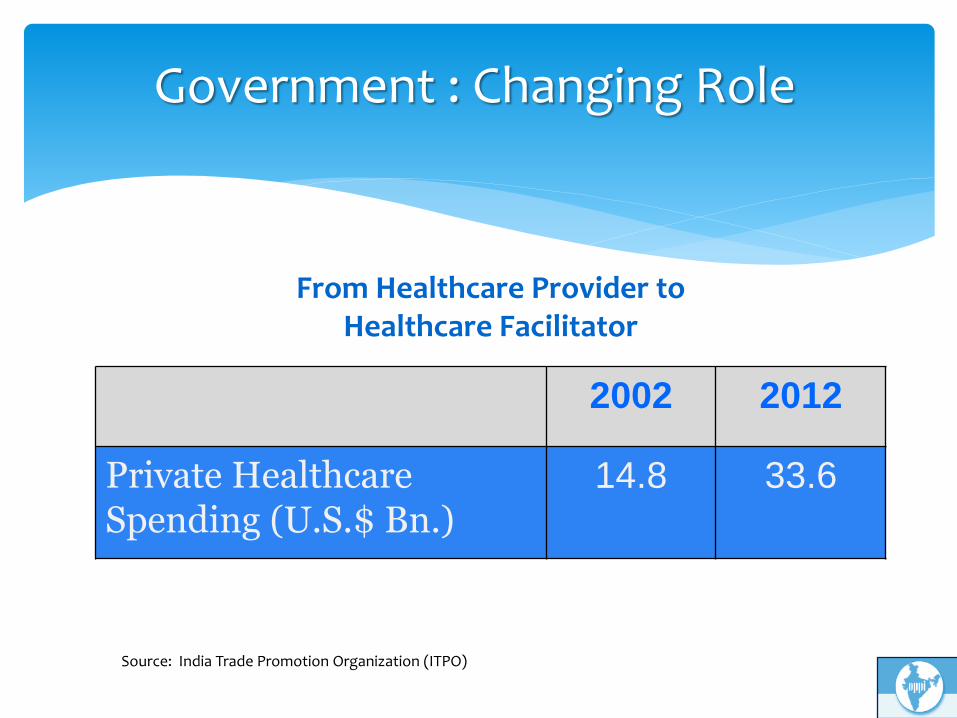
2002 2012
Private Healthcare Spending (U.S.$ Bn.)
14.8 33.6
Source: India Trade Promotion Organization (ITPO)
From Healthcare Provider to Healthcare Facilitator
Government : Changing Role

0
2
4
6
8
10
12
14
16
18
20
0
5000
10000
15000
20000
25000
30000
35000
40000
45000
1993 1994 1995 1996 1997 1998 1999 2000 2001 2002 2003 2004 2004 2005 2006 2007 2009 Dec MAT
Total retail market size: US $ 11.5 Bn; >23,000 companies; >60,000 Brands
Indian Pharmaceutical Industry is doubling every 6 Years

Highly fragmented
Top 50 companies contribute to 85%
Retails Sales (91%) and Institutional Sales (9%)
5.5 Million Pharmacies
Acute therapies (74%) dominate over Chronic Therapies (26%)
Combination Drug Market (62% of new introductions in 2010)
Indian Pharmaceutical Market is Different

Market Size US$ 11.5 Bn.
Source : IMS
OTC 8% Branded
Generics 84%
Key Market Types

Rank Company Sales (US $ Mn.) M.S. % % Growth
Industry 11466 100 17.5
1 Abbott (combined) 708 6.17 13.2
2 Cipla 650 5.67 24
3 Ranbaxy 545 4.75 14.6
4 GSK 539 4.71 13.4
5 Sun Pharma 507 4.43 23.5
6 Zydus Cadila 442 3.86 13.1
7 Alkem 370 3.31 20.9
8 Lupin 373 3.26 24.5
9 Mankind 361 3.15 29.7
10 Pfizer + Wyeth 340 2.97 22.3
Source: AIOCD
Indian Pharmaceutical Market Top 10 Companies

Rank Products TG Company Value ($ Mn) % GR
1 Corex Cough Preparation Pfizer 46.37 24.3
2 Phensedyl Cough Preparation Piramal Healthcare 44.781 10.8
3 Voveran NSAID Novartis 39.29 15.1
4 Augmentin Amoxy+Clav GSK 36.44 33.9
5 Human Mixtard 30/70
Insulin Abbott 36.39 30.9
6 Revital Nutritional Ranbaxy 34.88 42.4
7 Dexorange Haematinic Franco Indian 32.39 25.7
8 Zifi Cephalosporin FDC 32.01 25.1
9 Monocef Cephalosporin Aristo 31.82 29.2
10 Becosule Nutritional Pfizer 31.50 29.3
1 USD = 45.29 INR
Indian Pharmaceutical Market Top 10 Products
Source: IMS

Source: IMS Health, MIDAS MAT Sept 2007; Market Prognosis September 2007, audited markets only
Sh
are
of
Glo
bal
Val
ue
Gro
wth
%
Emerging Markets
CAGR 2007-11
China 13-16%
Korea 8-11%
Brazil 9-12%
Russia 17-20%
Mexico 6-9%
India 11-14%
Turkey 9-12%
Mature Markets
CAGR 2007-11
USA 4-7%
Canada 6-9%
Japan 2-5%
Germany 3-6%
France 2-5%
Italy 3-6%
UK 4-7%
Spain 5-8%
Contribution to Global Growth (US$)
5345 43
15
15 16
11
17 16
0
20
40
60
80
100
2002 2007* 2007-11
North America Top 5 EuropeRest of Western Europe JapanPharmerging RoW
E
Contribution of Emerging Markets will be as much as top 5 Europe by 2011

Policy and Regulatory Framework

Pharma & Biotech Industry
Dept. of Pharmaceuticals DCGI DIPP
Dept. of Science & Technology
Ministry of Finance
Pharma Policy
• NPPA
• Pricing
• Drugs & Cosmetics Act – Drugs & Magic Remedies Act
• Marketing Approval
• Clinical Trials
• IPR
• Patents Act
• FDI
• R&D
• Biotech Policy
• Tax & Duty
• Transfer Pricing
Ministry of Chemicals &
Fertilizers
Ministry of Health & Family Welfare
Ministry of Commerce &
Industry
Ministry of Science &
Technology
Regulatory Structure

Key Growth Catalysts and Trends

Changing Growth Fundamentals
Estimated US$ 69.7 Bn. to be invested by private sector in healthcare infrastructure by 2012
Number of patients visiting Indian hospitals is expected to rise by 30 per cent to 22 Million by 2015
Increasing purchasing potential of the middle class to drive consumption of healthcare services
Public Healthcare Initiatives NRHM, NUHM
Increasing Penetration of Medical Insurance
Source: Espicom

Cost Arbitrage
• Over 8,000 manufacturers drives down costs • Costs of US FDA plants in India are 65 per cent lower than the US and 50 per cent
lower than that in Europe.
Source: Taking Wings, OPPI - Ernst & Young 2009
100
80-85
35-40
0
20
40
60
80
100
120
US Europe India
Co
st
Ind
ex
Percentage overall indexed manufacturing cost (US FDA – approved plants)

Technical Capability
119 USFDA and 84 UK MHRA approved plants. Many plants approved by Canada, Australia, Germany and South Africa.
Source: United Kingdom’s Medicines and Healthcare products Regulatory Agency
119
55
27 25
10 8 5
0
20
40
60
80
100
120
140
India Italy China Spain Taiwan Israel Hungary
US FDA-Approved Plants
US
FD
A –
app
rove
d p
lan
ts

Key Indicators for Attractiveness

Key Indicators for Attractiveness

Key Indicators for Attractiveness

Rural Population 800 900 (million)
350
400
500
150 > 5
1-5
< 1
Per capita Income per day (USD)
250
50
2010 2020
Source : Bird of Gold, MGI & MART Knowledge Centre
Key Indicators for Attractiveness Rural Income
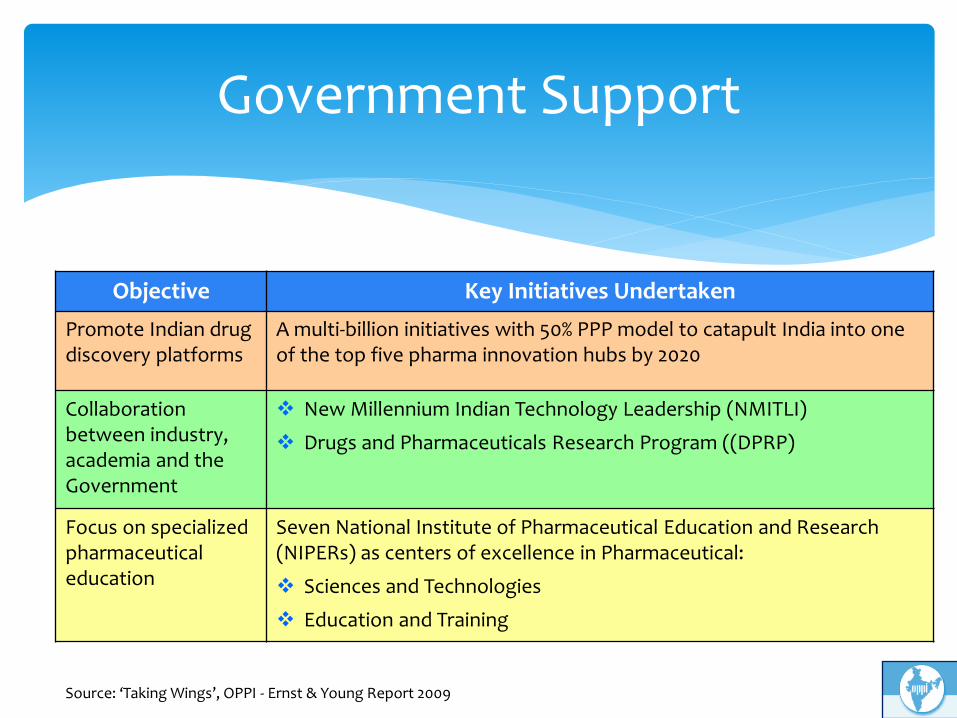
Government Support
Source: ‘Taking Wings’, OPPI - Ernst & Young Report 2009
Objective Key Initiatives Undertaken
Promote Indian drug discovery platforms
A multi-billion initiatives with 50% PPP model to catapult India into one of the top five pharma innovation hubs by 2020
Collaboration between industry, academia and the Government
New Millennium Indian Technology Leadership (NMITLI)
Drugs and Pharmaceuticals Research Program ((DPRP)
Focus on specialized pharmaceutical education
Seven National Institute of Pharmaceutical Education and Research (NIPERs) as centers of excellence in Pharmaceutical:
Sciences and Technologies
Education and Training

Global generics to grow to about US$ 140 billion by 2015. Healthcare reforms, cost-saving initiatives, along with US$ 150 billion worth
of brands going off-patent in next 5 years, would drive this growth.
Sources: “Teva investor presentation,” Investor Relations, Teva Pharmaceuticals Industries website, www.tevapharm.com, as on January 28, 2010
80
140
0
20
40
60
80
100
120
140
160
2008 2015
Global Generic Market
US
$ b
illio
n
Growing Global Demand for Generics

(1) Over 50% of shortages expected from English-speaking countries Note: Pakistan, Bangladesh and Vietnam have not been represented for lack of reliable data on productivity and cost of service employees Source: World Competitiveness Yearbook 2001; Britannica Yearbook; :Literature search; BCG analysis
India Advantage

Company NCE Pipeline Key Therapeutic Area
Biocon Preclinical – 2 Phase II – 2 Phase III – 1
Inflammatory Diseases, Oncology, Diabetes
Piramal Healthcare 13 Compounds in Clinical Trials Oncology, Infectious Diseases, Diabetes, Inflammatory Diseases,
Glenmark Discovery – 4 Preclinical – 5 Phase I – 1 Phase II – 3
Metabolic Disorders, Dermatology, Inflammatory Diseases
Ranbaxy Preclinical – 4-6 Molecules Phase II – 1
Metabolic Diseases, Infectious Diseases, Respiratory Diseases, Oncology
Suven Life Sciences Discovery – 2 Preclinical – 4 Phase I – 1
Neurodegenerative Diseases, Obesity, Diabetes, Inflammatory Diseases
Source: Financial Express., March 23, 2009,
R&D - Indian Pharma Companies

Company NCE Pipeline Key Therapeutic Area
Dr Reddy’s Lab Pre-clinical – 1 Phase II – 2 Phase III – 1
Metabolic Disorders, Cardiac, Oncology
Advinus Pre-clinical – 3 Diabetes, Cardiac, Lipid Disorders
Wockhardt Preclinical – 10 Phase II – 1
Infectious Diseases,
Lupin
Discovery –2 Pre-clinical – 1
Migraine, Psoriasis,T.B.
Sun Pharma Discovery – 2 NDDS – 1
Allergy, Muscle Relaxant,, Inflammatory Diseases, Pain Management
Source: Financial Express, March 23, 2009
contd..
R&D - Indian Pharma Companies

Specialties 2001 2008 Comments
R&D Exp. as a % of sales
1.4% 9.9% 7 times
R&D Exp. in absolute terms (US$ M)
55 660 12 times
Source: Ernst & Young Analysis of top 25 pharmaceutical companies operating in India
contd..
R&D - Indian Pharma Companies

Business Outsourcing Opportunities

Product Market
Significant unmet needs
20 Bn. USD by 2015
One of the Top 10 markets by 2015
Top 3 in growth opportunity
Service Provider
Resources
Competence
Cost Arbitrage
Experience
Young population
Growing economy
Pharmaceutical expertise
Democratic set up
IP Protection
Source: McKinsey / BCG
Twin Opportunity

Pharmaceutical manufacturing outsourcing market is valued at US$ 1.1 billion in 2008, and growing at thrice the global market rate.
India’s share of the outsourcing market is to grow from 2.8% in 2007 to 5.5% in 2010.
APIs/intermediate outsourcing is 64% of total outsourcing
Source: Taking Wings, OPPI - Ernst & Young Research 2009 , P: Projected
0.8
1.1
1.6
2.3
0
0.5
1
1.5
2
2.5
2007 2008 2009 2010P
Indian Custom Manufacturing Outsourcing Market
US
$ b
illi
on
Contract Manufacturing

United States49
India 31
Europe 9
Canada6
Israel5
(In %)
Source: US FDA, CRISIL Research Pharmaceuticals Annual Review, Page A-16 , Mar 2010 Issue
Country-wise ANDA Approvals 2008 & 2009

227280 298
404
517
689 706762 745
547
33 52 63124
193274 306
340 359
272
0
100
200
300
400
500
600
700
800
900
2000 2001 2002 2003 2004 2005 2006 2007 2008 2009 (till
Oct.)Total DMF filing with US FDA DMF filing from India
Source: US FDA, CRISIL Research Pharmaceuticals Annual Review, Page A-26, March 2010
DMF Filing (Global v/s. India)

Clinical trials market in India, currently valued at about US$ 250–275 million, is expected to grow at a CAGR of 30 per cent over the next few years, at nearly double the global average.
Sources: The glorious metamorphosis, Ernst & Young Research 2009
95124
161211
275
360
468
608
0
100
200
300
400
500
600
700
2004 2005 2006 2007 2008 2009 2010 2011
Market Size Forecast for Indian Clinical Research Market
Clinical Research
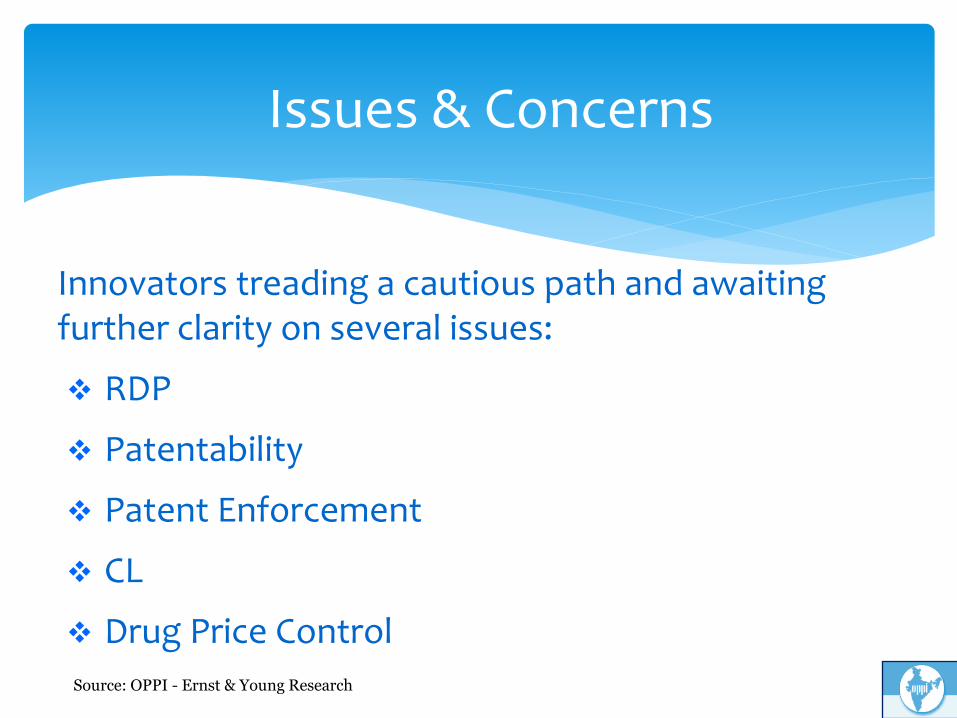
Innovators treading a cautious path and awaiting further clarity on several issues:
RDP
Patentability
Patent Enforcement
CL
Drug Price Control
Source: OPPI - Ernst & Young Research
Issues & Concerns

India to be in Top 10…