Embed Size (px)
Citation preview

Copyright © 2017
All contents in this report is the property of FICCI. Any other use, including the reproduction, modification, distribution, transmission, republication, display or performance, of the content in this report is strictly prohibited without written permission from them.
Mines and Metals Division Federation of Indian Chamber of Commerce and Industry Federation House, Tansen Marg New Delhi 110 001 India www.ficci.com

Indian Non-Ferrous Metals Industry
Way Forward
February 2018

About the Report
FICCI has always thrived in providing thought leadership. In this regard, I am happy that we in FICCI have developed a comprehensive report on the non-ferrous metals industry in India titled - Non-Ferrous Metals Industry – Way Forward. The report covers current issues faced by industry stakeholders in primary and secondary downstream segments, and explores potential remedies. The report also briefly covers the historical growth path of non-ferrous metal industry in India, its current trends and how the industry is likely to shape up in the near future, inter-alia outlining major recommendations that can help further accelerate the industry’s growth.
The non-ferrous metals industry in India has been performing well in the last few years and has provided the impetus to the domestic economy. The industry has been partner in the growth and development in sectors such as power, automobiles, defence, telecom, manufacturing and infrastructure.
The industry has however, also witnessed some challenges, which can be addressed with the Government support so as to enable its steady & healthy growth in the coming years, namely - inverted duty structure under FTAs, raw material insufficiency, inadequate infrastructure etc. FICCI Non-Ferrous Metals Committee felt the need for highlighting all such issues, and a way forward for harnessing the full potential of various Non-Ferrous Metals. Hence, this report, which covers metals like aluminium, copper, lead and zinc and the policy imperatives which can help these industries to a sustained path of growth with global competitiveness.
I am sure, the policy makers, industry members, academicians and all other stakeholders will find this report useful.
Shri S K Roongta Mentor, FICCI Non-Ferrous Metals Committee

Foreword
Non-ferrous metals, due to their inherent characteristics like excellent thermal and electrical conductivity, high recyclability, high strength-to-weight ratios, form the backbone of a growing economy like that of India. Metals like aluminium, copper, zinc and lead are key inputs to a wide range of critical industries, including infrastructure, power, automobile, defence, transport, telecom and manufacturing in general.
Key Government reforms like Make in India, focus on urbanization, including initiatives like Smart Cities, place strong emphasis on expansion of our manufacturing sector. Growth of the manufacturing sector will be directly proportional to the growth of the non-ferrous metals industry. Aided by strong demand in sectors like automobile, construction, electrical and consumer durables, the non-ferrous metals industry in India has historically witnessed good progress. However, there are many critical challenges which are affecting robust growth of the sector in India, especially the China factor, the underdeveloped scrap recycling sector and the problem of inverted duty structure.
Addressing each of these challenges is imperative for India to realize the true potential of its vast natural reserves and for boosting sustainable economic development. Providing a platform for the Industry and Government to come together and jointly address these challenges and explore ways to foster growth would thus be the step in the right direction. FICCI is taking various initiatives dedicated to non-ferrous metals industry, where the key stakeholders can raise pertinent issues and propose specific actions to address common challenges and facilitate conducive environment for stronger growth.
This report, titled Non-Ferrous Metals Industry – Way Forward, is a first-of-its-kind publication that ties together industry inputs on key trends, along with specific policy recommendations, which we believe, will help spur growth for the sector and the economy.
It is now the right time for the non-ferrous metals industry to be recognized as strategically important for India’s long-term economic development, and be given its rightful place as a core constituent in government planning. In the common interest of inclusive growth, the Government and the Industry must jointly work together for capacity augmentation and technology upgradation in the value chain. At the same time, urgent steps should be taken to ensure that the domestic industry is not hampered by unfair import advantages with respect to trade policies, to provide level playing field to the domestic players to flourish.
Shri Satish Pai Chair, FICCI Non-Ferrous Metals Committee

Acknowledgements
Federation of Indian Chambers of Commerce and Industry (FICCI) would extend its heartfelt thanks to its Knowledge Partners Avalon Global Research and Avalon Consulting in India for providing key inputs and editorial support in preparation and finalization of the report. The approach adopted by Avalon provided a holistic perspective to the report; giving it a 360 degree coverage across the entire gamut of the Indian non-ferrous metals industry.
FICCI would like to thank its non-ferrous metals committee for conceptualizing, reviewing and supporting the report development. A true attempt has been made to comprehensively cover the issues, opportunities and recommendations highlighted by the committee. The sub-group carved out of the committee provided a continuous support during the report development with interventions from time to time in the best interest of the report and the desired objectives.
FICCI would also like to convey its sincere thanks to various organizations, associations and individual experts in the sector for sharing their insights and contributing to the report. Their views have contributed immensely in finalizing the recommendations of the report.
A special mention for Ministry of Mines, Government of India for their encouragement to FICCI in developing the report to address the needs of Indian non-ferrous industry of the decade ahead.
At the end, FICCI acknowledges and appreciates the contribution made by one & all associated with the report.

Table of Contents
About the Report 5
Foreword 7
Acknowledgements 9
List of Figures 12
List of Abbreviations 14
1. Report Background 15
2. Executive Summary 17
3. Introduction to Indian Non-Ferrous Metals Industry 25
3.1 Overview 26
3.2SignificanceofNon-FerrousMetalsIndustry 28
3.3Non-FerrousMetalsIndustry-ValueChain 28
3.4InstalledCapacityofLeadingProducers(2016-17) 30
4. Aluminium 31
4.1CurrentStatusofIndustry 32
4.2Import-ExportScenario 38
5. Copper 43
5.1CurrentStatusofIndustry 44
5.2Import-ExportScenario 49
6. Lead 55
6.1CurrentStatusofIndustry 56
6.2Import-ExportScenario 59
7. Zinc 63
7.1CurrentStatusofIndustry 64
7.2Import-ExportScenario 66
8. Non-ferrous metals: Secondary Industry 71
8.1IndustryOverview 72
8.2NFMScrapsImportsintoIndia 74
8.3Metalrecyclingpolicy 75
9. An International Perspective 77
10. Outlook: Vision 2030 81
10.1Domesticdemandandexportpotential 82
10.2Newapplicationsfornon-ferrousmetals 85
10.3Keychallenges 89
11. Key Recommendations 93
List of Figures
Figure Title Page #1 Demand – Supply of Primary Aluminium (All figures in million tonnes) 192 Demand – Supply of Primary Copper (All figures in million tonnes) 193 Demand – Supply of Primary Lead (All figures in million tonnes) 204 Demand – Supply of Primary Zinc (All figures in million tonnes) 205 Contribution of Non-Ferrous Metals End-Use Industries to GVA in India’s
GDP28
6 Non-Ferrous Metals Industry - Value Chain 297 India’s Aluminium Industry Structure 338 Top 10 Countries by Global Bauxite Reserves 349 India’s Primary Aluminium Installed Capacity Utilization 3510 India’s Aluminium Installed Capacity 3511 India’s Aluminium Production and Consumption 3612 India’s Aluminium Industry End-use segments 3613 Consumption by End-Use Sector 3714 India’s Production and Consumption of Bauxite (Aluminium Ore) 3915 India’s Production and Consumption of Alumina (Aluminium Concentrate) 3916 India’s Export-Import of Bauxite (Aluminium Ores) 4017 India’s Export-Import of Alumina (Aluminium Concentrate) 4018 India's Aluminium Exports and Imports 4119 India’s Aluminium Wire and Aluminium Scrap Imports from Malaysia 4220 India’s Copper Industry Structure 4521 Top 10 Countries by Global Copper Ore Reserves 4522 India’s Copper Production Installed Capacity 4623 India’s Copper Production and Consumption 4624 India’s Copper Industry End-use segments 4725 Copper Consumption by End-Use Sector 4726 India’s Production of Copper ore 4927 India's Exports-Imports of Copper Ores & Concentrates 5028 India’s Imports Copper Waste and Scrap, Unrefined Copper 5129 India's Copper Tube Imports 5130 India's Copper Exports and Imports 5231 India’s Copper Wire and Copper Sheets Imports from Malaysia 5332 India’s Copper Wire and Copper Sheets Imports from Thailand 5333 Top 10 Countries by Global Lead Ore Reserves 5734 India’s Lead Production Installed Capacity 5735 India’s Lead Production and consumption 5836 Lead Consumption by End-Use Sectors 5837 India's Exports-Imports of Lead Ores & Concentrates 6038 India's Lead Imports and Exports 61

Figure Title Page #39 Top 10 Countries by Global Zinc Ore Reserves 6440 India’s Zinc Production Installed Capacity 6541 India’s Zinc Production and consumption 6542 Zinc Consumption by End-Use Sectors 6643 India's Exports-Imports of Zinc Ores & Concentrates 6744 India's Zinc Imports and exports 6845 Share of organized and unorganized players in India’s secondary non-
ferrous metals industry72
46 Share of the recycling industry 7347 Secondary Metal share in Total Size of non-ferrous metals industry
(2016-17)73
48 Per capita per annum Aluminium Consumption 8249 Per capita per annum Copper Consumption 8350 Per capita per annum Lead Consumption 8451 Per capita per annum Zinc Consumption 8552 Aluminium Processing Cost Structure 9153 NFM Future Demand Growth 99

List of Abbreviations
BIS Bureau of Indian Standards
CAGR Compound Annual Growth Rate
CEPA Comprehensive Economic Partnership Agreement
CPCB Central Pollution Control Board
DGFT Directorate General of Foreign Trade
EU European Union
FICCI Federation of Indian Chambers of Commerce and Industry
FTA Free Trade Agreement
FY Financial Year
GDP Gross Domestic Product
GVA Gross Value Added
ICSG International Copper Study Group
IBM Indian Bureau of Mines
INR Indian Rupee
KT Kilo Tonnes
MT Million Tonnes
Mn TPA Million Tonnes per Annum
SPCBs State Pollution Control Boards
SPCCs State Pollution Control Committees
TPA Tonnes Per annum
NFM Non-Ferrous Metals
RCEP Regional Comprehensive Economic Partnership

1. Report Background

16 Indian Non-Ferrous Metals Industry - Way Forward
1. Report Background
This report is an initiative to provide a platform for the industry stakeholders and Government officials to commence a dialogue on the road ahead for the non-ferrous metals industry, given its promising outlook and significance to the Indian economy.
With no ready reference or guide available consolidating all the non-ferrous metals, both primary and secondary segments at one place, the FICCI non-ferrous metals committee felt the need of carving out an industry report focusing upon the important metals of aluminium, copper, zinc & lead and their vision along with challenges and opportunities.
This report primarily aims to throw more light on serious issues faced by industry players today, and explore potential remedies. Further, the report also offers a glimpse into the historical growth path of non-ferrous metals industry in India, how the industry is likely to shape up in the near future, challenges ahead and finally, the key recommendations that can help further accelerate the industry growth.
The chapters of the report offer considerable insights into major demand and supply-side trends and recommend possible policy imperatives that can help the non-ferrous metals industry to become globally competitive. It also identifies challenges faced by downstream fabricators of non-ferrous metals (including aspects such as FTAs, RCEP, taxation and others) that hinder the domestic industry.
This report is a fundamental step to initiate a much-needed dialogue to propel the industry to achieve its next phase of growth.

17Indian Non-Ferrous Metals Industry - Way Forward
2. Executive Summary
18 Indian Non-Ferrous Metals Industry - Way Forward
2. Executive Summary
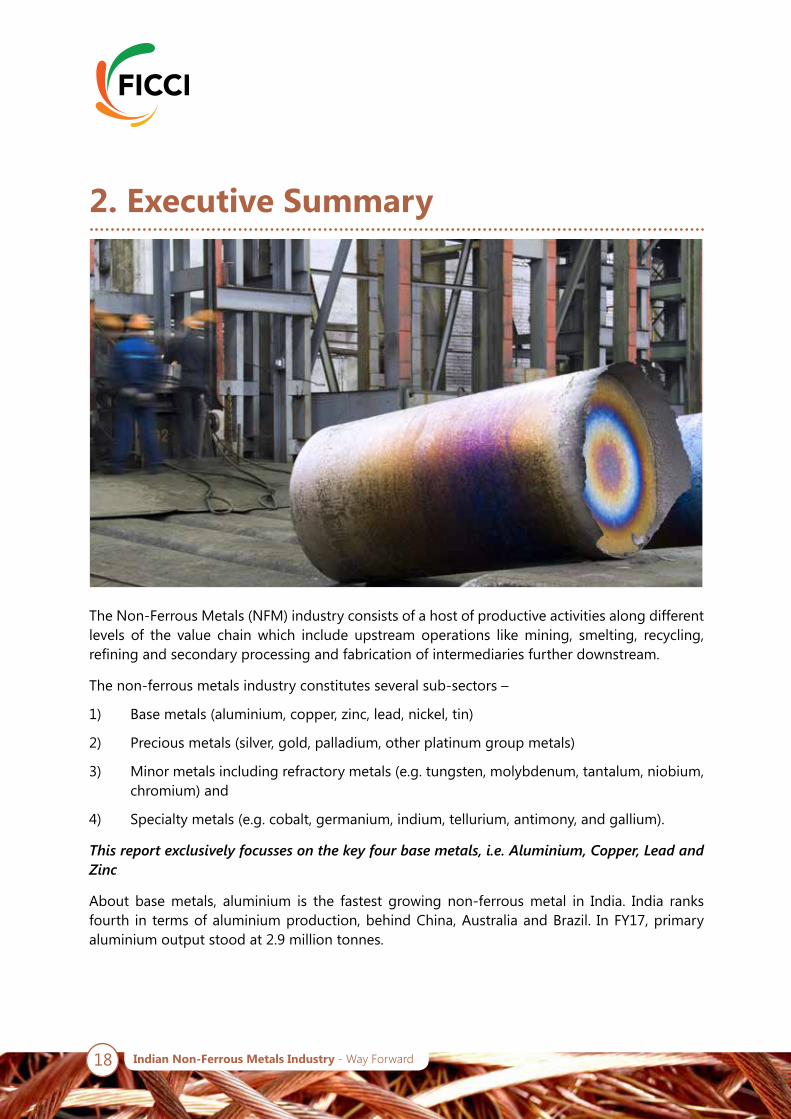
The Non-Ferrous Metals (NFM) industry consists of a host of productive activities along different levels of the value chain which include upstream operations like mining, smelting, recycling, refining and secondary processing and fabrication of intermediaries further downstream.
The non-ferrous metals industry constitutes several sub-sectors –
1) Base metals (aluminium, copper, zinc, lead, nickel, tin)
2) Precious metals (silver, gold, palladium, other platinum group metals)
3) Minor metals including refractory metals (e.g. tungsten, molybdenum, tantalum, niobium, chromium) and
4) Specialty metals (e.g. cobalt, germanium, indium, tellurium, antimony, and gallium).
This report exclusively focusses on the key four base metals, i.e. Aluminium, Copper, Lead and Zinc
About base metals, aluminium is the fastest growing non-ferrous metal in India. India ranks fourth in terms of aluminium production, behind China, Australia and Brazil. In FY17, primary aluminium output stood at 2.9 million tonnes.

19Indian Non-Ferrous Metals Industry - Way Forward
Copper is the second largest non-ferrous metals market in India in terms of production. In FY17, primary copper output totalled 0.8 million tonnes. By 2020, India is poised to become the world’s fourth largest copper market, growing at a CAGR of ~6.1% per annum from FY16-FY20.
Lead finds its use in storage batteries, also dubbed lead acid batteries. The Indian market for lead acid batteries is currently estimated US$7 billion, driven by the automotive sector, which consumes ~60% of lead acid batteries.
Figure 1: Demand – Supply of primary aluminium (All figures in million tonnes)
Figure 2: Demand – Supply of primary copper (All figures in million tonnes)
1.7 1.7 1.72.0
2.4
2.9
0
0.2
0.4
0.6
0.8
1
1.2
1.4
1.6
0
0.5
1
1.5
2
2.5
3
3.5
2012 2013 2014 2015 2016 2017
Production Import Export
1.71.9
1.71.9
2.22.3
0
0.5
1
1.5
2
2.5
2012 2013 2014 2015 2016 2017
Demand
Source:Aluminium-IndianMineralsYearbook2015Vol.II
Source:Copper-IndianMineralsYearbook2012to2015Vol.II
0.5 0.50.6
0.8 0.8 0.8
0.0
0.1
0.2
0.3
0.4
0.5
0.0
0.2
0.4
0.6
0.8
1.0
2012 2013 2014 2015 2016 2017
Production Import Export
0.4 0.4
0.6 0.6
0.8 0.8
00.10.20.30.40.50.60.70.80.9
2012 2013 2014 2015 2016 2017
Demad

20 Indian Non-Ferrous Metals Industry - Way Forward
Figure 3: Demand – Supply of Primary Lead (All figures in million tonnes)
Figure 4: Demand – Supply of primary zinc (All figures in million tonnes)
Source:Lead-IndianMineralsYearbook2012to2015Vol.II
Source:Zinc-IndianMineralsYearbook2012to2015Vol.II
0.09
0.12 0.120.1
0.14 0.14
0.00.10.10.20.20.30.30.40.40.50.5
0.00
0.05
0.10
0.15
0.20
2012 2013 2014 2015 2016 2017
Production Import Export
0.12
0.180.16
0.19 0.190.17
0.00
0.05
0.10
0.15
0.20
0.25
2012 2013 2014 2015 2016 2017
Demand
Zinc is the fourth most widely used metal across the globe, trailing only steel, aluminium and copper. Zinc consumption in India totalled 0.67 million tonnes during FY17. This is set to rise to 0.90 million tonnes by FY20. Around 75% of zinc is used for galvanising in order to protect steel from corrosion.
0.8
0.7
0.8
0.7
0.8
0.7
0.0
0.1
0.2
0.3
0.4
0.0
0.2
0.4
0.6
0.8
1.0
2012 2013 2014 2015 2016 2017
Production Import Export
0.57
0.61
0.65 0.65
0.670.66
0.50
0.55
0.60
0.65
0.70
2012 2013 2014 2015 2016 2017
Demand

21Indian Non-Ferrous Metals Industry - Way Forward
Import-Export Scenario
India ranks fifth in the world’s reserve base of Bauxite and has approximately 5.1% of the world’s total reserve. Considering the fact that India has significant aluminium ores and concentrates, its exports are higher than imports.
India is heavily dependent on imports of copper ores and concentrates in order to fulfil 96% of the demand, while the domestic availability satisfies only about 4%. The country’s exports and imports of lead ores and concentrates over the last five years have shown an erratic behaviour. While the exports used to be significantly higher than imports, there has been a steep decline in the former due to slowdown in the global commodities market.
India’s exports of zinc ores and concentrates have seen a massive decline over the last five years amid slowdown in demand from China.
India’s imports of aluminium scrap are much higher than its imports of either primary aluminium or aluminium products. Over the last five years, aluminium scrap imports have grown rapidly due to limited generation and availability of aluminium scrap within the country.
India is also a large importer of copper products and copper scrap to meet its requirements.
In terms of both imports and exports, primary lead is prominent and dwarfs the lead products and lead scrap categories. Additionally, India’s imports of lead scrap are considerably higher than its exports, pointing to the domestic industry’s appetite for lead scrap.
India not only imports a large quantity of primary zinc and zinc scrap, but also exports a significant quantity of primary zinc. The overall imports have seen a jump after the implementation of the India-ASEAN FTA, India-Japan CEPA and FTA with South Korea. Another reason for this increase is the inverted duty structure that makes imports of downstream products cheaper as compared to importing raw materials to produce primary metal.
A review of global best practices in the non-ferrous metals industry throws up many lessons for India. The domestic industry can certainly thrive on Government support by recognising this industry as one of strategic importance.
• The recognition of industry’s significance to end-use sectors such as infrastructure and manufacturing is critical
• A cluster-focused development of the industry is another step required to boost the development of the domestic industry
• Government assistance in the form of infrastructure support, cheap and abundant electricity supply, relaxation in import duties on raw materials and recycling equipment and other taxation incentives would also go a long way
• India also urgently needs to ensure that existing regulations (Hazardous Waste Mgmt. Rules, Battery Management Rules, E-Waste Rules enacted by MOEF&CC) pertaining to the import and use of metal scrap are strictly implemented and monitored by SPCBs/ SPCCs

22 Indian Non-Ferrous Metals Industry - Way Forward
Additionally, in a bid to cut dependency on metal scrap imports and support a sustainable recycling ecosystem, drafting of end-of-waste and end-of-life guidelines for metal scrap should be considered as an important initiative.
One of the key challenges faced by the non-ferrous metals industry is its heavy dependence on scrap metal imports.
• A major share of metal scrap demand is served by imports owing to the underdeveloped metal scrap collection, segregation and processing infrastructure in the domestic market
• Given India’s population and metal consumption, the gap between demand and supply of metal scrap is glaring
• However, scrap generation domestically has been rising year after year, thanks to the excess recycling capacity in the country. India also imports scrap from other countries over and above the locally generated
Another cause for concern is the reliance on imports of metal ores and concentrates, especially for copper.
• The domestic supply of copper ores and concentrates serves only 4% of the Indian demand, while imports make up for 96%
India’s non-ferrous metals industry is also plagued by the inverted duty structure
• It essentially means that select downstream products such as copper wires, zing ingots and aluminium foil etc. are imported from certain countries under trade agreements at lower tariffs than the imports of raw materials for producing primary metal in India
• This has an adverse impact on domestic producers and puts them at an unfair disadvantage
A collaborative effort between the Government and industry is required to provide a fillip to the industry and to ensure that the domestic non-ferrous metals industry is globally competitive.
23Indian Non-Ferrous Metals Industry - Way Forward
To tackle the problem of indiscriminate metal scrap imports, India needs to develop and strictly implement quality standards pertaining to the import and use of metal scrap.
Furthermore, well-defined end-of-life norms are essential to ensure availability of quality scrap and cut dependency on imports.
Government should formulate a major policy initiative on procurement of NFM products from domestic producers for all PSU’s and Government department requirements.
Given the Government initiatives such as Make in India, Housing for All, Power for All, modernisation of railways etc., this Government policy initiative would be a game changer for the domestic non-ferrous metals industry.
In order to make the domestic producers globally competitive, the problem of inverted duty structure needs to be resolved.
As is the case with the imports of raw materials for copper and other metals in China and EU nations, the import duty on raw materials needs to be reduced or done away with.
This report is an effort from FICCI, to initiate a key dialogue to identify the major challenges faced by the non-ferrous metals industry and suggest
recommendations to help industry achieve its potential.

24 Indian Non-Ferrous Metals Industry - Way Forward

25Indian Non-Ferrous Metals Industry - Way Forward
3. Introduction to Indian Non-Ferrous Metals Industry
26 Indian Non-Ferrous Metals Industry - Way Forward
3. Introduction to Indian Non-Ferrous Metals Industry
3.1 Overview
Metals industry has two segments: Ferrous and Non-Ferrous Metals.
Major non-ferrous metals include aluminium, copper, lead and zinc. The non-ferrous metals industry, with its far-reaching linkages across various downstream sectors, is of great economic significance. While the demand for non-ferrous metals in India is expected to rise with the Government’s ‘Make in India’ and ‘Smart City’ initiatives, the industry is also preparing to face challenges to reduce costs and support technological innovation.
Indian Metal Industry
Ferrous Metal ( Iron and Different Varities of Steel)
Non Ferrous Metals (Aluminium, Copper, Zinc, Lead, Nickel and Tin)
27Indian Non-Ferrous Metals Industry - Way Forward
Aluminium
Aluminium is the most abundant metal in the earth’s crust. As measured by the volumes, it is the second most used metal, only next to steel. It is the fastest growing non-ferrous metal and the same is evident by its growing and widespread use. Growing consumption of aluminium in the automotive sector has proven to be a game-changer. The automotive industry with its need for lightweight and fuel-efficient vehicles will be the key growth driver for the metal moving ahead. Other sectors that will drive the demand include electrical applications, consumer durables, construction, packaging, transportation and aviation.
India’s strength in aluminium stems from its rich reserves of bauxite, a core resource used in production of Aluminium.
Copper
Copper is the second largest non-ferrous metal in India in terms of production. The country has come a long way since being a net importer of refined copper, with exports of refined copper markedly increasing over the years. However, India continues to import significant volumes of copper ores and concentrates from Chile, Australia and Indonesia. The demand for copper in India will remain strong, driven by rapidly increasing electricity generation and consumption.
Major applications of copper are in electrical sectors viz, transformers, motors, generators, switchgears, house wiring etc. The metal finds usage across numerous applications including but not limited to defence, spacecraft, railways, power cables, electronics & communications, auto ancillaries, and consumer durables such as air conditioning, refrigeration.
Zinc
Zinc is the fourth most widely used metal across the globe, trailing only steel, aluminium and copper. Zinc metal always occurs in association with lead, copper, silver and other metals. The most common zinc mineral is Sphalerite, also known as zinc blende. The applications of zinc include galvanizing, zinc die-casting, batteries, zinc chemicals etc. with around 75% of it used for galvanizing to protect steel from corrosion. Infrastructure development activities, building and construction, and a rapidly growing steel industry will only fuel zinc demand in the country.
Lead
Lead usually occurs as ore with zinc, silver, copper, and extracted together with these metals. The main lead mineral is Galena. Traditionally, the automotive sector has been the major consumer of lead/lead acid batteries in India, in tune with global practices. Lead acid batteries find higher usage ~60% in automobiles, while the remaining 40% is for industrial applications. Other demand drivers of lead acid batteries include a growing need for inverters, uninterrupted power supply, rollout of smart grid projects, growing hybrid and electric vehicle market, installation of renewable energy systems and the telecommunication industry. Electric vehicles and renewable energy markets are to be the next wave of growth of Lead Industry.
28 Indian Non-Ferrous Metals Industry - Way Forward
3.2 Significance of Non-Ferrous Metals Industry
The NFM industry has high significance in the Indian economy and resultant from its widespread use across a number of industries of both economic and strategic significance. It forms a predictable part of economic growth as it provides basic raw-feed to a wide range of key industries including defence, engineering, electrical and electronics, infrastructure, automobile and railways.
The above six sectors also form the core of Government’s schemes and programmes such as:
• Make in India
• Power for All
• Smart Cities Scheme,
• National Solar Mission and Housing for All, among others
The NFM industry generates large-scale employment both directly and indirectly. For example, aluminium industry alone accounts for employment generation of about 800,000 people.
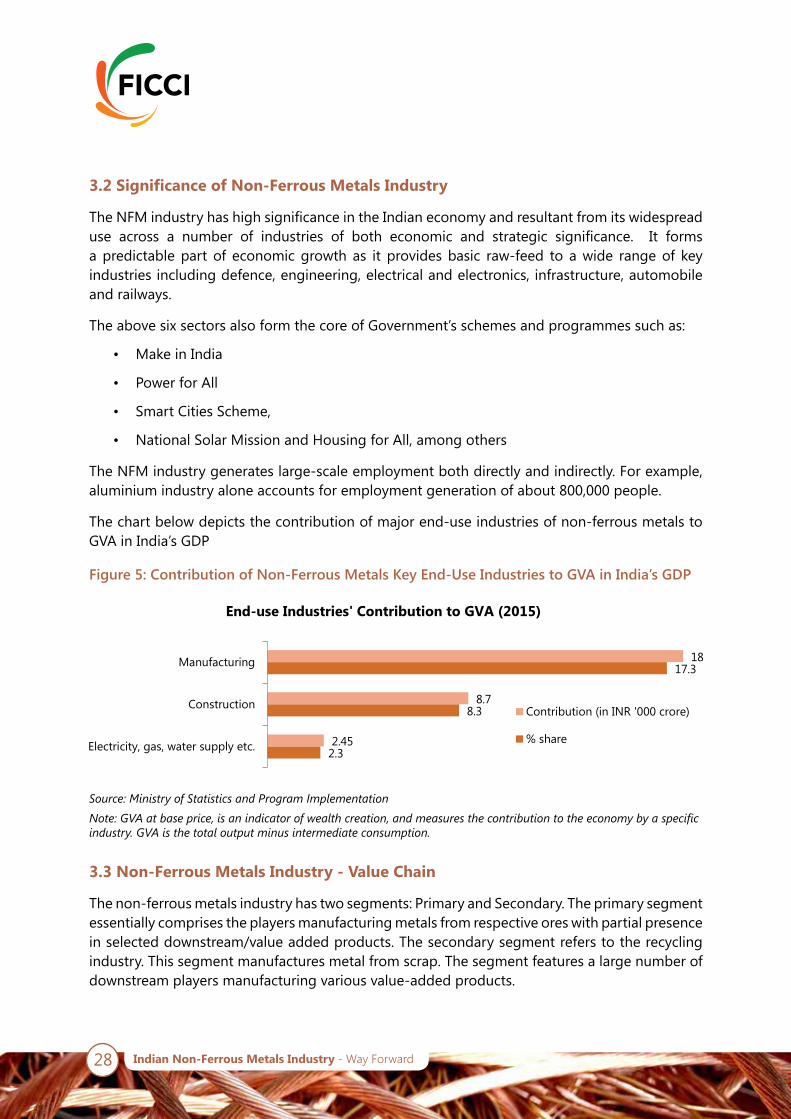
The chart below depicts the contribution of major end-use industries of non-ferrous metals to GVA in India’s GDP
3.3 Non-Ferrous Metals Industry - Value Chain
The non-ferrous metals industry has two segments: Primary and Secondary. The primary segment essentially comprises the players manufacturing metals from respective ores with partial presence in selected downstream/value added products. The secondary segment refers to the recycling industry. This segment manufactures metal from scrap. The segment features a large number of downstream players manufacturing various value-added products.
Figure 5: Contribution of Non-Ferrous Metals Key End-Use Industries to GVA in India’s GDP
Source:MinistryofStatisticsandProgramImplementation
Note:GVAatbaseprice,isanindicatorofwealthcreation,andmeasuresthecontributiontotheeconomybyaspecificindustry.GVAisthetotaloutputminusintermediateconsumption.
2.3
8.3
17.3
2.45
8.7
18
Electricity, gas, water supply etc.
Construction
Manufacturing
End-use Industries' Contribution to GVA (2015)
Contribution (in INR '000 crore)
% share

29Indian Non-Ferrous Metals Industry - Way Forward
Figure 6: Non-Ferrous Metals Industry - Value Chain
Owing to the fact that it is capital, resource and energy-intensive, the primary metals industry is highly consolidated with a very few large players dominating the market. The secondary segment, on the other hand, is highly competitive and fragmented, with a large number of players in both the organised and unorganised sectors.
The primary metal in case of aluminium is usually in the form of ingots, billets and wire rods.
Value-added products or downstream products such as flat rolled products, extrusions and foils are produced from above primary products. Downstream products are converted into sheets, plates and other fabricated products.
In the copper industry, primary metal is usually in the form of copper cathodes, billets, cakes and continuous cast copper rods. The semi-fabricated or downstream products are typically in the form of rods, profiles, wires, tubes, sheets and strips.
In the lead and zinc industry, primary metal is usually in the form of ingots. Semi-fabricated or downstream products are typically in the form of rolled or extruded products.
OreBauxite/Copper /Lead and Zinc SulphideCopper Oxide/mixed ores
Primary Product and Secondary ProductIngots - Billets/slab/blooms
- Mining- Beneficiation- Concentration- Smelting/leaching- Refining
New Scrap
Upstream
Downstream
Extrusion/rolling/casting
Semi-fabricated productSheet/Strip/Plate/Foil/ Tubing and Pipe/Wire/Alloys
Conc
entr
ated
Indu
stry
Frag
men
ted
Indu
stry
End-of-life products(old SCRAP)
- Engineered design- Product and process development- Material selection and sourcing
Recyclers
End-use applicationDoors, windows, power cables,equipment and machinery parts
30 Indian Non-Ferrous Metals Industry - Way Forward
The metal ores excavated from mining deposits as a concentration is smelted and refined to produce primary metal.
Secondary metal is manufactured using recycling scrap, both old and new scrap. New scrap is produced during the conversion process i.e. the conversion of the semi-fabricated product to the end-use product. Old scrap refers to the scrap after the end-use product has outlived its utility and turns to scrap.
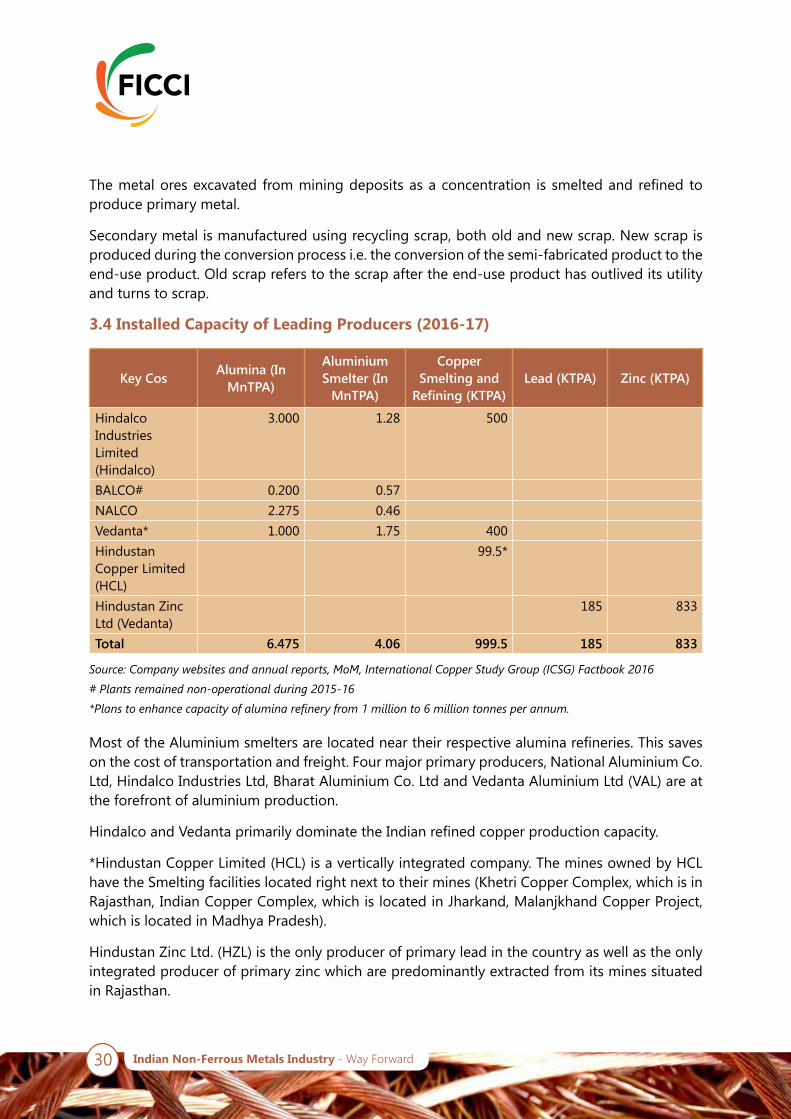
3.4 Installed Capacity of Leading Producers (2016-17)
Most of the Aluminium smelters are located near their respective alumina refineries. This saves on the cost of transportation and freight. Four major primary producers, National Aluminium Co. Ltd, Hindalco Industries Ltd, Bharat Aluminium Co. Ltd and Vedanta Aluminium Ltd (VAL) are at the forefront of aluminium production.
Hindalco and Vedanta primarily dominate the Indian refined copper production capacity.
*Hindustan Copper Limited (HCL) is a vertically integrated company. The mines owned by HCL have the Smelting facilities located right next to their mines (Khetri Copper Complex, which is in Rajasthan, Indian Copper Complex, which is located in Jharkand, Malanjkhand Copper Project, which is located in Madhya Pradesh).
Hindustan Zinc Ltd. (HZL) is the only producer of primary lead in the country as well as the only integrated producer of primary zinc which are predominantly extracted from its mines situated in Rajasthan.
Key Cos Alumina (In MnTPA)
Aluminium Smelter (In
MnTPA)
Copper Smelting and
Refining (KTPA)Lead (KTPA) Zinc (KTPA)
Hindalco Industries Limited (Hindalco)
3.000 1.28 500
BALCO# 0.200 0.57NALCO 2.275 0.46Vedanta* 1.000 1.75 400Hindustan Copper Limited (HCL)
99.5*
Hindustan Zinc Ltd (Vedanta)
185 833
Total 6.475 4.06 999.5 185 833
Source:Companywebsitesandannualreports,MoM,InternationalCopperStudyGroup(ICSG)Factbook2016
#Plantsremainednon-operationalduring2015-16
*Planstoenhancecapacityofaluminarefineryfrom1millionto6milliontonnesperannum.

31Indian Non-Ferrous Metals Industry - Way Forward
4. Aluminium

32 Indian Non-Ferrous Metals Industry - Way Forward
4. Aluminium
4.1 Current Status of Industry
4.1.1 Overview and Industry Structure
Aluminium is one of the lightest metals in the world and as a result, used widely in the production of multiple products. Bauxite is the basic raw material that goes into aluminium manufacturing.
The aluminium production process has two main activities namely - upstream and downstream activities.
The upstream process involves mining, refining and smelting activities, while downstream process involves casting and fabricating. Aluminium downstream-fabricated products include rods, sheets, extrusions and foils.
Aluminium is produced using two routes. The primary production process involves the conversion of ores to aluminium, while in secondary production (recycling), the aluminium scrap is recycled to produce aluminium again.
In India, four key players dominate the primary aluminium market - privately owned Hindalco, Vedanta and BALCO and public-sector undertaking National Aluminium Company Limited (NALCO).
33Indian Non-Ferrous Metals Industry - Way Forward
4.1.2 Key raw material sourcing- Bauxite
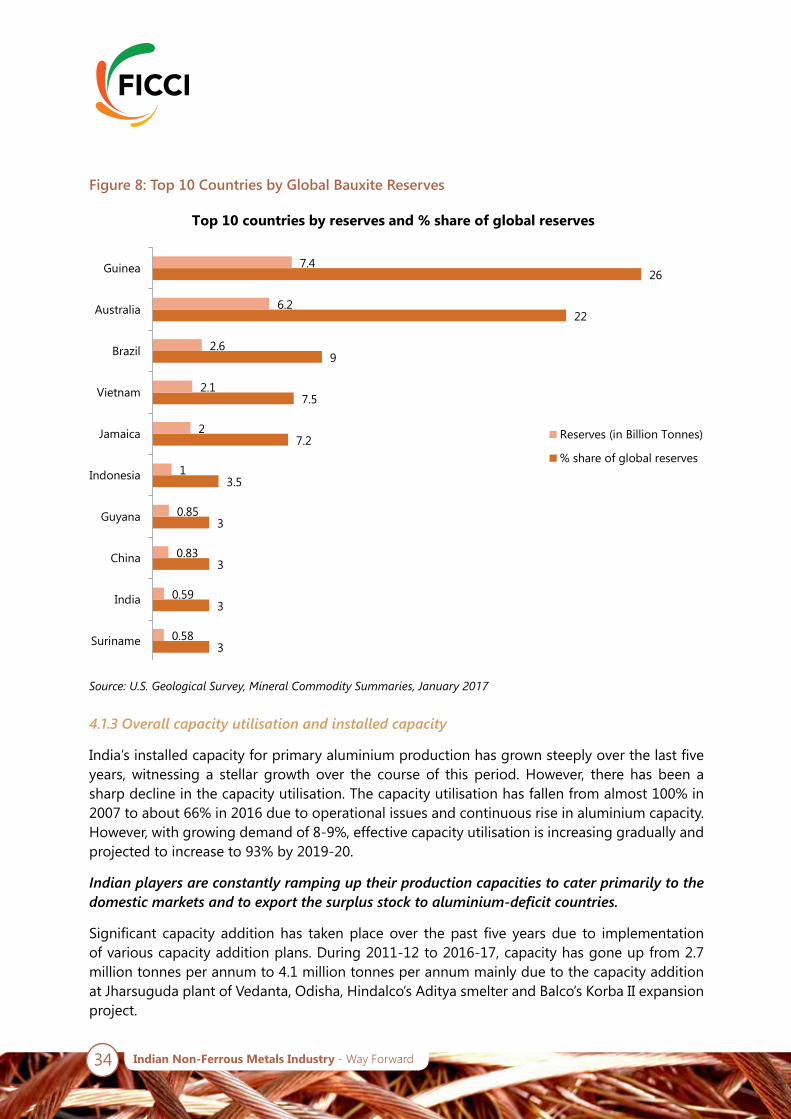
The share of bauxite reserves held by the top 10 countries is about 87% of the total global bauxite reserves. Guinea and Australia together holds almost ~50% of the total reserves.
The states of Odisha and Andhra Pradesh together hold 69% of total India’s bauxite reserves.
India has the fifth largest bauxite reserves with deposits of about 3.8 billion tonnes. India’s share in world aluminium capacity stands at about 4.85%. Production of one tonne of aluminium requires two tonnes of alumina, while production of one tonne of alumina requires three-four tonnes of bauxite.
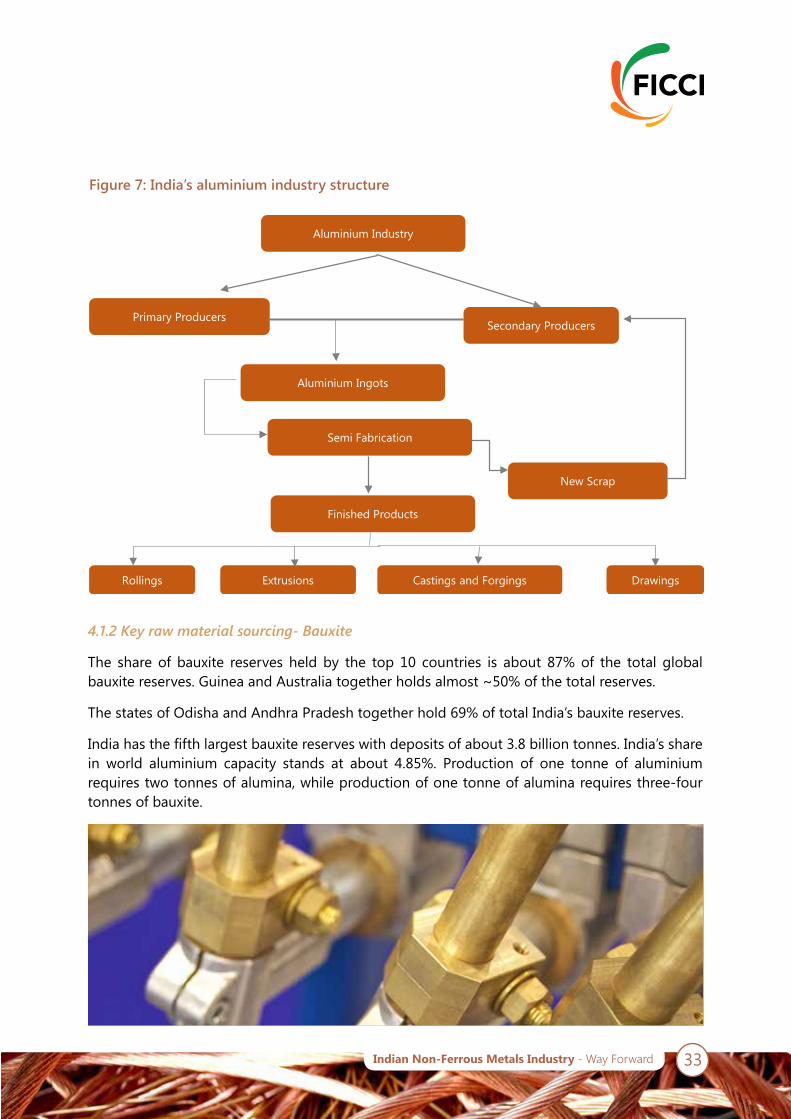
Figure 7: India’s aluminium industry structure
Aluminium Ingots
Secondary ProducersPrimary Producers
Semi Fabrication
Finished Products
New Scrap
Rollings Castings and Forgings DrawingsExtrusions
Aluminium Industry
34 Indian Non-Ferrous Metals Industry - Way Forward
Figure 8: Top 10 Countries by Global Bauxite Reserves
3
3
3
3
3.5
7.2
7.5
9
22
26
0.58
0.59
0.83
0.85
1
2
2.1
2.6
6.2
7.4
Suriname
India
China
Guyana
Indonesia
Jamaica
Vietnam
Brazil
Australia
Guinea
Top 10 countries by reserves and % share of global reserves
Reserves (in Billion Tonnes)
% share of global reserves
Source:U.S.GeologicalSurvey,MineralCommoditySummaries,January2017
4.1.3 Overall capacity utilisation and installed capacity
India’s installed capacity for primary aluminium production has grown steeply over the last five years, witnessing a stellar growth over the course of this period. However, there has been a sharp decline in the capacity utilisation. The capacity utilisation has fallen from almost 100% in 2007 to about 66% in 2016 due to operational issues and continuous rise in aluminium capacity. However, with growing demand of 8-9%, effective capacity utilisation is increasing gradually and projected to increase to 93% by 2019-20.
Indian players are constantly ramping up their production capacities to cater primarily to the domestic markets and to export the surplus stock to aluminium-deficit countries.
Significant capacity addition has taken place over the past five years due to implementation of various capacity addition plans. During 2011-12 to 2016-17, capacity has gone up from 2.7 million tonnes per annum to 4.1 million tonnes per annum mainly due to the capacity addition at Jharsuguda plant of Vedanta, Odisha, Hindalco’s Aditya smelter and Balco’s Korba II expansion project.

35Indian Non-Ferrous Metals Industry - Way Forward
Figure 9: India’s primary aluminium installed capacity utilisation
Figure 10: India’s aluminium installed capacity*
Source:MoM,DGFT,CompanyAnnualReport.*Roundedofftonearestwholevalue
Source:MoM,DGFT,CompanyAnnualReport.*Roundedofftonearestwholevalue
4.1.4 Overall production and consumption
India ranks fourth in terms of primary aluminium production. China continued to be the single largest aluminium producer, contributing more than half of the total world production. To add, China is also one of the major consumers of aluminium.
• Primary domestic aluminium production grew @ CAGR of ~10.50% in last 5 years
• Aluminium production needs abundant amount of energy. Domestic players rely on coal-fired captive plants for power and fuel requirements
• Power accounts for 30% of the total cost of aluminium production.
• Indian manufacturers have an advantage of abundant source of bauxite, availability of cheap labour and access to captive power plants that all aid in increasing the production efficiency
During 2012-13 to 2016-17, aluminium demand grew at a CAGR of 3.5% supported by electrical and automotive sectors, which constitutes 60-65% of the total consumption of Aluminium.
As India has bountiful bauxite reserves and mining potential, there is a constant rise in the production and mining of bauxite.
99 93 89 8663 53 48 49 57 66
2007 2008 2009 2010 2011 2012 2013 2014 2015 2016
% capacity utilization
2.67 2.93.5 3.64 4.1 4.1
0
2
4
6
2011-12 2012-13 2013-14 2014-15 2015-16 2016-17
Installed Capacity of Aluminium ( Mn Tonnes)
36 Indian Non-Ferrous Metals Industry - Way Forward
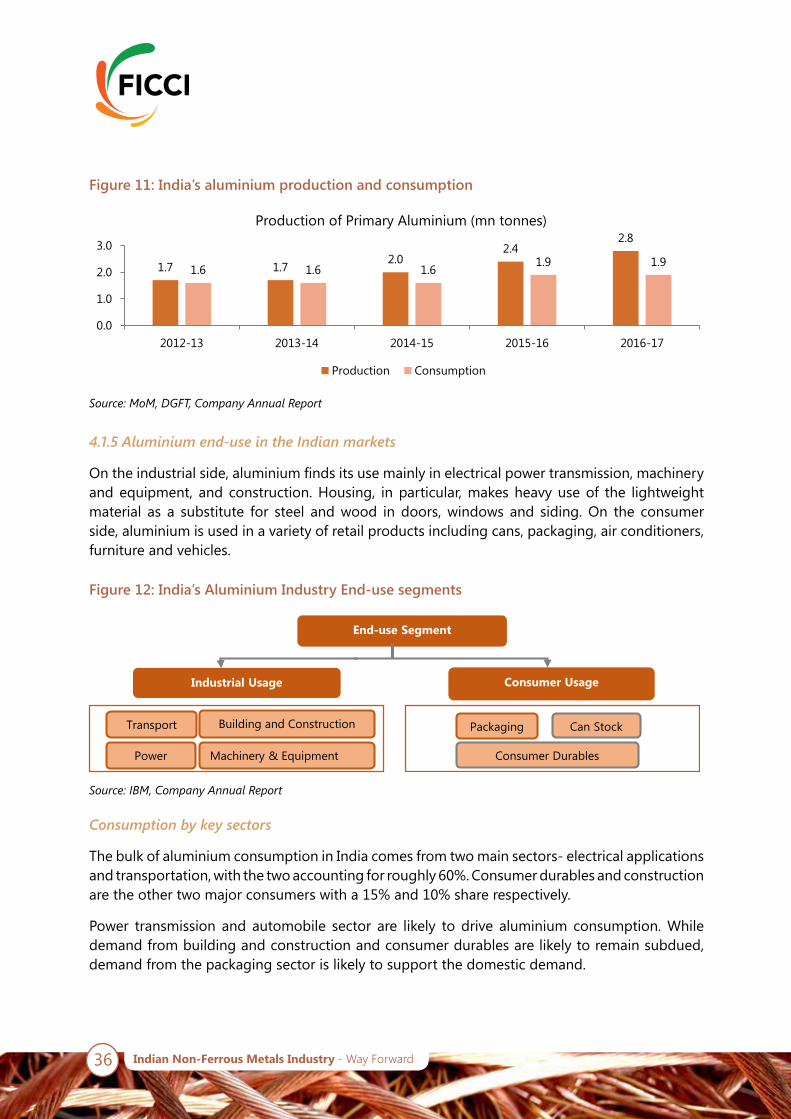
Figure 11: India’s aluminium production and consumption
Figure 12: India’s Aluminium Industry End-use segments
1.7 1.72.0
2.42.8
1.6 1.6 1.61.9 1.9
0.0
1.0
2.0
3.0
2012-13 2013-14 2014-15 2015-16 2016-17
Production of Primary Aluminium (mn tonnes)
Production Consumption
Source:MoM,DGFT,CompanyAnnualReport
Source:IBM,CompanyAnnualReport
4.1.5 Aluminium end-use in the Indian markets
On the industrial side, aluminium finds its use mainly in electrical power transmission, machinery and equipment, and construction. Housing, in particular, makes heavy use of the lightweight material as a substitute for steel and wood in doors, windows and siding. On the consumer side, aluminium is used in a variety of retail products including cans, packaging, air conditioners, furniture and vehicles.
Consumption by key sectors
The bulk of aluminium consumption in India comes from two main sectors- electrical applications and transportation, with the two accounting for roughly 60%. Consumer durables and construction are the other two major consumers with a 15% and 10% share respectively.
Power transmission and automobile sector are likely to drive aluminium consumption. While demand from building and construction and consumer durables are likely to remain subdued, demand from the packaging sector is likely to support the domestic demand.
End-use Segment
Industrial Usage Consumer Usage
Transport Building and Construction Packaging Can Stock
Power Machinery & Equipment Consumer Durables

37Indian Non-Ferrous Metals Industry - Way Forward
Figure 13: Consumption by End-Use Sector
Source:TheAluminiumAssociation,IBM,CompanyAnnualReport
Electrical Applications: Aluminium finds use in electric power transmission, overhead conductors and cables. Aluminium electrical wiring market is a steadily growing market. This is owing to the fact that aluminium wiring is lightweight and corrosion resistant, and provides two times the conductivity, per pound, of copper wiring. The metal’s preference in the electrical power transmission and distribution network is attributable to the fact that it has superior conductivity-to-weight ratio compared with copper.
Auto applications: The use of aluminium in automotive industry stems from the fact that the metal is environmentally friendly and offers a cost-effective way to increase performance, boost fuel economy and reduce emissions while improving safety and durability. Aluminium is now second only to steel as the most used material in vehicles.
The emphasis on recyclability has only further helped cement aluminium’s place in the automotive industry. At the end of a vehicle’s life, nearly 90% of the aluminium, on an average, is recycled. The lightweight advantage of aluminium in outer body structure of automobiles is evident in the fact that aluminium can provide weight savings of up to 50% compared with the traditional mild steel structure.
Machinery Equipment: Greater industrialisation and investments will spur growth in the aluminium sector due to industrial growth in emerging economies.
Aviation: Aluminium is widely used in manufacturing of aircraft. The airframe of a typical modern commercial transport aircraft is 80 % aluminium by weight. Further, aluminium alloys are used for the fuselage, wing, and supporting structures of commercial airliners and military cargo/transport aircraft. Certain structural components of current military aircraft are made of fabricated wrought aluminium, essentially forged, machined and assembled parts. Owing to its lightweight and strength, Aluminium also finds use in spacecraft and space shuttles used for space exploration.
Consumer Durables and Electronics Applications: Aluminium finds widespread use in body structures of consumer durables and other electronics appliances such as washing machines, dryers, refrigerators and laptops. Aluminium’s lightweight, structural strength and thermal characteristics have helped it make inroads into modern electronics applications such as in Apple’s MacBook, iPhone, iPod and iPad. Aluminium nanostructures are also finding use in harvesting solar energy.
48% 15% 7% 13% 7% 4% 6%
0% 10% 20% 30% 40% 50% 60% 70% 80% 90% 100%
Segmental % share in Aluminum consumption ( Tonnes)
Electrical Sector Automobile and Transport Consumer durablesConstruction Industrial Machinery & Equipment Packaging
38 Indian Non-Ferrous Metals Industry - Way Forward
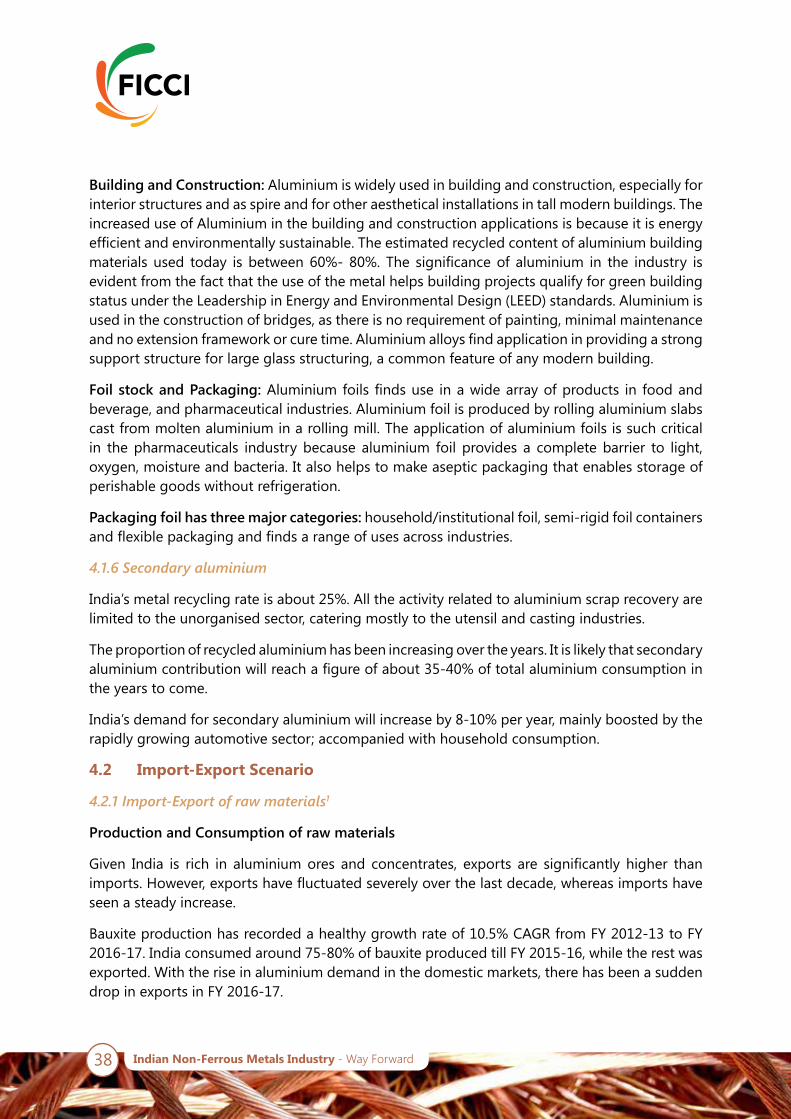
Building and Construction: Aluminium is widely used in building and construction, especially for interior structures and as spire and for other aesthetical installations in tall modern buildings. The increased use of Aluminium in the building and construction applications is because it is energy efficient and environmentally sustainable. The estimated recycled content of aluminium building materials used today is between 60%- 80%. The significance of aluminium in the industry is evident from the fact that the use of the metal helps building projects qualify for green building status under the Leadership in Energy and Environmental Design (LEED) standards. Aluminium is used in the construction of bridges, as there is no requirement of painting, minimal maintenance and no extension framework or cure time. Aluminium alloys find application in providing a strong support structure for large glass structuring, a common feature of any modern building.
Foil stock and Packaging: Aluminium foils finds use in a wide array of products in food and beverage, and pharmaceutical industries. Aluminium foil is produced by rolling aluminium slabs cast from molten aluminium in a rolling mill. The application of aluminium foils is such critical in the pharmaceuticals industry because aluminium foil provides a complete barrier to light, oxygen, moisture and bacteria. It also helps to make aseptic packaging that enables storage of perishable goods without refrigeration.
Packaging foil has three major categories: household/institutional foil, semi-rigid foil containers and flexible packaging and finds a range of uses across industries.
4.1.6 Secondary aluminium
India’s metal recycling rate is about 25%. All the activity related to aluminium scrap recovery are limited to the unorganised sector, catering mostly to the utensil and casting industries.
The proportion of recycled aluminium has been increasing over the years. It is likely that secondary aluminium contribution will reach a figure of about 35-40% of total aluminium consumption in the years to come.
India’s demand for secondary aluminium will increase by 8-10% per year, mainly boosted by the rapidly growing automotive sector; accompanied with household consumption.
4.2 Import-Export Scenario
4.2.1 Import-Export of raw materials1
Production and Consumption of raw materials
Given India is rich in aluminium ores and concentrates, exports are significantly higher than imports. However, exports have fluctuated severely over the last decade, whereas imports have seen a steady increase.
Bauxite production has recorded a healthy growth rate of 10.5% CAGR from FY 2012-13 to FY 2016-17. India consumed around 75-80% of bauxite produced till FY 2015-16, while the rest was exported. With the rise in aluminium demand in the domestic markets, there has been a sudden drop in exports in FY 2016-17.

39Indian Non-Ferrous Metals Industry - Way Forward
Alumina production is increasing at a CAGR of 13.7% from FY 2012-13 to FY 2016-17. In terms of production, there has been an 8.4% increase y-o-y from FY 2015-16 to FY 2016-17. Most of the alumina produced is domestically consumed while the surplus is being exported.
Alumina consumption on the other hand is growing at a CAGR of 11.6% CAGR from FY 2012-13 onwards. There has been a 12.5% y-o-y surge in alumina consumption from FY 2015-16 to FY 2016-17.
With growth in aluminium consumption, there has been rise in alumina imports.
Major import sources and export destinations1
India exports bauxites to China, Nepal, Saudi Arabia, France, Japan, Slovenia, the US, the UK, Oman, Italy and Kuwait. Of the total exports, almost 90% is to China. Imports are quite negligible, but whatever little India imports is from Guinea and Brazil.
Figure 14: India’s production and consumption of bauxite (aluminium ores)
Figure 15: India’s production and consumption of alumina (aluminium concentrate)
16.621.7 22.5
28.124.8
12.5
18.6 17.520.3
24.5
0
10
20
30
2012-13 2013-14 2014-15 2014-16 2016-17
Production Consumption of Bauxite (mn tonnes) Production Consumption
Source:AvalonAnalysis&Industry
3.6 45.1 5.6 6.1
3.8 3.9 4.35.2 5.8
0
2
4
6
8
2012-13 2013-14 2014-15 2014-16 2016-17
Alumina Production -Consumption (mn tonnes) Production Consumption
Source:AvalonAnalysis&Industry
40 Indian Non-Ferrous Metals Industry - Way Forward
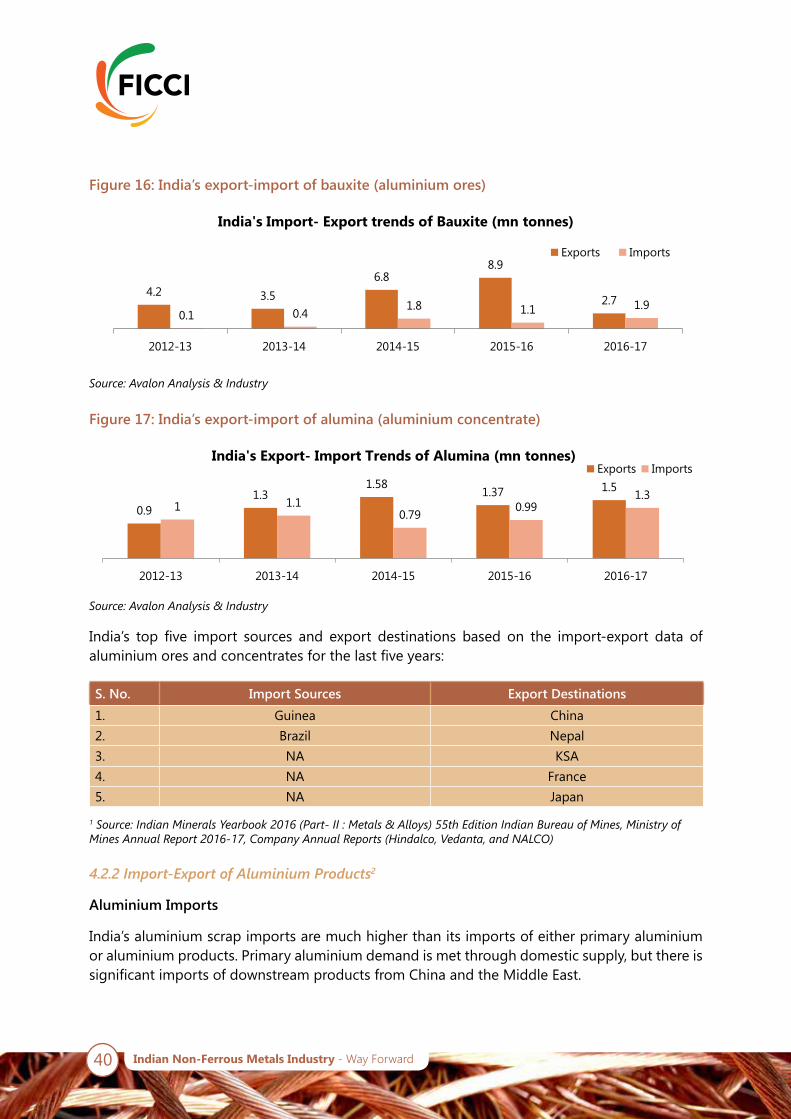
Figure 16: India’s export-import of bauxite (aluminium ores)
Figure 17: India’s export-import of alumina (aluminium concentrate)
4.2 3.56.8
8.9
2.70.1 0.4
1.8 1.1 1.9
2012-13 2013-14 2014-15 2015-16 2016-17
India's Import- Export trends of Bauxite (mn tonnes)
Exports Imports
Source:AvalonAnalysis&Industry
Source:AvalonAnalysis&Industry
1Source:IndianMineralsYearbook2016(Part-II:Metals&Alloys)55thEditionIndianBureauofMines,MinistryofMinesAnnualReport2016-17,CompanyAnnualReports(Hindalco,Vedanta,andNALCO)
0.91.3
1.581.37 1.5
1 1.10.79 0.99
1.3
2012-13 2013-14 2014-15 2015-16 2016-17
India's Export- Import Trends of Alumina (mn tonnes) Exports Imports
India’s top five import sources and export destinations based on the import-export data of aluminium ores and concentrates for the last five years:
4.2.2 Import-Export of Aluminium Products2
Aluminium Imports
India’s aluminium scrap imports are much higher than its imports of either primary aluminium or aluminium products. Primary aluminium demand is met through domestic supply, but there is significant imports of downstream products from China and the Middle East.
S. No. Import Sources Export Destinations1. Guinea China2. Brazil Nepal3. NA KSA4. NA France5. NA Japan

41Indian Non-Ferrous Metals Industry - Way Forward
Figure 18: India’s aluminium ingots exports and imports2
Source:AvalonAnalysis&Industry
2Source:MinistryofMinesAnnualReport2016-17,IndianMineralsYearbook2016(Part-I:GENERALREVIEWS),FOREIGNTRADE(ADVANCERELEASE)55thEdition;https://mines.gov.in/writereaddata/UploadFile/nlfeb2017.pdf
S. No. Aluminium and Alloys Incl. Scrap (Imports) Aluminium and Alloys (Exports)% Share The imports were mainly from China (14%),
the UAE (12%), the UK and Saudi Arabia (7% each), Malaysia (6%), the USA, Australia and South Africa (5% each), Russia (3%) and Korea, Rep. of (2%)
Exports were mainly to Korea, Rep. of (27%), Malaysia & Mexico (9% each), USA (8%), Taiwan & Turkey (4% each), UAE (3%) and Brazil, Kenya & Singapore (2 % each)
1. China South Korea2. The United Arab Emirates Malaysia3. The United Kingdom Mexico4. Saudi Arabia USA5. Malaysia Turkey, Taiwan
Aluminium exports
Aluminium scrap exports are negligible as consumption of scrap in India is quite high, while the production is not very strong. A large proportion of the demand is served through substantial imports.
Over the last five years, the quantity of aluminium products exported has doubled. Exports of aluminium ingots have grown at a CAGR of 48% from FY2012-13 to FY2016-17.
As the capacity grew at a much faster rate vis-à-vis demand, export has risen at a CAGR of 30% in last five years that has transformed India from being a net importer to a net exporter of the base metal.
Import-export destinations - Top five
The following table lists down the top five import sources for aluminium and alloys and scrap imports and exports
0.25 0.3
0.60.7
1.1
0.2 0.2 0.2 0.20.1
0
0.5
1
1.5
2012-13 2013-14 2014-15 2015-16 2016-17
Export- Import trend of Ingots (mn tonnes)
Exports Imports

42 Indian Non-Ferrous Metals Industry - Way Forward
4.2.3 Key issues in import-export scenario
India-ASEAN Free Trade Agreement1
ASEAN’s exports of aluminium products to India have risen at a fast pace, whereas India effectively exports primary products to ASEAN countries and imports back finished products/scrap. As an example, India’s imports of aluminium wire (HS Code 7605) from Malaysia increased from 13 tonnes in 2012 to 15,354 tonnes in 2016. The imports of aluminium scrap (HS Code 7602) have increased by almost 200%.
Inverted Duty Structure- Aluminium2
• The inverted duty structure has adversely affected the domestic aluminium industry and has encouraged increased imports at the cost of the domestic industry
• Given the inverted duty structure, the import duty on some key ingredients used for aluminium manufacturing is higher than the primary metal itself
• The duty on the import of primary aluminium is 5% while the tax for raw materials are at higher rate
• Both caustic soda and aluminium fluoride attract a duty of 7.5%, while alumina and coal tar pitch come with an import duty of 5%
• This is in contrast to China, which imposes no import duty on Alumina
Thus, the prevailing inverted duty structure has resulted in higher Import duty on some key ingredients used for aluminium manufacturing, which is higher than the primary metal itself.
Figure 19: India’s Aluminium Wire and Aluminium Scrap Imports from Malaysia (KT)
Source:AvalonAnalysis&Industry
1ComTrade,TradeMap2AluminiummakerswantMIP,removalofinverteddutystructure-BusinessStandard,December26,2016
0.013 0.92.7
19.3
15.35
4.1 3.95.9
12.4 11.9
2012 2013 2014 2015 2016
Aluminium wire Aluminium scrap

43Indian Non-Ferrous Metals Industry - Way Forward
5. Copper
44 Indian Non-Ferrous Metals Industry - Way Forward
5. Copper
5.1 Current Status of Industry
5.1.1 Overview and Industry Structure
One of the oldest metals, copper is an important non-ferrous base metal used in industry-wide applications.
Compared to global markets, India has limited copper ore reserves, constituting to just about 2% of the world reserves.
India ranks seventh in global refined copper production and fifth in copper smelter production globally. In addition, the country is a net exporter of refined copper.
Hindustan Copper Limited (HCL) (public sector), Hindalco Limited and Vedanta Industries Limited (both private sector) are the three dominant players in the Indian copper market.
The copper industry operates under four categories as depicted below:

45Indian Non-Ferrous Metals Industry - Way Forward
5.1.2 Key raw material sourcing
Of the total global reserves of copper ores and concentrates, Chile alone accounts for about 30%, follwed by Australia and Peru. The aforementioned countries totally account for more than 50% of the global reserves.
Copper mines in India are less in number and are mainly concentrated in the states of Rajasthan, Madhya Pradesh, Bihar and Jharkhand. Rajasthan has the largest reserves of copper ore in the country. Hindustan Copper has all the operating copper mining leases in India.
Due to limited reserves availability in the country, India relies heavily on imports to fulfil ~ 96% of the demand of copper ore.
Figure 20: India’s Copper Industry Structure
Figure 21: Top 10 Countries by global copper ore reserves
•Ore Excavator•Hindustan Copper
Miners
•Orce Excavators, Smeltng and Refining•Hindustan Copper
Integerated Producers
•Smetlting and Refining•Hindalco and vedanta
Custom Smelters
•Many regional players manufacturing copper by recycling copper scrapSecondary Producers
1.5
3
3
4
4
5
6
11
12
29
11
20
20
28
30
35
46
81
89
210
Canada
Zambia
Congo
China
Russia
United States
Mexico
Peru
Australia
Chile
Top 10 countries by reserves and % share of global reserves
Reserves (in Million Tonnes)
% share of global reserves
Source:U.S.GeologicalSurvey,MineralCommoditySummaries,January2017,MoM

46 Indian Non-Ferrous Metals Industry - Way Forward
5.1.3 Overall Capacity
In India, copper companies buy copper ore (called concentrates) from international suppliers or they import it from their own mines in foreign countries.
5.1.4 Overall Production3 and Consumption4
Domestic production of refined copper has been growing at a robust CAGR of 13%, recording a level of production of 494 000’MT in FY 2012-13 to the highest level of production of 795 000’MT in FY 2016-17. Hindalco and Vedanta primarily dominate the Indian refined copper production.
Indian smelters are running at about 74% of their capacities, which is at the same level as of world capacity utilisation.
The primary copper consumption has seen a non-linear and only a marginal increase over the last decade. During 2007-16, primary copper consumption grew by only about 4%. Consumption rose from 2007 to 2010, declined during 2010-14 and then picked up again in the past two years. This is largely in line with the overall trajectory of the economy and the metals sector. The primary copper consumption decline is also in line with increased consumption of copper scrap.
Refined copper consumption in the Indian economy has recorded a CAGR of 2.51% from FY 2012-13 to FY 2016-17. There was a surge in the consumption during FY 2015-16 owing to a reported drop in LME Copper prices.
Figure 22: India’s Copper Production Installed Capacity
Figure 23: India’s Copper Production and Consumption
Source:CMIE,MoM,CompanyWebsite
Source:3CMIE,MoM,CompanyWebsite;4ICSGFactBook,CMIE54thEditionCopper-IBMMineralyearBook2015, (Part-II:Metals&Alloys)Page5-22(Table13),Page5-24(Table14);Page22,24MinistryofMinesAnnualReport2016-17
850 850 850 950 1000
2012-13 2013-14 2014-15 2015-16 2016-17
India's Copper Production Installed Capacity (in KT) Primary
494644
766 790 795
446 426 432 509643
FY 12-13 FY 13-14 FY 14 -15 FY 15-16 FY16-17
Copper Production and Consumption (000’MT) Refined Copper ProductionApparent Consumption

47Indian Non-Ferrous Metals Industry - Way Forward
56% 8% 7% 7% 6% 16%
0% 20% 40% 60% 80% 100%
Segmental % share in Copper consumption ( Tonnes)
Electrical and Telecommunication Transportation Consumer Durables
Building and Construction General Engineering Goods Other Industries Including ProcessIndustries
5.1.5 End use of copper in the Indian markets
Copper and copper alloys are transformed by downstream industries for use in end-use products such as automobiles, appliances, electronics, wires and cables and a whole range of other copper-dependent products.
Demand for primary copper has grown at a CAGR of 14% over the past five years, thanks to robust growth in the electrical sector and consumer durables segment.
Historically, refined Copper consumption growth remained above the GDP growth by ~1%.
• Major growth drivers - Industry and Construction sector
• Expected to be sixth largest copper market by 2020
India offers a huge growth potential for copper consumption over the next 20-25 years
Consumption by key sectors
India’s copper consumption largely comes from the electrical industry in contrast with the rest of the world.
The electrical and telecommunication applications consume more than half of the total copper consumed in India. The transportation sector is a distant second with an 8% share. The consumer durables and construction sectors, each consume about 7%, and engineering goods sector’s consumption is about 6%.
Figure 24: India’s Copper Industry End-use segments
Figure 25: Copper Consumption by End-Use Sector
Source:3CMIE,MoM,CompanyWebsite;4ICSGFactBook,CMIE54thEditionCopper-IBMMineralyearBook2015, (Part-II:Metals&Alloys)Page5-22(Table13),Page5-24(Table14);Page22,24MinistryofMinesAnnualReport2016-17
RACAutomobileWires/CablesElectrical
Transformers, Rotating
Equipment, Switchgears
House-Wires, Telecom
Cables Power & Control
Cables
Refrigeration, Air
conditioning compressors
Railways, Ordinance,
Alloy Products, Zari
Others
Auto Harness, Radiators
End-Use Segment
Source:CopperDevelopmentAssociation,Hindalco-BirlaCopper,MinistryofMines

48 Indian Non-Ferrous Metals Industry - Way Forward
Electrical and Telecommunication applications: Copper finds its typical use in electrical applications ranging from common electrical wiring to photovoltaic cells. Besides overhead transmission line wiring which uses aluminium, a majority of electrical wirings are still made from copper.
Busbars, conductors that distribute power, transformers, and motor windings also use copper owing to its conductivity. Additionally, copper is also used in the following : electronic connectors, printed circuit boards (PCBs), micro-chips, vaccum tubes, welding electrodes and electromagnets.
Copper is also one of the compoenents used in the production of wind turbines which can contain 4-5 metric tonne (MT) of the metal per wind mill. In terms of telecommunications applications, finely twisted copper wires are used in wiring for local area network (LAN) internet lines.
Transportation: In automobiles, copper and brass radiators and oil coolers are commonly used. Some of the modern uses of copper and its alloys in automotives industry include on-board navigation systems, anti-lock braking systems, and heated seats. Further, copper also forms a component of wiring for glass defrost systems, fittings, fasteners, and Brass screws, hydraulic lines, bronze sleeve bearings and wiring for window and mirror controls. The total weight of copper in a vehicle ranges from 15 kgs for a small-size car like hatchbacks to 30 kgs for a high-end vehicle.
The growing demand for hybrid and electric cars will further boost copper consumption. On an average, electric cars contain roughly 25 kgs of copper. Further, metal foils and copper chemicals are incorporated into both nickel-metal hydride and lithium-ion batteries that power fuel-efficient vehicles, while cast copper rotors have been used as an alternative to rare earth magnet motors.
Copper also find its use in high speed rail networks. High-speed trains can use up to 10 MT of copper per kilometre of track, whereas powerful locomotives contain as much as 8 MT of the base metal. Copper is also used in railway signalling systems.
Copper has some use in the aviation industry as about 2% of an airliner’s weight can be attributed to copper, which includes as much as ~190km of wiring.
Consumer Durables and Electronics: Consumer durables such as air conditioners and refrigerators make use of copper tubes as heat exchangers because of its excellent thermal conductivity and heat dissipation property.
The cathode ray tubes present in TVs as well as magnetron used in a microwave ovens are made of copper. The metal is also used in microprocessors and heat-sinks.
Construction: Copper tubing is now the standard material used for potable water and heating systems in buildings. This is largely due to its bacteriostatic properties i.e. copper’s ability to inhibit growth of bacterial and viral organisms in water.
Medical gas pipeline is an upcoming potential market for copper tubes.
In addition, the base metal is also used for decorative and architectural hardware in buildings. Copper alloys such as brass and bronze are particularly preferred for such applications.
The proposed affordable Housing for all programme will auger well for copper consumption demand in the building and construction sector.

49Indian Non-Ferrous Metals Industry - Way Forward
5.1.6 Secondary Copper
Many players in the copper downstream industry face challenges such as outdated technology, improper infrastructure, and high set up and funding cost and lack of skilled professionals.
Gujarat Copper Project (formerly known as Jhagadia Copper Limited, acquired by HCL), is into smelting and refining of secondary copper.
5.2 Import-Export Scenario
5.2.1 Import-Export of raw materials
Production and consumption of raw materials
India has limited copper mines that are mainly concentrated in the states of Rajasthan, Madhya Pradesh, Bihar and Jharkhand. India contributes only 0.2% to the world mined copper.
A drop in the production numbers were reported in FY 2014-15 as there was a steep fall of 21% in the Malanjkand mine, which contributes to about 65% of the copper ore production.
India is deficient in copper ores & concentrates owing to lack of copper mines in the country and thus heavily relies on imports to fulfil the industry’s needs.
One of the primary reasons for declining imports of copper ores and concentrates is the growing imports of refined copper and semi-fabricated copper products. Another reason for the fall in imports is the increasing protectionist curbs on exports by the Government of Indonesia3, a major exporter of copper ores and concentrates4. This is an alarming scenario as this means India engages in less copper refining, a high value and high margin process. The domestic industry is rather dependent more on low cost imports.
The domestic availability of copper concentrates satisfies only about 4% of the demand. Import meets bulk (about 96%) of the demand.
Figure 26: India’s Production of Copper ore
Source:AvalonAnalysis&Industry
3.13 2.92
3.77 3.593.15 3.29
0
1
2
3
4
2011-12 2012-13 2013-14 2014-15 2015-16 2016-17
Domestic Mine Production ( Mn Tonnes)
3TheGovernmentliftedthecurbinMarch20174FreeporttocutcopperoutputunlessIndonesialiftsexportban-FinancialTimes,HindustanCopperAnnualReports

50 Indian Non-Ferrous Metals Industry - Way Forward
Figure 27: India’s exports-imports of copper ores and concentrates
Source:AvalonAnalysis&Industry
Source:5IndianMineralsYearbook2016(Part-II:Metals&Alloys)55thEditionIndianBureauofMines,MinistryofMinesAnnualReport2016-17,CompanyAnnualReports(Vedanta,andNALCO),IndianMineralsYearbook2016(Part-I:GENERALREVIEWS)FOREIGNTRADE(ADVANCERELEASE)55thEdition
20 30 38 1 15 10
2,125 2,296
2,048
1,702 1,886 1,950
2011-12 2012-13 2013-14 2014-15 2015-16 2016-17
India's Exports-Imports of Copper Ores & Concentrates (in 000' Tonnes) Exports Imports
Major import sources and export destinations
India’s most important imports source for the import of copper ores and concentrates is the South American nation of Chile, the world’s largest producer.
India majorly exports to China, Singapore, Taiwan, Malaysia, South Korea, Oman, Indonesia and Saudi Arabia. During FY 2012-13 China imported 88% of India’s refined copper exports vis-à-vis to now China only imports 37% of India’s refined copper exports for FY2016-17.
Based on the data on imports and exports of Copper ores and concentrates over the past five years, India’s top five import sources and export destinations:
5.2.2 Import-Export of Copper products
Copper Imports
As recycled copper alone cannot meet the industry demands, India is dependent on copper produced from mineral ores. Since FY 2015-16, there been a substantial increase in the imports of unrefined copper. From FY 2015-16 to FY 2016-17, there has been a y-o-y increase in imports of unrefined copper by 25.20%. This is could be related to the increase in domestic consumption of refined copper as well.
S. No. Import Sources Export Destinations1. Chile China2. Indonesia South Korea3. Peru France4. Australia Germany5. Brazil Liberia

51Indian Non-Ferrous Metals Industry - Way Forward
Figure 28: India’s Copper Imports
Figure 29: India’s Copper Tube Imports
Top Five Import Sources
The following table lists the top five import sources for each category of copper imports as per the data for the past five years
India’s Copper tubes and pipes imports
India’s imports of copper tubes and pipes have grown at a CAGR of ~17% in the last decade.
Copper Exports
Due to the increase in copper supply and demand for copper, India has emerged as a net exporter of Refined Copper.
S. No. Primary Copper Copper Products Copper Scrap
1. Congo Zambia United Arab Emirates
2. Japan United Arab Emirates Saudi Arabia
3. Malaysia Malaysia United Kingdom
4. Zambia Vietnam United States
5. South Africa China Germany
204.3143.7 166.9 181.9 171.2
26.8 20.148.6
107.8135
2012-13 2013-14 2014-15 2015-16 2016-17
Imports of Copper Waste and Scrap, Unrefined Copper (000’MT) Copper Waste and ScrapUnrefined Copper
Source:AvalonAnalysis&Industry
Source:AvalonAnalysis&Industry
9 11 1120 18 19 22
2835.5
43
2007 2008 2009 2010 2011 2012 2013 2014 2015 2016
India's Copper Tubes and Pipes Imports (in KT)
52 Indian Non-Ferrous Metals Industry - Way Forward
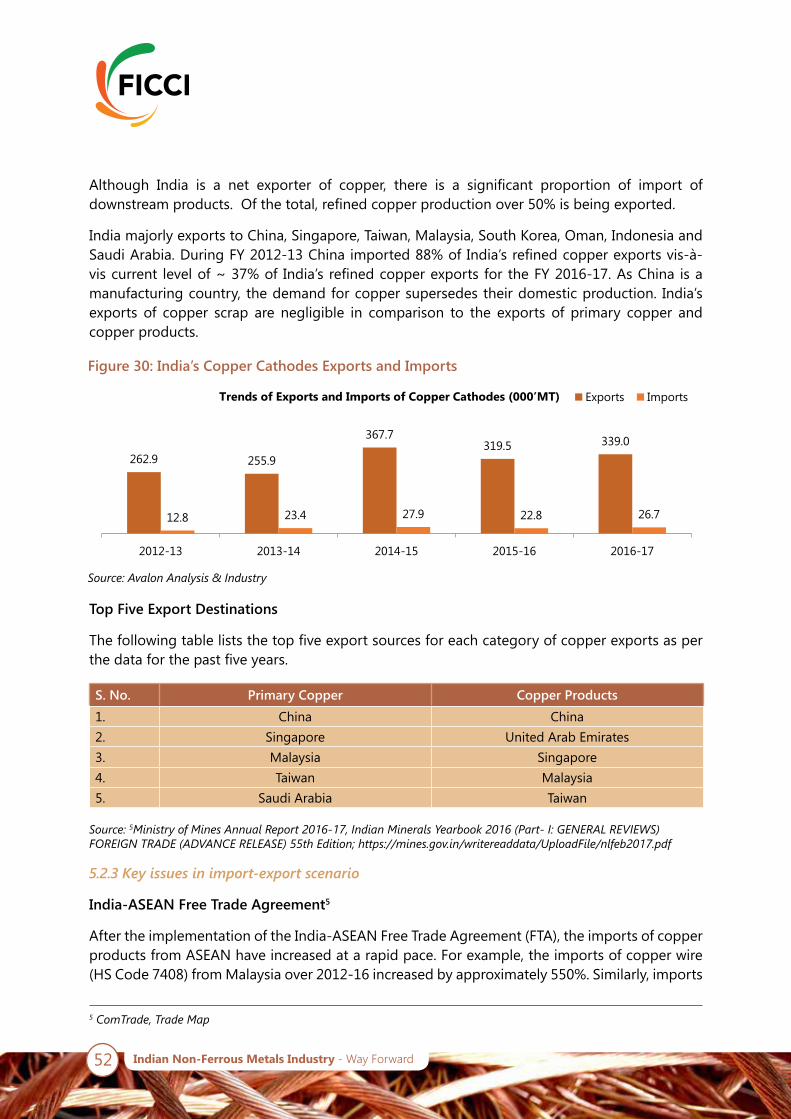
Although India is a net exporter of copper, there is a significant proportion of import of downstream products. Of the total, refined copper production over 50% is being exported.
India majorly exports to China, Singapore, Taiwan, Malaysia, South Korea, Oman, Indonesia and Saudi Arabia. During FY 2012-13 China imported 88% of India’s refined copper exports vis-à-vis current level of ~ 37% of India’s refined copper exports for the FY 2016-17. As China is a manufacturing country, the demand for copper supersedes their domestic production. India’s exports of copper scrap are negligible in comparison to the exports of primary copper and copper products.
Top Five Export Destinations
The following table lists the top five export sources for each category of copper exports as per the data for the past five years.
5.2.3 Key issues in import-export scenario
India-ASEAN Free Trade Agreement5
After the implementation of the India-ASEAN Free Trade Agreement (FTA), the imports of copper products from ASEAN have increased at a rapid pace. For example, the imports of copper wire (HS Code 7408) from Malaysia over 2012-16 increased by approximately 550%. Similarly, imports
Figure 30: India’s Copper Cathodes Exports and Imports
Source:AvalonAnalysis&Industry
Source:5MinistryofMinesAnnualReport2016-17,IndianMineralsYearbook2016(Part-I:GENERALREVIEWS)FOREIGNTRADE(ADVANCERELEASE)55thEdition;https://mines.gov.in/writereaddata/UploadFile/nlfeb2017.pdf
262.9 255.9
367.7319.5 339.0
12.8 23.4 27.9 22.8 26.7
2012-13 2013-14 2014-15 2015-16 2016-17
Trends of Exports and Imports of Copper Cathodes (000’MT) Exports Imports
S. No. Primary Copper Copper Products1. China China2. Singapore United Arab Emirates3. Malaysia Singapore4. Taiwan Malaysia5. Saudi Arabia Taiwan
5ComTrade,TradeMap
53Indian Non-Ferrous Metals Industry - Way Forward
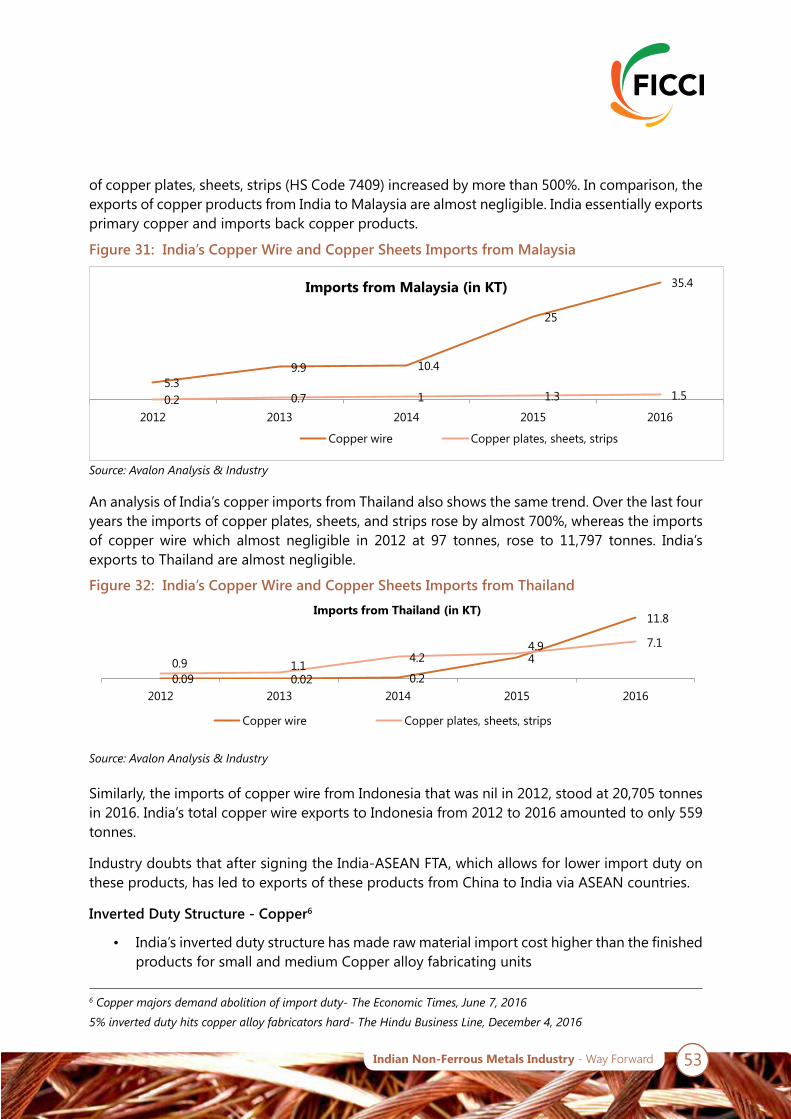
5.39.9 10.4
25
35.4
0.2 0.7 1 1.3 1.5
2012 2013 2014 2015 2016
Imports from Malaysia (in KT)
Copper wire Copper plates, sheets, strips
Figure 31: India’s Copper Wire and Copper Sheets Imports from Malaysia
Figure 32: India’s Copper Wire and Copper Sheets Imports from Thailand
Source:AvalonAnalysis&Industry
Source:AvalonAnalysis&Industry
of copper plates, sheets, strips (HS Code 7409) increased by more than 500%. In comparison, the exports of copper products from India to Malaysia are almost negligible. India essentially exports primary copper and imports back copper products.
Similarly, the imports of copper wire from Indonesia that was nil in 2012, stood at 20,705 tonnes in 2016. India’s total copper wire exports to Indonesia from 2012 to 2016 amounted to only 559 tonnes.
Industry doubts that after signing the India-ASEAN FTA, which allows for lower import duty on these products, has led to exports of these products from China to India via ASEAN countries.
Inverted Duty Structure - Copper6
• India’s inverted duty structure has made raw material import cost higher than the finished products for small and medium Copper alloy fabricating units
An analysis of India’s copper imports from Thailand also shows the same trend. Over the last four years the imports of copper plates, sheets, and strips rose by almost 700%, whereas the imports of copper wire which almost negligible in 2012 at 97 tonnes, rose to 11,797 tonnes. India’s exports to Thailand are almost negligible.
0.09 0.02 0.2
4
11.8
0.9 1.14.2
4.9 7.1
2012 2013 2014 2015 2016
Imports from Thailand (in KT)
Copper wire Copper plates, sheets, strips
6Coppermajorsdemandabolitionofimportduty-TheEconomicTimes,June7,2016
5%inverteddutyhitscopperalloyfabricatorshard-TheHinduBusinessLine,December4,2016
54 Indian Non-Ferrous Metals Industry - Way Forward
• This has affected the domestic industry adversely, leading to shutting down of domestic units and increase in imports of Copper products
• Under the inverted duty structure, the import of copper cathode and scrap, the basic raw material of the fabricating units, attracts a duty of 5%, while the finished products such as copper sheets, foils and tubes attracts Nil duty
• The inverted duty structure is counterproductive for domestic manufacturing as it incentivizes imports of finished goods rather than imports of raw material
55Indian Non-Ferrous Metals Industry - Way Forward
6. Lead
56 Indian Non-Ferrous Metals Industry - Way Forward
6. Lead
6.1 Current Status of Industry
6.1.1 Overview
One of the most recyclable and sustainable commodities, lead is a highly corrosion-resistant, ductile and malleable blue-grey metal.
Recycled lead accounts for more than 85% of total lead production in India. In fact, among all materials, metallic as well as non-metallic, lead has the highest recycling rate (about 98%) globally.
6.1.2 Key raw material sourcing
The top 10 countries account for about 95% of the total global reserves of lead ores and concentrates. Furthermore, the top two countries account for almost 60%. Australia alone accounts for 40% of the total global Lead ores and concentrates reserves. China is another major source with close to 20%.
India ranks seventh with about 2.5% of the total global reserves of the metal ores and concentrates in zinc – lead resource belt in Rajasthan.

57Indian Non-Ferrous Metals Industry - Way Forward
6.1.3 Overall Capacity
Primary lead is produced entirely by HZL that operates smelter at Chanderiya having capacity of 85,000 tpy and 100,000 tpy of lead metal (commissioned in 2012-13) at Dariba, respectively. Thus, the smelting capacity for lead (primary) in the country presently is 185,000 tpy.
6.1.4 Overall Production and Consumption of Primary lead
Lead output has seen sharp increase in the last few years due to more capacity utilisation. Lead consumption in any country is driven by automobile production. India has practically all the global players in passenger cars, two wheelers, coaches, SUVs etc., operating in the country and the production volumes have been increasing steadily. Telecom sector growth has also fuelled lead demand along with growth in electric vehicle market and renewable energy systems.
Demand for primary Lead has grown at a healthy pace of 7% CAGR during 2011-12 to 2016-17, which has led to an increase in production levels and capacity utilisation in the primary Lead industry.
Figure 33: Top 10 Countries by Global Lead Ore Reserves
Figure 34: India’s Lead Production Installed Capacity
2
2
2.3
2.5
6.4
5.7
7
7
19
40
1.6
1.6
2
2.2
5.6
5
6.3
6.4
17
35
Poland
Bolivia
Kazakhstan
India
Mexico
United States
Peru
Russia
China
Australia
Top 10 countries by reserves and % share of global reserves
Reserves (in Million Tonnes)
% share of global reserves
Source:U.S.GeologicalSurvey,MineralCommoditySummaries,January2017
Source:AvalonAnalysis&Industry
85
185 185 185 185 185
2011-12 2012-13 2013-14 2014-15 2015-16 2016-17
India's Lead Production Installed Capacity (in KT)

58 Indian Non-Ferrous Metals Industry - Way Forward
Figure 35: India’s Lead Production and consumption**
Figure 36: Lead Consumption by End-Use Sectors
98 125 130 135 152 144125185 162 188 200 232
0
200
400
2011-12 2012-13 2013-14 2014-15 2015-16 2016-17
India's Primary Lead Production and Apparent Consumption ( In 000'Tonnes) Production Consumption
Source:AvalonAnalysis&Industry
**Apparentconsumptionofleadduringtheyeariscalculatedonthebasisofproductionoflead(primary)andimports&exportsofrefinedlead(unwrought).Inadditiontothis,itisunderstoodthatlargequantitiesofrecycledleadwerealsoconsumedincertainotherindustries.
Officialconsumptionwas232KTin2016-17.However,asperindustryestimatestotalleadconsumptionforIndiaisindicatedas1.0milliontonnes,includingprimaryproduction,secondaryproductionaswellasimports.
6.1.5 Consumption by key sectors6
Automotive demand will continue to ‘lead’, while industrial battery segment to add impetus.
Electric vehicles and renewable energy are high thrust areas of the Government and once these areas expand; lead acid battery sector will make significant inroads.
Increasing vehicle production, e-bikes, infrastructure development, new telecoms networks and inverter consumption will continue to support lead demand growth.
Batteries: Lead has many other applications, the largest of which is in the manufacture of storage batteries. In the lead-acid storage batteries, grid or plate is made of Lead or a lead alloy such as with antimony.
74% 9% 8% 3%2%
4%
0% 10% 20% 30% 40% 50% 60% 70% 80% 90% 100%
Segement % share in total Lead consumption in Tonnes
Batteries Pigments and compounds Rolled and extruded ProductsAlloys Cable, Sheathing Other Industries
Source:6Table“TotalRefinedMetal”Page18fromHZL_Final_Annual_Report_16-17.AlsoVerifiedbothPrimaryLeadProductionandconsumptionfrom54thEditionLEAD&ZINC-IBMMineralyearBook2015,(Part-II:Metals&Alloys)Page10-14(Table14),Page10-17(Table18);53rdEditionLEAD&ZINCIBMMineralyearBook2014,(Part-II:Metals&Alloys)Page10-11(Table14),Page10-14(Table18);Page22,24MinistryofMinesAnnualReport2016-17

59Indian Non-Ferrous Metals Industry - Way Forward
About 75% of lead produced finds its use in manufacturing of lead acid batteries, specially the one used in automobiles, motorcycles, electric cars and bicycles.
Industrial products:
By virtue of its resistance to chemical corrosion, lead sheet also finds use for the lining of chemical treatment baths, acid plants and storage vessels. Since Lead effectively absorbs electromagnetic radiation of short wavelengths, finds use as a protective shielding around nuclear reactors, particle accelerators, X-ray equipment, and containers used for transporting and storing radioactive materials.
Lead Alloys’ applications: Lead forms alloys with many metals. The alloys formed with tin, copper, arsenic, antimony, bismuth, cadmium, and sodium are all of industrial importance. Lead alloy find it usage in making of bearings, solder, antifriction metals, and type metal. Soft solders are largely Lead-tin alloys with or without antimony while fusible alloys are various combinations of Lead, tin, bismuth, cadmium and other low melting point metals.
Lead alloys finds usage in making of lead foil. Lead is also used for making bullets and shots for firearms. White lead, lead sulfate, and lead chromate are used as colouring elements in paints and ceramic glazes. Lead telluride, lead antimonide, and lead selenide are some of the lead-based semiconductors, which are used in photovoltaic (solar energy) cells and infrared detectors.
6.1.6 Secondary Lead
India also recycles lead from the inevitable waste arising like used lead batteries, scrap etc., in an environment- friendly manner
It is reported that Pondy Oxides & Chemicals also uses lead scrap along with concentrates as feedstock at its 17,000 tpy smelter and its subsidiary company has capacity to refine metal to the tune of 12,000 tpy.
The ever-increasing demand for lead, especially from the lead acid battery market is met to an extent by the flourishing lead scrap recycling market.
In addition to primary production, a majority of the demand is met through secondary production, which accounts for around 85% of the total production.
6.2 Import-Export Scenario
6.2.1. Import-Export of Raw materials7
An analysis of exports and imports of lead ores and concentrates over the past five years shows an erratic behaviour. While India’s exports used to be significantly higher than the imports, there has been a steep decline in the exports, with only the year 2011-12 being an exception.
Over the past five years, India’s exports have been extremely low, with the high of about 500 tonnes in 2014. This is in drastic contrast to exports of about 129,000 tonnes as recently as 2010.
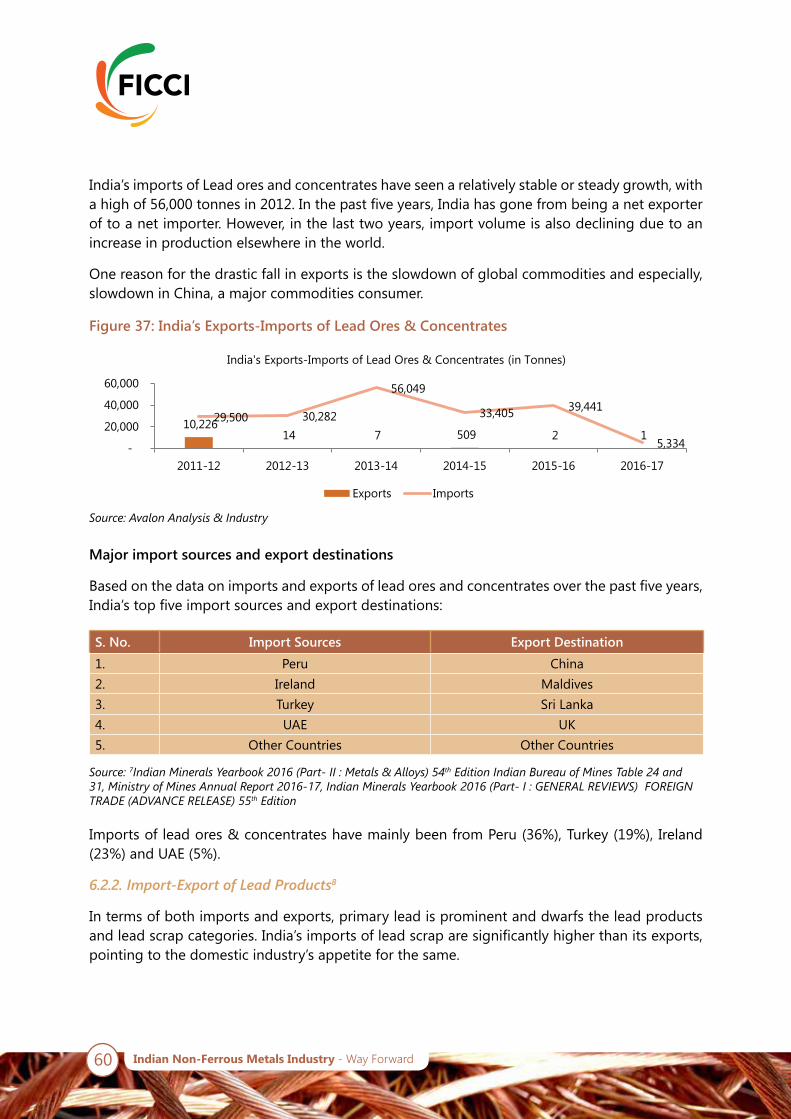
60 Indian Non-Ferrous Metals Industry - Way Forward
India’s imports of Lead ores and concentrates have seen a relatively stable or steady growth, with a high of 56,000 tonnes in 2012. In the past five years, India has gone from being a net exporter of to a net importer. However, in the last two years, import volume is also declining due to an increase in production elsewhere in the world.
One reason for the drastic fall in exports is the slowdown of global commodities and especially, slowdown in China, a major commodities consumer.
Major import sources and export destinations
Based on the data on imports and exports of lead ores and concentrates over the past five years, India’s top five import sources and export destinations:
Imports of lead ores & concentrates have mainly been from Peru (36%), Turkey (19%), Ireland (23%) and UAE (5%).
6.2.2. Import-Export of Lead Products8
In terms of both imports and exports, primary lead is prominent and dwarfs the lead products and lead scrap categories. India’s imports of lead scrap are significantly higher than its exports, pointing to the domestic industry’s appetite for the same.
Figure 37: India’s Exports-Imports of Lead Ores & Concentrates
Source:AvalonAnalysis&Industry
Source:7IndianMineralsYearbook2016(Part-II:Metals&Alloys)54thEditionIndianBureauofMinesTable24and31,MinistryofMinesAnnualReport2016-17,IndianMineralsYearbook2016(Part-I:GENERALREVIEWS)FOREIGNTRADE(ADVANCERELEASE)55thEdition
10,226 14 7 509 2 1
29,500 30,282
56,049
33,405 39,441
5,334 -
20,000
40,000
60,000
2011-12 2012-13 2013-14 2014-15 2015-16 2016-17
India's Exports-Imports of Lead Ores & Concentrates (in Tonnes)
Exports Imports
S. No. Import Sources Export Destination1. Peru China2. Ireland Maldives3. Turkey Sri Lanka4. UAE UK5. Other Countries Other Countries
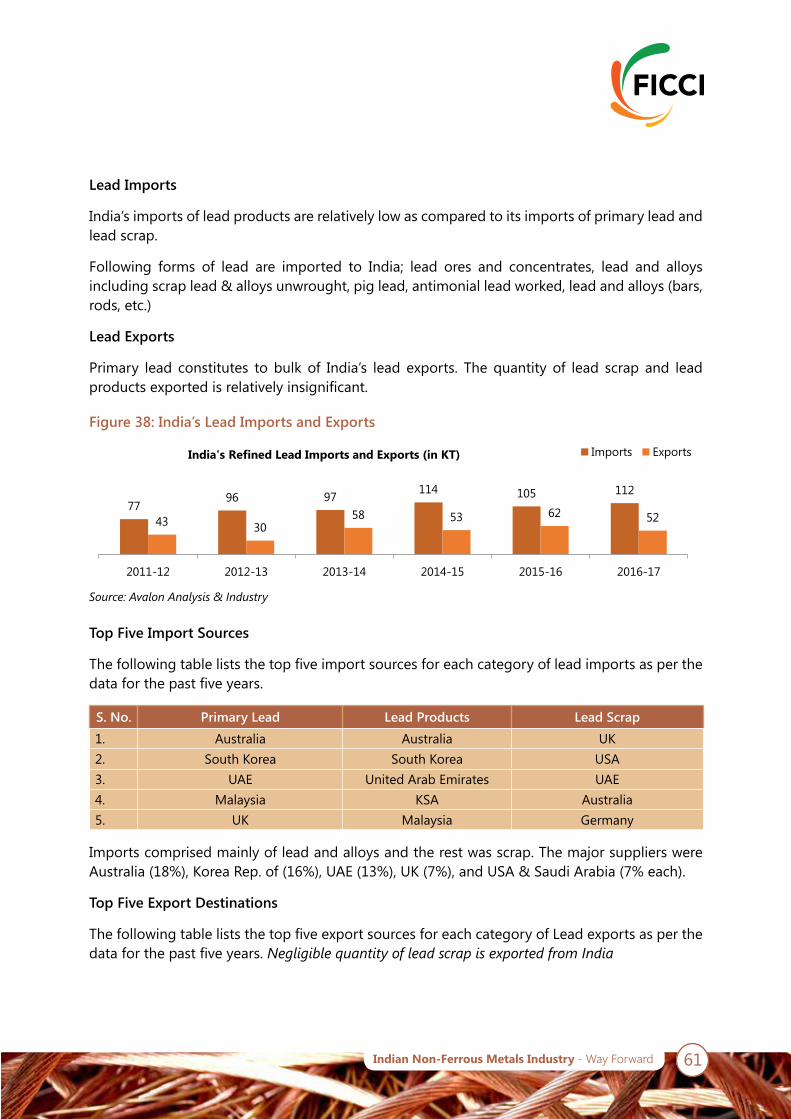
61Indian Non-Ferrous Metals Industry - Way Forward
S. No. Primary Lead Lead Products Lead Scrap1. Australia Australia UK2. South Korea South Korea USA3. UAE United Arab Emirates UAE4. Malaysia KSA Australia5. UK Malaysia Germany
Lead Imports
India’s imports of lead products are relatively low as compared to its imports of primary lead and lead scrap.
Following forms of lead are imported to India; lead ores and concentrates, lead and alloys including scrap lead & alloys unwrought, pig lead, antimonial lead worked, lead and alloys (bars, rods, etc.)
Lead Exports
Primary lead constitutes to bulk of India’s lead exports. The quantity of lead scrap and lead products exported is relatively insignificant.
Top Five Import Sources
The following table lists the top five import sources for each category of lead imports as per the data for the past five years.
Imports comprised mainly of lead and alloys and the rest was scrap. The major suppliers were Australia (18%), Korea Rep. of (16%), UAE (13%), UK (7%), and USA & Saudi Arabia (7% each).
Top Five Export Destinations
The following table lists the top five export sources for each category of Lead exports as per the data for the past five years. NegligiblequantityofleadscrapisexportedfromIndia
Figure 38: India’s Lead Imports and Exports
Source:AvalonAnalysis&Industry
7796 97 114 105 112
43 3058 53 62 52
2011-12 2012-13 2013-14 2014-15 2015-16 2016-17
India's Refined Lead Imports and Exports (in KT) Imports Exports

62 Indian Non-Ferrous Metals Industry - Way Forward
S. No. Refined Lead, Unwrought Lead Products1. Australia Germany2. Korea UK3. Canada Netherland4. UK Ireland5. Belgium Czech Republic
Source:8TradeMap,ComTrade,IndianMineralsYearbook2016(Part-II:Metals&Alloys)54thEditionIndianBureauofMinesMinistryofMinesAnnualReport2016-17,IndianMineralsYearbook2016(Part-I:GENERALREVIEWS)FOREIGNTRADE(ADVANCERELEASE)55thEditionIndianBureauofMinesMinistryofMines
6.2.3 Key issues in import-export scenario
India-ASEAN Free Trade Agreement7
India’s import of lead products has largely been on a growth path for last five years except for 2015-16. This is due to India’s FTAs with countries like Korea and Japan, which makes zinc imports from these countries at near zero duty.
About 70% of ore is imported at near zero duty compared to the duty of 2.5% on raw material imports due to CEPA.
Inverted Duty Structure
• The duty on the ore/ concentrate is 2.5% and it is zero duty for finished goods, thus creating a situation of inverted duty structure
• The industry is incurring high duty incidence on the raw materials consumed in the manufacturing of finished goods for export.
• Recovery of duty drawback at 1.5% in lieu of raw materials consumed in manufacturing is insufficient.
7ComTrade,TradeMap

63Indian Non-Ferrous Metals Industry - Way Forward
7. Zinc

64 Indian Non-Ferrous Metals Industry - Way Forward
7. Zinc
7.1 Current Status of Industry
7.1.1 Key raw material sourcing
The top 10 countries account for >~ 85 % of the total reserves of zinc ores and concentrates. The reserves of the top two countries amount to approximately half of the total global reserves. Australia, the holder of largest reserves, alone accounts for a little less than 30%. China, the next major holder of reserves has about 18%. India’s overall reserves ranks seventh and has about a 4.5% of the world total global reserves.
1.4
2
2.6
4.5
5
5
8
11
18
29
3
4
5.7
10
11
11
17
25
40
63
Sweeden
Bolivia
Canada
India
United States
Kazakhstan
Mexico
Peru
China
Australia
Top 10 countries by reserves and % share of global reserves
Reserves (in Million Tonnes)
% share of global reserves
Figure 39: Top 10 Countries by Global Zinc Ore Reserves
Source:U.S.GeologicalSurvey,MineralCommoditySummaries,January2017
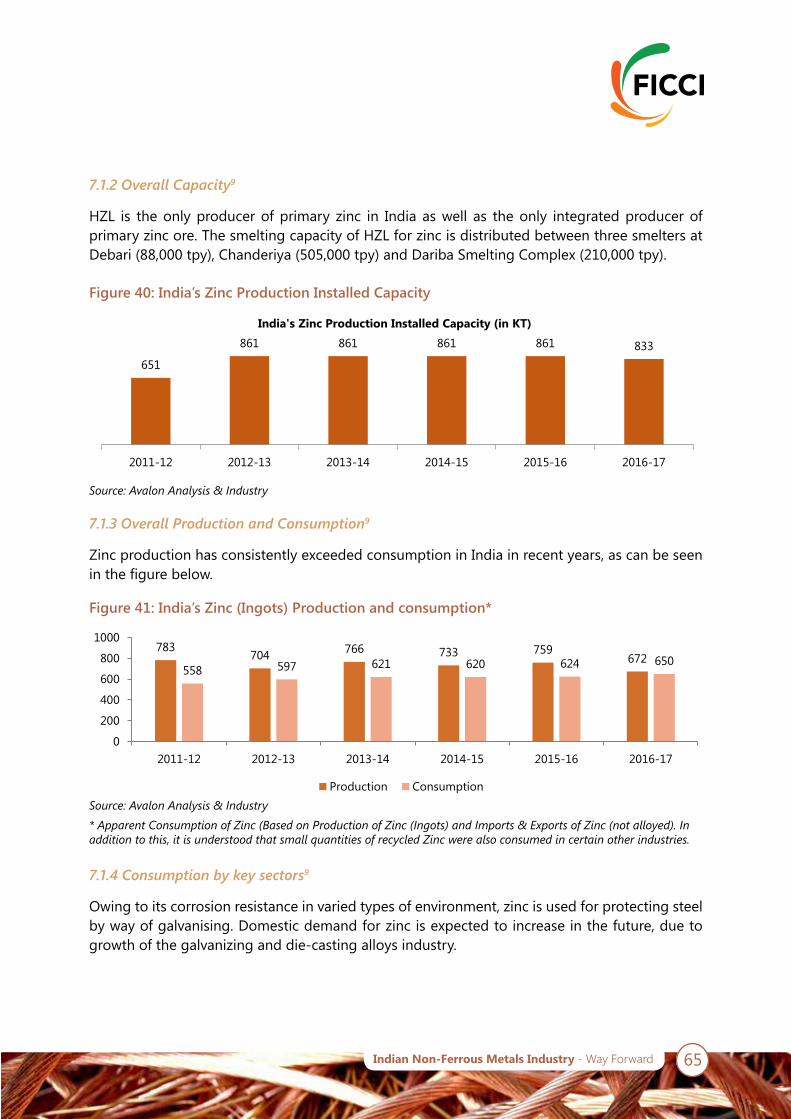
65Indian Non-Ferrous Metals Industry - Way Forward
7.1.2 Overall Capacity9
HZL is the only producer of primary zinc in India as well as the only integrated producer of primary zinc ore. The smelting capacity of HZL for zinc is distributed between three smelters at Debari (88,000 tpy), Chanderiya (505,000 tpy) and Dariba Smelting Complex (210,000 tpy).
7.1.3 Overall Production and Consumption9
Zinc production has consistently exceeded consumption in India in recent years, as can be seen in the figure below.
7.1.4 Consumption by key sectors9
Owing to its corrosion resistance in varied types of environment, zinc is used for protecting steel by way of galvanising. Domestic demand for zinc is expected to increase in the future, due to growth of the galvanizing and die-casting alloys industry.
Figure 40: India’s Zinc Production Installed Capacity
Figure 41: India’s Zinc (Ingots) Production and consumption*
Source:AvalonAnalysis&Industry
Source:AvalonAnalysis&Industry
*ApparentConsumptionofZinc(BasedonProductionofZinc(Ingots)andImports&ExportsofZinc(notalloyed).Inadditiontothis,itisunderstoodthatsmallquantitiesofrecycledZincwerealsoconsumedincertainotherindustries.
651
861 861 861 861 833
2011-12 2012-13 2013-14 2014-15 2015-16 2016-17
India's Zinc Production Installed Capacity (in KT)
783704 766 733 759
672558 597 621 620 624 650
0
200
400
600
800
1000
2011-12 2012-13 2013-14 2014-15 2015-16 2016-17
Production Consumption

66 Indian Non-Ferrous Metals Industry - Way Forward
Figure 42: Zinc Consumption by End-Use Sectors
Source:AvalonAnalysis&Industry
57% 16% 14% 7% 6%
0% 10% 20% 30% 40% 50% 60% 70% 80% 90% 100%
Segment % share in total consumption (Tonnes)
Galvanising Coatings Die Casting Alloys Oxides & Chemicals Extruded Products
In comparison to the demand arising from the galvanising industry, demand from other end-user segments such as zinc oxides/chemicals, brass and dry cell industry is expected to rise at a marginally slower pace.
Galvanising: Zinc is primarily used in galvanisation of steel in order to prevent rusting. Galvanised steel is used for car bodies, street lampposts, safety barriers, suspension bridges, telecom towers, transmission line towers, railway electrification towers, steel pipes, steel sheets, steel wires and steel fasteners.
Zinc also finds its use in production of die-castings, important in the automobile, electrical and hardware segments. Zinc is also used in alloys such as brass, nickel silver and aluminium solder. Zinc can be used to make batteries such as zinc-manganese batteries and zinc air batteries.
7.1.5 Secondary Zinc
Industry experts estimate that globally, 30% of zinc is recycled/recovered from galvanized steel scrap, EAF dust, zinc ash, zinc dross, etc. Since zinc production is a power intensive process, the lower consumption of power, usage of cheap scrap, dross or ash and low overheads offer the secondary players a competitive edge, over the primary producers.
Source: 9Table “Total Refined Metal” Page 15 of HZL_Final_Annual_Report_15-16; Page 18 of HZL_Final_Annual_Report_16-17;Page10-2,10-14 (Table15),10-15,10-18of54thEditionLEAD&ZINC-IBMMineralyearBook2015(Part- II: Metals & Alloys); Page 10-13(Table 18), Page 10-18 (Table 19) 53rd Edition LEAD & ZINC IBM Mineralyear Book 2014, (Part- II:Metals&Alloys); Page 10-11 (Table 15), Page 10-15 (Table 19) of 52nd Edition LEAD&ZINCIBMMineralyearBook2014, (Part- II:Metals&Alloys);Page22,24MinistryofMinesAnnualReport2016-17; http://www.ilzsg.org/static/enduses.aspx?from=1
7.2 Import-Export Scenario
7.2.1. Import-Export of raw materials 10
For the past three years, India’s imports and exports of zinc ores and concentrates have declined.
One reason for the fall in exports is a slowdown in the steel sector in China, which is a major consumer of India’s zinc ores and concentrates exports and increasing domestic consumption.
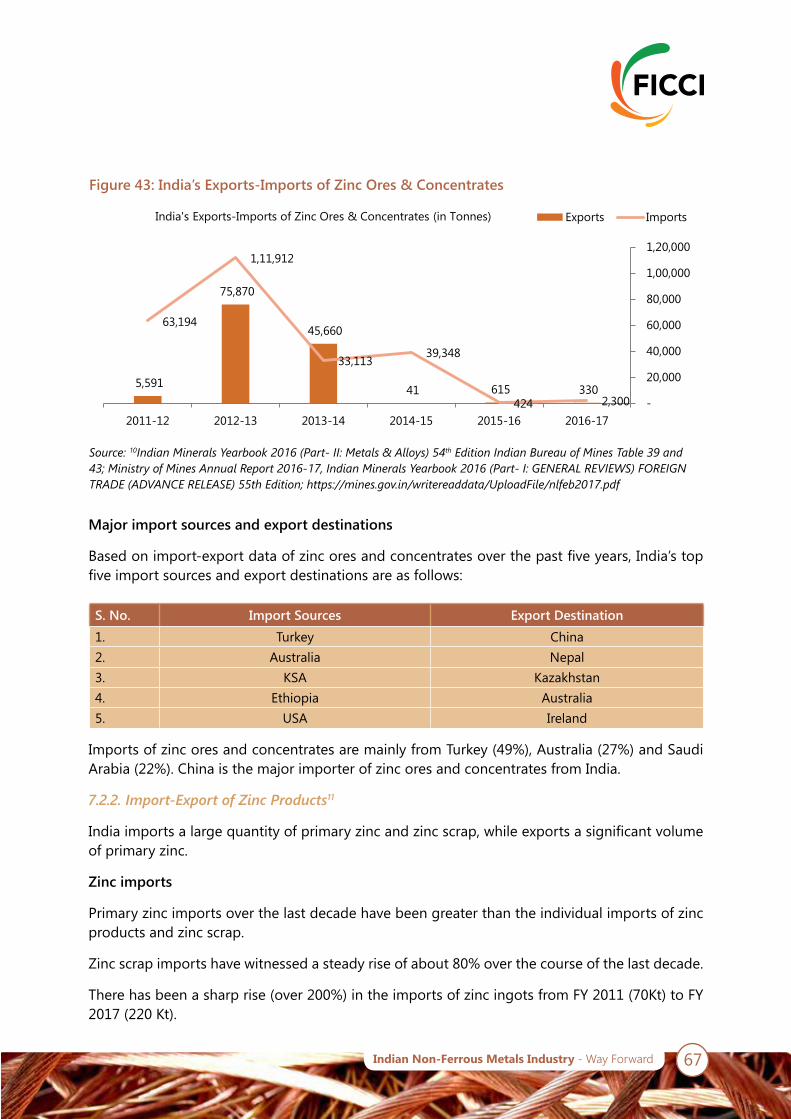
67Indian Non-Ferrous Metals Industry - Way Forward
Figure 43: India’s Exports-Imports of Zinc Ores & Concentrates
Major import sources and export destinations
Based on import-export data of zinc ores and concentrates over the past five years, India’s top five import sources and export destinations are as follows:
Imports of zinc ores and concentrates are mainly from Turkey (49%), Australia (27%) and Saudi Arabia (22%). China is the major importer of zinc ores and concentrates from India.
7.2.2. Import-Export of Zinc Products11
India imports a large quantity of primary zinc and zinc scrap, while exports a significant volume of primary zinc.
Zinc imports
Primary zinc imports over the last decade have been greater than the individual imports of zinc products and zinc scrap.
Zinc scrap imports have witnessed a steady rise of about 80% over the course of the last decade.
There has been a sharp rise (over 200%) in the imports of zinc ingots from FY 2011 (70Kt) to FY 2017 (220 Kt).
5,591
75,870
45,660
41 615 330
63,194
1,11,912
33,113 39,348
424 2,300
2011-12 2012-13 2013-14 2014-15 2015-16 2016-17 -
20,000
40,000
60,000
80,000
1,00,000
1,20,000
India's Exports-Imports of Zinc Ores & Concentrates (in Tonnes) Exports Imports
Source:10IndianMineralsYearbook2016(Part-II:Metals&Alloys)54thEditionIndianBureauofMinesTable39and43;MinistryofMinesAnnualReport2016-17,IndianMineralsYearbook2016(Part-I:GENERALREVIEWS)FOREIGNTRADE(ADVANCERELEASE)55thEdition;https://mines.gov.in/writereaddata/UploadFile/nlfeb2017.pdf
S. No. Import Sources Export Destination1. Turkey China2. Australia Nepal3. KSA Kazakhstan4. Ethiopia Australia5. USA Ireland

68 Indian Non-Ferrous Metals Industry - Way Forward
Zinc exports
Primary zinc accounts for the bulk of overall exports. In line with other metal scraps, zinc scrap exports are minuscule, both in relative and absolute terms.
7.2.3 Key issues in India’s import-export scenario
India-ASEAN Free Trade Agreement8
Indian zinc production is more than sufficient to meet the domestic demand (650Kt). However, due to India’s FTAs with countries like Korea and Japan, ~120Kt of zinc is imported at near zero duty.
Top five import sources
The following table lists the top five import sources for each category of zinc imports as per the data available for the last five years
Top Five Export Destinations
The following table lists out the top five export sources for each category of zinc exports as per the data available for the last five years. Negligible quantity of zinc scrap is exported from India.
Figure 44: India’s Zinc Imports and exports
Source:AvalonAnalysis&Industry
61 83 79166 168 188
286188 195 246 258 270
2011-12 2012-13 2013-14 2014-15 2015-16 2016-17
India's Zinc& alloys Imports and Exports (in KT) Imports Exports
S. No. Primary Zinc (Spelter) Zinc & Alloys Zinc Scrap1. South Korea South Korea USA2. Kazakhstan Australia KSA3. UAE UAE UAE4. Belgium Kazakhstan Mexico5. Namibia Spain Netherlands
S. No. Zinc & Alloys1. China2. South Korea3. Taiwan4. UAE5. Turkey
8ComTrade,TradeMap

69Indian Non-Ferrous Metals Industry - Way Forward
About 70% of zinc imports are from Korea at Nil duty compared to the duty of 2.5% on raw material imports due to India-Korea CEPA. In essence, raw materials are being heavily taxed, while finished good are being imported tax free.
Inverted Duty Structure
• The duty on the ore/ concentrate is 2.5% and it is zero duty for finished goods, thus creating a situation of inverted duty structure
• The industry is incurring high duty incidence on the raw materials consumed in the manufacturing of finished goods for export and recovery of duty at 1.5% is insufficient.
• Due to increasing imports, Indian manufacturers are compelled to export the excess capacity of zinc
• Recovery of duty drawback in lieu of raw materials consumed in manufacturing is insufficient
Pricing of zinc metal is concurrent with the LME. Zinc producers are ‘price-takers’ and do not have any control on prices.

70 Indian Non-Ferrous Metals Industry - Way Forward

71Indian Non-Ferrous Metals Industry - Way Forward
8. Non-ferrous metals: Secondary Industry
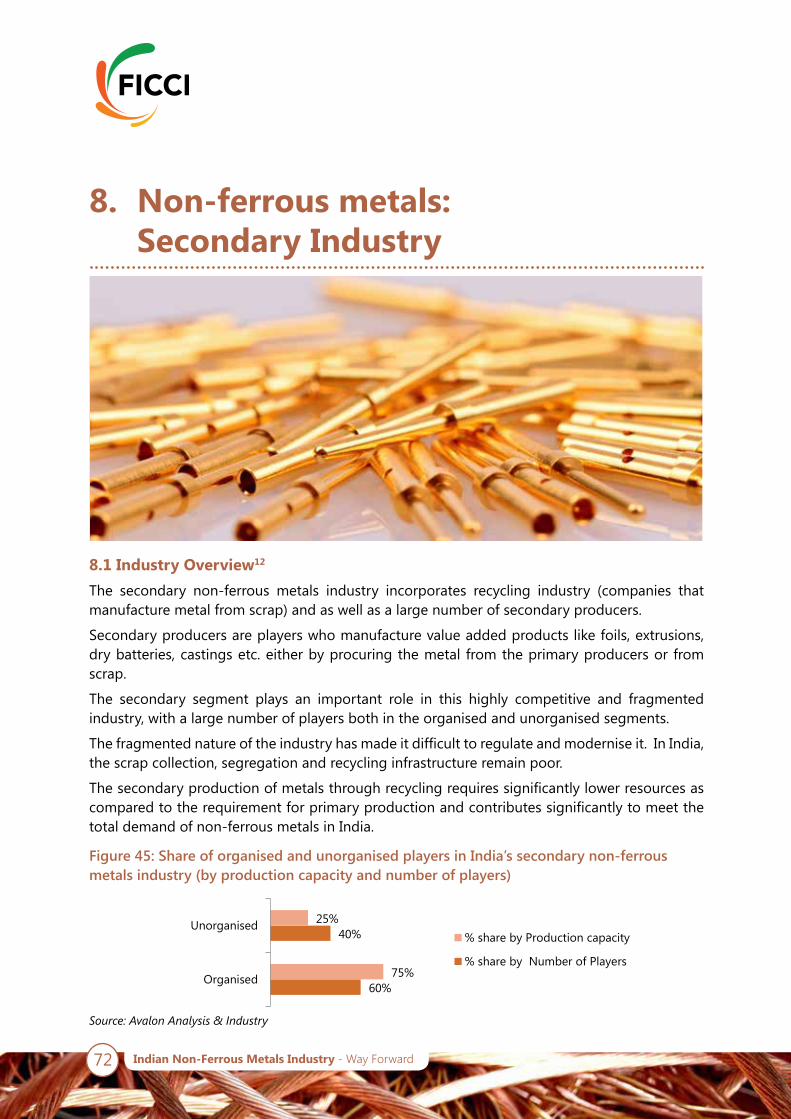
72 Indian Non-Ferrous Metals Industry - Way Forward
8. Non-ferrous metals: Secondary Industry
8.1 Industry Overview12
The secondary non-ferrous metals industry incorporates recycling industry (companies that manufacture metal from scrap) and as well as a large number of secondary producers.
Secondary producers are players who manufacture value added products like foils, extrusions, dry batteries, castings etc. either by procuring the metal from the primary producers or from scrap.
The secondary segment plays an important role in this highly competitive and fragmented industry, with a large number of players both in the organised and unorganised segments.
The fragmented nature of the industry has made it difficult to regulate and modernise it. In India, the scrap collection, segregation and recycling infrastructure remain poor.
The secondary production of metals through recycling requires significantly lower resources as compared to the requirement for primary production and contributes significantly to meet the total demand of non-ferrous metals in India.
Figure 45: Share of organised and unorganised players in India’s secondary non-ferrous metals industry (by production capacity and number of players)
Source:AvalonAnalysis&Industry
60%
40%
75%
25%
Organised
Unorganised% share by Production capacity
% share by Number of Players

73Indian Non-Ferrous Metals Industry - Way Forward
Share of scrap metal in respective overall metal production
The scrap metal demand for non-ferrous metals production in India is substantial. It is expected to grow as it is an environmental friendly process.
As India is likely to produce more non-ferrous metals and as infrastructure for scrap collection and segregation improve, the share of metal production from recycled metal is only expected to rise.
The recycling industry is an important part of the overall ecosystem and is required for the long-term sustainability of the industry.
By the year 2020, domestic scrap generation is expected to touch 6.5 million tonnes, whereas demand would be about 7.9 million tonnes, creating a deficit of 1.4 million tonnes
Figure 47: Secondary Metal share in Total Size of non-ferrous metals industry (2016-17)
Source:Page24Table“Shareoftherecyclingindustry”fromtheArticle”Non-ferrousMetalsindustry:Buildingthefuture_KPMGSept2017;MRAI
**Calculatedbasedonexpertsinput
Source:12IBMMineralyearBook2015,(Part-II:Metals&Alloys)54thEdition,PublishedonJuly2017;IndianMineralsYearbook2016;(Part-I:GENERALREVIEWS)55thEdition;FOREIGNTRADE(ADVANCERELEASE),ILZSGPressRelease,ILZSG,July2017/July2017;
30%20%
85%
10%
31%17%
58%
8%
Aluminium Copper Lead Zinc
Share of the recycling industry of overall production in TonnesIndia share Global Share
2.860.79 0.14 0.674.09 0.99 0.93 0.74
3.48
0.96 0.96 0.7
30%20%
85%
10%
0%
20%
40%
60%
80%
100%
0
1
2
3
4
5
Aluminium Copper Lead Zinc **
Total Size of non-ferrous metals industry (2016-17) (in Mn Tonnes)
Primary Production Total Production Total Demand Recycling Share
Figure 46: Share of the recycling industry

74 Indian Non-Ferrous Metals Industry - Way Forward
8.2 NFM Scraps Imports into India
India’s non-ferrous scrap import in FY 2016 was to the tune of ~1.1 million tonnes, an increase of ~20% as compared with FY 2015.
Given that there is room for improvement in scrap collection and recycling infrastructure in India, the domestic industry is highly dependent on scrap imports to meet the non-ferrous metals demand.
The significance of secondary industry globally is evident from the fact that about a third of aluminium production comes from recycled scrap. About half of global lead production comes from secondary lead.
Scrap imports would be possible only through the above listed designated ports and no exceptions are allowed even in case of EOUs, SEZs.
The major ports of imports for non-ferrous metal scraps are Nhava Sheva (Mumbai) port, which accounts for up to 50% of the total and Kandla port, which accounts for a further 15-20%.
Recommendations for safer and swifter import of scrap
• North America, Europe and Japan constitute a bulk of India’s imported non-ferrous metals scrap. Given the fact that these countries have advanced scrap collection, segregation and processing infrastructure, scrap imported from these regions should be exempted from the requirement of obtaining PSICs.
• Functional scanners to be placed in all designated ports for scrap imports - to scan the scrap for any radioactive substances and other prohibited materials. Once all the designated ports have these inspection scanners functional, the requirement for PSICs should be done with away altogether.
List of approved ports and ICDs for scrap imports
Source:HandbookofProceduresDGFTFTP2015-20
S. No. Ports/ICD1. Chennai2. Ennore3. Cochin4. JNPT5. Kandla6. Kolkata7. Mormugao8. Mumbai9. Mundra
S. No. Ports/ICD S. No. Ports/ICD
10. New Mangalore11. Paragraphdip12. Pipava13. Tuticorin14. Vishakhapatnam15. ICD Loni, Ghaziabad16. ICD Ludhiana
17.ICD Dadri (Greater Noida)
18. ICD Nagpur19. ICD Jodhpur20. ICD Jaipur21. ICD Udaipur22. CFS Mulund23. ICD Ahmedabad24. ICD Malanpur25. ICD Pitampur26. ICD Kanpur

75Indian Non-Ferrous Metals Industry - Way Forward
8.3 Metal recycling policy
India has witnessed strong growth in the recycling industry since 2010.
Focus on metals recycling has increased rapidly due to the growing emphasis on environment conservation and sustainable development.
This has increased metal recycling share in the total metal production significantly with time, and is almost in parity with the global level.
Given the nature of its huge population, India generates large volumes of non-segregated scrap, of which, a significant portion constitutes metals that can be reused for processing.
India imports a significant quantity of metals scrap as the supply side is not adequate to meet the demand. There is also largely unorganised scrap collection and insufficient awareness, leading to a major proportion of scrap going to landfills rather than recycling.
Furthermore, while regulations exist to govern the scrap recycling industry, these regulations are inconsistently enforced due to the unorganized nature of the industry.
The Government may consider the following aspects that, if they can be consistently applied to the scrap recycling industry as a whole, will result in accelerated adoption of recycled metals.
• Ensure maximum recovery of scrap to meet the domestic demand
o Trade deficits can be drastically reduced by ensuring high domestic recovery of scrap and there by slowly reducing scrap and metal imports
o Natural resource conservation and energy savings can be grown by adequate metal scrap recycling
o Recycling industry needs to be promoted with carbon credits for better recycling
• Quality issues:
o There are at times issues related to aluminium products made from secondary routes
o Some policy on certification of major/key products should be introduced irrespective of manufacturing route taking
o The Government should take strong measures to ensure that substandard products do not enter Indian markets for general consumption
o More laboratories approved by BIS for testing Non-Ferrous and other materials as per the BIS standard and specification in order to improve the quality of the product and help the consumers to know the products that they are procuring
• Employment of unskilled labour
o Most people involved in informal recycling are the urban poor with low literacy levels, and have very little awareness regarding the hazards of non-ferrous metal waste and the recycling processes
76 Indian Non-Ferrous Metals Industry - Way Forward
o There is a need to broadly enforce regulations that prevent the entry of child labour into the NFM waste market- its collection, segregation and distribution
• Proper Scrap collection and segregation Center
o Promotion of a formal collection and shredding mechanism for end of life products that are sources of metal scrap
o Define end of life criteria and set up shredding centres
o Formation of specially designated zones/areas for Metals Recycling on outskirts of each major city
• Development of better resource generation and infrastructure in the recycling industry
o Generation of new sources of revenue and employment for the Government
o Around 1 million people are employed in the recycling industry currently and this figure can multiply if supported by enabling policies
o Induction and promotion of appropriate technologies indigenously or through joint ventures is required to be promoted for preparation of downstream products and alloys
o Contribution and promotion of ‘Clean India’ campaign by developing recycling zones
• Review on import duties and tax credit on scrap value chain
o Import duties on scrap should be reviewed to help make secondary production more competitive in India
o At present there is no provision of providing any input tax credit to stakeholders present in scrap recycling value chain
o Stakeholders have to pay the tax twice i.e. first time on the purchase of input material and second time on the product sold thus leading to multiple taxation
o The Government should consider tax credit to the stakeholder on the input material purchased as previous stakeholder in value chain has already paid the taxes on the finished product

77Indian Non-Ferrous Metals Industry - Way Forward
9. An International Perspective

78 Indian Non-Ferrous Metals Industry - Way Forward
9. An International Perspective9
1. Strategically important industry status
The Government of China categorises the non-ferrous metals industry to be of strategic importance for the country’s economy and its further development. The industry constitutes a core element of Government planning in the context of the ‘Strategic Emerging Industry Initiative’, a Government of China initiative launched in 2009 and the ‘Made in China 2025 Plan’ launched in 2015.
The Made in China 2025 Plan states exhaustive directions for non-ferrous metal specifications to be developed and promoted in the fields of high-end machine tools and robots, aerospace equipment, advanced rail transport equipment, and energy saving and new energy automotive vehicles.
2. Recognition and promotion of respective metal use in key end-use industries
In order to promote the metals industry, China focused on identifying and promoting key end-use sectors for various metals. For example, in case of aluminium, China recognised the importance of aluminium in the development of several strategic end-uses such as automotive, construction, electrical, defence and solar. The Government also proactively worked with the industry to help accelerate the adoption of aluminium by various end-use industries.
3. Cluster development approach
In order to ensure operation efficiency and cost reduction, China has successfully adopted and implemented an approach of developing clusters for metal production
9AnalysisofMarket-DistortionsintheChineseNon-FerrousMetalsIndustry-ThinkDeskEuropeanUnion,Eurometaux

79Indian Non-Ferrous Metals Industry - Way Forward
Around raw material availability centres in county following industries has be built; Refining, Smelting, Primary metal production and even Downstream products production. This approach has served dual benefit for China- cost and efficiency benefits, and development of backward regions. The industry in turn has also benefitted from support from the Government incentives in the form of infrastructure, tax incentives and power supply, among other incentives.
4. Availability of cheap and abundant electricity10
The cost of electricity is a major cost of the NFM industry, which is an intensive user of power. In addition to making sure that the power situation is stable and available in abundance, the Government of China has ensured supply of quality power at controlled cost. This has helped make the metal producers in China competitive. As per an analysis of 65 major metal producers in China, energy subsidies to these companies alone amount to about EUR 300 million or USD 353 million between 2011 and 2015. Aluminium Corp of China alone received more than EUR 60 million (USD 71 million) every year between 2012 and 2014 in the form of energy subsidies. This allowed for a reduction of the company’s total energy costs by approximately 3%.
5. Import-Export Incentives
As a general principle, China promotes the import of raw materials (ores, scrap, etc.) and advanced machinery required for industry operations as well as the export of processed metal products. The major Chinese metal producers received export subsidies of about EUR 16.9 million or USD 20 million over the five-year period 2011-15.
To promote exports of downstream products, China provides an incentive in the form of 13-17% rebate of value added tax (VAT).
6. Explicit and implicit Government subsidies
According to a study by an independent EU-China think tank, 65 major Chinese non-ferrous metals producers received over EUR 5.2 billion or USD 6.15 billion of Governmental subsidies between 2011 and 2016. This number is equivalent to 44% of their aggregate after tax profits. The high level of subsidies have resulted in market distortions that have had a global impact, due to which it has become difficult for countries to have a level playing field in the industry. Additionally, these companies received another EUR 2.1 billion or USD 2.5 billion in deferred income subsidies. The combined subsidies to these major companies stand at about EUR 7.3 billion or USD 8.6 billion. The bulk of these benefits have accrued to state owned enterprises. Among the biggest beneficiaries of subsidies have been China Minmetals Group Aluminium Corporation of China, Jinchuan Group, Yunnan Aluminium Co., Ltd., Tongling Nonferrous Metals Group Co., Ltd., and Yunnan Copper Co., Ltd.
Similar incentives to Indian non-ferrous metals industry in terms of export incentives, strong infrastructure, availability of power among others can go a long way in furthering the growth of industry in the decade ahead.
10Eurometaux

80 Indian Non-Ferrous Metals Industry - Way Forward

81Indian Non-Ferrous Metals Industry - Way Forward
10. Outlook: Vision 2030
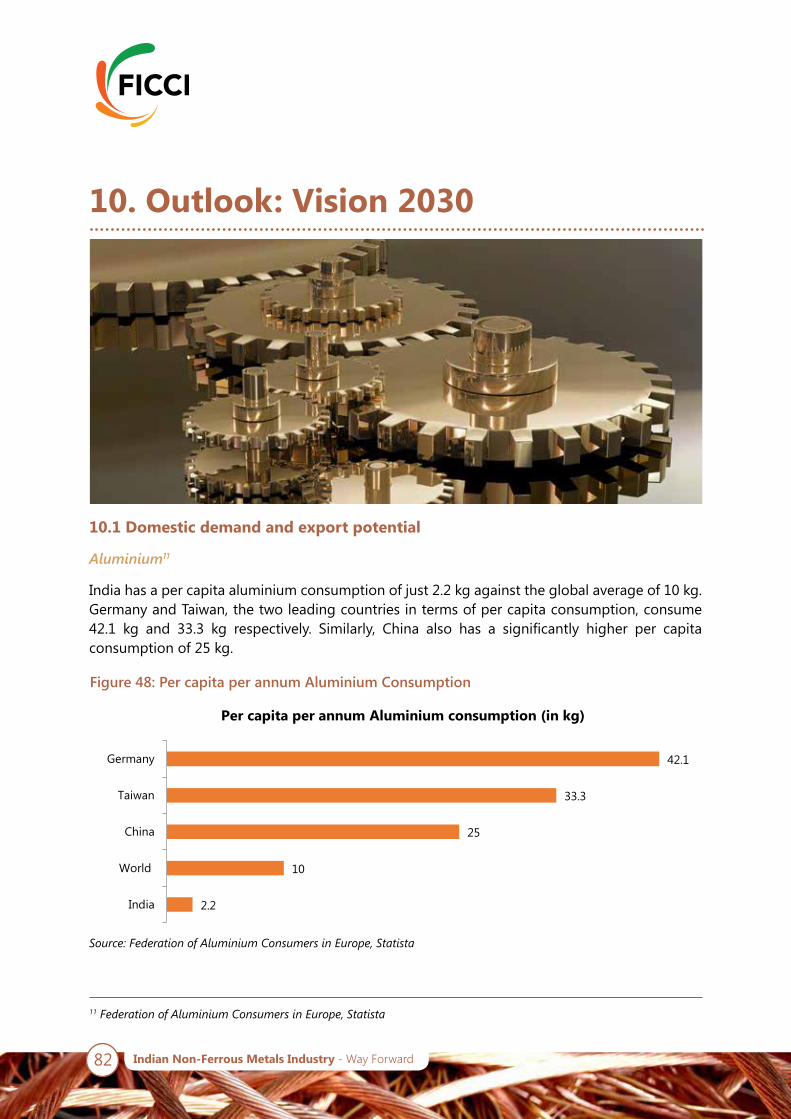
82 Indian Non-Ferrous Metals Industry - Way Forward
10. Outlook: Vision 2030
10.1 Domestic demand and export potential
Aluminium11
India has a per capita aluminium consumption of just 2.2 kg against the global average of 10 kg. Germany and Taiwan, the two leading countries in terms of per capita consumption, consume 42.1 kg and 33.3 kg respectively. Similarly, China also has a significantly higher per capita consumption of 25 kg.
Figure 48: Per capita per annum Aluminium Consumption
Source:FederationofAluminiumConsumersinEurope,Statista
11FederationofAluminiumConsumersinEurope,Statista
2.2
10
25
33.3
42.1
India
World
China
Taiwan
Germany
Per capita per annum Aluminium consumption (in kg)

83Indian Non-Ferrous Metals Industry - Way Forward
0.5
3
8
13
15
India
World
China
South Korea
Germany
Per capita per annum Copper consumption (in kg)
India has committed to reduce emissions intensity and increase share of renewable energy, as per commitments at the 2015 United Nations Climate Change Conference (COP 21). To achieve this, the country requires greater usage of electric cars, replacing plastic packaging with aluminium packaging where applicable and greater adoption of solar power. All of this essentially translates to greater use and demand for aluminium.
Aluminium consumption is picking up pace. Reforms proposed by the Indian Government (Make in India Campaign, Smart Cities, Rural Electrification and a focus on building renewable energy projects under the National Electricity Policy) could further drive up consumption.
Copper12
The per capita consumption of copper in India is merely 0.5 kg as compared to the global average of 3 kg and China’s 8 kg per capita. Germany and South Korea consume about 13 kg and 15 kg of copper per capita per annum respectively. This indicates strong future demand and potential in India.
While the demand from the building and construction segment is likely to remain subdued, the demand from the automobile segment is likely to support the domestic demand for copper. The high usage of copper in electrical applications will continue, due to its high conductivity (next only to gold and silver), safety and proven record in these applications.
Copper will also continue to be used for consumer durables like air conditioners and technologies like split units and VRV/VRF type air-conditioning equipment.
The Make in India Initiative and the Affordable Housing for all programme and increase in capex activities (especially in the railways and defense sectors) are set to further support the domestic demand for the metal.
Figure 49: Per capita per annum Copper Consumption
Source:InvestmentFrontier,VedantaResources
12InvestmentFrontier,VedantaResources

84 Indian Non-Ferrous Metals Industry - Way Forward
0.15
1.7
4
India
China
Western Europe
Per capita per annum Lead consumption (in kg)
Lead
As compared to the per capita per annum Lead consumption of 4 kg and 1.7 kg of Western European countries and China respectively, India’s consumption is only about 0.15 kg per capita per annum. Lead consumption is to rise steeply in the future, owing to the future growth potential of the automobile industry in India.
Usage of Lead has essentially been in batteries, and it has been the source of power for starting, lighting and ignition (SLI) for the automotive industry for over a century. Increasing vehicle production, e-bikes, infrastructure development and new telecoms networks will also continue to support lead demand growth in the country.
Lead Batteries: India is Asia’s largest lead consuming market after China, where growth is largely driven by demand from the automotive sector and inverter batteries for standby power.
In addition, with the Government’s focus on curbing the pollution levels in major cities, electric cars and thus the industrial battery segment holds growth promise.
India’s growing telecom industry and ongoing infrastructure development has also boosted the industrial battery demand, as is the case with an expanding photovoltaic market, which is to reach 246 GW by 2030. India has the second largest number of mobile subscribers in the world after China, and is currently sixth in global vehicle production.
Zinc13
India’s low per capita consumption of Zinc of 0.6 kg lags behind the world average of 2 kg. China’s per capita consumption stands at around 4.8 kg, while the comparable figure for the US is 3.2 kg. Given the low base, in line with rising demand from major consumption industries, India is likely to see an increase in its consumption.
Government initiatives like the Smart cities initiative, Digital India campaign, high-speed rail network, construction of highways and modernization of railways will boost the infrastructure industry, which is a key consumer of zinc.
Figure 50: Per capita per annum Lead Consumption
Source:HZLAnnualreport,IBEF
13VedantaResources
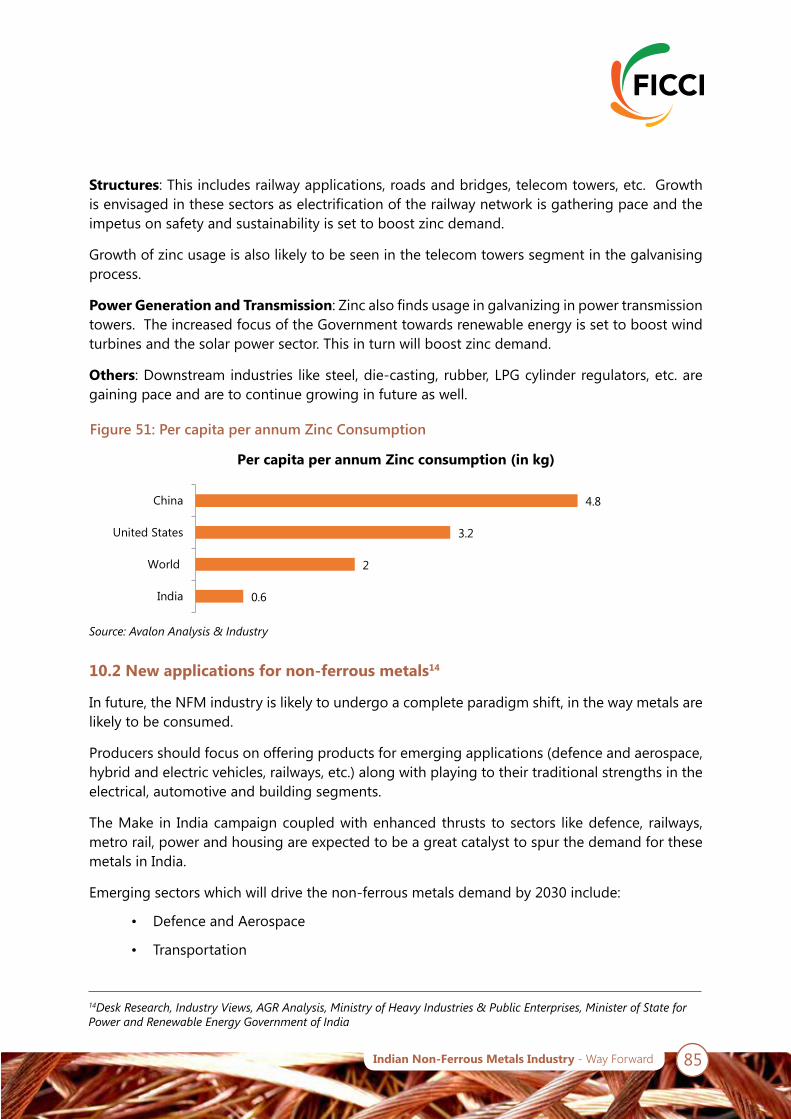
85Indian Non-Ferrous Metals Industry - Way Forward
Figure 51: Per capita per annum Zinc Consumption
Source:AvalonAnalysis&Industry
14DeskResearch,IndustryViews,AGRAnalysis,MinistryofHeavyIndustries&PublicEnterprises,MinisterofStateforPowerandRenewableEnergyGovernmentofIndia
Structures: This includes railway applications, roads and bridges, telecom towers, etc. Growth is envisaged in these sectors as electrification of the railway network is gathering pace and the impetus on safety and sustainability is set to boost zinc demand.
Growth of zinc usage is also likely to be seen in the telecom towers segment in the galvanising process.
Power Generation and Transmission: Zinc also finds usage in galvanizing in power transmission towers. The increased focus of the Government towards renewable energy is set to boost wind turbines and the solar power sector. This in turn will boost zinc demand.
Others: Downstream industries like steel, die-casting, rubber, LPG cylinder regulators, etc. are gaining pace and are to continue growing in future as well.
10.2 New applications for non-ferrous metals14
In future, the NFM industry is likely to undergo a complete paradigm shift, in the way metals are likely to be consumed.
Producers should focus on offering products for emerging applications (defence and aerospace, hybrid and electric vehicles, railways, etc.) along with playing to their traditional strengths in the electrical, automotive and building segments.
The Make in India campaign coupled with enhanced thrusts to sectors like defence, railways, metro rail, power and housing are expected to be a great catalyst to spur the demand for these metals in India.
Emerging sectors which will drive the non-ferrous metals demand by 2030 include:
• Defence and Aerospace
• Transportation
0.6
2
3.2
4.8
India
World
United States
China
Per capita per annum Zinc consumption (in kg)

86 Indian Non-Ferrous Metals Industry - Way Forward
• Healthcare
• Agriculture
• Solar
• Refrigerators and air conditioners (ACs)
• Marine applications
DEFENCE AND AEROSPACE:
A growing number of emerging applications in both these sectors will make aluminium the metal of choice in the future.
Apart from easing FDI norms and increasing its allocation in the budget, the Government is trying to boost defence manufacturing in India by giving more opportunity to Small and Medium Enterprises (SMEs) under the ‘Make in India’ campaign.
One of the biggest challenges in producing good quality grade alloys in defence and aerospace is technology and infrastructure related constraints. The need of the hour is to establish modern facilities in India or to form joint ventures with foreign companies for advanced manufacturing.
Many companies have already started investing in setting up dedicated facilities for manufacturing of defence and aerospace components using high-end alloys of Aluminium, which pave the way for the increased usage of Aluminium in India.
While Aluminium finds its usage in wide applications such as aircrafts, missiles, spacecraft and small warships, there are other non-ferrous metals, which find relevance in many applications such as:
• Copper in ammunitions, rockets and high explosive anti-tank shells
• Zinc in ship building and Lead in batteries, ammunition and radio equipment
TRANSPORTATION:
India is now amongst the largest automobile markets in the world and is set to improve further due to gaining attraction towards the high-end luxury car segment. There has been an increased penetration of galvanised steel in fuel tanks and skin panels of four-wheelers.
India shall be shifting to BS VI from 2020 onwards, which will mandate lower emissions, and hence car bodies need to be lighter. This will make use of galvanized steel sheets more apparent.
Hybrid and Electric Vehicles (HEVs)
The Government launched the National Electric Mobility Mission Plan (NEMPP) 2020 in 2013 to promote hybrid and electric vehicles and work towards achieving fuel security in India. By the year 2020, there is an ambitious target set to achieve sales of 6-7 million units of hybrid and electric vehicles.
87Indian Non-Ferrous Metals Industry - Way Forward
To achieve this target, the Government has launched Faster Adoption & Manufacturing of Hybrid and Electric Vehicle (FAME) under NEMPP 2020, which focusses on the development of indigenous technology and enhancement of Research and Development (R&D) capabilities to develop and manufacture components, create demand, pilot projects and enhance charging infrastructure.
Due to the increasing usage of hybrid and electric vehicles, demand for Aluminium and Lead are expected to grow. Using Aluminium in HEVs means lower fuel consumption, reduced CO2 emissions and reduced demand for raw materials since a high proportion of products used are recycled. Usage of Lead has essentially been in batteries, and it has been the source of power for starting, lighting and ignition (SLI) for the automotive industry for over a century.
Railways
Through its ‘Make in India’ initiative such as easing of FDI norms, allocation of funds for 2700-km Dedicated Freight Corridor projects, etc., the Government has taken various initiatives that will boost demand of non-ferrous metals.
In addition, the coaches of the proposed high-speed train between Mumbai and Ahmedabad are proposed to be made of Aluminium, as the lightweight trains use less energy and move faster as compared to steel coaches.
There are sufficient opportunities for Aluminium to become the raw material of choice for railway wagons due to its key benefits over steel (lightweight, resistance to corrosion, can be continuously recycled, high strength to weight ratio, environment-friendly). Galvanising steel assets can help in protecting them from corrosion.
OTHER APPLICATION AREAS:
Healthcare
Aluminium finds increasing use in various areas of the healthcare industry - in medical cases, trays and general hospital devices due to its intrinsic sustainable qualities (lightweight, recyclability, strong, non-toxic nature).
Copper use in this sector is also increasing due to its inherent bactericidal property. Typical examples include use of water storage pots made of copper; doorknobs, handrails etc.
It is well proved through research that copper kills bacteria almost instantly and no other industrial metal has such a unique property.
Zinc is also known for properties that aid in diarrhoea treatment. Therefore, Zinc-based ORS is also available at Government Health centres and local Aanganwadis. Zinc is also an important micronutrient for human health and physiology and child and foetal development.

88 Indian Non-Ferrous Metals Industry - Way Forward
Agriculture
Zinc is also important for crop health. Unfortunately, more than 60% of Indian soil is zinc deficient. Hence, the required amount of zinc is not available for crops and humans. Zinc-based fertilizers are widely prevalent.
Due to the acute zinc deficiency of Indian soil and importance of zinc in human physiology and child and fetal development, zinc based fertilizers and zinc-fortified crops are now gaining pace.
Solar
Aluminum extrusions can be used to create a thorough framework for solar panels in a variety of situations, including frames, supports and connectors, as it is lighter than other metals, making them easier to transport and assemble in remote locations.
Mounting structures used for solar panels are galvanised as per the ASTM and BIS standards.
Refrigerators and ACs
Copper is widely used in this segment. Owing to low penetration of ACs in India, the segment has witnessed a significant growth in the past, leading to healthy growth in the demand for copper, which is expected to continue the growth momentum in the future.
Refrigerator panels and AC ducts are galvanised for increased corrosion protection.
Increasing affluence levels, high disposal incomes levels, easy finance options are driving the premium and luxury product markets.
In the refrigeration segment, product categories like visi-coolers, deep freezers, water coolers and cold storage facilities are likely to drive growing demand for copper.
Growing consumer demand for white goods, like washing machines, AC ducts and refrigerators will further drive galvanised sheets usage in the future.
Radiation Shielding
Lead finds usage in various forms of radiation shielding, due to its high density.
For example, metallic lead is used in shielding of a container for radioactive materials; lead sheets in rooms where x-ray machines are installed; and lead powder is incorporated into plastic and rubber sheeting as a material for protective clothing.
Marine applications
Aluminium finds applications in shipbuilding and fabrication of components in offshore platforms due to its unique properties such as corrosion resistance, lightweight nature, superior mechanical properties, and high recyclability.
Manufacturers have utilised these properties in the designs of ships and boats with high-speed capability, long life, high payloads, low maintenance costs and high recycle value. Many high-

89Indian Non-Ferrous Metals Industry - Way Forward
speed patrol and military boats in service worldwide, are built with mono-hulls and topsides of Aluminium alloys.
Demand for non-ferrous metals is expected to witness strong growth in future, considering the strong economic prospects, a thrust on manufacturing sector growth, the expected growth in the key end-use segments and advent of new application areas.
10.3 Key challenges15
The non-ferrous metals industry is facing the following challenges for which Government support is required to provide a level playing field for healthy growth in the coming years.
Non-ferrous metal industry is bracing for challenges such as:
• Environment issues
• Improper duty structure
• Dumping of goods under FTA
• Poor infrastructure
• Inadequate quality consciousness
• Rapid capacity expansion of input minerals
• Availability of indigenous technological expertise and need for cost reduction.
1. Environment issues
Waste management by primary and secondary NFM industries is a key concern and the Government should take actions on tackling the same. Networking among the various industries on recycling and use of waste generated internally should be evaluated. Proper education on methodologies for assessing environmental implications and technologies of Non-Ferrous Metals should reach every organisation.
2. Rising raw material cost for primary / secondary metal producers
The impact of rising input costs is expected to be higher as there has been a sharp increase in prices of ores and concentrates, which is a large cost driver in production of the metal. Higher input costs for domestic producers like high exploration costs, mining expenses and high royalty charges etc. make domestic products more expensive.
3. Dependency on imports of copper ores and concentrates
India is highly deficient in the domestic availability of certain ores and concentrates. The major import destinations are Chile, Indonesia and Peru. Over the past few years, there have been disruptions in these countries. For example, the supply from Chile, the single largest copper ore exporting country in the world and one of the most important source of imports for India, has been erratic due to declining outputs owing to labour unrest in that country.
15DeskResearch,IndustryViews,AGRAnalysis,TradeMap,ComTrade

90 Indian Non-Ferrous Metals Industry - Way Forward
Similarly, the Government in Indonesia had earlier restricted the export of copper ores, a ban that has subsequently been lifted.
A combination of high dependence on import of ores, likelihood of disruptions in supply, and an inverted duty structure are the key concerns that the industry has to deal with going forward.
4. Dependency on scrap imports
There remains a huge gap in the demand and supply of non-ferrous metals scrap. The demand is far greater than the domestic supply of metal scrap, which has resulted in high dependency on imports.
The majority of scrap used by the recycling industry is imported, despite India having a huge population base generating a large volume of scrap. Therefore, there is a need to strengthen India’s scrap recycling ecosystem with more consistent enforcement of legislation and laws promoting organised scrap collection and segregation in India.
The recycling rate of metals in India is less than 30% as opposed the recycling rate in the US, which stands at about 90%.16 Moving forward, this is a critical challenge that the industry needs to deal with. Because of a shortage of domestically available raw materials, India imports many types of non-ferrous scrap metal.
5. Threats to domestic downstream market
Overall, India’s downstream industry is fragmented, with numerous small and medium sized businesses facing challenges such as low capacity utilisation, outdated technology, lack of proper infrastructure, high cost of funding, lack of qualified personnel, high set up cost, etc.
Domestic downstream producers are also not as price-competitive as imports of downstream products coming from China, Japan, South Korea and ASEAN countries, due to the prevailing inverted duty structure.
6. Inverted duty structure
Primary metal producers: Primary metal imports are lower priced than imports of raw materials required for producing the primary metal in India due to the inverted duty structure. This has adversely affected domestic primary metal producers.
Downstream product producers: Similarly, there is low or zero import duty on certain downstream products and a relatively higher duty on the import of primary metal. This has resulted in lack of demand for the domestically manufactured downstream products and has put the domestic downstream product manufacturers under threat. The anomalies in duty charged are a major challenge that the industry faces in its quest to stay competitive.
Imports still dominate downstream products such as copper wire and aluminium foils. In order for domestic downstream producers to be successful, they need to be provided a level playing field to gain the market share currently occupied by imports.
16MetalMiner

91Indian Non-Ferrous Metals Industry - Way Forward
Import duties are also levied on metals recycling equipment/radiation detection equipment, despite being environmentally nonthreatening, needing an immediate review.
7. High energy costs
Energy costs constitute approximately 40% of total manufacturing costs in India for NFM industries, compared to ~30% globally.
Most Indian companies have set internal targets to reduce energy consumption in the next five-eight years along with the declaration of formal energy policies as well.
Secondary metal processing consumes less energy as compared to primary metal processing. Compared to primary metal processing, the energy required to recycle metals is a relatively small fraction of the energy required to produce metals from their ores, as energy is required largely only for melting and not chemical transformation. This is further incentive to strengthen and nurture India’s secondary metal processing industry.
Figure 52: Aluminium energy Cost Structure
Source:AvalonAnalysis&Industry
41%
28%
12%
8%
11%
Aluminium Cost StructureAlumina
Energy Cost
Other Raw Materials
Labour Cost
Other Costs

92 Indian Non-Ferrous Metals Industry - Way Forward

93Indian Non-Ferrous Metals Industry - Way Forward
11. Key Recommendations

94 Indian Non-Ferrous Metals Industry - Way Forward
11. Key Recommendations17
1. Pertaining to trade agreements and imports
Aluminium
• China’s aluminium exports to India is higher than its imports from India. Any agreement under the proposed Regional Comprehensive Economic Partnership (RCEP) that facilitates duty reduction or duty-free imports is going to skew this trade imbalance further
• Aluminium should be out of RCEP purview, given the strategic importance of aluminium and the need to develop to a strong domestic industry
Copper
• As per the India-ASEAN FTA, certain copper products are attracting zero duty. This has led to huge imports of these products into India, not just from ASEAN but also from China via ASEAN. All Copper products should be in the negative list under the FTA
• The India-Japan Comprehensive Economic Partnership Agreement (CEPA) does not have a clause for a minimum requisite value addition in order for products to be exported/imported. Due to this, between 2013-14 and 2014-15, Japan’s exports of certain copper products to India rose by nearly 20 times
• Similar to India-ASEAN FTA, in CEPA a clause stipulating a minimum 35% value addition needs to be inducted. The clause is a common norm in all major FTAs
17DeskResearch,IndustryViews,AGRAnalysis,TradeMap,ComTrade

95Indian Non-Ferrous Metals Industry - Way Forward
Lead
• In India, export and import quantities fluctuate every year due to changing custom duties and Government policy with regards to FTA
• India’s FTAs with ASEAN countries has led to imports of lead in the form of lead ores and concentrates, lead and alloys including scrap, lead and alloys unwrought, pig lead, antimonial lead worked, lead and alloys (bars, rods, plates, etc.)
Zinc
• India’s FTAs with countries like Korea and Japan, which makes zinc imports from these countries at zero or near zero duty has compelled high imports, in spite of sufficient domestic production capacity
• Over the last two-three years, zinc demand in China is waning (due to lack of steel demand) and soon China will again become a zinc surplus nation
• This will create a problem to India and domestic zinc market will be greatly affected, when RCEP is consented, as all the excess zinc capacity of China will be shipped to India
In the ongoing negotiations over the Regional Comprehensive Economic Partnership (RCEP), India should insist on placing all NFM products under the negative list. A failure to do so would result in a disproportionate flow of these products from China.
Besides China, other countries covered under RCEP including Australia, Philippines and Indonesia, are all extremely competitive countries in the NFM value chain.
This would be counterproductive for the domestic NFM industry in India and would negatively affect capacity development and technology upgrades in the industry.
2. Import-Export incentives
Aluminium
• The raw materials - Aluminium Fluoride, Caustic Soda Lye and Anodes - required by the domestic industry attract a high import duty of 7.5%. In order to ensure the price competitiveness of the domestic industry, the Government should take steps to reduce the duty to the lowest possible level
Copper
• Under the Market Linked Focused Product Scheme (MLFPS) that was operational up until 31 March 2015, certain copper products were a beneficiary of an export incentive of 2%. However, under the new scheme, Merchandise Export from India Scheme (MEIS), these products are excluded form export incentive
• Reinstatement of the products under the new scheme would provide the necessary support and competitiveness to the industry. Furthermore, copper is one of the few

96 Indian Non-Ferrous Metals Industry - Way Forward
commodities that India exports to China and a fillip to copper exports would help lower India’s trade deficit with China
• India is deficient in Copper ores, concentrates, and relies heavily on its import to support the domestic industry and exports. Government should consider reducing the import duty on concentrates from 2.5% to 0%, so that it would immensely help the industry and exports competitiveness. The domestic availability of concentrates meets only about 4 % of the demand and imports share meets rest of the demand. There is precedence for the same, as China, Japan, South Korea and European Union nations do not have import duty on Copper concentrates.
Lead and Zinc
• With rapid expansion of smelter capacities, imports of zinc and lead concentrates are inevitable as domestic production will be insufficient to meet the requirements. A supportive tariff regime (NIL Duty) is required on raw materials such as zinc and lead concentrates.
• There is no incentive provided to the Indian producers to export their product in the international markets by means of MIES scheme. Zinc products with HS Code 790111, 790112 has been dropped put as a category from any of the export incentives. Additionally, the duty drawback of 1.5% for zinc and 2.5% for lead is also insufficient.
• Keeping in mind the above points, the Government should study the possibilities of increasing the Duty Drawback from the existing level for lead and zinc.
3. Preferences to the domestic industry in Government procurement and initiatives
• In order to achieve the desired advancement of the non-ferrous metals industry in the country, the Government should give preference to domestic manufacturers of primary and secondary metals in procurement for Government contracts
• The Government initiatives for defence procurement, rural electrification, Housing for All scheme and others should mandate procurement from domestic manufacturers
4. Scrap metal imports
• The trade data of all four non-ferrous metals throws up one clear insight- the import of scrap metal is disproportionately high. It is high, both, as a proportion of respective total metal imports and as a proportion of respective metal’s domestic consumption
• One of the reasons is the inconsistency of enforcement of regulations governing the import of scrap metal in India; with other being the non-availability of the scrap domestically
• Under the new GST regime, all categories of scrap now have a high tax rate of mostly 18%

97Indian Non-Ferrous Metals Industry - Way Forward
• Government should ensure proper and timely refunds of discounts on GST pricing for scrap and finished products
• Collection of scrap should be GST free and the Government should consider removing the prevailing threshold Limit of Rs 20 lakhs/annum
• The Government must come up with well-defined end-of-life cycle norms and more consistently enforce regulations to reduce metal scrap import and close the gap between the demand and supply of metal scrap
• Greater than 50% of metal output comes from recycling; import of scrap attracts 2.5-5% duty while finished products come free under various FTAs
• Government should review inverse tax structure with import duty of 2.5-5% on scrap and zero on finished products; in absolute as well as comparative terms through industry consultations
• Overall, NFM Industry is set to grow in the next 5 years and this signifies the huge potential growth of scrap recycling in volume terms, as the secondary metals produced through scrap contributes nearly half of India’s base metal consumption
According to All India Kabadi Mazdoor Mahasangh, “Tax should be on the waste generator, not on waste. In Colombia, informal waste pickers or dealers are getting money from the Government for providing their service to the people and environment. They get 2$ per day from tax on waste/ scrap. The money collected should go in paying the real environmentalists of our country – the rag pickers and the kabadiwaalas.”
5. Augmentation of domestic recycling capability
• Government support in infrastructure upgradation will go a long way in augmenting domestic metal scrap generation and collection and making the secondary metal industry more sustainable. This infrastructural development would also support the primary producers.
• Upgradation of ship-breaking yards and establishment of recycling zones in coastal economic zones will contribute to the objective of transforming Indian port infrastructure.
• Establishment of recycling zones and shredding centres will also be a part of developing self-sufficient and sustainable smart cities
• Formation of Cluster on outskirts for secondary / recycling sector should also be considered, as well as the creation of recycling parks to create a long term, sustainable and eco-friendly business model.
• The Government can also help by initially reducing import duty on recycling and radiation detection equipment. In the medium to longer term, the Government must help develop capacity in indigenously producing this equipment.
• Upgradation on technology of secondary smelting units to reduce pollution.

98 Indian Non-Ferrous Metals Industry - Way Forward
• The Government should also ensure full enforcement of safety guidelines for employees in the scrap sector using international benchmarks such as OSHA guidelines as reference
• A Special Economy Zone for battery breaking and recycling industry should be considered and the Government should ensure that secondary industry clusters are free from residential intrusions
• In essence, the Government should recognise the secondary/recycling industry as clean, sustainable and a value addition to the economy of the country
6. Non-tariff barriers
• Implement “Rules of Origin norms” so that the source of origin of products is readily identifiable. This is essential in order to ensure that countries not having FTAs with India, do not leverage India’s bilateral free trade agreements with other countries
• The next step would be to ensure that quality standards pertaining to metal scrap imports are implemented through inspection and certification
• The BIS, DGFT and Customs inspections will play a key role in this regard. These standards need to be all encompassing and include different aspects such as physical and chemical properties, and packaging and labelling
7. Top policy intervention areas that should be pursued in order to drive non-ferrous metal demand in key end-use sectors
• There is not enough advocacy and awareness within Government institutions about the non-ferrous metals industry and its contribution to the economy.
• Decision makers need to be aware about the issues unique to the non-ferrous metals industry.
• All domestically produced automobile bodies should be light weighted and galvanized.
• Focus on safety & sustainability in Indian Railways with galvanized rails, bridges & structures
• Policy intervention for standardizing minimum zinc coating thickness for galvanized sheets.
• Making galvanized rebar use mandatory for high-rise buildings, bridges and highways in corrosion prone areas.
• Considering the severe Zinc deficiency of Indian soil, the Government should promote and subsidize Zinc fortification of fertilizers.
• Support from the Government in monitoring of illegal and backyard secondary lead smelters.

99Indian Non-Ferrous Metals Industry - Way Forward
The Government should identify the non-ferrous industry as a “core industry”
8. Government should review the existing hurdles in regulation and ease the same to support effective operations of primary metal producers
• As NFM primary metal producers provides critical raw material to several industries which are the pillars of economic development, a well-developed NFM metals industry is vital for India
• Some steps the Government can take to help further support primary metal producers are:
o Explore ways to lessen the burden of rising input costs
o Review the inverted duty structure to incentivize primary production of metals, rather than depending on imports of finished goods
o Explore ways to ensure cheap, reliable and abundant electricity, e.g. through electricity infrastructure investments or energy subsidies
Provided these measures are being taken rapidly, domestic demand for NFM can grow at a minimum of 8% year on year over the next five years.
Given this scenario, business returns of domestic non-ferrous metal players (primary producers) shall improve in the future, which implies an increase in tax revenue generation alongside growth in industry.
Furthermore, resurgence in the secondary NFM industry would result in the generation of new sources of revenue and employment for the Government. Around 1 Million people are employed in the recycling industry and this number can multiply if supported by enabling policies.
Figure 53: NFM Future Demand Growth
Source:AvalonAnalysis&Industry
3.485.16
0.96
1.320.96
1.38
0.66
0.88
0
2
4
6
8
10
2016-17 2020-21
Non-ferrous metals consumption growth (in million tonnes)
Aluminium Copper Lead Zinc
6.06
8.74

100 Indian Non-Ferrous Metals Industry - Way Forward
The Indian non-ferrous metals industry has been a success story in waiting.
By making a few course adjustments, and by focusing on common interests, Government and industry can come
together to unlock the true potential of this critical industry, and in doing so, use it as a powerful engine for the growth of end-use sectors, Indian Manufacturing
and the Indian economy as a whole.

101Indian Non-Ferrous Metals Industry - Way Forward
NOTES

102 Indian Non-Ferrous Metals Industry - Way Forward
NOTES

103Indian Non-Ferrous Metals Industry - Way Forward

104 Indian Non-Ferrous Metals Industry - Way Forward
Contact us
Mines & Metals Division Federation of Indian Chambers of Commerce and Industry
Tel: +91-11-23487536 Email: [email protected]
www.ficci.in
Shri S K Roongta Mentor
FICCI Non-Ferrous Metals Committee
Shri Sunil Duggal Co-Chair
FICCI Non-Ferrous Metals Committee
Shri Satish Pai Chair
FICCI Non-Ferrous Metals Committee
Shri Santosh Sharma Co-Chair
FICCI Non-Ferrous Metals Committee