Embed Size (px)
Citation preview

Indian Manufacturing Productivity: What Caused the Growth Stagnation before the 1990s?
Abhay Gupta1
MITACS
ABSTRACTThis article addresses the question of why productivity growth in Indian manufacturing wasslow in the pre-reform period and analyzes how economic reforms in the 1990s acceleratedproductivity growth. The answer lies in two subtle but important distortion-inefficiencymechanisms, which affected productivity growth by distorting intermediate input allocation.The interaction of quantitative restriction policies and inflexible labour laws resulted in lowerthan optimal materials per worker usage. The combination of high inflation and unavailabilityof credit exacerbated this factor distortion and lowered productivity growth further. Using apanel dataset on Indian industries, this article finds widespread underutilization of materialscompared to labour until recently, and this sub-optimal materials per worker usage loweredproductivity growth.
RÉSUMÉCet article cherche à déterminer pourquoi la croissance de la productivité dans la fabricationen Inde a été lente dans la période préalable à la réforme et il analyse comment les réformeséconomiques des années 90 ont accéléré la croissance de la productivité. La réponse tient àdeux mécanismes subtils mais importants de manque d'efficacité et d'effet de distorsion, quiont eu des répercussions sur la croissance de la productivité en créant un effet de distorsionsur la répartition des intrants intermédiaires. L'interaction entre les politiques de restrictionsquantitatives et les lois rigides sur la main-d'œuvre ont entraîné une utilisation inférieure auniveau optimal des matériaux par travailleur. L'inflation élevée et la non-disponibilité ducrédit ont ensemble exacerbé cet effet de distorsion des facteurs et ont fait diminuerdavantage la croissance de la productivité. Au moyen d'un ensemble de données recueillies aumoyen de panels sur les industries indiennes, on constate une sous-utilisation généralisée desmatériaux comparativement à la main-d'œuvre jusqu'à récemment, et cette utilisation sous-optimale des matériaux par travailleur a fait diminuer la croissance de la productivité.
THE SLOW PRODUCTIVITY GROWTH in Indian man-ufacturing before the late 1990s is cited as one ofthe major reasons why the Indian economy couldnot achieve high rates of economic growth. Indian
manufacturing productivity growth was slowercompared to that in other Asian economies likeChina and Vietnam, as shown in Fernandes andPakes (2008). But more interestingly, the relative
1 The author is an analyst for Mathematics of Information Technology and Complex Systems (MITACS)research network. This article draws from the author’s PhD thesis submitted to the Department of Economics atthe University of British Columbia. Email: [email protected].
I N T E R N A T I O N A L P R O D U C T I V I T Y M O N I T O R 85

performance of the manufacturing sector in Indiawas poor compared to the Indian services sector.Chart 1 shows output and output shares of manu-facturing and services in India for 1960-2002.Manufacturing output grew during these 42years, but that growth was slower than thegrowth in services output, which startsgrowing exponentially in the 1990s. Thecontrast between these two sectors becomesclearer when looking at their shares of totaloutput. The share of services jumped from0.29 in 1960 to 0.50 in 2002, while theshare of manufacturing went from 0.11 to0.18 in 2002.
Why is it that under a similar economicenvironment the service sector grew atremarkable rates while the manufacturingsector did not? How did reforms in the 1990sspur productivity growth in the manufactur-ing sector? This article differs from previ-ous articles2 in its approach to answeringthese questions by introducing two new fac-tors. First, the role of intermediate inputs isexamined, as this is missing from the dis-cussion despite being the most importantdifference between manufacturing and ser-vices production processes. Second, thisarticle studies the effects arising from thecombination and interaction of policies,which can be totally different from the indi-vidual effects of policies. Adding these twodimensions provides new insights into theIndian economic growth experience.
By taking this appraoach, this article finds thatthe difference between the growth performance ofthe manufacturing and the service sector is causedby the greater reliance of the former on intermedi-ate inputs. Interactions and combinations of poli-cies (inflexible labour laws in the presence of aquota-permit system) and economic conditions(high inflation in the presence of credit unavail-
ability) in India created distortions resulting inproduction inefficiency. These mechanisms ham-pered productivity growth in manufacturing byforcing firms to operate at non-optimal intermedi-
ate input allocation. Economic reforms in the1990s helped reduce these distortions by removingmany of these restrictions and, as a result, themechanisms that caused inefficiency disappeared.This article discusses the economic mechanismsthrough which government policies affected man-ufacturing productivity at the firm level.
To estimate the effect of a given policy, oneneeds to isolate it from other policies. But the cet-
2 See Basu and Maertens (2007) for a survey of some of the explanations for economic growth in India after thereforms.
Chart 1Output and Output Shares of Manufacturing andServices in India, 1960-2002
8 6 N U M B E R 2 0 , F A L L 2 0 1 0
eris paribus assumption comes at a cost, becausethe interaction of different economic conditionsmay give rise to mechanisms or incentives that aretotally different from the predicted outcomes ofany single policy. This is especially true in the caseof India, where different policies are not alwayscoordinated or synchronized. Rajan et al (2006)argue that the development policies adopted afterIndia’s independence can be described as “idio-syncratic”. In fact, the reason manufacturinggrowth is relatively slower lies in the way theIndian economy has evolved. By the time indus-trial growth started to become the focus of five-year plans, India had already embraced the social-ist model of planning. Government regulations andcontrol greatly influenced Indian industry throughthe notorious “license-raj” (the quota-permit sys-tem) and rigid labour laws. Besley and Burgess(2004) show that pro-worker industrial disputeregulation tend to lower output, investment, pro-ductivity and employment in manufacturing.Fernandes and Pakes (2008) also find that labour isunderutilized in states with more restrictive labourlaws (e.g. an amendment to the Industrial DisputesAct which made the firing of workers illegalexcept with previous permission from the appro-priate state government).
Why do these worker-friendly labour laws endup reducing product ivi ty and inducing theunderutilization of labour? This article shows thatit is because of the presence of the additional (andoften ignored) policy of a quota system. The inter-action of the quota system with existing conditionsand labour laws created economic mechanismsthat distorted the usage of intermediate inputs,which are very important in manufacturing pro-duction (a share of 60 per cent of gross output).This non-optimal allocation of intermediate inputsresulted in inefficiencies in the manufacturing sec-tor.
Unfortunately, the effect of the quota-permitsystem on Indian industry has not received its dueattention. Mohammad and Whalley (1984) discuss
some of those licenses and other controls. Theirestimates of the welfare losses from rent seeking inIndia are as high as 30-45 per cent of GNP. Themain sources of rent seeking were price controlsand rationing. Das (2004) finds that the structure ofimport licensing remained restrictive and compli-cated throughout the 1980s and even in the early1990s. In general, labour laws have not changeddramatically and economic reforms have focusedon removing these license regulations rather thanlabour rigidities. This indicates that the observedimprovements in productivity performance stemmostly from the removal of the quota-permit sys-tem and the reason for differences in pre-reformand post-reform performance is directly related tothis quota system.
This article argues that the combination of thetwo distortions caused by labour-rigidity and thematerials-quota were impeding productivitygrowth. An optimizing firm has to equate its labourand material ratio such that marginal returns areequal to the respective prices. But if a firm cannotfire extra workers due to the labour laws, it ends uprequiring more material to reach its optimal alloca-tion. However, the firm cannot buy extra materialsbecause of quota-permit restrictions. Hence, thefirm ends up operating at non-optimal levels. Inisolation, none of these policies would haveresulted in a distorted allocation.
This mechanism also explains the resul tobserved by Chand and Sen (2002) that the liberal-ization of intermediate-good sectors is better forTFP growth than the liberalization of final-goodsectors.
This article also provides another perspective onthe role of inflation in affecting growth in Indianmanufacturing. Inflation combined with creditunavailability forced firms to operate at non-opti-mal input allocation because they could neitherreduce labour (due to labour laws) nor afford tobuy materials (due to credit constraints and signif-icant increase in materials prices due to inflation).This article finds a strong relationship between
I N T E R N A T I O N A L P R O D U C T I V I T Y M O N I T O R 87

materials inflation and real wages (labour produc-tivity) indicating the presence of this channel.
These results provide new perspectives for poli-cymakers regarding two widely used industrialpolicies: labour market regulations and importsubstitution regimes. Ahsan and Pages (2007) findthat in India pro-worker labour policies are associ-ated with reduced productivity growth. Kruger(1997) discusses how it was thought that importsubstitution in manufactures would be the key todevelopment. Earlier explanations about boththese observations, i.e. labour laws slowinggrowth and import substitution policies slowinggrowth, are based on calculating implicit costs orwasted resources. This article finds a direct chan-nel (intermediate inputs) and the distortion mecha-nisms through which productivity is affected.
One of the major impacts of economic reformsin India was to break these interactions by removalof permit quotas and by increasing credit availabil-ity. The distortion-inefficiency mechanismsdescribed above no longer remain relevant becausethe firms are not restricted when choosing theirmaterial input allocation (layoff restrictions havestill not been removed). This article finds that thedistortions in input allocation and their effect onproductivity growth fell significantly after thereforms in the 1990s. It also shows that firms havestarted over-substituting materials relative tolabour. This explains the phenomenon of joblessgrowth in Indian manufacturing. The firms are pro-ducing more output because of this material-deep-ening, but they are avoiding hiring additionalworkers to avoid future inflexibilities and legalissues. Like many other studies, these findings callfor the policy makers to take another look at theexisting labour market regulations in India.
Industrial Economic Policies in India before 1991
The industrial sector became the focus and oneof the early goals of the Indian government’s five-year plans. Just like every other part of the econ-
omy, Indian manufacturing has experienced anevolution of policies in the last three decades. Ithas been the subject of many productivity and pol-icy research studies, but often for the wrong rea-sons. Unlike other sectors in India and unlikemanufacturing sectors in other developing coun-tries, the manufacturing sector in India did not reg-ister many years of consistent high growth untilvery recently. GDP (at 1993-94 prices) in manu-facturing grew almost 10 times between 1960 and2002. But the unimpressive labour productivityand TFP growth estimates from various studieshave portrayed Indian manufacturing as a stagnantsector that is little affected by the early stages ofpolicy reform. Das (2004) finds the TFP growthover the period of 1980-2000 to be negative andattributes this to structural factors.
Inflexible Labour LawsThe Industrial Disputes Act of 1947 states that
the “discharge, dismissal, retrenchment or termi-nation” of an individual workman by an employer“shall be deemed to be an industrial dispute''. Thislaw has motivated many studies on the role oflabour market regulation in India. Labour regula-tion has become a standard part of the explanationsfor India's poor growth performance before the1990s. Besley and Burgess (2004) show thatIndian states which made additional amendmentsto this act in favour of workers experienced loweroutput and productivity in manufacturing. Theyalso find that pro-worker labour regulation is asso-ciated with increases in urban poverty. Fernandesand Pakes (2008) use World Bank Investment Cli-mate Survey data to show that conditional on firmproductivity, factor costs and other factors facedby firms, labour was underutilized in Indian manu-facturing in 2001 and 2004. The supposed explana-tion is that these inflexible labour laws restrictingthe firing of workers in India resulted in firms low-ering their demand for labour. Ahsan and Pages(2007) discuss various types of labour laws inIndia, including Chapter V(b) of the amendment to
8 8 N U M B E R 2 0 , F A L L 2 0 1 0

the Industrial Disputes Act which prohibits firmsthat employ 100 or more workers from retrenchingwithout permission from the state. There arearound 45 pieces of central legislation coveringvarious aspects of employment as well as a largenumber of state laws. Even shifting the weeklyschedules or days offs without notice could be innon-compliance to the labour legislation. Ahsanand Pages (2007) find that regulations that impedeemployment adjustment are associated with nega-tive effects on output.
Quantitative Restrictions:Import Permit Quota
Jagdish Bhagwati (1978) examined in detail thequantitative restrictions which were the buildingblocks of industrial policy in India. These wereguided by the principle of import substitution andwere justified by the aim of protecting domesticproducers. Commodities were divided into variouscategories and producers needed to apply for spe-cific licenses for items not under open generallicense (OGL). Licenses were required for produc-ing new products or expanding production capaci-ties. Mohammad and Whalley (1984) estimate thatthe cost of these rent seeking policies in India wasas high as 30-45 per cent of GNP and it “put Indiain a different category altogether” in terms of theextent of distortions.
Despite being one of the most widely criticizedpolicy choices, not many studies have tried to iden-tify and estimate how this quota system affectedthe growth in Indian manufacturing. Bhagwati andDesai (1970) document the industrial licensingscheme adopted in India after the passage of theIndustries (Development and Regulation) Act of1951. There were several separate license catego-ries. A capital goods (CG) license was required toimport necessary capital goods, while actual user(AU) licenses, issued to producers for imports ofraw materials and intermediate goods, had itemsspecified in considerable detail to ensure that onlythe approved production would be made feasible.
This also required that value and/or quantity limitswere specified for the listed importables on eachlicense. These licenses even specified the compo-sition and the source of the goods and were non-transferable between firms and even betweenplants within a firm. This licensing system wasinefficient since it lacked any evaluation criteriaand there were large administrative costs anddelays.
Other Economic Conditions: High Inflation and Low Credit Availability
Inflation has been consistently high in India.Annual average CPI inflation has been 8.2 per centper year between 1970 and 2003. The pre-1990sand post-1990s inflation rate averages were 8.6 percent and 7.4 per cent respectively, both muchhigher than average inflation in industrialized andnewly industrialized countries. In China, the aver-age retail price inflation between 1978 and 2003was around 5 per cent. Intermediate input priceshave also experienced the same kind of high infla-tion throughout the last three decades. The averageannual inflation rate of materials prices was 7.5 percent.
Using industry specific price index data fromIndia’s Central Statistical Organization, we calcu-late average inflation rates for output in all 58industries. The average inflation is higher than 7per cent per year for 53 industries, with a fewindustries experiencing price increases averagingmore than 11 per cent per year between 1973 and2003. During this period, the annual nominal wageinflation in Indian manufacturing was 9.6 per cent;11.1 per cent per year before 1990 and 7.1 per centper year after 1990.
It was the currency crisis of 1991 in India thatpaved the way for a broad set of reforms includingcapital market reforms. Prior to that, credit mar-kets in India were unorganized and underdevel-oped. Chart 2 shows the lending rates of variouscountries using data from the IMF’s International
I N T E R N A T I O N A L P R O D U C T I V I T Y M O N I T O R 89

Chart 2Lending Rates
Financial Statistics. For India, lending rates were16.5 per cent for the entire decade of the 1980s.They were not only higher than in developed coun-tries such as United States and Germany, but alsohigher than other Asian economies like Singaporeand Malaysia. Interest rates, which denotes thecost of borrowing, remained very high in Indiauntil late 1990s. Capital markets were also under-developed. Table 1 shows stock market capitaliza-tion in 1990 for different countries. For India,market capitalization as percentage of GDP wasmuch lower than for other countries.
Role of Intermediate Inputs in Manufacturing Growth
To see the role of the materials-per-worker ratioin output growth in manufacturing, let us considera simple extension of Solow's growth accountingmodel by including materials as an input in theconstant return to scale production function.
(1)where Y stands for output, K for capital, L for
labour, A is a measure of the production technol-ogy and other unobservable inputs, α is the capitalshare in output and β is the materials share in out-put.
This can be rearranged in per-worker terms as (2)
where k stands for capital per worker and m is materials per worker.
Hence labour productivity growth between twoperiods can be expressed as following.
(3)Hence, labour productivity growth is the sum of
TFP growth and the contributions of capital perworker growth and materials per worker growth.The last term in Equation 3 denotes materials-deepening, which receives little attention in the lit-erature, even though it can be of crucial impor-t ance in exp l a in ing ou tpu t g rowth of t hemanufacturing sector. The estimated values ofinput shares for Indian manufacturing are and , indicating that materials per worker
Y AKαMβL 1 α– β–( )=
YL--- Α K
L----⎝ ⎠
⎛ ⎞ α ML-----⎝ ⎠
⎛ ⎞ βy Akαmβ=≡=
∆ yln ∆ Aln α ∆ kln β ∆ mln×+×+=
α 0.2=
β 0.4=
Table 1Stock Market Indicators in 1990, India and Other Countries, 1990.
Market Capitalization (billions US$)
Market Cap. / GDP (per cent)
Value Traded / GDP (per cent)
India 38.6 12.2 6.9Malaysia 48.6 110.4 24.7Korea 110.6 43.8 30.1Singapore 34.3 93.6 55.4Hong Kong 83.4 111.5 46.3Germany 355.1 22.2 21.4United States 3,059.4 53.3 30.5
in India and Other Countries, 1978-2000
9 0 N U M B E R 2 0 , F A L L 2 0 1 0

is very important for the gross output of the Indianmanufacturing sector.
Value-added (VA), which is widely used as theoutput measure in industry-wide analysis, isobtained by subtracting the real intermediateinputs (M) from real gross output (Y).
(4)or in per-worked terms,
(5)where va stands for value added per worker, and
m is materials-per-worker.Hence the labour productivity growth (using
value-added) is given by (6)
The above equation contradicts the notion thatvalue added productivity growth is independent ofmaterials used. A change in the materials-per-worker ratio between two time-periods affectslabour productivity growth even if the output ismeasured using a value-added concept. In fact,some methodologies try to highlight the impor-tance of intermediate inputs, e.g. Domar weightsand terms-of-trade decomposition. But the generalconsensus is that if we are measuring the output asvalue added, we do not have to worry about theintermediate inputs. As shown in Equation 6, thisis clearly a simplification, as it assumes that thematerials-per-worker ratio remains constantbetween periods.
The importance of raw materials has not beenstudied widely in the Indian manufacturing pro-ductivity literature. The reason is that ideally thismaterials input should have been allocated toequate the returns between the materials andlabour; and hence value-added productivitygrowth should have been independent of the mate-rials input. But this has not been the case withIndian manufacturing. Government policy, or to bemore specific the interaction of government poli-cies, distorted the materials input allocation com-pared to the labour input and this had a negativeeffect on productivity growth. This article definesand estimates some measures of this distortion by
comparing the observed materials-per-workerratio to the (hypothetical) optimal materials-per-worker ratio for the given materials’ prices andwage levels.
Input Distortions and Productivity The presence of channels that transfer the effect
of policy interactions (labour laws in the presenceof quantitative restrictions) and economic condi-tions (high inflation with low credit access) to theproduction process in Indian manufacturing can beverified using the data. From production functionestimates, one can identify whether the value ofmaterials-per-worker is higher than or lower thanthe optimal . A lower means the firm iseither operating with less than the desired materi-als input (due to a quota) or with more than opti-mum number of workers (since the firms cannotlay-off workers).
We can see how these distortion-inefficiencychannels work in different scenarios by consider-ing a simple production model Y = F (A, K, L, M);where output Y is produced using capital K, labourL and materials M. A is the measure of productiontechnology and other unobservable inputs. Theoptimization gives the following first order condi-tions for input allocation in terms of price of labourw and price of materials PM.
(7)
For the Cobb-Douglas production function, thiscondition can be written as
(8)
In response to a positive technology shock, thereis upward pressure on wages due to increased pro-ductivity. Since imported materials prices (PM) aredetermined in the world market, the optimality canonly be achieved by either using more materials orusing less labour. In India, however, the quantita-tive restrictions do not allow a firm to use morematerials, and the inflexible labour laws prohibit a
VA Y M VA AKαMβL 1 α– β–( ) M–=≡–=
va Akαmβ m–=
∆va ∆y ∆m–=ML-----⎝ ⎠
⎛ ⎞ ML-----⎝ ⎠
⎛ ⎞
w ∂Y∂L-------
∂Y∂L-------
∂Y∂M-----------------; w
PM--------==
αLαM--------- M
L----- w
PM-------=•
I N T E R N A T I O N A L P R O D U C T I V I T Y M O N I T O R 91
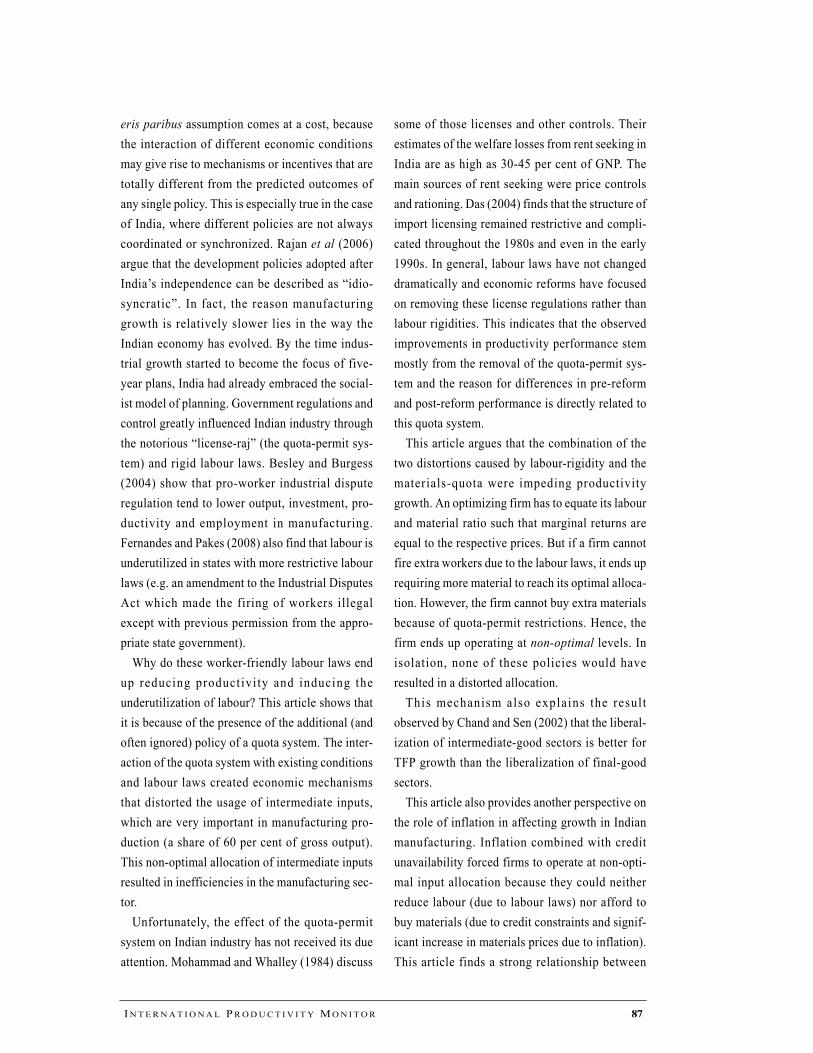
firm from using fewer workers. As a result, theoptimal materials-per-worker ratio is not achieved.Due to these frictions, the gains from technologicalprogress are not fully realized and firms are forcedto operate at non-optimal factor allocations.
The distortion worsens in the presence of risingprices and limited access to credit markets. Let usconsider the effect of high inflation in materials onthe factor allocation choice of a firm. In absence ofcredit, the firms may find it difficult to buy thesame amount of materials as in the last period dueto increased prices. The firm can still operate effi-ciently by shrinking its scale and reducing labourinput according to its budget. But even that is notpossible. Since it is difficult to layoff workers, thefirms have to compromise on materials and mustoperate at a lower materials per worker ratio thanin the last period. This causes the output to godown and hence reduces productivity growth.
Substitutability between Materials and Labour: An Example
One of the main differences between manufac-turing industries and services industries is thatmanufacturing primarily changes the physicalcharacteristics of a good. Unlike the substitutabil-ity between capital and labour, materials andlabour have limited substituability in manufactur-ing. The increased capital input in the form ofmachinery makes some of the workers redundant.But one cannot use labour input in place of thematerials that are required to create the final out-put. Materials and labour inputs are still substitut-able in the sense that firms can outsource some ofthe process of converting to the final good. Ratherthan producing some intermediate materials them-selves, they might directly buy it from other firms.For most of the manufacturing industries, how-ever, the actual production function of their finaloutput is Leontief in terms of the intermediatematerials requirements.
Let us consider the example of a car manufac-turer. The final good, a car, is made by combiningdifferent intermediate goods like engines, airbags,and tires. The production function would be
(10) where, = Scale of Production
= Maximum number of Cars thatcould be made using M.
The function N(M) has the following Leontiefform:N(M) = min (engines, , steering wheel,brake pedal, , ...) (11)
This materials upper-bound function N(M) isnot relevant in cases where the material input is notthe limiting factor and hence only the scale S(K,L)matters. In these cases, the concept of value-addedby capital and labour can explain the output growthcorrectly. But in the case of India, N(M) had anupper bound due to import quota restrictions.Indian manufacturing firms could have reducedtheir scales S(K,L) accordingly, but labour lawsmade that difficult.
Table 2 provides a simple example of how theserestrictions would harm a typical car manufacturerby denying i t the benefi t of technologicaladvances. Note that even after the reforms themanufacturer is not reaching the growth potential.The firms are not hiring more workers even whenit is optimal to do so, because they are worriedabout firing restrictions and extra costs.
Productivity Estimation Methodology
The estimates used in this article are based onthe Annual Survey of Industries (ASI) data version2 released by the Economic and Political WeeklyResearch Foundation.
The Annual Survey of Industries is the principalsource of industrial statistics in India. It providesdata on various vital aspects of registered factoriessuch as employment, wages, invested capital, cap-ital formation, inputs, gross output, depreciation
(9)
Y F K L M, ,[ ] F S K L,( ) N M( ),[ ]= =
S K L,( )
N M( )
tires4
------------airbags
2---------------------
9 2 N U M B E R 2 0 , F A L L 2 0 1 0

and value added, etc. It covers all factories regis-tered under Sections 2m(i) and 2m(ii) of the Facto-ries Act, 1948 i.e. those factories employing 10 ormore workers using power, and those employing20 or more workers without using power. Thedataset is created from these surveys and has 31variables for the years from 1973 to 2003. The arti-cle uses both aggregate level data and industrylevel data for 58 industries based on the 3-digitnational industry classification (NIC) code.
Industry-specific price deflators are taken fromthe wholesale price index series provided byIndia’s Central Statistical Organization (CSO).GDP, GDCF deflators and interest rate series wereavailable from the Reserve Bank of India publica-tion titled Handbook of Statistics of the IndianEconomy.
Real value added is calculated using double-deflation. Gross output is deflated using sector-specific price indexes, materials inputs aredeflated using the wholesale price index for manu-facturing and fuels are deflated using the fuel andenergy price index available from CSO. The busi-ness services input is estimated by subtracting thesum of materials and fuel from the total value ofinputs. This business services input is deflatedusing the consumer price index. The capital inputis generated using the user-cost approach.
This article estimates the unit-input require-ment, which is the amount of each factor that isrequired to produce one unit of output in each year.
It also estimates the productivity growth measuresbased on an index number method which has theadvantage of incorporating the effect of changes infactor shares. A Fisher index is used for aggregat-ing the input quantities. TFP growth is estimated asthe ratio of output growth and input quantity indexgrowth. For gross output all three inputs (capital,labour and materials) are used, while for valueadded only capital and labour inputs are used.
(12)
The above set of estimates are calculated for all-industries data (time period 1970-2003) and forpanel dataset using 3-digit National IndustrialClassification (NIC) codes (time period 1973-2003).
Estimating Distortions There have been few studies which estimate the
extent of distortions in factor allocation. Hsieh andKlenow (2007) quantify this factor misallocationby comparing marginal products of labour and cap-ital in industries in India and China with those inthe United States. Fernandes and Pakes (2008)estimate the underutilization of labour and capitalacross states for Indian manufacturing in 2001.This article uses a similar concept, but rather thanestimating absolute values, it measures the distor-
X t 1 t,+( ) Fisher Quantity IndexQt 1+ Pt 1+ Qt Pt
, , ,( )
=
TFP Y t 1 t,+( )X t 1 t,+( )-------------------------=
Table 2Productivity Growth in Indian Manufacturing – An Example
Scenario Optimal Response L & M Restrictions (Pre-Reform)
Only L Restrictions (Post-Reform)
Baseline L-Prod. = 1 Car/Worker.L ¦ = 100 Workers. M = 100 Engines. 400 Tires. Y = 100 Cars.
PositiveTechnologyShock.
L-Prod. = 1.2 Cars/Worker.L ? (depending on wageincrease and labour supply,assume 110).M = 132 Engines. 528 Tires.Y = 132 Cars.Y Growth = 32%.
= 100 Engines. 400 Tires.(fixed due to permit quota)L ´ (no incentive to increasethe workers) Y = 100 Cars.L-Prod. = 1 Car/Worker.Y Growth = 0%
L ´ (still many disincentivesto increase the workers) M = 120 Engines. 480 Tires.Y = 120 Cars. L-Prod. = 1.2 Cars/Worker.Y Growth = 20%.
M
I N T E R N A T I O N A L P R O D U C T I V I T Y M O N I T O R 93

Chart 3Actual and OpIndian Manufa
tions (under- or overutilization) relative to theother factors.
We believe this is a superior approach. If onetries to measure the misallocation or underutiliza-tion of factors by the amount of extra labour thatwill be required to justify the wages, one is assum-ing that capital is already optimally allocated,which defeats the purpose of this counter-factualexercise. Measuring the relative distortions doesnot depend on these assumptions and, as shownearlier for a Cobb-Douglas specification, thisratio-based relative underutilization measure isdirectly related to productivity growth.
Another problem with earlier approaches is theimplicit assumption that TFP estimates representthe unit-production-values, i.e. if one amount ofeach input is employed, the output will be equal tothe value of estimated TFP for that period. This ishard to justify since there are measurement errorsand many of the unmeasured inputs such as educa-tion and economic conditions are also included inthe TFP estimates. Therefore, it makes more senseto base the analysis on TFP growth, as is done inthis article, rather than on the absolute values ofTFP estimates.
Using ASI data, the production function forIndian manufacturing is estimated using Olley-Pakes and Levinshon-Petrin methodologies on thepanel dataset. These methods give robust estimatesfor the labour, capital and material shares. Theoptimal and ratios are calculated usingthe estimated factor shares and observed factorprices in the corresponding periods. These areobtained by making the ratios of marginal returnson the factors equal to their relative prices. Theestimated underutilization is the differencebetween this optimal ratio and the actual ratio ofinputs used in that period. Underutilization = Optimal (Prices) – Actual
(13)Similarly, the optimal relative substitution val-
ues are calculated using observed changes in factorprices and factor allocations between two time-periods. The under-substitution is the differencebetween the optimal and the actual changes of rel-ative factor allocations.Under-Substitution = Optimal ( Prices) –Actual (14)
Underutilization of Materials and Productivity Growth in Indian Manufacturing
Using data for all-industries, Chart 3 plots themovement of the actual versus the optimal ratio. Compared to 2003, the actual materials-per-worker index is lower than what the optimal shouldhave been for the existing wages and materials'prices in each year. We find that for the entireperiod (1970-2003) materials were on average 25per cent underutilized compared to labour and thisaverage is reduced by half (i.e. 12 percentagepoints) after the reforms in the 1990s. When esti-mating the underutilization of materials with a 3-digit NIC code panel dataset, the unweighted aver-age underutilization of over 58 industries isalmost the same as the all-industries average (24per cent for the 1973-2003 period and 11 per centfor the post-reform period of 1991-2003).
KL----⎝ ⎠
⎛ ⎞ ML-----⎝ ⎠
⎛ ⎞
ML-----⎝ ⎠
⎛ ⎞ML-----⎝ ⎠
⎛ ⎞
∆ ML-----⎝ ⎠
⎛ ⎞ ∆
∆ ML-----⎝ ⎠
⎛ ⎞
ML-----⎝ ⎠
⎛ ⎞
ML-----⎝ ⎠
⎛ ⎞
timal Material-per-Labour Ratios (M/L) in cturing, 1970-2003
9 4 N U M B E R 2 0 , F A L L 2 0 1 0

eriod
– 97 97 – 03
7.0 3.22.7 -3.78.7 -3.96.9 5.44.7 0.9
4.3 6.90.8 2.8
1.9 4.32.2 4.8
-90 and 1990-io for 3-Digit
Similarly, the estimates show that compared tolabour, capital input is being over-utilized in thelater periods. These results are similar to those ofFernandes and Pakes (2008), who found overuti-lization of capital in 2001 and 2004. This overuti-lization happened because capital prices droppedsignificantly after 1990s and Indian manufacturingfirms started over-substituting capital relative tolabour. One explanation for this trend might be thefact that the reforms did not change the labourlaws. A firm still needs to obtain governmentapproval to layoff workers and such approval israrely given. Expecting these issues, firms prefernot to hire the workers and over-substitute otherfactors (capital and materials) compared to what isoptimal at the existing prices. This leads to theobserved overutilization of capital.
This article finds that some industries (specifiedby their 3-digit NIC code) are over-substituting thematerials input relative to labour input. Thisobserved presence of over-substitution of materialsrelative to labour in the 1970s and 1980s does notimply that few firms somehow got around thelicensing requirements. It simply means that evenwhen wages went down (relative to materials prices)the firms did not hire more workers. The firms mighthave done this for two reasons. Their input factorallocation was already distorted and materials wereunderutilized, so the firms did not want to increasethis distortion. Another reason might be that theseforward-looking firms knew that in the future theywould not be able to obtain the extra materialsrequired to make these workers more productive andneither would they be able to fire these workers ifrelative prices change again. Thus, they chose not tohire extra workers even when it was optimal to do soat the existing prices.
The estimated average of over-substitution ofmaterials relative to labour for all-industries isaround 3.6 per cent per year. But this varies byperiod, with the average being 0.7 per cent in the1970s and 7.2 per cent between 1996 and 2003. Forthe years after the reforms, this over-substitution
of materials relative to labour is continuouslyincreasing despite the fact that the materials are nolonger underutilized relative to labour. This trendindicates that producers are unwilling to hire work-ers due to labour market inflexibilities and firingcosts, which should be a concern for Indian policy-makers.
The period averages of estimated growth ratesare shown in Table 3. We can see that firms havebeen continuously increasing their materials usagemuch faster than their labour input usage. This
Table 3Growth Rates in Indian Manufacturing by P(average annual rate of change in per cent)
1970 – 2003
70 – 80 80 – 90 90
Gross Output 6.0 6.4 6.6Labour 1.1 3.6 0.4Capital 3.6 3.8 4.4Materials 6.5 4.8 8.8Value-Added 4.4 6.4 4.1Using Gross-OutputLabour Productivity 4.9 2.8 6.2TFP 1.3 2.4 2.2 -Using Value-AddedLabour Productivity 3.2 3.0 3.6TFP 2.3 4.6 4.2 -
Chart 4Change in Productivity Growth between 19812000 by Average Materials-Gross Output RatIndustries
I N T E R N A T I O N A L P R O D U C T I V I T Y M O N I T O R 95
Chart 5Material-pIndian Ma
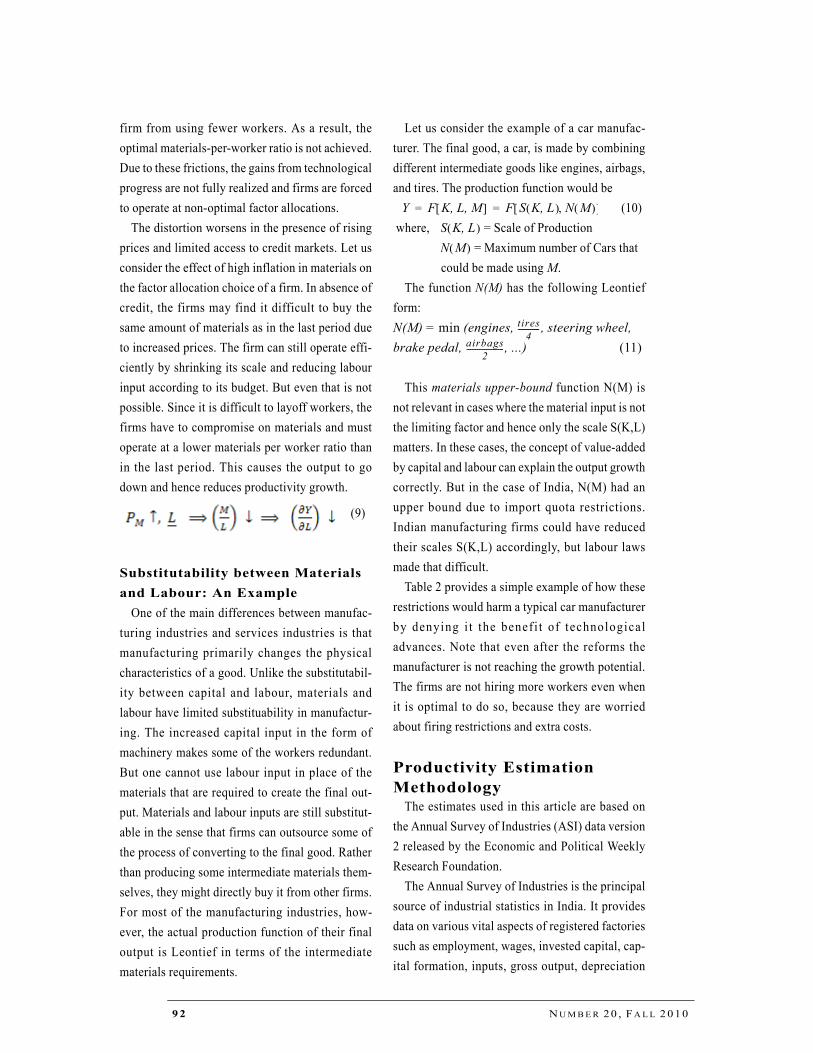
results in increased labour productivity growth,averaging 6.2 per cent per year for the 1980-90sub-period and 6.9 per cent for 1997-2003 as thefirms try to move towards an optimal materials-per-worker allocation.
The estimates in Table 3 show that the immedi-ate impact of the reforms was negative, as bothlabour productivity growth and TFP growthslowed down in the 1990-97 period. But if we lookat the jump in labour and capital imput growth dur-ing these years, the estimates make sense. Sincethe industrial reforms coincided with the openingof capital markets in 1991, Indian manufacturingunits started expanding due to easier access to cap-ital irrespective of their productivity. But once
capital markets developed and competition fromforeign firms increased, the resources started flow-ing from inefficient units and industries to moreefficient ones (this reallocation is sometimescalled churning). The government disinvestmentinitiative also helped in this process. The resultwas a 3.2 per cent annual average growth in grossoutput between 1997 and 2003, despite using lesscapital stock and fewer workers.
To verify whether the abolition of industriallicensing helped to remove these distortions, thisarticle estimates the industry-wide average pro-ductivity growth in the years preceding and fol-lowing the reforms. Chart 4 presents the resultsbased on a 3-digit industrial panel data accordingto the average materials to gross output (nominal)ratio for manufacturing. The industries using morematerials should have faced higher distortions andhence should have benefitted more from theremoval of the restrictions. The scatter-plot inChart 5 confirms this. It shows the increase in 10-year average annual productivity growth ratesbetween post and pre reform periods (i.e. 1990 to2000, and 1981 to 1990) is higher for industriesthat use materials more heavily.
In the Indian manufacturing sector, the interac-tion of the quota permit system and labour laws ledto sub-optimal materials-per-worker usage andthus slowed down labour productivity growth.This mechanism is identified by finding the corre-lation between underutilization and productivitygrowth. Similarly, the combination of high infla-tion in materials and less developed credit marketsreduced the intermediate input usage in response toprice increases, which in turn resulted in lowerlabour productivity. This second mechanism isrecognized by looking at the relationship of mate-rials inflation with productivity and real wages.This article estimates these two channels usingaggregate data (all-industries) and panel data con-sisting of 58 industries based on 3-digit NIC code.The summary of the main relationships for the
er-Labour Growth and TFP Growth in nufacturing
9 6 N U M B E R 2 0 , F A L L 2 0 1 0

panel data is shown in Table 4 and Table 5; and theestimates are plotted in Chart 5.
For both panel and aggregate data, underutiliza-tion of materials is negatively correlated to labourproductivity levels and growth. More interest-ingly, the underutilization of ( ) is also nega-t ive ly re la ted to TFP growth . The l abourproductivity relation is simply an implication ofdistorted input allocations. But it is not obviouswhy TFP growth should be affected by materialsand labour usage. One explanation can be that thisunderutilization gives rise to other inefficiencies
as well. For example, to work with less materialinput per worker, the production process needs tobe reorganized and machines run fewer hours perweek. This change in schedule can cause disrup-tion and lower productivity.
The distortion measures (underutilization andunder-substitution) are negatively related to TFPgrowth because of the nature of the Indian govern-ment’s policies. Labour is bounded by below andmaterial input has an upper bound. Since ( ) islower than the optimal at existing prices, anychange that makes this underutilization worse is
ML-----
ML-----
Table 4Distortions and Productivity Correlations, 1970-2003, 3-Digit NIC Code Panel
Productivity Measure (Y) Distortion Measure (X) Corr. Co-Var. Pooled OLS βLab. Prod. (GO) Under-Util. M/L -0.69 -0.29 -0.99***
Over-Util. K/L 0.6 0.29 0.74***Lab. Prod. (Val-Add) Under-Util. M/L -0.26 -0.15 -0.5***
Over-Util. K/L 0.29 0.19 0.46***∆ Lab. Prod. (GO) Under-Subs. M/L -0.42 -0.33 -0.5***
Over-Subs. K/L 0.18 0.2 0.21*∆ Lab. Prod. (Val-Add) Under-Subs. M/L -0.3 -0.28 -0.34***
Over-Subs. K/L 0.21 0.25 0.36***∆ TFP (GO) Under-Util. M/L -0.31 -0.27 -0.37***
Over-Util. K/L 0.2 0.13 0.23∆ TFP (Val-Add) Under-Subs. M/L -0.26 -0.21 -0.35**
Over-Subs. K/L 0.17 0.13 0.19*10% significance level ** 5% significance level *** 1% significance level
Table 5Factor Inputs, Prices and Productivity, 1970-2003, 3-Digit NIC Code Panel
Productivity Measure (Y) Input/Price Measures (X) Pooled OLS βReal Wage Inflation Materials Inflation -5.91***
-8.6*** (73-90)0.003 (91-03)
∆ Lab. Prod. (GO) Materials Inflation -0.32***∆ Lab. Prod. (Val-Add) Materials Inflation -0.39Lab. Prod. (Val-Add) L Growth, M Growth -0.39***, 0.11**∆ Lab. Prod. (GO) L Growth, M Growth -0.46***, 0.33***
-0.73***, 0.7*** (91-03)∆ Lab. Prod. (Val-Add) L Growth, M Growth -0.34***, 0.18***
-0.43***, 0.48*** (91-03)∆ TFP (GO) L Growth, M Growth -0.22***, 0.2*** (91-03)∆ TFP (Val-Add) L Growth, M Growth -0.23***, 0.12***
-0.31***, 0.38*** (91-03)*10% significance level ** 5% significance level *** 1% significance level
I N T E R N A T I O N A L P R O D U C T I V I T Y M O N I T O R 97

going to increase the inefficiencies. That is whylabour growth is negatively related to TFP growthand materials growth is positively related to TFPgrowth.
Labour productivity measured in value-addedterms is negatively related to labour growth due todecreasing marginal product. The estimates showthat even value-added labour productivity is posi-tively related to materials growth. This highlightsthe importance of material input for the manufac-turing sector performance. The reason for thisfinding is the widespread underutilization in mate-rials in Indian manufacturing resulting from thepresence of restrictive industrial policies. Anincrease in the growth rate of materials helps toreduce this distortion and enables workers toincrease their value-added.
The estimates show that the measures of produc-tivity growth are negatively related to under-sub-stitution of materials relative to labour andpositively related to growth in materials usage.These results support the presence of distortion-inefficiency channels operating through the inter-action of policies. The under-substitution leads tothe worsening of input distortion, and hence usingless material inputs per worker, resulting in lowerproductivity growth. An increase in materialsusage helps to bring the input allocation closer tooptimal and increases productivity growth. Thisarticle also finds that intermediate input (materi-als) price inflation is negatively related to realwage growth. This negative correlation occursbecause in the absence of credit availability, therising materials prices mean fewer materials perworker and thus reduced labour productivity. Thislower labour productivity means a drop in realwages. The overutilization of capital relative tolabour has a positive correlation with labour pro-ductivity, which is the usual capital-deepeningeffect.
Role of Economic ReformsIndia's current phase of economic reforms began
in 1991 when the government faced an exception-ally severe balance-of-payments crisis. The Con-gress government at the time started short-termstabilization processes followed by longer-termcomprehensive structural reforms. In 1991, thegovernment of India adopted the New IndustrialPolicy. It abolished industrial licensing for almostall industries, irrespective of the levels of invest-ment. This industrial policy was supported bytrade policy that removed import restrictions andliberalized foreing direct investment as part of themulti-faceted gradual reform process. Ahluwalia(2002) outlines and evaluates these sets of struc-tural reforms. India’s reform program alsoincluded wide-ranging reforms in the banking sys-tem and capital markets relatively early in the pro-cess, with reforms in insurance introduced at alater stage.
These reforms broke down two major links thatwere responsible for distorted input usage andlower productivity growth. The removal of quanti-tative restrictions meant that firms were no longerforced to operate at a sub-optimal level. Firms stillcannot reduce the number of workers, but they canincrease the intermediate inputs usage (and capitalusage) and make the allocation optimal for givenprices. Similarly, improved credit access meantthat firms could reach this optimal allocation evenin periods of high inflation. Firms can borrowmoney, use the optimal inputs and repay the loanafter selling the output (because higher intermedi-ate input prices usually mean that output prices arealso higher).
The estimated growth rates and relationshipsamong them in Tables 3 and 4 clearly show thepositive impact of the reforms. After the reforms,materials growth averaged around 7 per cent peryear between 1991 and 2003 for all-industries. Theeffect of materials growth on labour productivitygrowth and TFP growth amplified after 1991. Thepooled OLS coefficient between materials growth
9 8 N U M B E R 2 0 , F A L L 2 0 1 0

and labour productivity growth is 0.7 for the sub-sample 1991-2003, more than double the value forthe entire time period of 1970-2003. The increase
in coefficient value implies that materials growthis becoming more important in labour productivitygrowth.
Chart 6Imports of Intermediate Inputs in India – Levels and Growth Rates, 1987-2005
I N T E R N A T I O N A L P R O D U C T I V I T Y M O N I T O R 99

Chart 7Input/Output Rati1970-2003
As mentioned earlier, some of the estimationresults run contrary to the conventional wisdomwhich suggests that growth in net value addedshould not depend on materials at all. This articlefinds that labour productivity growth and TFPgrowth measured in value added terms are stronglycorrelated with growth in materials usage. Thisrelationship becomes stronger after the reforms(pooled OLS coefficient is 0.48 for subsample of1991-2003 compared to 0.18 for the entire timeperiod). The relationship between intermediateinput inflation and real wages breaks down afterthe reforms. The coefficient is close to zero and nolonger significant after 1991. The explanation isthat the inflation-productivity mechanism wasbeing driven by low credit availability. Reformsincreased the credit availability by liberalizingcapital markets.
Another important consequence of the economicreforms was that one of the restrictions that onlyapplied to the manufacturing industry wasremoved. The import quota and industrial licens-ing policies abolished during the reforms weremore relevant to the manufacturing sector than theservice sector. In recent years, the growth rates of
the manufacturing sector have been higher than theservice sector growth rates; this was somethingvery uncommon in the years before the reforms.
Did Import Quotas Lead to Underutilization and Bottlenecks?
The quantity restrictions were only applicable toimported goods. But there were no controls onbuying intermediate inputs from within the coun-try. It will be prudent to make a distinctionbetween imported and domestic materials inputand then re-do the whole analysis. The underuti-lization and its negative effect on Indian manufac-turing productivity should exist only for importedmaterials. Unfortunately, the ASI dataset does nothave the split between domestic and importedmaterials.
We can look at two different trends which indi-cate that the imported intermediate inputs were thereal bottlenecks in Indian manufacturing. Theactual production process of many manufacturingindustries can be characterized as a Leontief spec-ification, where production involves transformingthe input. In such industries, output - and thuslabour productivity - becomes restricted by theleast freely available input. In the presence of animport permit-quota system, the least freely avail-able inputs were imported intermediate goods.
If imported inputs were the bottlenecks, theremoval of these restrictions would lead to anincrease in demand for these inputs without corre-sponding increase in the other inputs. That isexactly what happened in Indian manufacturing.As shown in Table 3, the materials input grew atthe average annual rate of 6.9 per cent and 5.4 percent for the 1990-97 and 1997-2003 periodsrespectively. The corresponding average growthrate for labour input were 2.7 per cent and -3.7 percent. Chart 6 shows the growth in imported rawmaterials and intermediate inputs. There is a dis-tinct jump after the reforms. The growth rates of allthe imported items other than coal increased sig-
os in Registered Indian, Manufacturing,
1 0 0 N U M B E R 2 0 , F A L L 2 0 1 0

anufacturing
nificantly. Indian manufacturing firms that werepreviously forced to operate at less than optimal( ) ratio due to quota restrictions started movingtowards their potential productivity by importingand using more intermediate inputs.
The continuous increase in the material contentof output, as shown in Chart 7, indicates thatIndian manufacturing is becoming more special-ized or high-end. But the production of (low value)intermediate goods is not being outsourced to theunorganized manufacturing sector in India, as bothoutput share and output growth rates of the unorga-nized manufacturing sector have declined in theyears after the reforms (Chart 8).
This reaffirms the belief that only the importedintermediate-inputs were the bottlenecks. TheIndian manufacturing firms were not restricted intheir access to raw materials and intermediate-inputs that were domestically available. But thesegoods were not perfect substitutes for the quota-restricted imported intermediate inputs. The pro-duction functions of manufacturing firms (e.g.chemical, semi-conductors, electronics, and spe-cialized goods) often have Leontief type comple-mentarities between intermediate inputs andlabour input. The restrictions on these goods cre-ated a bottleneck that choked the productivitygrowth in Indian manufacturing.
In fact, the concurrent trends of the increase inthe growth rates of imported intermediate goodsand the decrease in the growth rates of unorganizedmanufacturing output are consistent with themechanisms discussed. Since there were norestrictions on buying domestically produced rawmaterials, which were often bought by the unorga-nized manufacturing sector, the reforms had nodirect effect on these firms. But the firms in theorganized sector, which were previously using the(imperfect) substitutes produced domestically bythe unorganized sector, started reducing their reli-ance on these domestic goods after the reforms andstarted importing the desired intermediate inputs.
This is why the output growth rate of the unorga-nized sector fell in the late 1990s.
ConclusionThis article has shown how the import permit-
quota system in the presence of inflexible labourlaws resulted in input distortions in Indian manu-facturing that had negative effects on productivitygrowth. The role of intermediate inputs in the man-ufacturing sector deserves greater attention, espe-cially for developing countries. Even though thereforms have abolished import restrictions in
ML-----
Chart 8Share and Growth Rate of the Unorganized MSector in India, 1970-2003
I N T E R N A T I O N A L P R O D U C T I V I T Y M O N I T O R 101
India, labour laws are still unchanged. Indian man-ufacturing firms are shying away from hiringworkers, which is not socially desirable. India hasa huge pool of unskilled workers and the need tomove them out of the unproductive agriculturalsector is becoming more urgent. Policymakersshould reconsider these labour laws in view of thefact that they are hindering employment growthand leading to jobless output growth in Indianmanufacturing.
The evidence of the mechanisms identified inthis article would be more robust if the data onimported and domestic materials input wereincluded in the analysis. In the absence of suchdata, one could try to rank the industries based ontheir imported input requirements and then seewhether the effects are more severe in the indus-tries that use a larger share of imported materials.Another important dimension in analyzing theresults is the production function complementari-ties between materials and labour. We should seemore prominent results in industries which haveLeontief type production processes.
References Ahluwalia, M. (2002) "Economic reforms in India since
1991: has gradualism worked? Journal of Eco-nomic Perspectives," Vol. 16, No. 3, pp. 67-88.
Ahsan, A. and Pages, C. (2007) "Are all labor regula-tions equal?: Assessing the effects of job security,labor dispute, and contract labor laws in India,"World Bank Working Paper, No. 4259.
Basu, K. and Maertens, A. (2007) “The pattern and causes of economic growth in India,” Oxford
Review of Economic Policy, Vol. 23, No. 2, pp. 143-167.
Besley, T. and Burgess, R. (2004) "Can Labor Regula-tion Hinder Economic Performance? Evidence From India," Quarterly Journal of Economics, Vol. 19, No. 1, pp. 91-134.
Bhagwati, J. (1978) Anatomy and consequences ofexchange control regimes, National Bureau ofEconomic Research.
Bhagwati, J, and Desai, P. (1970) India: planning forindustrialization: industrialization and trade poli-cies since 1951, Oxford: Oxford University Press.
Chand, S. and Sen, K. (2002) "Trade liberalization andproductivity growth: evidence from Indian manu-facturing," Review of Development Economics, Vol.6, No. 1, pp. 120-132.
Das, D. (2004) "Manufacturing productivity under vary-ing trade regimes: India in the 1980s and 1990s,"Economic and Political Weekly, Vol. 39, No. 5.
Fernandes, A., and Pakes, A. (2008) "Factor utilizationin indian manufacturing: A look at the world bankinvestment climate surveys data," NBER WorkingPaper, No. 14178.
Hsieh, Chang-Tai and Klenow, Peter, J. (2007) “Misal-location and Manufacturing TFP in China andIndia”, NBER Working Papers, No. 13290.
Kochhar, K., U. Kumar, R. Rajan, A. Subramanian,, andI. Tokatlidis, I. (2006) "India's pattern of develop-ment: What happened, what follows?" Journal ofMonetary Economics, Vol. 53, No. 5, pp. 981-1019.
Krueger, A. (1997) "Trade policy and economic devel-opment: how we learn.," American EconomicReview, Vol 87, No. 1, pp. 1-22.
Mohammad, S. and J. Whalley (1984) "Rent seeking inIndia: its costs and policy significance," Kyklos,Vol. 37, No. 3, pp. 387-413.
1 0 2 N U M B E R 2 0 , F A L L 2 0 1 0