Embed Size (px)
Citation preview
8/7/2019 Indian Leather & Tanning Industry Profile 2010
http://slidepdf.com/reader/full/indian-leather-tanning-industry-profile-2010 1/43
Indian Leather & Tanning IndustryProfile 2010
8/7/2019 Indian Leather & Tanning Industry Profile 2010
http://slidepdf.com/reader/full/indian-leather-tanning-industry-profile-2010 2/43
2
CONTENTS
Sr No ChaptersPg No
1 Introduction3
2 Positioning Indian Leather in the Global Market6
3 Horizontal Spread of the Industry13
4 West Bengal – A Case Study in Tanning
32
5 Government Initiatives
36
6 Indian Leather Industry – A SWOT Analysis 39
7 List of Tables 42
Annexure 43
8/7/2019 Indian Leather & Tanning Industry Profile 2010
http://slidepdf.com/reader/full/indian-leather-tanning-industry-profile-2010 3/43
3
1. Introduction
Chronologically the birth of Leather in India dates back to 3,000 years B.C. The innate strengths,
innovative technology and marketing strategies have converted the comparative advantage of India
into a commercial success making the country a cynosure of Leather and Tanning in the Global
Leather Map.
1.1 The Industry- Economic Significance
The Euro 5.25 Billon1, Indian Leather Industry – 6th largest in the World2, is one of the major
established manufacturing industries in the modern as well as traditional sector. It is an indigenous
industry in which the country is well endowed with an affluence of raw materials, skilled manpower,
innovative technology, increasing industry compliance to international environment standards and the
dedicated support of the allied industries. The industry has undergone a structural change during the
last three decades, from merely an exporter of raw material in the sixties to that of value added
products occupying a place of prominence in the Indian economy in terms of foreign trade, employment
generation and growth and is among the top ten foreign exchange earners for the country, gradually
parading towards the magic figure of Euro 5.27 Billion3 of exports by 2013-14.
1.2 Industry – Structure
Leather product / leather industry in India is spread over organized as well as unorganized sector
dominated by the presence of family units. The small scale, cottage and artisan sectors account for
over 90% of the total production.
Table 1- Sectoral Classification of the Production Units 4
Type of Unit Turnover
Small < Euro 2.25 Million
Medium Euro 2.25 -11.25 Million
Large Euro11.25 – 41.25 Million
1 CLE –Report – Export of Leather & Leather Products – Facts and Figures 2008-09 where 1USD =..75 Euro and 1 INR = .015 Euro , Apr
23,10
2 ’Indian Leather Exports-Prospects & Problems’ –CLE (Council for Leather Exports) 3 Same as 14 Leather & Leather Products industry in Selected Asia-Pacific Countries – An In depth Study of Competitiveness – Mr. A.A. Gopalakrishnan-
Pg 60
8/7/2019 Indian Leather & Tanning Industry Profile 2010
http://slidepdf.com/reader/full/indian-leather-tanning-industry-profile-2010 4/43
4
1.3 Major production Centres
The major production centers for leather and leather products are located in Tamil Nadu -Chennai,Ambur, Ranipet, Vaniyambadi, Trichy, Dindigal; West Bengal – Kolkata; Uttar Pradesh - Kanpur,
Agra and Noida; Maharashtra – Mumbai; Punjab – Jallandhar; Karnataka – Bangalore; Andhra
Pradesh – Hyderabad; Haryana - Ambala, Gurgaon, Panchkula and Karnal and Delhi.
Table 2- Top 8 States in Terms of Manufacturing Units
States Footwear Units (
Factories +
Household)
Leather Garments
+ Leather Goods
Units
Total
Tamil Nadu 160 598 758
West Bengal 230 436 666Uttar Pradesh 268 22 290
Haryana & Punjab 163 8 171New Delhi 112 43 155
Andhra Pradesh 128 10 138Karnataka 48 40 88
Maharashtra 20 48 68
1.4 Table 3 - Estimated Production Capacities:
Item CapacityLeather Footwear 909 Million Pairs
Leather Shoe Uppers 100 Million PairsNon – Leather Footwear 1056 Million Pairs
Leather Garments 16 Million PiecesLeather Goods 63 Million Pieces
Industrial Gloves 52 Million PairsSaddlery & Harness 12.50 Million Pieces
Source: CLRI – Central Leather Research Institute
1.5 Distinguishing Features
Own raw material source - 21% of world cattle & buffalo and 11% of world goat & sheep
population are housed in India.
2 Billion sq feet of leather produced annually
2nd largest producer of Footwear and Leather Garments
8/7/2019 Indian Leather & Tanning Industry Profile 2010
http://slidepdf.com/reader/full/indian-leather-tanning-industry-profile-2010 5/43
5
3rd largest producer of saddlery and harness items.
Generating employment for 2.5 Million people, mostly from the weaker sections with 30%
women predominance.
Nearly 60-65% of the production is in the small / micro sector5
Promising technology inflow and Foreign Direct Investment
World-class institutional support for Design and Product Development, Human Resources
Development and R&D activities
Presence of support industries like leather chemicals and finishing auxiliaries
Presence in major markets-Long European experience and strategic location in Asian
landmass
5 CLE Directory 2008
8/7/2019 Indian Leather & Tanning Industry Profile 2010
http://slidepdf.com/reader/full/indian-leather-tanning-industry-profile-2010 6/43
6
2. Positioning Indian Leather in the Global Market
Indian leather industry today has attained well-merited recognition in the international market besides
occupying a place of pride within the domestic market.
India accounts for 6% of the global market in leather goods and 2.78% of the World Import of
Leather and Leather Products 6.
India’s export of leather and leather products increased from Euro 1618.01 Million in 2003-04
to Euro 2627.01 Million in 2008-09 registering a phenomenal growth rate of 10.17%.
India is the 5th largest exporter of Leather goods and accessories in the World with a lion’s
share of 24.27% in the country’s export of Leather & Leather Products.
2.1 Export Performance:
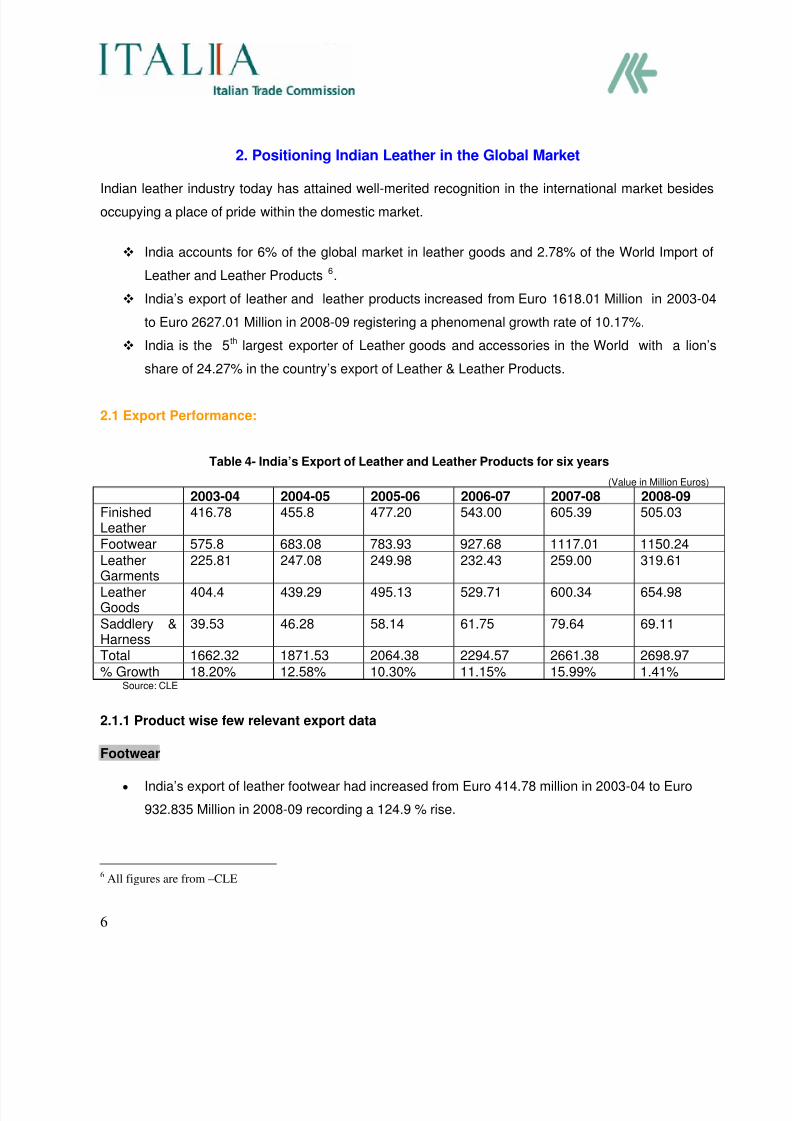
Table 4- India’s Export of Leather and Leather Products for six years
(Value in Million Euros)
2003-04 2004-05 2005-06 2006-07 2007-08 2008-09FinishedLeather
416.78 455.8 477.20 543.00 605.39 505.03
Footwear 575.8 683.08 783.93 927.68 1117.01 1150.24
LeatherGarments
225.81 247.08 249.98 232.43 259.00 319.61
LeatherGoods
404.4 439.29 495.13 529.71 600.34 654.98
Saddlery &Harness
39.53 46.28 58.14 61.75 79.64 69.11
Total 1662.32 1871.53 2064.38 2294.57 2661.38 2698.97
% Growth 18.20% 12.58% 10.30% 11.15% 15.99% 1.41%Source: CLE
2.1.1 Product wise few relevant export data
Footwear
• India’s export of leather footwear had increased from Euro 414.78 million in 2003-04 to Euro
932.835 Million in 2008-09 recording a 124.9 % rise.
6 All figures are from –CLE
8/7/2019 Indian Leather & Tanning Industry Profile 2010
http://slidepdf.com/reader/full/indian-leather-tanning-industry-profile-2010 7/43
7
• India’s export of footwear components had increased from Euro 120.95 million in 2003-04 to
Euro 184.76 million in 2008-09 recording a 52.76% growth.
• India’s export of footwear (leather, non-leather & footwear components) had increased from
Euro 575.8 million in 2003-04 to Euro 1150.25 million in 2008-09, growing at a CAGR of 99.8%
Leather Garments
• India’s export of leather garments had increased from Euro 225.81 million in 2003-04 to Euro
319.61 million in 2008-09 growing at 41.54%.
Leather Goods & Accessories
• India’s export of leather goods & accessories had increased from Euro 404.41 million in 2003-
04 to Euro 654.98 million in 2008-09 registering a growth of 61.96%
Saddlery & Harness
• India’s export of saddlery & harness had increased from Euro 39.53 million in 2003-04 to Euro
69.11 million in 2008-09 with a phenomenal 74.83% growth.
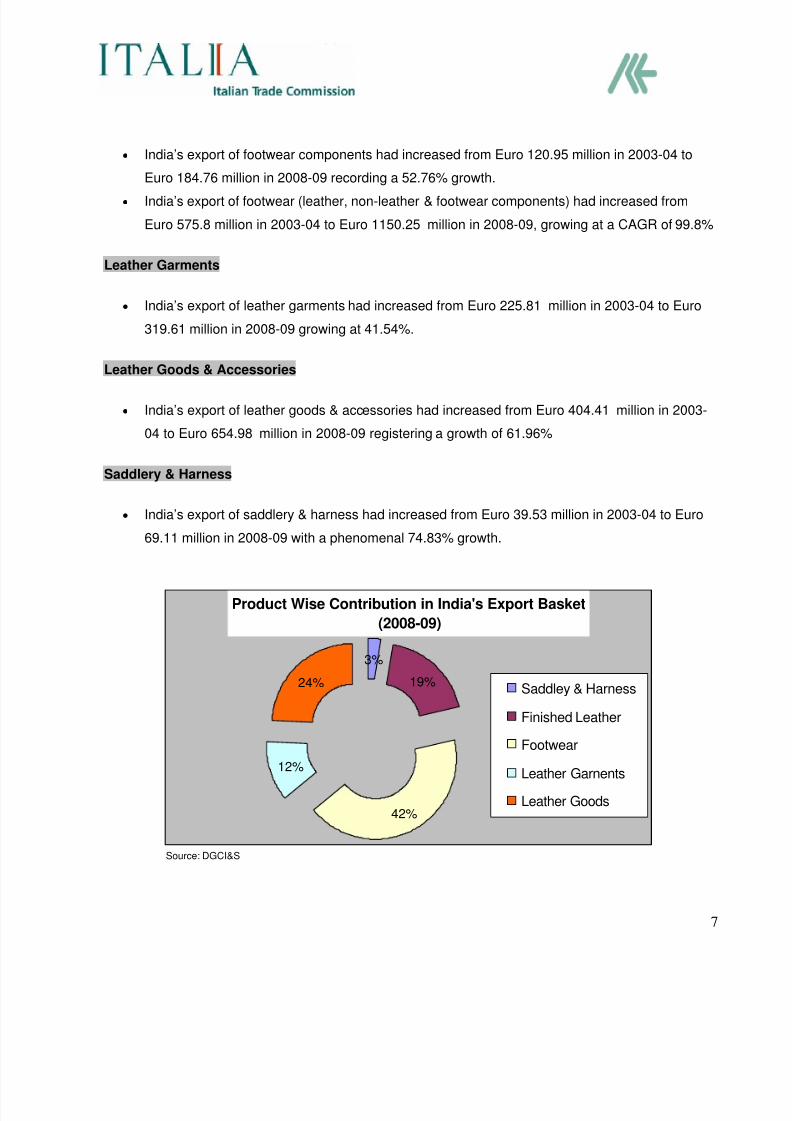
Product Wise Contribution in India's Export Basket
(2008-09)
3%
19%
42%
12%
24% Saddley & Harness
Finished Leather
FootwearLeather Garnents
Leather Goods
Source: DGCI&S
8/7/2019 Indian Leather & Tanning Industry Profile 2010
http://slidepdf.com/reader/full/indian-leather-tanning-industry-profile-2010 8/43
8
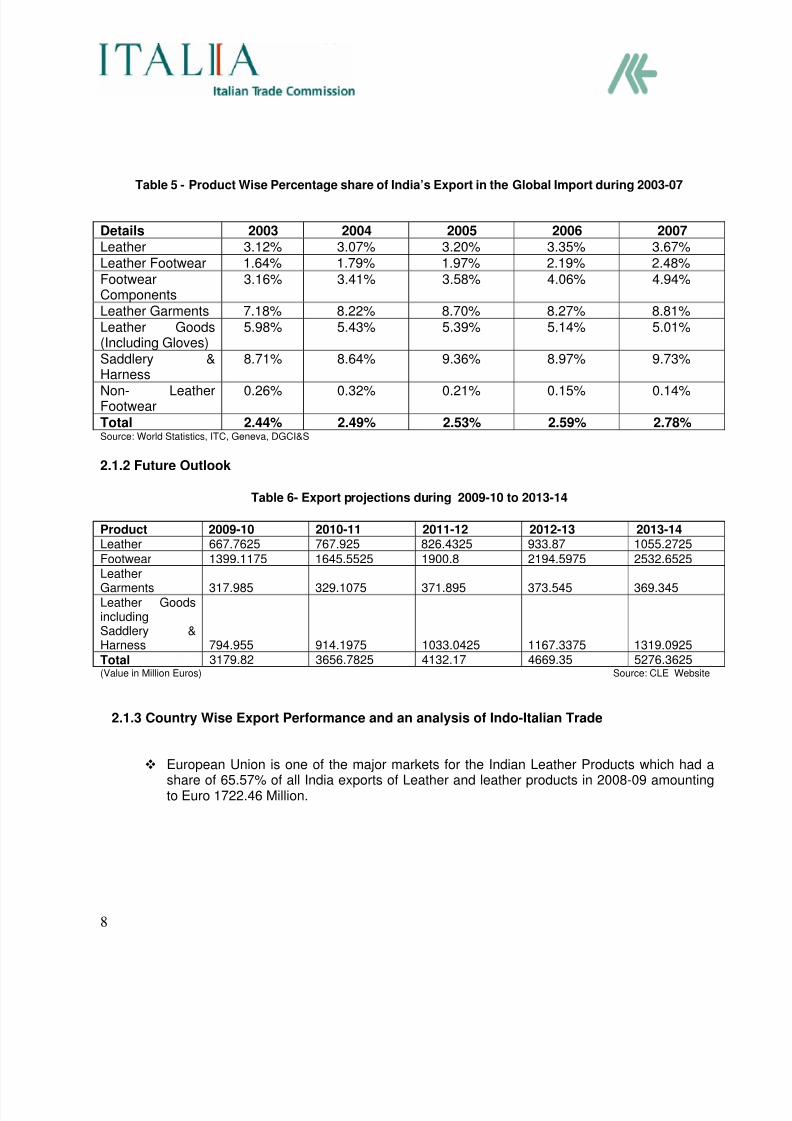
Table 5 - Product Wise Percentage share of India’s Export in the Global Import during 2003-07
Details 2003 2004 2005 2006 2007Leather 3.12% 3.07% 3.20% 3.35% 3.67%Leather Footwear 1.64% 1.79% 1.97% 2.19% 2.48%FootwearComponents
3.16% 3.41% 3.58% 4.06% 4.94%
Leather Garments 7.18% 8.22% 8.70% 8.27% 8.81%Leather Goods(Including Gloves)
5.98% 5.43% 5.39% 5.14% 5.01%
Saddlery &
Harness
8.71% 8.64% 9.36% 8.97% 9.73%
Non- LeatherFootwear
0.26% 0.32% 0.21% 0.15% 0.14%
Total 2.44% 2.49% 2.53% 2.59% 2.78%Source: World Statistics, ITC, Geneva, DGCI&S
2.1.2 Future Outlook
Table 6- Export projections during 2009-10 to 2013-14 Product 2009-10 2010-11 2011-12 2012-13 2013-14Leather 667.7625 767.925 826.4325 933.87 1055.2725
Footwear 1399.1175 1645.5525 1900.8 2194.5975 2532.6525LeatherGarments 317.985 329.1075 371.895 373.545 369.345Leather GoodsincludingSaddlery &Harness 794.955 914.1975 1033.0425 1167.3375 1319.0925
Total 3179.82 3656.7825 4132.17 4669.35 5276.3625(Value in Million Euros) Source: CLE Website
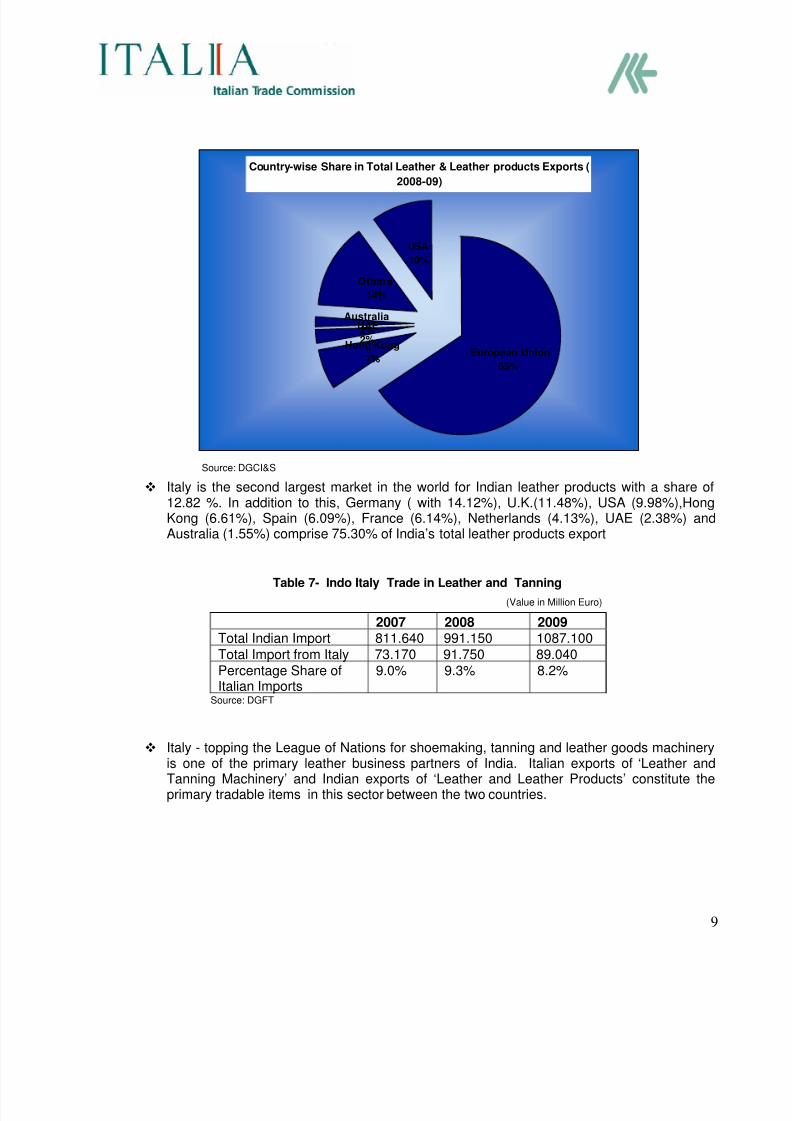
2.1.3 Country Wise Export Performance and an analysis of Indo-Italian Trade
European Union is one of the major markets for the Indian Leather Products which had ashare of 65.57% of all India exports of Leather and leather products in 2008-09 amountingto Euro 1722.46 Million.
8/7/2019 Indian Leather & Tanning Industry Profile 2010
http://slidepdf.com/reader/full/indian-leather-tanning-industry-profile-2010 9/43
9
Country-wise Share in Total Leather & Leather products Exports (
2008-09)
European Union
65%
Hong Kong
7%
UAE
2%
Australia
2%
Others
14%
USA
10%
Source: DGCI&S
Italy is the second largest market in the world for Indian leather products with a share of12.82 %. In addition to this, Germany ( with 14.12%), U.K.(11.48%), USA (9.98%),HongKong (6.61%), Spain (6.09%), France (6.14%), Netherlands (4.13%), UAE (2.38%) andAustralia (1.55%) comprise 75.30% of India’s total leather products export
Table 7- Indo Italy Trade in Leather and Tanning
(Value in Million Euro)
2007 2008 2009Total Indian Import 811.640 991.150 1087.100Total Import from Italy 73.170 91.750 89.040Percentage Share ofItalian Imports
9.0% 9.3% 8.2%
Source: DGFT
Italy - topping the League of Nations for shoemaking, tanning and leather goods machineryis one of the primary leather business partners of India. Italian exports of ‘Leather andTanning Machinery’ and Indian exports of ‘Leather and Leather Products’ constitute theprimary tradable items in this sector between the two countries.
8/7/2019 Indian Leather & Tanning Industry Profile 2010
http://slidepdf.com/reader/full/indian-leather-tanning-industry-profile-2010 10/43
10
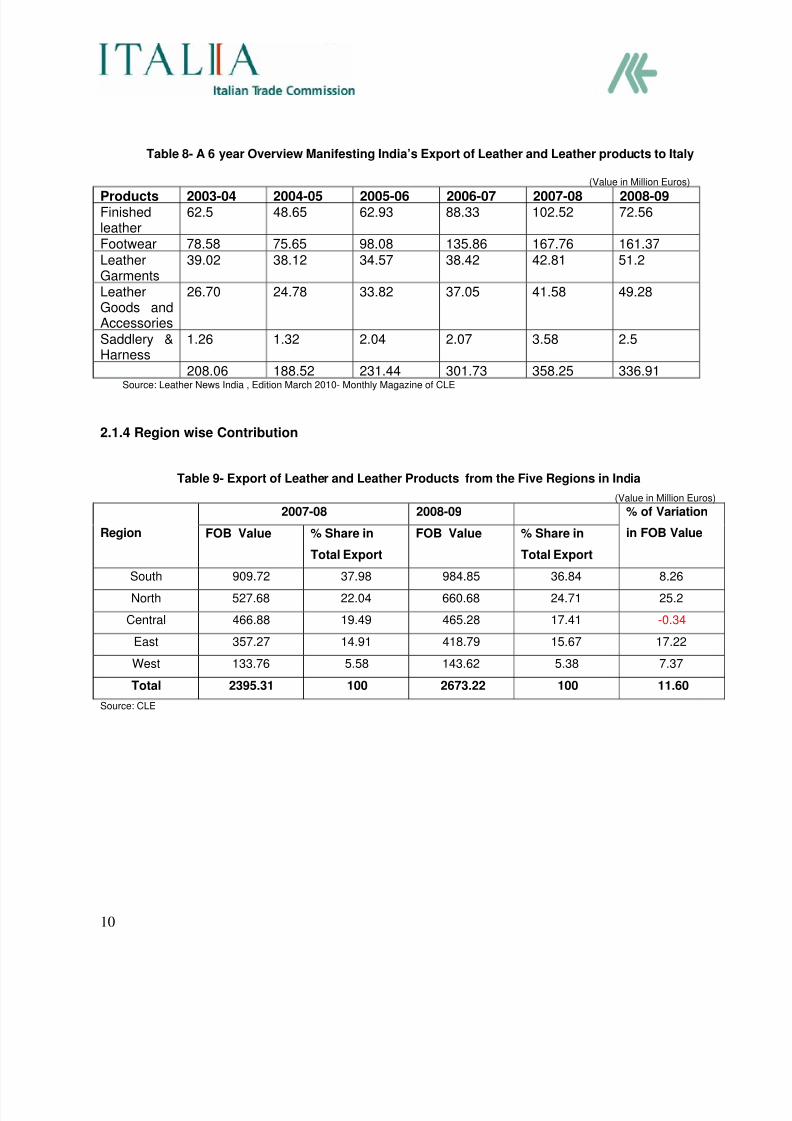
Table 8- A 6 year Overview Manifesting India’s Export of Leather and Leather products to Italy
(Value in Million Euros)
Products 2003-04 2004-05 2005-06 2006-07 2007-08 2008-09Finishedleather
62.5 48.65 62.93 88.33 102.52 72.56
Footwear 78.58 75.65 98.08 135.86 167.76 161.37LeatherGarments
39.02 38.12 34.57 38.42 42.81 51.2
LeatherGoods andAccessories
26.70 24.78 33.82 37.05 41.58 49.28
Saddlery &Harness
1.26 1.32 2.04 2.07 3.58 2.5
208.06 188.52 231.44 301.73 358.25 336.91Source: Leather News India , Edition March 2010- Monthly Magazine of CLE
2.1.4 Region wise Contribution
Table 9- Export of Leather and Leather Products from the Five Regions in India
(Value in Million Euros) 2007-08 2008-09
Region FOB Value % Share in
Total Export
FOB Value % Share in
Total Export
% of Variation
in FOB Value
South 909.72 37.98 984.85 36.84 8.26
North 527.68 22.04 660.68 24.71 25.2
Central 466.88 19.49 465.28 17.41 -0.34
East 357.27 14.91 418.79 15.67 17.22
West 133.76 5.58 143.62 5.38 7.37
Total 2395.31 100 2673.22 100 11.60
Source: CLE
8/7/2019 Indian Leather & Tanning Industry Profile 2010
http://slidepdf.com/reader/full/indian-leather-tanning-industry-profile-2010 11/43
11
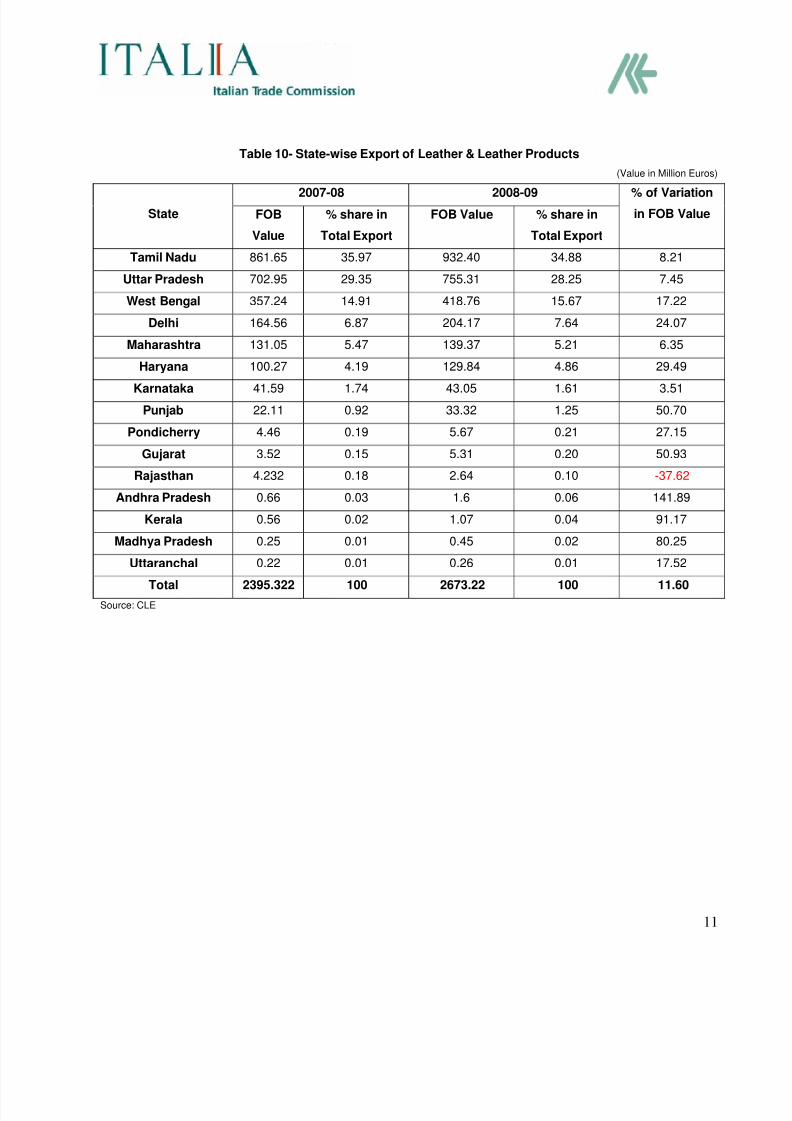
Table 10- State-wise Export of Leather & Leather Products
(Value in Million Euros)
2007-08 2008-09
State FOB
Value
% share in
Total Export
FOB Value % share in
Total Export
% of Variation
in FOB Value
Tamil Nadu 861.65 35.97 932.40 34.88 8.21
Uttar Pradesh 702.95 29.35 755.31 28.25 7.45
West Bengal 357.24 14.91 418.76 15.67 17.22
Delhi 164.56 6.87 204.17 7.64 24.07
Maharashtra 131.05 5.47 139.37 5.21 6.35
Haryana 100.27 4.19 129.84 4.86 29.49
Karnataka 41.59 1.74 43.05 1.61 3.51
Punjab 22.11 0.92 33.32 1.25 50.70
Pondicherry 4.46 0.19 5.67 0.21 27.15
Gujarat 3.52 0.15 5.31 0.20 50.93
Rajasthan 4.232 0.18 2.64 0.10 -37.62
Andhra Pradesh 0.66 0.03 1.6 0.06 141.89
Kerala 0.56 0.02 1.07 0.04 91.17
Madhya Pradesh 0.25 0.01 0.45 0.02 80.25
Uttaranchal 0.22 0.01 0.26 0.01 17.52
Total 2395.322 100 2673.22 100 11.60
Source: CLE
8/7/2019 Indian Leather & Tanning Industry Profile 2010
http://slidepdf.com/reader/full/indian-leather-tanning-industry-profile-2010 12/43
12
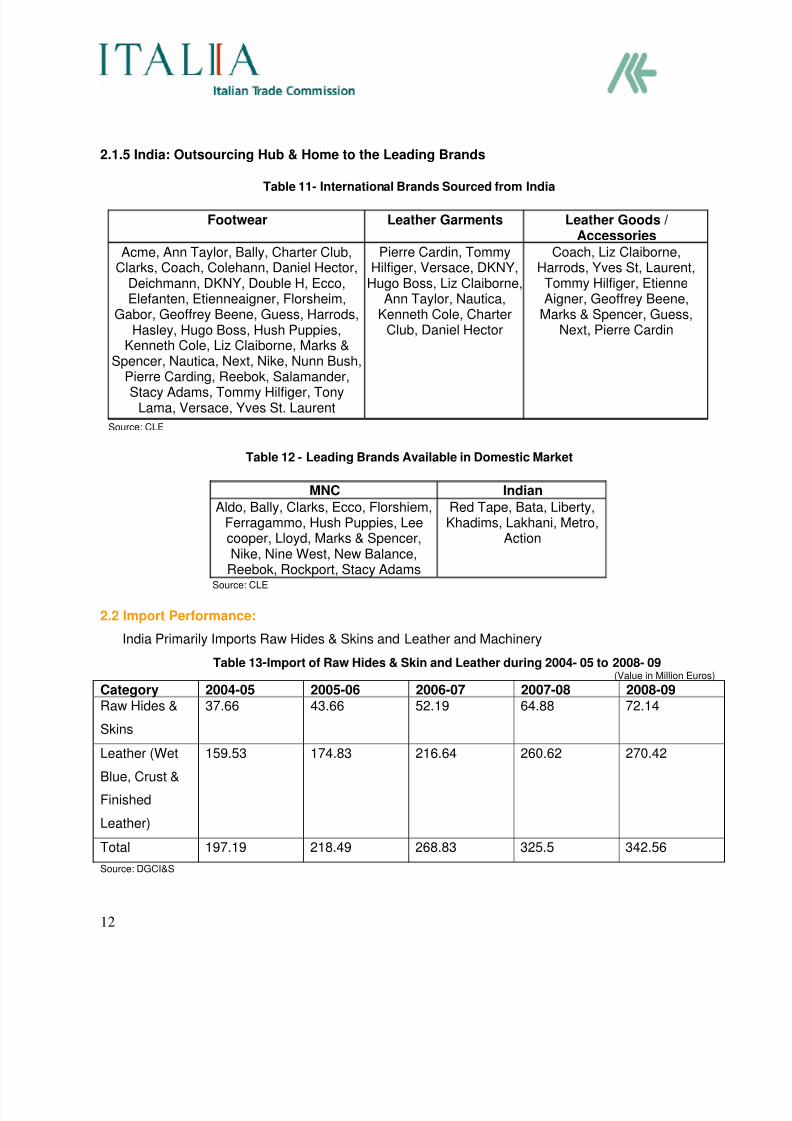
2.1.5 India: Outsourcing Hub & Home to the Leading Brands
Table 11- International Brands Sourced from India
Footwear Leather Garments Leather Goods /Accessories
Acme, Ann Taylor, Bally, Charter Club,Clarks, Coach, Colehann, Daniel Hector,
Deichmann, DKNY, Double H, Ecco,Elefanten, Etienneaigner, Florsheim,
Gabor, Geoffrey Beene, Guess, Harrods,Hasley, Hugo Boss, Hush Puppies,
Kenneth Cole, Liz Claiborne, Marks &Spencer, Nautica, Next, Nike, Nunn Bush,
Pierre Carding, Reebok, Salamander,Stacy Adams, Tommy Hilfiger, Tony
Lama, Versace, Yves St. Laurent
Pierre Cardin, TommyHilfiger, Versace, DKNY,
Hugo Boss, Liz Claiborne,Ann Taylor, Nautica,
Kenneth Cole, CharterClub, Daniel Hector
Coach, Liz Claiborne,Harrods, Yves St, Laurent,Tommy Hilfiger, EtienneAigner, Geoffrey Beene,
Marks & Spencer, Guess,Next, Pierre Cardin
Source: CLE
Table 12 - Leading Brands Available in Domestic Market
MNC Indian
Aldo, Bally, Clarks, Ecco, Florshiem,Ferragammo, Hush Puppies, Leecooper, Lloyd, Marks & Spencer,Nike, Nine West, New Balance,Reebok, Rockport, Stacy Adams
Red Tape, Bata, Liberty,Khadims, Lakhani, Metro,
Action
Source: CLE
2.2 Import Performance:
India Primarily Imports Raw Hides & Skins and Leather and Machinery
Table 13-Import of Raw Hides & Skin and Leather during 2004- 05 to 2008- 09(Value in Million Euros)
Category 2004-05 2005-06 2006-07 2007-08 2008-09Raw Hides &
Skins
37.66 43.66 52.19 64.88 72.14
Leather (Wet
Blue, Crust &
Finished
Leather)
159.53 174.83 216.64 260.62 270.42
Total 197.19 218.49 268.83 325.5 342.56
Source: DGCI&S
8/7/2019 Indian Leather & Tanning Industry Profile 2010
http://slidepdf.com/reader/full/indian-leather-tanning-industry-profile-2010 13/43
13
3. Horizontal Spread of the Industry
Leather industry can be broadly divided into Leather Processing and Leather Product Industry .The
flow chart elucidates the structure :
Leather Industry
Leather Processing Leather Product
Tanning & Finishing
Footwear & Footwear Components
Leather Garments
Leather Goods
Table 14 - Share of Different Sectors in the Leather Production in India
Sector/Product Household Sector Small Scale Sector Medium & Large
Sector
Tanneries 10% 35% 55%
Footwear – Leather 60% 25% 15%Footwear- Non
Leather
15% 70% 15%
Garments &
Outerwear
Nil 95% 5%
Assorted Leather
Goods
10% 85% 5%
Saddlery &
Harness
40% 60% Nil
3.1 The Leather Processing Industry:
3.1.1 The Leather Processing involves two stages, viz:
i) Processing of raw hides/skins into semi-finished leather – Tanning and (ii) Processing of
semi- finished leather to finished leather – Finishing
8/7/2019 Indian Leather & Tanning Industry Profile 2010
http://slidepdf.com/reader/full/indian-leather-tanning-industry-profile-2010 14/43
14
3.1.1.1 Tanning Industry in India:
There has been a major change in the complexion of tanning industry during the last few decades. The
organized tanning sector has gained significance in the industrial process and grown in Tamil Nadu,
West Bengal and Uttar Pradesh. With the power of technology and resources, the organized sector is
able to mobilize the raw hides from the entire country. However the industry is established in a few
pockets in the states of Tamil Nadu, West Bengal due to the presence of tanning operations from the
British period and proximity to the port. The process of transformation has been faster since 1973 and
tanning industry has grown in clusters of Tamil Nadu, West Bengal, Uttar Pradesh and Punjab.
Table 15- State-wise Distribution of Tanneries in the Country:
State No. of Tanneries Percentage
Tamil Nadu 934 44.60
West Bengal 538 25.70
Punjab 79 3.80
Uttar Pradesh 378 18.00
Andhra Pradesh 24 1.15
Maharashtra 33 1.60Karnataka 16 0.80
Bihar 17 0.80
Haryana 18 0.80
Other States 54 2.75
Total 2091 100.00
Source: Central Pollution Control Board (CPCB)
Out of the total number of tanneries in India, about 45% are in Tamil Nadu alone. Tamil Nadu, West
Bengal and Uttar Pradesh account for 88.50% of the total tanneries in the country. The states of
Tamil Nadu, Uttar Pradesh and Maharashtra contribute to 85% of the total production each with a
share of 37.44% , 21.74% and 14.96% respectively.
3.1.1.1.1 Tanning & Finishing Process :
8/7/2019 Indian Leather & Tanning Industry Profile 2010
http://slidepdf.com/reader/full/indian-leather-tanning-industry-profile-2010 15/43
15
Tanning is the process by which raw animal hides are converted into leather. During this process, the
leather is made resistant to biological decay by stabilizing the collagen structure of the hide, using
natural or synthetic chemicals (UNEP 1991). The English word for tanning is from medieval Latin
tannāre, deriv. of tannum (oak bark), related to Old German- tanna meaning oak.This refers to the use
of the bark of oaks (the original source of tannin- an acidic chemical compound) in some kinds of hide
preservation.
The process involves several stages, viz: The first stage is the preparation for tanning. The second
stage is the actual tanning and other chemical treatment. The third stage, known as retanning, applies
retanning agents and dyes to the material to provide the physical strength and properties desired
depending on the end product. The fourth and final stage, known as finishing, is used to apply finishing
material to the surface or finish the surface without the application of any chemicals if so desired.
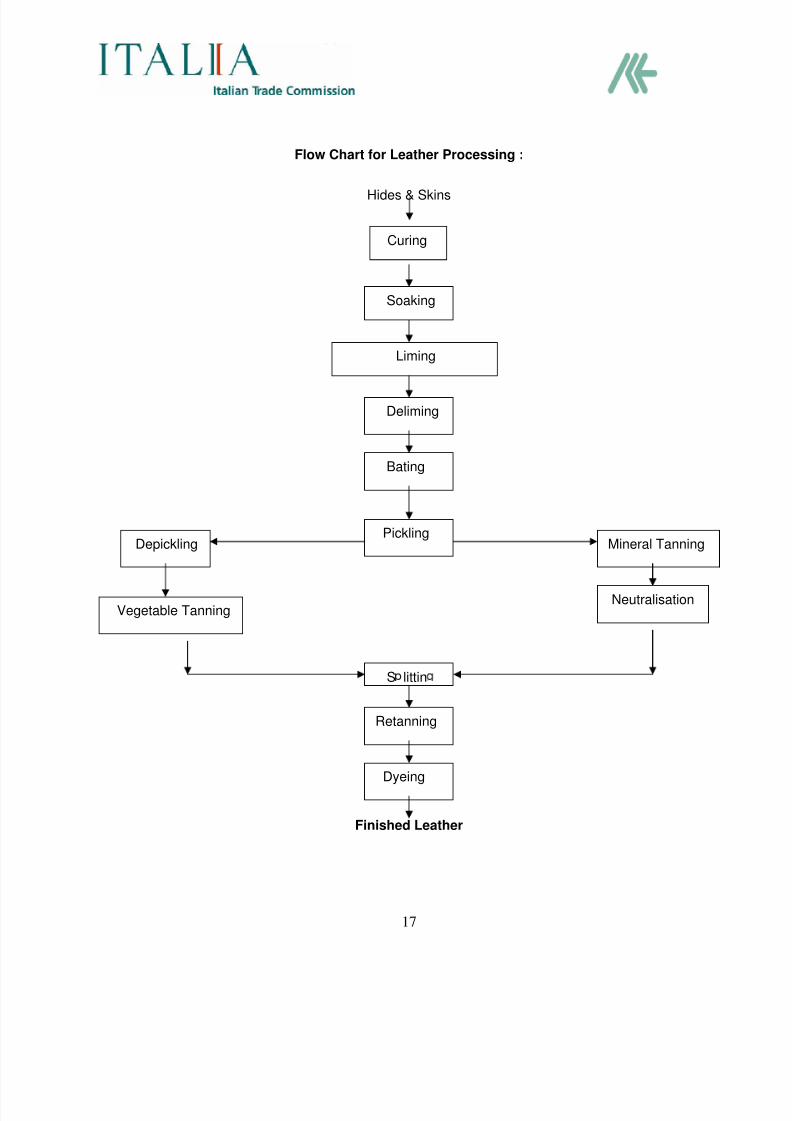
1st stage- Preparing hides begins by ‘curing’ them with salt. Curing is employed to prevent putrefaction
of the protein substance (collagen) from bacterial infection during the time lag that might occur from
procuring the hide to when it is processed. Curing removes excess water from the hides and skins
using a difference in osmotic pressure. Then the hides are ‘soaked’ in clean water to remove the salt
and increase the moisture so that the hide or skin can be further treated. After soaking, the hides and
skins are taken for ’liming’. Liming is done primarily to -Remove the hairs, nails and other keratinous
matters. After liming, the pH (acidity) of the collagen is brought down to a lower level so that enzymes
may act on it. This process is known as ‘deliming.’ Depending on the end use of the leather, hides may
be treated with enzymes to soften them in a process called ‘bating ‘.Once bating is complete, the hides
and skins are treated with a mixture of common (table) salt and sulphuric acid, in case a mineral
tanning is to be done. This is done to bring down the pH of collagen to a very low level so as to
facilitate the penetration of mineral tanning agent into the substance. This process is known as
‘pickling’ .
2nd Stage- Tanning can be performed with either vegetable or mineral methods.
Vegetable tanning uses tannin (a class of polyphenol astringent chemical) which are present
naturally in the bark and leaves of many plants. Tannins bind to the collagen proteins in the
hide and coat them causing them to become less water-soluble, and more resistant to bacterial
8/7/2019 Indian Leather & Tanning Industry Profile 2010
http://slidepdf.com/reader/full/indian-leather-tanning-industry-profile-2010 16/43
16
attack. The process also causes the hide to become more flexible. The primary barks used in
modern times are chestnut, oak, tanoak, hemlock, quebracho, mangrove, wattle (acacia; see
catechu), and myrobalan. Hides are stretched on frames and immersed for several weeks in
vats of increasing concentrations of tannin. Vegetable tanned hide is flexible and is used for
luggage and furniture.
Mineral tanning usually uses chromium in the form of basic chromium sulfate. It is employed
after pickling. Once the desired level of penetration of chrome into the substance is achieved,
the pH of the material is raised again to facilitate the process. This is known as "basification". In
the raw state chrome tanned skins are blue and therefore referred to as "wet blue." Chrome
tanning is faster than vegetable tanning (less than a day for this part of the process) and
produces a stretchable leather which is excellent for use in handbags and garments.
3rd Stage- After tanning, the hides are split horizontally into an upper layer called the grain, and a layer
from the flesh side called the split . These layers are separately processed further, sometimes retanned
and then pressed for water, stretched and dried.
4th and Final Stage- Depending on the finishing desired, the hide may be waxed, rolled, lubricated,
injected with oil, split, shaved and, of course, dyed and given surface treatment to give texture, look
and shape to the finished leather.
The process is depicted in the flow chart below:
8/7/2019 Indian Leather & Tanning Industry Profile 2010
http://slidepdf.com/reader/full/indian-leather-tanning-industry-profile-2010 17/43
17
Flow Chart for Leather Processing :
Hides & Skins
Curing
Soaking
Liming
Deliming
Bating
PicklingDepickling
S littin
Vegetable Tanning
Mineral Tanning
Neutralisation
Retanning
Finished Leather
Dyeing
8/7/2019 Indian Leather & Tanning Industry Profile 2010
http://slidepdf.com/reader/full/indian-leather-tanning-industry-profile-2010 18/43
18
3.1.1.1.1.1 Effect on Environment:
The pollution load from the tanning activity has been estimated to be 50% more in weight than the
weight of the hides processed. Pollution comes from several of the sub-processes due to the usage of
175 different chemicals, and is both organic and chemical. Wastes and chemicals released to water
system are the main pollution concerns for the leather industry. They are produced during washing,
dehairing and tanning of the leather. The water discharge from turnover is called ‘Raw Effluent’.
More than 95% of the Indian tanneries have pollution control devices.Central Pollution Control Board
has constituted a Special Task force to identify the waste minimization techniques and control pollution
3.1.1.1.1.1.1 Action Plan:
Chrome Recovery: Chrome is entirely extracted from the Chrome Liquor produced during
chroming process and the resident water is used for other purposes apart from drinking. 20% of
the extracted chrome is also reused for chroming.
The Common Effluent Treatment Plants (CETPs) - have been established in all the tannery
clusters. The TDS (Total Dissolved Solids) in Tannery effluent is high because common salt is
widely used for preserving raw hides and skins. There are 19 ‘CETPs’ operational in India and
out of which 14 are operational in Tamil Nadu. More than 150 individual Effluent Treatment
Plants (ETPs) are operational in isolated tanneries and locations where the common facilities
are not possible.
Zero Liquid Discharge Technology - by implementing the reverse osmosis (RO) system for
recovery of water from tannery effluent is being implemented in the South Indian tanneries ( i.e.
120 individual units and 14 effluent treatment plants). Establishment of decentralized secure
landfill system linked with CETPs has been implemented in many tannery clusters (First of its
kind in the World). This process facilitates in the recovery of water, apart from meeting the
TDS norms.
Bio Processing - R&D activities are under progress for this method of effluent treatment.
8/7/2019 Indian Leather & Tanning Industry Profile 2010
http://slidepdf.com/reader/full/indian-leather-tanning-industry-profile-2010 19/43
19
Water Conservation & Other Pollution Control Methods
o All the tanneries have installed water meters and flow meters to measure actual
consumption and waste water discharge.
o Consumption of water reduced to 22 m3/tonne of hides/skins.
o Ground water quality being monitored to strengthen wherever the treated effluents are
applied on land for irrigation.
o Deployment of qualified and well-trained staff for Observation and Monitoring of the
ETPs (Effluent Treatment Plants) / CETPs.
o Separate energy meter for ETPs / CETPs.
o Replacement of open anaerobic lagoons with cleaner technology options.
o All the large tannery units (Processing more than 5 tonnes per day of hides / skins) have
undertaken Environmental Auditing on annual basis.
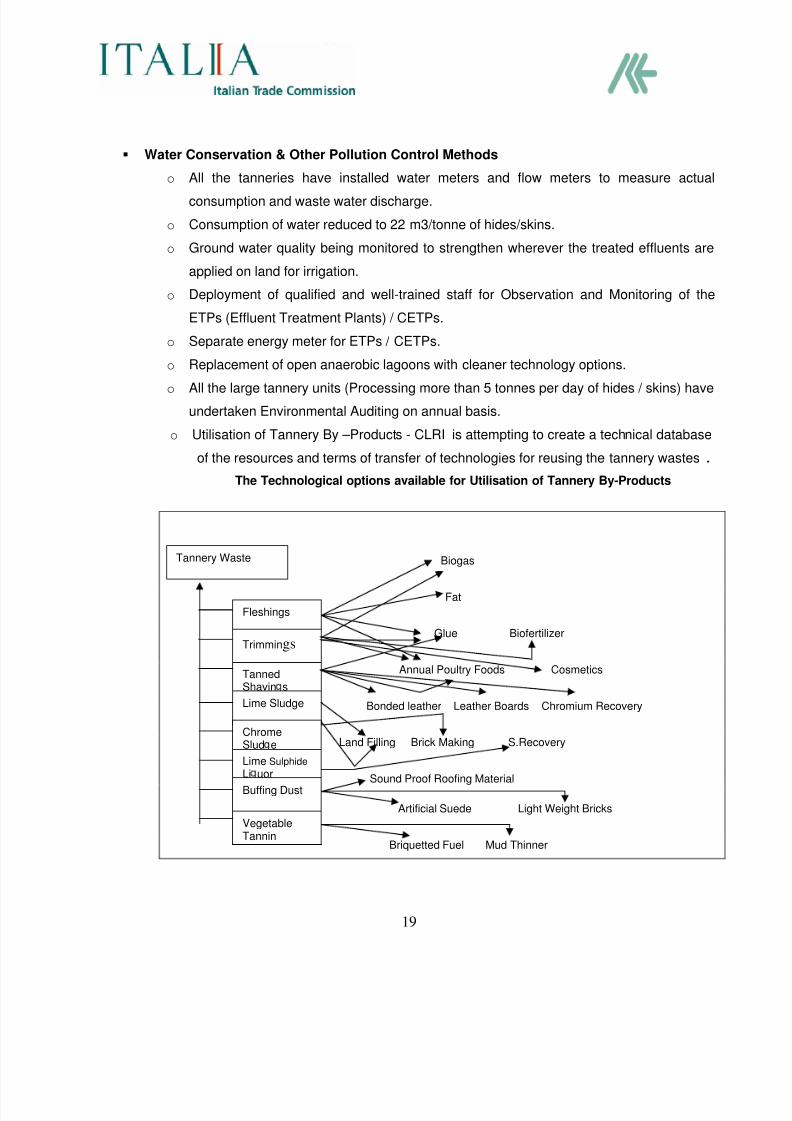
o Utilisation of Tannery By –Products - CLRI is attempting to create a technical database
of the resources and terms of transfer of technologies for reusing the tannery wastes .
The Technological options available for Utilisation of Tannery By-Products
Biogas
Fat
Glue Biofertilizer
Annual Poultry Foods Cosmetics
Bonded leather Leather Boards Chromium Recovery
Land Filling Brick Making S.Recovery
Sound Proof Roofing Material
Artificial Suede Light Weight Bricks
Briquetted Fuel Mud Thinner
Tannery Waste
Fleshings
Trimmings
TannedShavin s
Lime Sludge
ChromeSlud e
Lime Sulphide Li uor
Buffing Dust
VegetableTannin
8/7/2019 Indian Leather & Tanning Industry Profile 2010
http://slidepdf.com/reader/full/indian-leather-tanning-industry-profile-2010 20/43
20
3.1.1.1.2 Challenges faced by the Indian Tanneries:
Increased cost of production per unit area of finished leather due to stringent environmental
norms
Expansion of production capacities – issue in Tamil Nadu due to local laws, despite
compliance
Increasing demand of raw material – raw hides, skins and semi finished leathers
Low level of technology in small tanneries
No specific dedicated industrial areas for leather sector in few States
Poor capacity utilization in most tanneries leading to higher financial cost and overheads
3.1.1.1.3 Areas where Foreign Collaboration is sought
• Water use minimization, recycle and reuse
• Solid Waste/Sludges Management
• Energy savings by best management practices
• By product management, recycle and reuse
• Optimal usage of chemicals and preservatives
• The ways to run state of art machinery and employ advanced technology which will
produce skilled personnel in the tanning units which will bolster productivity, reduce
costs, improve production quality.
• Technique to make tanning industry more eco compatible
• Precise knowledge of occupational safety, test standards
• Best tanning and management methods
8/7/2019 Indian Leather & Tanning Industry Profile 2010
http://slidepdf.com/reader/full/indian-leather-tanning-industry-profile-2010 21/43
21
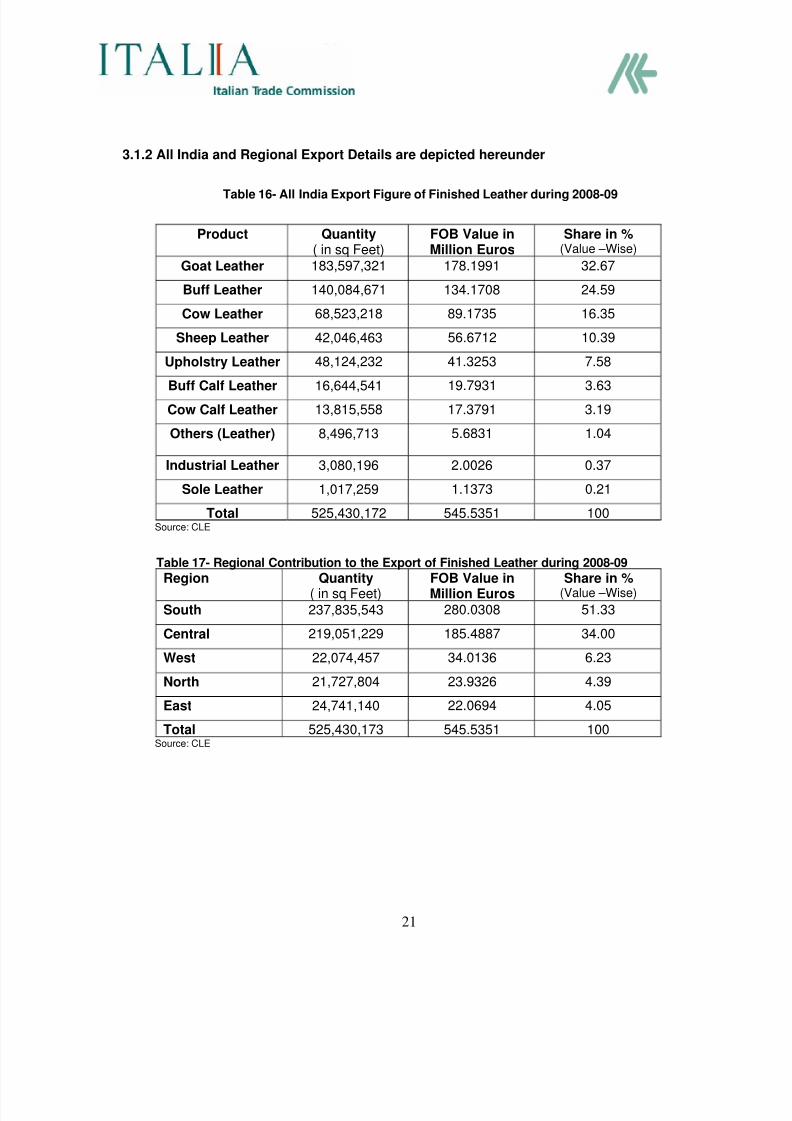
3.1.2 All India and Regional Export Details are depicted hereunder
Table 16- All India Export Figure of Finished Leather during 2008-09
Product Quantity( in sq Feet)
FOB Value inMillion Euros
Share in %(Value –Wise)
Goat Leather 183,597,321 178.1991 32.67
Buff Leather 140,084,671 134.1708 24.59
Cow Leather 68,523,218 89.1735 16.35
Sheep Leather 42,046,463 56.6712 10.39
Upholstry Leather 48,124,232 41.3253 7.58
Buff Calf Leather 16,644,541 19.7931 3.63
Cow Calf Leather 13,815,558 17.3791 3.19
Others (Leather) 8,496,713 5.6831 1.04
Industrial Leather 3,080,196 2.0026 0.37
Sole Leather 1,017,259 1.1373 0.21
Total 525,430,172 545.5351 100Source: CLE
Table 17- Regional Contribution to the Export of Finished Leather during 2008-09Region Quantity
( in sq Feet)FOB Value inMillion Euros
Share in %(Value –Wise)
South 237,835,543 280.0308 51.33
Central 219,051,229 185.4887 34.00
West 22,074,457 34.0136 6.23
North 21,727,804 23.9326 4.39
East 24,741,140 22.0694 4.05
Total 525,430,173 545.5351 100Source: CLE
8/7/2019 Indian Leather & Tanning Industry Profile 2010
http://slidepdf.com/reader/full/indian-leather-tanning-industry-profile-2010 22/43
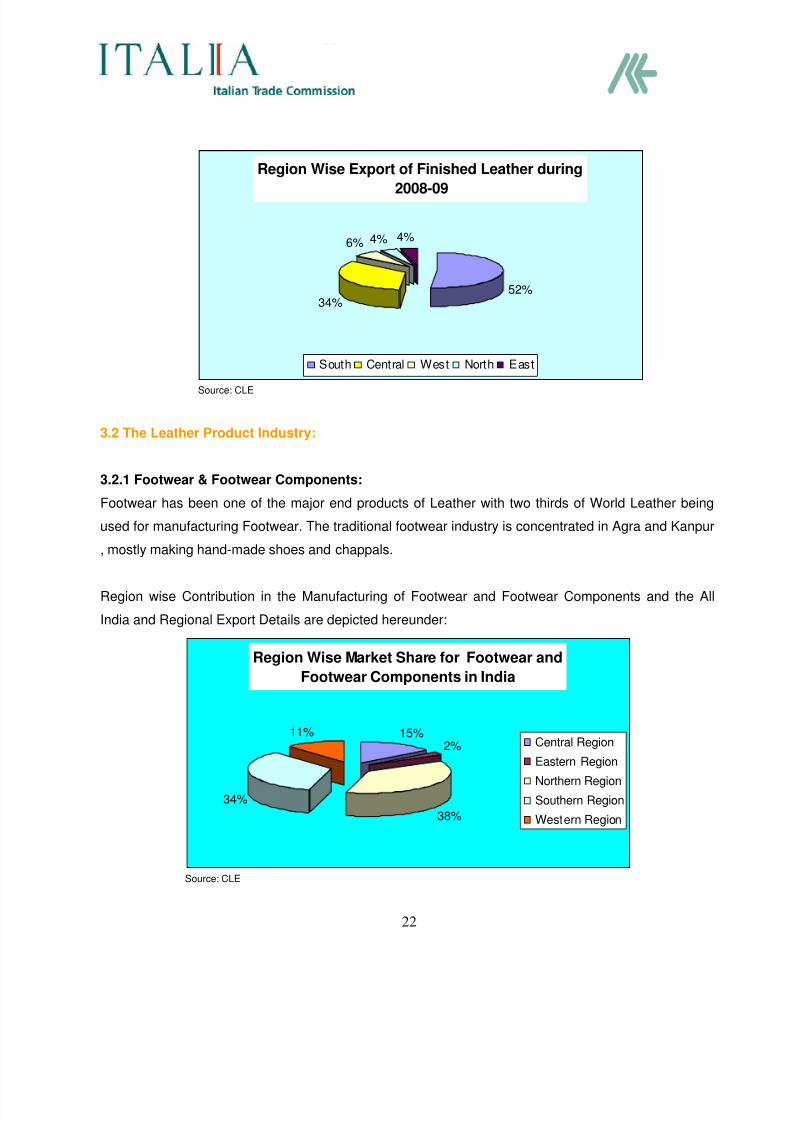
22
Region Wise Export of Finished Leather during
2008-09
52%34%
6% 4% 4%
South Central West North East
Source: CLE
3.2 The Leather Product Industry:
3.2.1 Footwear & Footwear Components:
Footwear has been one of the major end products of Leather with two thirds of World Leather being
used for manufacturing Footwear. The traditional footwear industry is concentrated in Agra and Kanpur
, mostly making hand-made shoes and chappals.
Region wise Contribution in the Manufacturing of Footwear and Footwear Components and the All
India and Regional Export Details are depicted hereunder:
Region Wise Market Share for Footwear and
Footwear Components in India
15%
2%
38%
34%
11%Central Region
Eastern Region
Northern Region
Southern Region
Western Region
Source: CLE
8/7/2019 Indian Leather & Tanning Industry Profile 2010
http://slidepdf.com/reader/full/indian-leather-tanning-industry-profile-2010 23/43
23
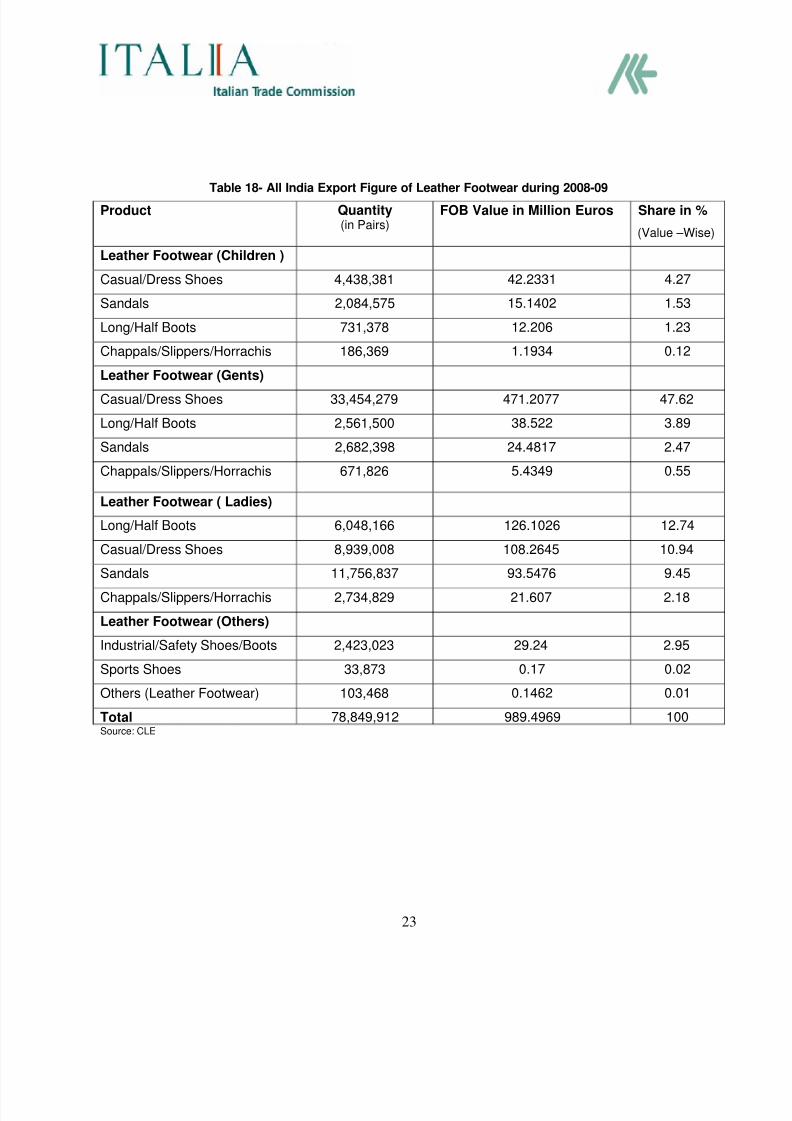
Table 18- All India Export Figure of Leather Footwear during 2008-09
Product Quantity(in Pairs)
FOB Value in Million Euros Share in %
(Value –Wise)
Leather Footwear (Children )
Casual/Dress Shoes 4,438,381 42.2331 4.27
Sandals 2,084,575 15.1402 1.53
Long/Half Boots 731,378 12.206 1.23
Chappals/Slippers/Horrachis 186,369 1.1934 0.12
Leather Footwear (Gents)
Casual/Dress Shoes 33,454,279 471.2077 47.62
Long/Half Boots 2,561,500 38.522 3.89
Sandals 2,682,398 24.4817 2.47
Chappals/Slippers/Horrachis 671,826 5.4349 0.55
Leather Footwear ( Ladies)
Long/Half Boots 6,048,166 126.1026 12.74
Casual/Dress Shoes 8,939,008 108.2645 10.94
Sandals 11,756,837 93.5476 9.45
Chappals/Slippers/Horrachis 2,734,829 21.607 2.18
Leather Footwear (Others)
Industrial/Safety Shoes/Boots 2,423,023 29.24 2.95
Sports Shoes 33,873 0.17 0.02
Others (Leather Footwear) 103,468 0.1462 0.01
Total 78,849,912 989.4969 100Source: CLE
8/7/2019 Indian Leather & Tanning Industry Profile 2010
http://slidepdf.com/reader/full/indian-leather-tanning-industry-profile-2010 24/43
24
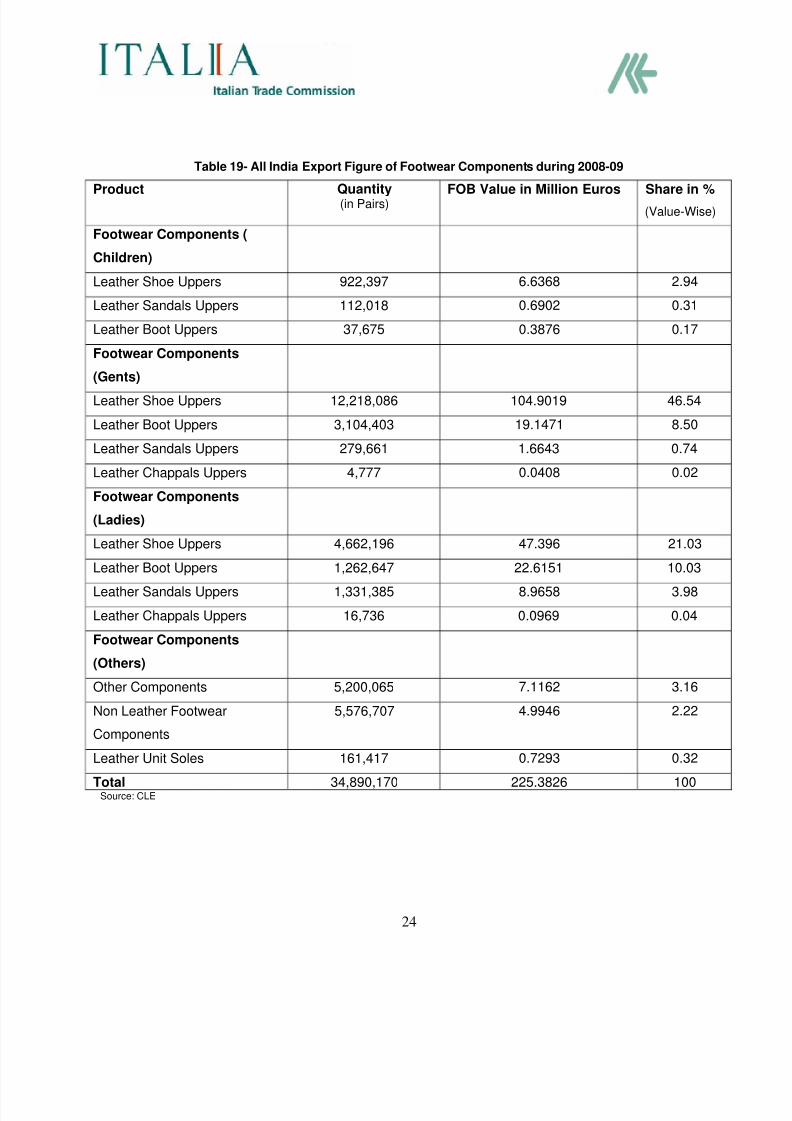
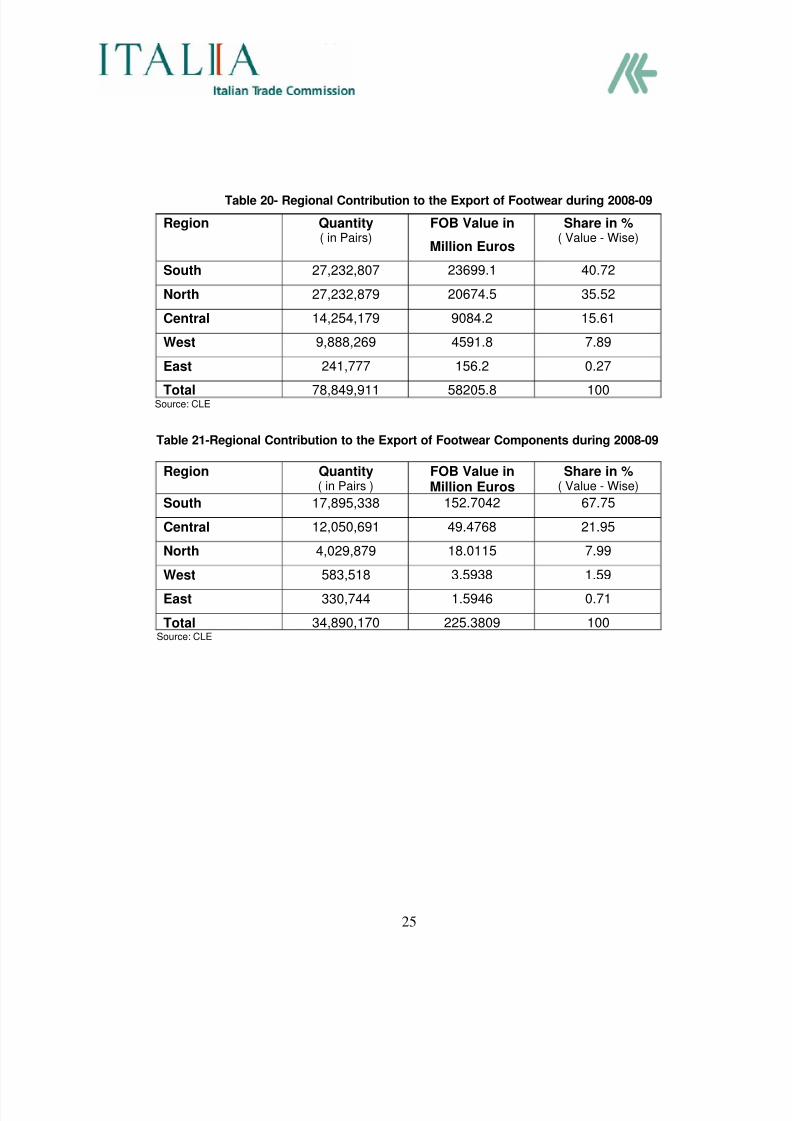
Table 19- All India Export Figure of Footwear Components during 2008-09
Product Quantity(in Pairs)
FOB Value in Million Euros Share in %
(Value-Wise)
Footwear Components (
Children)
Leather Shoe Uppers 922,397 6.6368 2.94
Leather Sandals Uppers 112,018 0.6902 0.31
Leather Boot Uppers 37,675 0.3876 0.17
Footwear Components
(Gents)
Leather Shoe Uppers 12,218,086 104.9019 46.54
Leather Boot Uppers 3,104,403 19.1471 8.50
Leather Sandals Uppers 279,661 1.6643 0.74
Leather Chappals Uppers 4,777 0.0408 0.02
Footwear Components
(Ladies)
Leather Shoe Uppers 4,662,196 47.396 21.03
Leather Boot Uppers 1,262,647 22.6151 10.03
Leather Sandals Uppers 1,331,385 8.9658 3.98
Leather Chappals Uppers 16,736 0.0969 0.04
Footwear Components
(Others)
Other Components 5,200,065 7.1162 3.16
Non Leather Footwear
Components
5,576,707 4.9946 2.22
Leather Unit Soles 161,417 0.7293 0.32
Total 34,890,170 225.3826 100Source: CLE
8/7/2019 Indian Leather & Tanning Industry Profile 2010
http://slidepdf.com/reader/full/indian-leather-tanning-industry-profile-2010 25/43
8/7/2019 Indian Leather & Tanning Industry Profile 2010
http://slidepdf.com/reader/full/indian-leather-tanning-industry-profile-2010 26/43
26
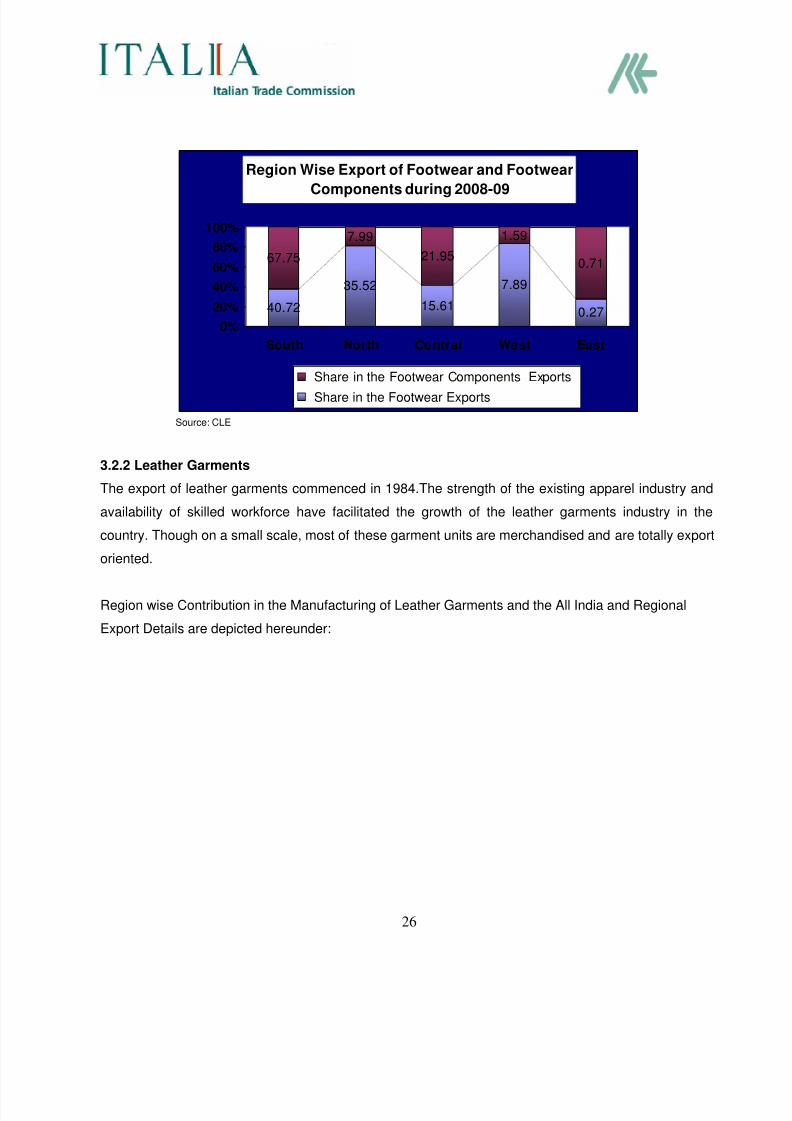
Region Wise Export of Footwear and Footwear
Components during 2008-09
40.72
35.52
15.61
7.89
0.27
67.75
7.99
21.95
1.59
0.71
0%
20%
40%
60%
80%
100%
South North Central West East
Share in the Footwear Components Exports
Share in the Footwear Exports
Source: CLE
3.2.2 Leather Garments
The export of leather garments commenced in 1984.The strength of the existing apparel industry and
availability of skilled workforce have facilitated the growth of the leather garments industry in the
country. Though on a small scale, most of these garment units are merchandised and are totally export
oriented.
Region wise Contribution in the Manufacturing of Leather Garments and the All India and Regional
Export Details are depicted hereunder:
8/7/2019 Indian Leather & Tanning Industry Profile 2010
http://slidepdf.com/reader/full/indian-leather-tanning-industry-profile-2010 27/43
27
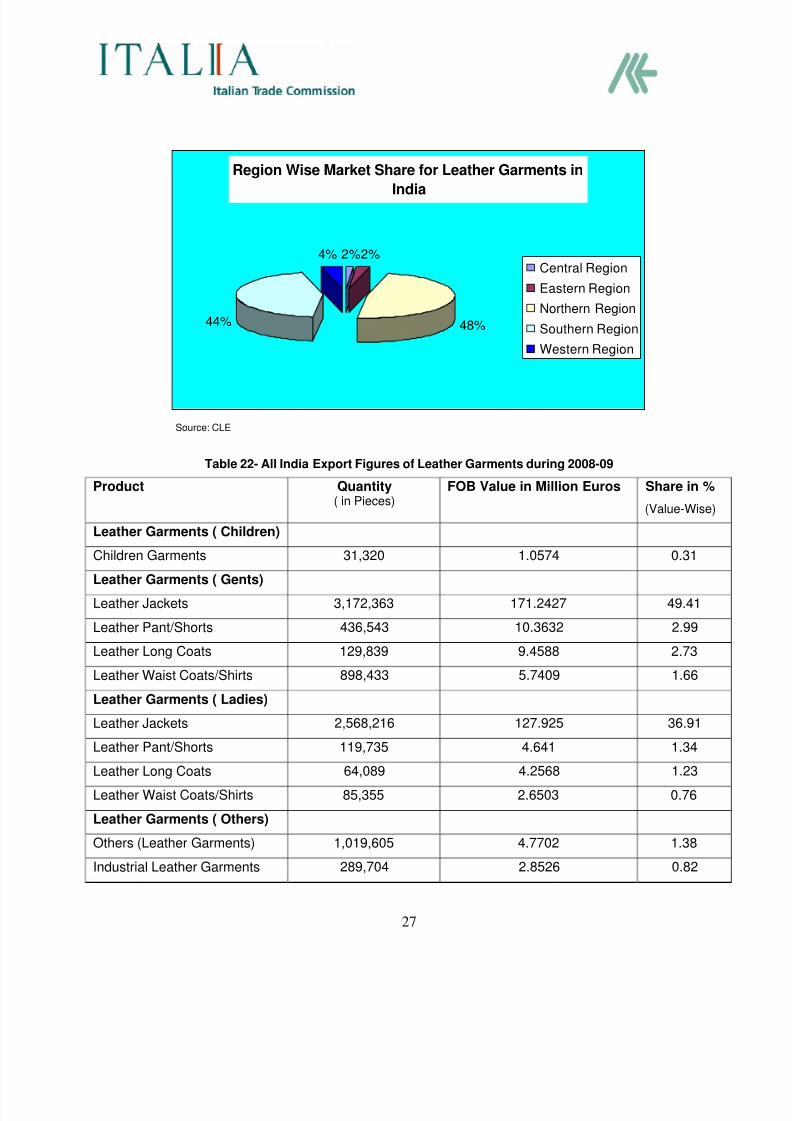
Region Wise Market Share for Leather Garments in
India
2%2%
48%44%
4%Central Region
Eastern Region
Northern Region
Southern Region
Western Region
Source: CLE
Table 22- All India Export Figures of Leather Garments during 2008-09
Product Quantity( in Pieces)
FOB Value in Million Euros Share in %
(Value-Wise)
Leather Garments ( Children)
Children Garments 31,320 1.0574 0.31
Leather Garments ( Gents)
Leather Jackets 3,172,363 171.2427 49.41
Leather Pant/Shorts 436,543 10.3632 2.99
Leather Long Coats 129,839 9.4588 2.73
Leather Waist Coats/Shirts 898,433 5.7409 1.66
Leather Garments ( Ladies)
Leather Jackets 2,568,216 127.925 36.91
Leather Pant/Shorts 119,735 4.641 1.34Leather Long Coats 64,089 4.2568 1.23
Leather Waist Coats/Shirts 85,355 2.6503 0.76
Leather Garments ( Others)
Others (Leather Garments) 1,019,605 4.7702 1.38
Industrial Leather Garments 289,704 2.8526 0.82
8/7/2019 Indian Leather & Tanning Industry Profile 2010
http://slidepdf.com/reader/full/indian-leather-tanning-industry-profile-2010 28/43
28
Product Quantity( in Pieces)
FOB Value in Million Euros Share in %
(Value-Wise)
Leather Aprons 470,758 1.5657 0.45
Motorbike Jackets 353 0.0187 0.01
Total 9,286,313 346.5433 100
Source: CLE
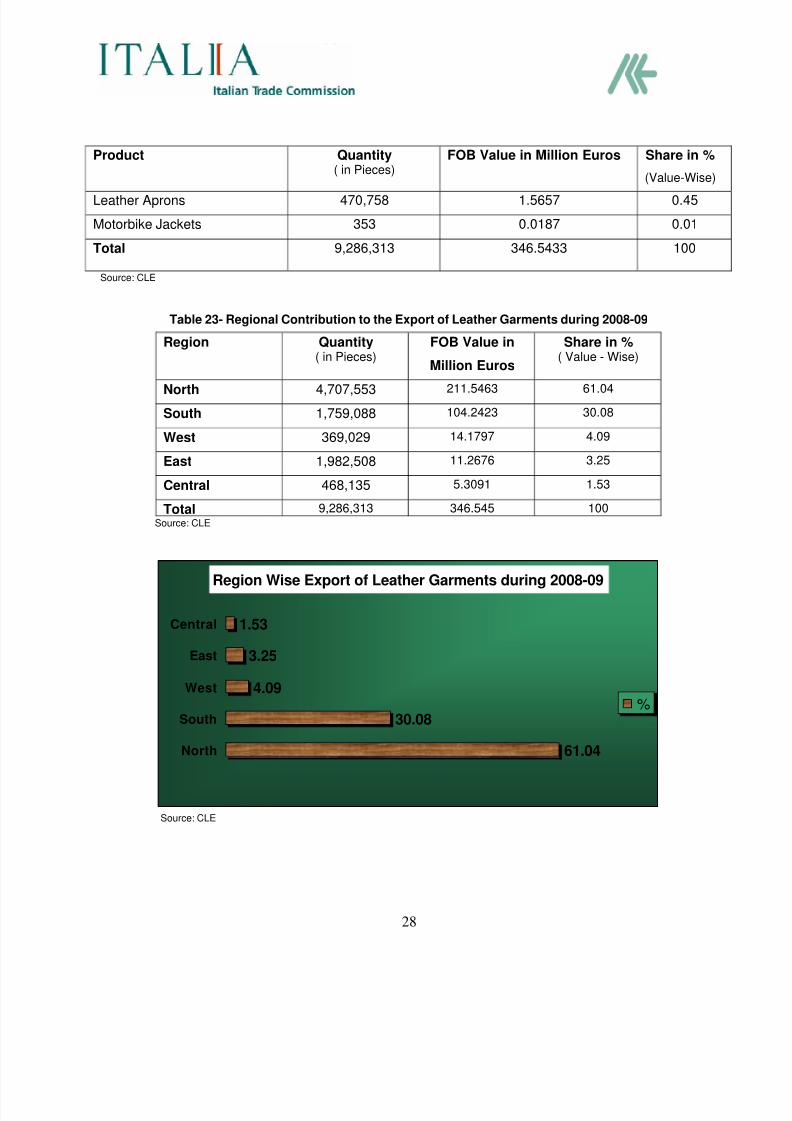
Table 23- Regional Contribution to the Export of Leather Garments during 2008-09
Region Quantity( in Pieces)
FOB Value in
Million Euros
Share in %( Value - Wise)
North 4,707,553 211.5463 61.04
South 1,759,088 104.2423 30.08
West 369,029 14.1797 4.09
East 1,982,508 11.2676 3.25
Central 468,135 5.3091 1.53
Total 9,286,313 346.545 100Source: CLE
Region Wise Export of Leather Garments during 2008-09
61.04
30.08
4.09
3.25
1.53
North
South
West
East
Central
%
Source: CLE
8/7/2019 Indian Leather & Tanning Industry Profile 2010
http://slidepdf.com/reader/full/indian-leather-tanning-industry-profile-2010 29/43
29
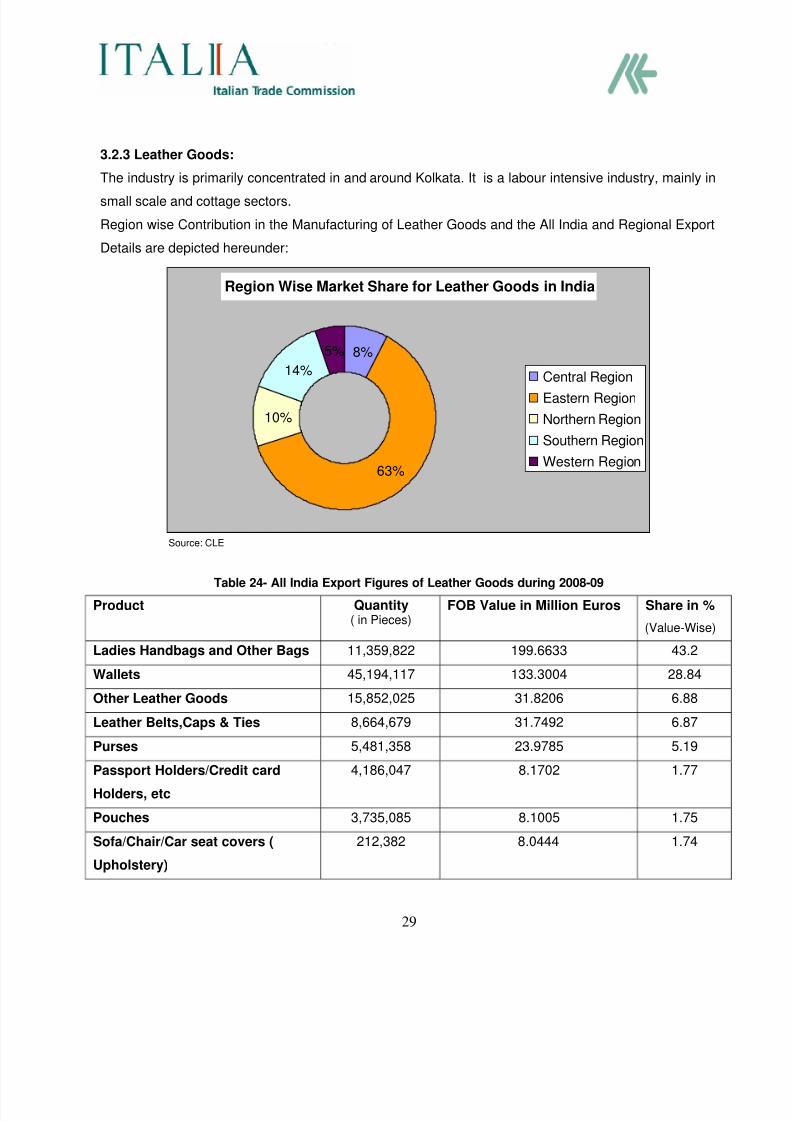
3.2.3 Leather Goods:
The industry is primarily concentrated in and around Kolkata. It is a labour intensive industry, mainly in
small scale and cottage sectors.
Region wise Contribution in the Manufacturing of Leather Goods and the All India and Regional Export
Details are depicted hereunder:
Region Wise Market Share for Leather Goods in India
8%
63%
10%
14%
5%
Central Region
Eastern Region
Northern Region
Southern Region
Western Region
Source: CLE
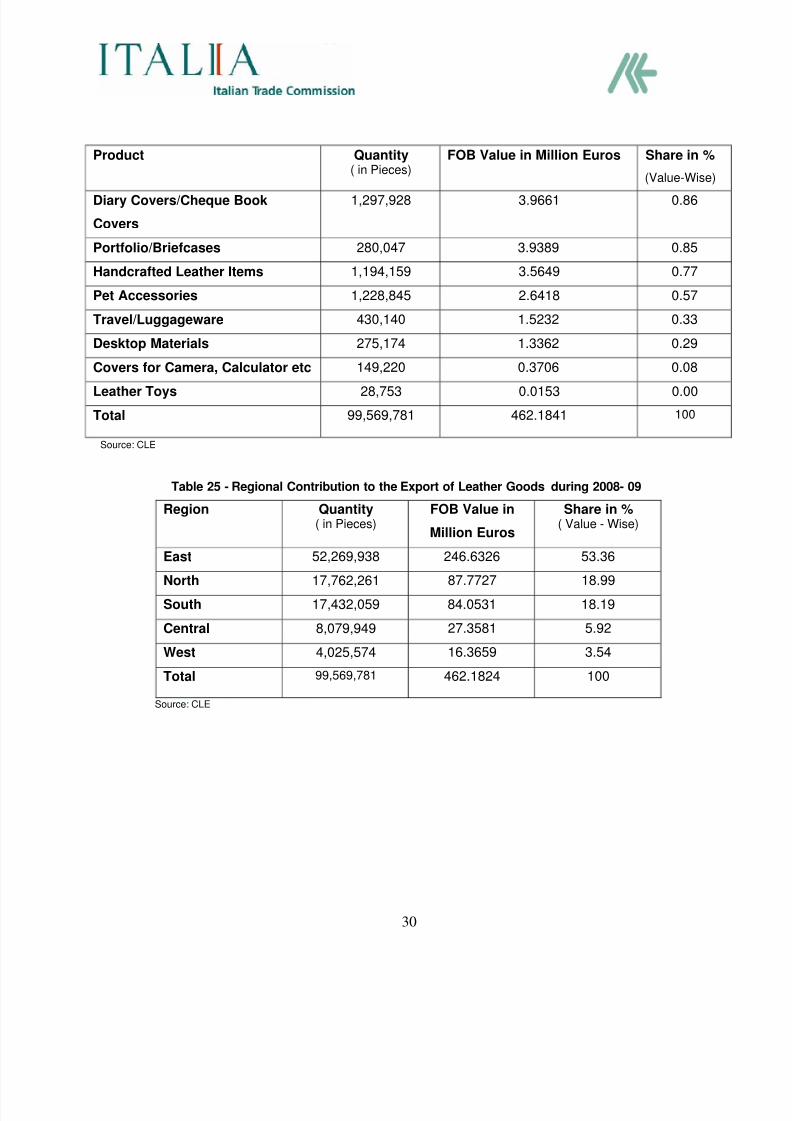
Table 24- All India Export Figures of Leather Goods during 2008-09
Product Quantity( in Pieces)
FOB Value in Million Euros Share in %
(Value-Wise)
Ladies Handbags and Other Bags 11,359,822 199.6633 43.2
Wallets 45,194,117 133.3004 28.84
Other Leather Goods 15,852,025 31.8206 6.88
Leather Belts,Caps & Ties 8,664,679 31.7492 6.87
Purses 5,481,358 23.9785 5.19Passport Holders/Credit card
Holders, etc
4,186,047 8.1702 1.77
Pouches 3,735,085 8.1005 1.75
Sofa/Chair/Car seat covers (
Upholstery)
212,382 8.0444 1.74
8/7/2019 Indian Leather & Tanning Industry Profile 2010
http://slidepdf.com/reader/full/indian-leather-tanning-industry-profile-2010 30/43
30
Product Quantity( in Pieces)
FOB Value in Million Euros Share in %
(Value-Wise)
Diary Covers/Cheque Book
Covers
1,297,928 3.9661 0.86
Portfolio/Briefcases 280,047 3.9389 0.85
Handcrafted Leather Items 1,194,159 3.5649 0.77
Pet Accessories 1,228,845 2.6418 0.57
Travel/Luggageware 430,140 1.5232 0.33
Desktop Materials 275,174 1.3362 0.29
Covers for Camera, Calculator etc 149,220 0.3706 0.08
Leather Toys 28,753 0.0153 0.00
Total 99,569,781 462.1841 100
Source: CLE
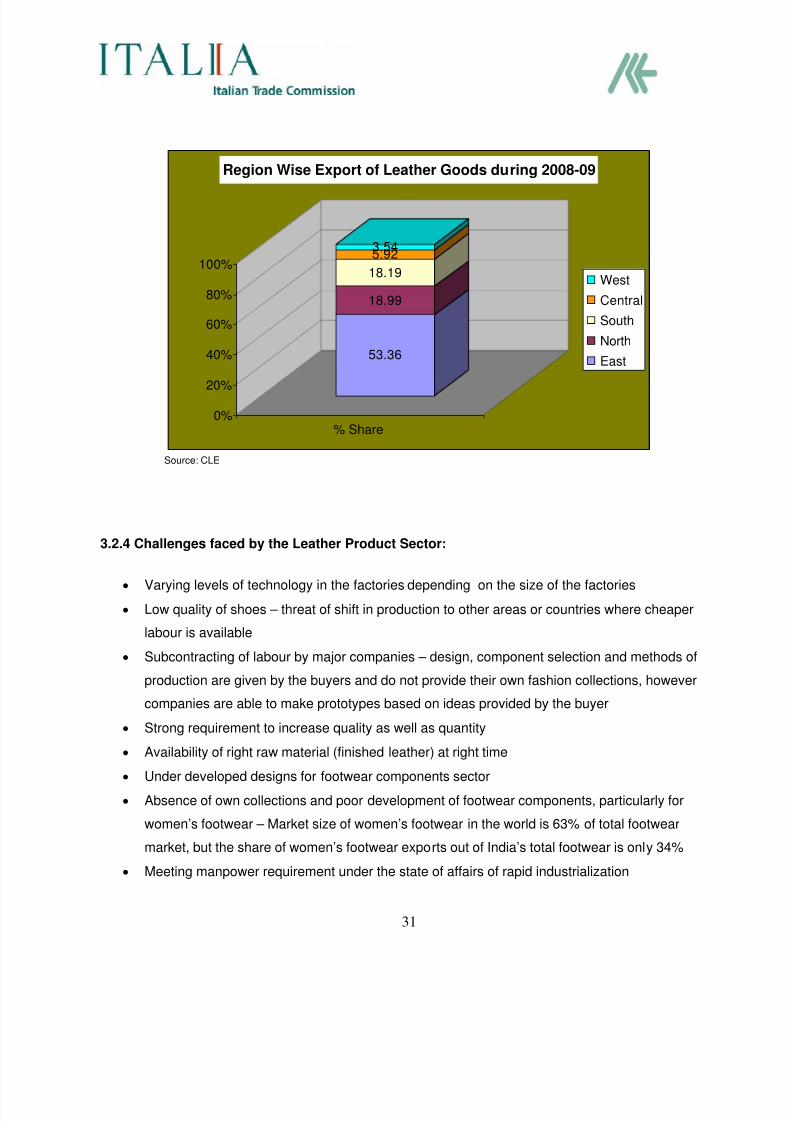
Table 25 - Regional Contribution to the Export of Leather Goods during 2008- 09
Region Quantity( in Pieces)
FOB Value in
Million Euros
Share in %( Value - Wise)
East 52,269,938 246.6326 53.36North 17,762,261 87.7727 18.99
South 17,432,059 84.0531 18.19
Central 8,079,949 27.3581 5.92
West 4,025,574 16.3659 3.54
Total 99,569,781 462.1824 100
Source: CLE
8/7/2019 Indian Leather & Tanning Industry Profile 2010
http://slidepdf.com/reader/full/indian-leather-tanning-industry-profile-2010 31/43
31
53.36
18.99
18.19
5.923.54
0%
20%
40%
60%
80%
100%
% Share
Region Wise Export of Leather Goods during 2008-09
West
Central
South
North
East
Source: CLE
3.2.4 Challenges faced by the Leather Product Sector:
• Varying levels of technology in the factories depending on the size of the factories
• Low quality of shoes – threat of shift in production to other areas or countries where cheaper
labour is available
• Subcontracting of labour by major companies – design, component selection and methods of
production are given by the buyers and do not provide their own fashion collections, however
companies are able to make prototypes based on ideas provided by the buyer
• Strong requirement to increase quality as well as quantity
• Availability of right raw material (finished leather) at right time
• Under developed designs for footwear components sector
• Absence of own collections and poor development of footwear components, particularly for
women’s footwear – Market size of women’s footwear in the world is 63% of total footwear
market, but the share of women’s footwear exports out of India’s total footwear is only 34%
• Meeting manpower requirement under the state of affairs of rapid industrialization
8/7/2019 Indian Leather & Tanning Industry Profile 2010
http://slidepdf.com/reader/full/indian-leather-tanning-industry-profile-2010 32/43
32
4. West Bengal – A Case Study in Tanning
4.1 Overview of the State as an investment destination
West Bengal - has seen amazing turnaround in recent years attracting maximum investment plans
worth Euro 19.095 Billion in Q3 2007-087 with third largest economy with NSDP (Net State Domestic
Product) of Euro 30.198 Billion growing at a phenomenal rate of (7-8)% over the years and with a
projected growth of 9% during Eleventh Plan 9.
The capital city of Kolkata itself constitutes a market of over 8 million while the Eastern and North-Eastern region provide a market of approximately 100 million.
4.2 Leather Industry in the State
Why West Bengal
A strong tradition and skills related to leather industry.
Easy availability of cheap raw materials like hides and skins.
Availability of water
Availability of additional incentives and fiscal benefits by the West Bengal Government
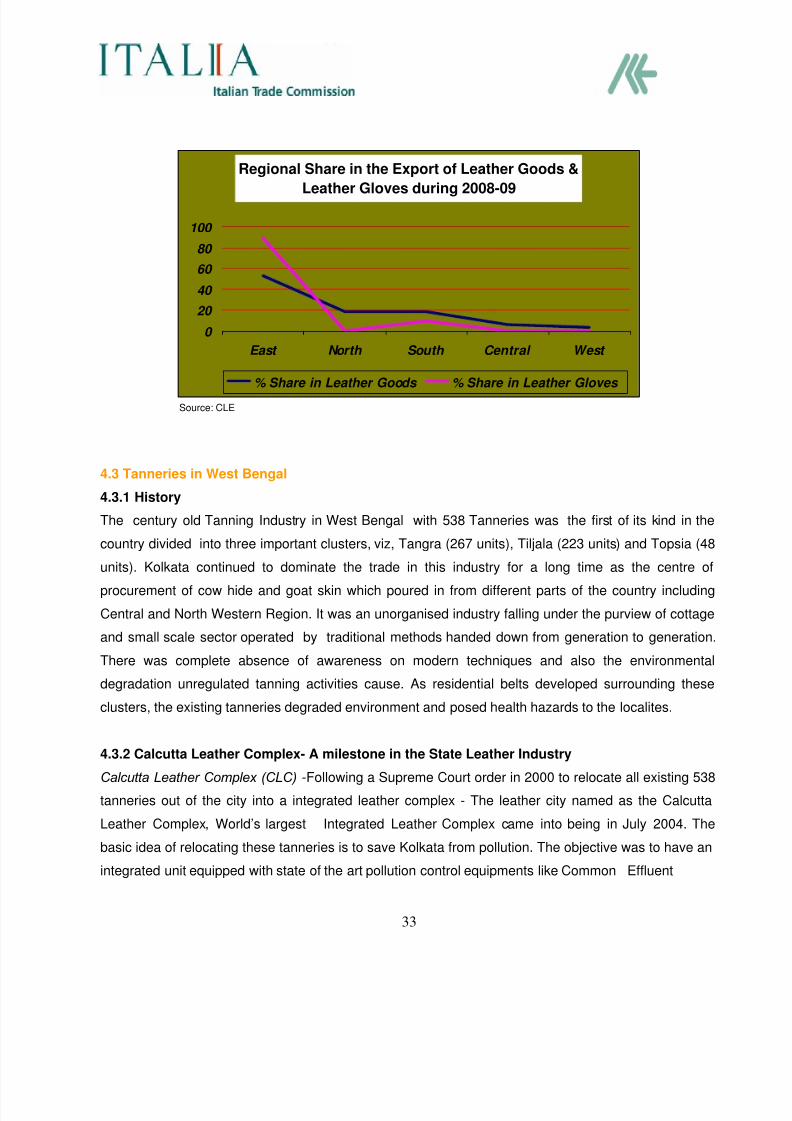
Large Market Size- 15.67% share in all India exports 10
Largest Indian exporter of leather goods and leather gloves which comprise 53.36% and
89.44% respectively of all India exports 11.
Graphically the leading position of eastern region in leather goods and gloves is manifested below
7 According to the findings of ASSOCHAM ( The Associated Chambers of Commerce and Industry of India ) Investment Meter (AIM) where 1
INR= .015 Euro and USD =0.72 Euro as on July 28,098 West Bengal Economic Review 2008-2009 9 Same as 2 & Eleventh Plan – 2007-2012 10
CLE 11 Same as 10
8/7/2019 Indian Leather & Tanning Industry Profile 2010
http://slidepdf.com/reader/full/indian-leather-tanning-industry-profile-2010 33/43
33
Regional Share in the Export of Leather Goods &
Leather Gloves during 2008-09
0
20
40
60
80
100
East North South Central West
% Share in Leather Goods % Share in Leather Gloves
Source: CLE
4.3 Tanneries in West Bengal
4.3.1 History
The century old Tanning Industry in West Bengal with 538 Tanneries was the first of its kind in the
country divided into three important clusters, viz, Tangra (267 units), Tiljala (223 units) and Topsia (48
units). Kolkata continued to dominate the trade in this industry for a long time as the centre of
procurement of cow hide and goat skin which poured in from different parts of the country including
Central and North Western Region. It was an unorganised industry falling under the purview of cottage
and small scale sector operated by traditional methods handed down from generation to generation.
There was complete absence of awareness on modern techniques and also the environmental
degradation unregulated tanning activities cause. As residential belts developed surrounding these
clusters, the existing tanneries degraded environment and posed health hazards to the localites.
4.3.2 Calcutta Leather Complex- A milestone in the State Leather Industry
Calcutta Leather Complex (CLC) -Following a Supreme Court order in 2000 to relocate all existing 538
tanneries out of the city into a integrated leather complex - The leather city named as the Calcutta
Leather Complex, World’s largest Integrated Leather Complex came into being in July 2004. The
basic idea of relocating these tanneries is to save Kolkata from pollution. The objective was to have an
integrated unit equipped with state of the art pollution control equipments like Common Effluent
8/7/2019 Indian Leather & Tanning Industry Profile 2010
http://slidepdf.com/reader/full/indian-leather-tanning-industry-profile-2010 34/43
34
Treatment & Chrome Recovery Plants and other infrastructure facilities. The leather complex – a
Euro.095 Billion project - is all set to emerge as an ideal place for leather processing and finishing
units.
Located 17 kilometers East of Kolkata the complex at Bantala, with a sprawling area of 1100 acres has
demarcated 201 acres for tannery zone.
The tannery zone - is meant to accommodate 538 existing units along with new units.
• Out of 538 tanneries only 454 tanneries applied for relocation inside the CLC. As of end of
2008, 236 tanners ( including old and new ones) have received the approval from the
Government to operate inside CLC.
4.3.3 Issues with the tanneries in CLC:
Technologically lagging behind the Southern and Northern Regions
There has not been a move up the value chain from suppliers of raw materials or processors of
low quality leather into more sophisticated and higher quality materials
4.3.4 In order to address these issues
The Tanning Training and Service Centre has been set up in Kolkata with Italian ‘Technical
Assistance’ provided by I.C.E (Italian Trade Commission) and ASSOMAC (National
Association of Italian Manufacturers of Footwear, Leather Goods and Tanning Machinery), in
collaboration with CLE (Council for Leather Exports), CLCTA (Calcutta Leather Complex
Tanners’ Association) and the Government of West Bengal as the confirming party.
The GCELT (Government College of Engineering and Leather Technology-Kolkata) and PISIE
(International Polytechnic for the Industrial and Economical Development) are the implementing
technical agencies from the Indian and Italian sides respectively.
The objective of TTSC is to help and assist the tanneries in the Calcutta Leather Complex
(CLC) to upgrade their processes and products to meet the regulations of the EU in terms of
safety, environment compliance and higher and consistent quality.
8/7/2019 Indian Leather & Tanning Industry Profile 2010
http://slidepdf.com/reader/full/indian-leather-tanning-industry-profile-2010 35/43
35
4.4 Other Noteworthy Initiatives Leather Goods Park - a 60 acre land adjacent to CLC has been proposed adding strength to the
manufacturing capacity. The park would be first of its kind in country to house 100
manufacturer-exporters. Government of West Bengal has provided ILPA (Indian Leather
Products Association) a land of 2776 sq metres within the ILPA Leather Goods Park for
opening a full fledged training centre for the grassroots level laborers. The training would be
conducted on cutting, stitching, method of selecting the raw materials to be tanned, skiving of
leather, splitting and other basic awareness necessary to produce leather products. The centre
will be run by ILPA. Leather Footwear Park in the vicinity of CLC
8/7/2019 Indian Leather & Tanning Industry Profile 2010
http://slidepdf.com/reader/full/indian-leather-tanning-industry-profile-2010 36/43
36
5. Government Initiatives
Globalization of the Indian economy is a major objective of the Government. It has been appreciated
that given the right type of policy support and framework, India would be able to substantially augment
her exports. The basic thrust of Indian economic policy in the recent years has been to integrate the
Indian economy with the global economy and expose the Indian manufacturers to the global market
and competition.
Leather and Leather Products as a sector, has been given considerable attention by the Government
of India at various levels due to its inherent strengths and prospective features. Many Expert
Committees were formed by the Government from time to time to suggest measures for strengthening
Indian leather industry and to enhance exports.
Policy initiatives taken by the Government of India since 1973 have been instrumental in the dramatic
transformation of the leather industry during sixties to nineties. • The entire leather sector is now de-licensed and de-reserved, paving the way for expansion
on modern lines with state of the art machinery and equipments.
•
Zero Duty on the import of all type of raw materials, embellishments and components,concessional duty on import of specified machinery, liberal import-export of consumer
products and components have been introduced
Identification of this sector as a Focus Sector in the Foreign Trade Policy 2004-09 to implement
Special Focus Initiatives is a bold move towards further up gradation of the leather industry.
ILDP- Indian Leather Development Programme –The Euro 223.15 Million scheme was
undertaken during the Ninth Five Year Plan (1996-2000) and is still being implemented during
the Eleventh Five Year Plan ( 2007-2012) The thrust areas include :
• Modernization of Production Facilities
• Up gradation of Technologies
• Expansion of Production Capacities
8/7/2019 Indian Leather & Tanning Industry Profile 2010
http://slidepdf.com/reader/full/indian-leather-tanning-industry-profile-2010 37/43
37
• Setting Up of Institutional Facilities
• Skill Development of Fresh Manpower
• Skill Upgradation of Existing Manpower
• Development of Rural Artisans
• Address Environmental concerns in the Tanning Sector
• Propagating India as an Attractive Destination for Joint Venture Collaborations/FDIs in the
Foreign Market
The Government assigned Euro 92.38 Million for Integrated Development of Leather Sector (IDLS)
Scheme and Euro 130.78 Million for various sub - schemes under ILDP for infrastructure strengthening
in the leather sector. The sub schemes include: ‘Establishment of Parks’, ’Design Studios’, ’HRD’,
’Intechmart Scheme’
Tannery Modernization Scheme - This was launched under ILDP in 2000. The objective was
to support existing tanneries for undertaking modernization programme for positive
environmental impact, becoming competitive, effecting better capacity utilization, achieving
productivity gains and reducing wastage.It included financial assistance of 30% of cost of plant
& machinery for small scale sector ( with a ceiling of Euro 0.05 Million) and 20% for othersectors ( with a ceiling of Euro 0.06 Million).
NLDP - National Leather Development Programme – The Joint Programme of Government
of India and UNDP with a total outlay of Euro 19.11 Million ( with Euro 11.7 Million from UNDP
and the rest by Indian Government) was drawn up for the integrated development of leather
and leather products sector within the country. Its objectives encompass:
Human Resource Development including upgradation of artisanal production system
Design and product development
Development of support and auxiliary industries
Research and Development
Environment Protection
Export enhancement and coordination
8/7/2019 Indian Leather & Tanning Industry Profile 2010
http://slidepdf.com/reader/full/indian-leather-tanning-industry-profile-2010 38/43
38
Leather Technology Mission - The Government of India launched the four year mission in
January 1995 aimed at spreading the awareness of wide variety of technology in the leather
sector primarily focusing the tanneries. The programme coordinated by Council of Scientific
and Industrial Research with its constituent organization, viz,Central Leather Research Institute
covered 172 projects in 16 States.
8/7/2019 Indian Leather & Tanning Industry Profile 2010
http://slidepdf.com/reader/full/indian-leather-tanning-industry-profile-2010 39/43
39
6. Indian Leather Industry – A SWOT Analysis
6.1 SWOT Analysis of the Indian Leather Industry
Strengths
o Uniqueness of Leather
o Fashion Choice
o Fine Quality of Skins
o Abundance of Human Resourceo Easily Accessible Raw Material
o Prevalence of Production Chain from Village to Fashion
o Versatile Bio-Polymer Collagen
o Policy Support from the Government
o Encouragement by International-Development Agencies
Weakness
o Traditional Processing Technology
o Dependence on Imported Machines and Components
o Inadequate Internal Demand
o Pollution Problem
o High Degree of Subjectivity in Quality Assessment and Grading
o Widely Dispersed Units
o Insufficient Enterprising Attitude of the Industry
o Poor Database
o Technology Management and Financial Problems
8/7/2019 Indian Leather & Tanning Industry Profile 2010
http://slidepdf.com/reader/full/indian-leather-tanning-industry-profile-2010 40/43
40
Opportunities
o Incentive from the Governmento Advances in Modern Biology, Genetics, Chemical Engineering, Computers and Electro
polymer Science
o Opulence of Synthetic Support Materials
o Preference for Indian Leather –The Goodwill factor
Threats
o Environmental Pollution may force closure of Tanneries unless relocated to a specified
cluster
o Liability Aspects of Pollutiono High Price of Leather & Leather products
o Inelastic Supply of Raw Material
o Perpetual Dependence on Western Market
o Rising Aggressive Competition from International Players
o Challenges from Synthetics
6.2 Recommendations:
o Animal Banks- Up gradation of the raw material and other related items warrant animalhusbandry should be made into an independent industry by forming animal banks.
o Non- Conventional Raw Materials Alternative sources of raw materials, viz from other
animals, e.g. camels, mules, donkeys and horses should be exploited
o 2-3 Tier System of Leather Technology- Adoption of multi layered system of operation
may contribute towards improvement of the quality of the end-product
o Industrial Estates-Formation of Clusters would enable the industry to make the effluent
treatment process more organized and seamless.
o
Base Shift to Coastal Area- Proximity of the production unit to the coastal area would easeprocurement of water and the disposal of effluent.
o Auxiliaries within the country- Much of the expenses could be pruned by using the
auxiliaries required for fashionable leather products within the country.
o Manufacturing Machines- Foreign Collaboration should be sought to manufacture
machines for the leather and leather products.
8/7/2019 Indian Leather & Tanning Industry Profile 2010
http://slidepdf.com/reader/full/indian-leather-tanning-industry-profile-2010 41/43
41
o Technical Training- The workers in the leather plants are required to undergo exhaustive
training process so that they are equipped to operate in an advanced environment
o Market Knowledge-Industry should be well versed with any latest development in the
Leather World through active interaction and participation in International Expositions and
Conferences
o R & D – R&D should be constantly up graded to be at par with the global village.
8/7/2019 Indian Leather & Tanning Industry Profile 2010
http://slidepdf.com/reader/full/indian-leather-tanning-industry-profile-2010 42/43
42
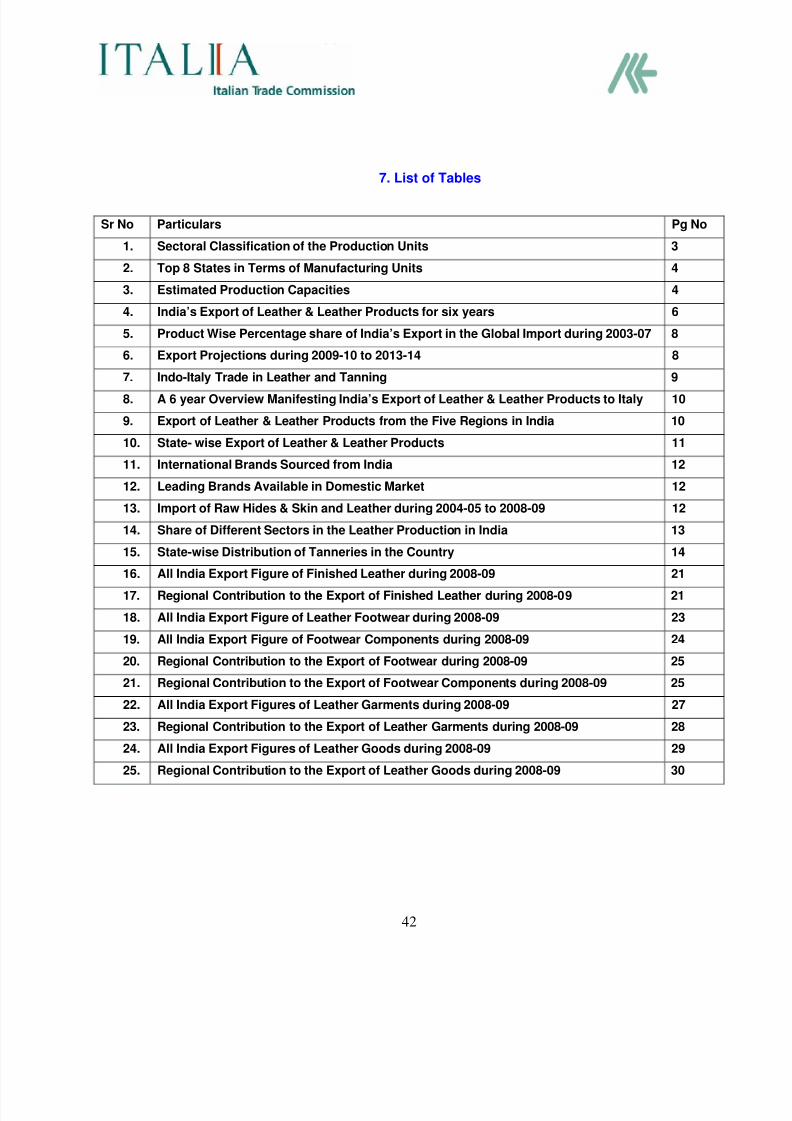
7. List of Tables
Sr No Particulars Pg No
1. Sectoral Classification of the Production Units 3
2. Top 8 States in Terms of Manufacturing Units 4
3. Estimated Production Capacities 4
4. India’s Export of Leather & Leather Products for six years 6
5. Product Wise Percentage share of India’s Export in the Global Import during 2003-07 8
6. Export Projections during 2009-10 to 2013-14 8
7. Indo-Italy Trade in Leather and Tanning 9
8. A 6 year Overview Manifesting India’s Export of Leather & Leather Products to Italy 10
9. Export of Leather & Leather Products from the Five Regions in India 10
10. State- wise Export of Leather & Leather Products 11
11. International Brands Sourced from India 12
12. Leading Brands Available in Domestic Market 12
13. Import of Raw Hides & Skin and Leather during 2004-05 to 2008-09 12
14. Share of Different Sectors in the Leather Production in India 13
15. State-wise Distribution of Tanneries in the Country 14
16. All India Export Figure of Finished Leather during 2008-09 21
17. Regional Contribution to the Export of Finished Leather during 2008-09 21
18. All India Export Figure of Leather Footwear during 2008-09 23
19. All India Export Figure of Footwear Components during 2008-09 24
20. Regional Contribution to the Export of Footwear during 2008-09 25
21. Regional Contribution to the Export of Footwear Components during 2008-09 25
22. All India Export Figures of Leather Garments during 2008-09 27
23. Regional Contribution to the Export of Leather Garments during 2008-09 28
24. All India Export Figures of Leather Goods during 2008-09 2925. Regional Contribution to the Export of Leather Goods during 2008-09 30
8/7/2019 Indian Leather & Tanning Industry Profile 2010
http://slidepdf.com/reader/full/indian-leather-tanning-industry-profile-2010 43/43
Annexure
Leading Leather Associations/Councils in India
• Council for Leather Exports (CLE)website: www.leatherindia.org
• All India Skin and Hide Tanners & Merchants Association (AISHTMA)website: http://www.aishtma.com
• Indian Finished Leather Manufacturers & Exporters Association (IFLMEA)
website: http://www.iflmea.net/svs.aspx
• Indian Footwear Components Manufacturers Association (IFCOMA)website: www.ifcoma.org
• Indian Leather Products Association (ILPA)website: http://www.ilpaindia.org
• Indian Leather Technologists’ Association (ILTA)website: http://www.iltaonleather.com/
• Central Leather Research Institute (CLRI)website: www.clri.org
![IS 12623 (1989): Chromed tanned cattle hides in …conditions [CHD 17: Leather, Tanning Materials and Allied Products] IS 12623 : 1989 Indian Standard LEATHER-CHROMETANNEDCATTLE HIDESINWETBLUECONDITION-](https://img.pdfslide.us/doc/110x75/5fa03273f6ccfd3666278dfe/is-12623-1989-chromed-tanned-cattle-hides-in-conditions-chd-17-leather-tanning.jpg)