Embed Size (px)
Citation preview
Indian Institute of Science (IISc), Bangalore, India
Interference Modelling in Spatially Distributed Shadowed Wireless Systems
Neelesh B. Mehta
ECE Department, IISc
Project 602 duration: April 2008 to March 2010

Indian Institute of Science, Bangalore
Outline
• Summary of research output
• Inter-cell interference modeling
• Our two approaches
• Results
• Conclusions
Indian Institute of Science, Bangalore
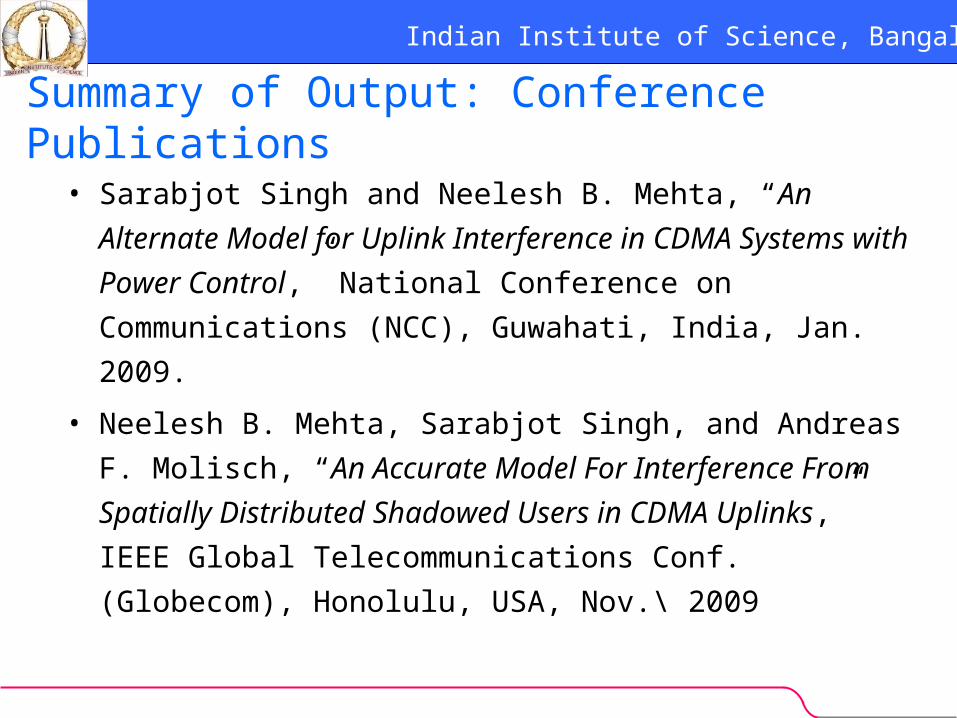
Summary of Output: Conference Publications
• Sarabjot Singh and Neelesh B. Mehta, “An Alternate
Model for Uplink Interference in CDMA Systems with
Power Control,” National Conference on Communications
(NCC), Guwahati, India, Jan. 2009.
• Neelesh B. Mehta, Sarabjot Singh, and Andreas F.
Molisch, “An Accurate Model For Interference From
Spatially Distributed Shadowed Users in CDMA Uplinks,”
IEEE Global Telecommunications Conf. (Globecom),
Honolulu, USA, Nov.\ 2009

Indian Institute of Science, Bangalore
Summary of Output: Journal Publications
• Sarabjot Singh, Neelesh B. Mehta, Andreas F. Molisch,
and Abhijit Mukhopadhyay, “Moment-Matched Lognormal
Modeling of Uplink Interference with Power Control and
Cell Selection,” IEEE Trans. on Wireless
Communications, March 2010.
• Neelesh B. Mehta, Sarabjot Singh, Abhijit Mukhopadhyay,
and Andreas F. Molisch, “Accurately Modeling the
Interference From Spatially Distributed Shadowed Users
in CDMA Uplinks,” To be submitted to IEEE Trans. on
Communications, 2010.
Indian Institute of Science, Bangalore
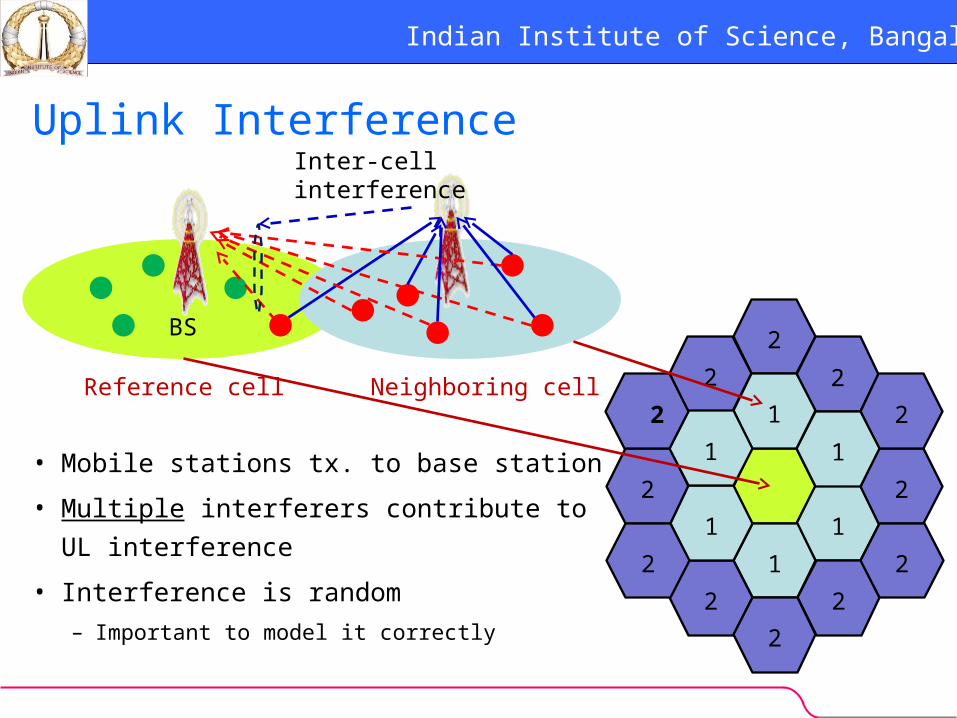
Uplink Interference
• Mobile stations tx. to base station
• Multiple interferers contribute to UL
interference
• Interference is random
– Important to model it correctly
Reference cell Neighboring cell
Inter-cell interference
1
1
2
2
2
2
2
1
2
2
2
2
2
1
2
1
1
2
BS

Indian Institute of Science, Bangalore
Wireless Propagation Characteristics
• Path loss (d)
• Shadowing (s)
– Lognormal distribution
• Fading (f)
– Rayleigh, Ricean, Nakagami-m
ss ff
4
0
d
dP
Path loss Shadowing Fading
Rx. power
Tx. power

Indian Institute of Science, Bangalore
Lognormal Probability Distribution
• A skewed distribution
• Several and varied applications in wireless propagation,
finance, health care, reliability theory, optics, etc.
2 210
2
2
(10log )10 / ln10( ) exp
22
, ( , )
X
Y
xp x
x
x e Y N
0 1 2 3 4 5 6 7 8 9 100
0.2
0.4
0.6
0.8
1
1.2
1.4
Lognormal Prob. Distribution
x
pX(x)

Indian Institute of Science, Bangalore
Conventional Model: Gaussian Approximation
• Problem: Closed-form tractable expressions for
probability distribution of sum are not known
• Conventional solution: Model as a Gaussian RV
– [Chan, Hanly’01; Tse,Viswanath’05]
• Two justifications given:
– Central limit theorem
– Less randomness in the presence of power control and
cell site selection

Indian Institute of Science, Bangalore
Our Approach: Approximate As A Lognormal
• Related literature supports this approach– Works much better given number of summands
– [Mehta et al'07, Fenton-Wilkinson’60, Schleher‘77, Schwartz-
Yeh‘82, Beaulieu-Xie’04]
• ‘Permanence' of lognormal sums– [W. A. Janos ‘70, R. Barakat’76]
Model inter-cell interference as a lognormal random variable
Model inter-cell interference as a lognormal random variable
Indian Institute of Science, Bangalore
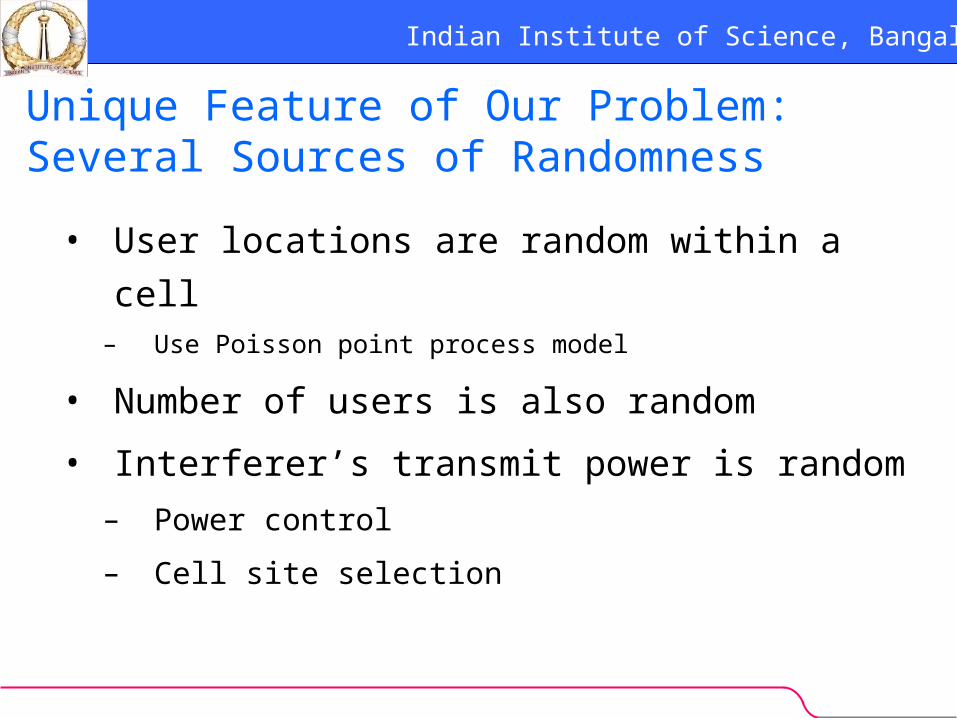
Unique Feature of Our Problem: Several Sources of Randomness
• User locations are random within a cell– Use Poisson point process model
• Number of users is also random
• Interferer’s transmit power is random
– Power control
– Cell site selection

Indian Institute of Science, Bangalore
Our Two Methods to Fix Lognormal Parameters
2 210
2
2
(10log )10 / ln10( ) exp
22
, ( , )
X
Y
xp x
x
x e Y N
Goal: Determine the two parameters μ and σGoal: Determine the two parameters μ and σ
Lognormal:
Developed two methods:
• Moment-matching method
• MGF-matching method

Indian Institute of Science, Bangalore
Moments of actual interference Moments of actual interference
Moment Matching: Key Results
• Match the first two moments of total uplink interference
• Advantage: Closed-form expressions possible

Indian Institute of Science, Bangalore
CCDF Matching: To See Tail Behaviour
• Lognormal tracks the actual CCDF very well
• Better than conventional Gaussian
Ave. # of users/cell= 10First tier interference
Total interference
Com
plem
enta
ry C
DF
Indian Institute of Science, Bangalore
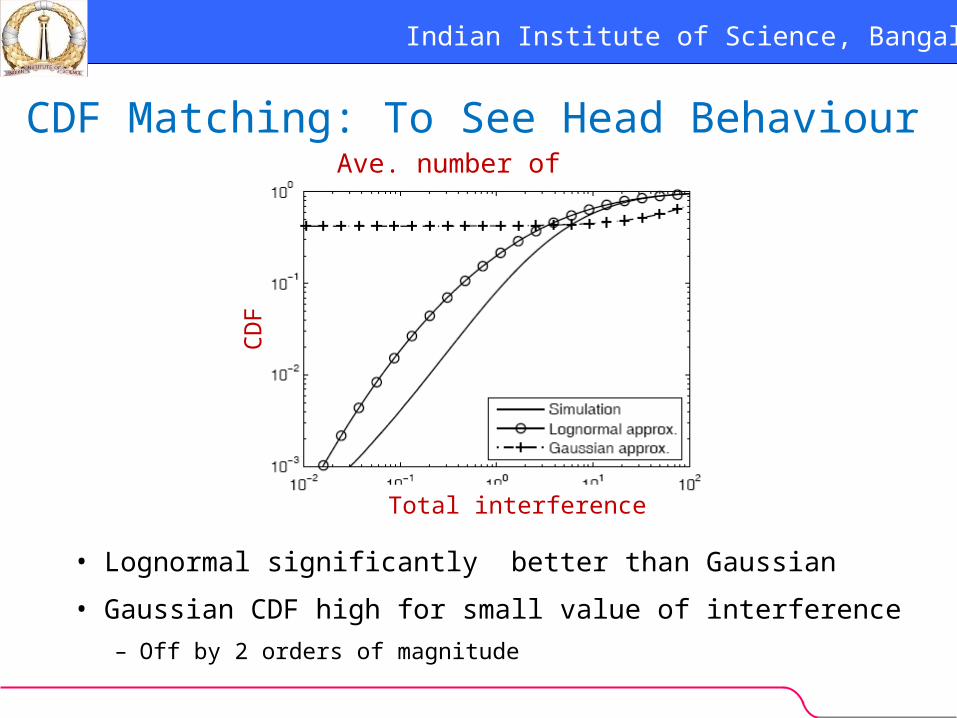
CDF Matching: To See Head Behaviour
• Lognormal significantly better than Gaussian
• Gaussian CDF high for small value of interference
– Off by 2 orders of magnitude
Ave. number of users/cell= 10
CD
F
Total interference

Indian Institute of Science, Bangalore
With Cell Selection (Handoff Set Size = 2)
• Moment matching based lognormal approximation is better than
Gaussian even with cell site selection
– Shown for first-tier interference
10-2
10-1
100
101
102
10-3
10-2
10-1
100
Interference
CD
F
Simulation
F-W methodGaussian
K = 10
K = 30
100
101
102
103
10-3
10-2
10-1
100
InterferenceC
CD
F
Interference with cell-site selection
SimulationF-W methodGaussian
K = 10
K = 30

Indian Institute of Science, Bangalore
Further Improvement Using MGF Matching
• Key idea: Match moment generating function
instead of moments
• Advantage: Gives the parametric flexibility to
match both portions of distribution well
• Technical enabler: Can evaluate MGF relatively
easily when users are distributed as per a Poisson
spatial process
– Benefit from the extensive theory on Poisson processes

Indian Institute of Science, Bangalore
Improved Lognormal Approximation Method
• MGF of the total uplink interference from users in cell k
• ψk(s): MGF of the interference from an arbitrary user in cell k
• Method: Match MGFs at s1 and s2 with lognormal’s MGF• Method: Match MGFs at s1 and s2 with lognormal’s MGF
Indian Institute of Science, Bangalore
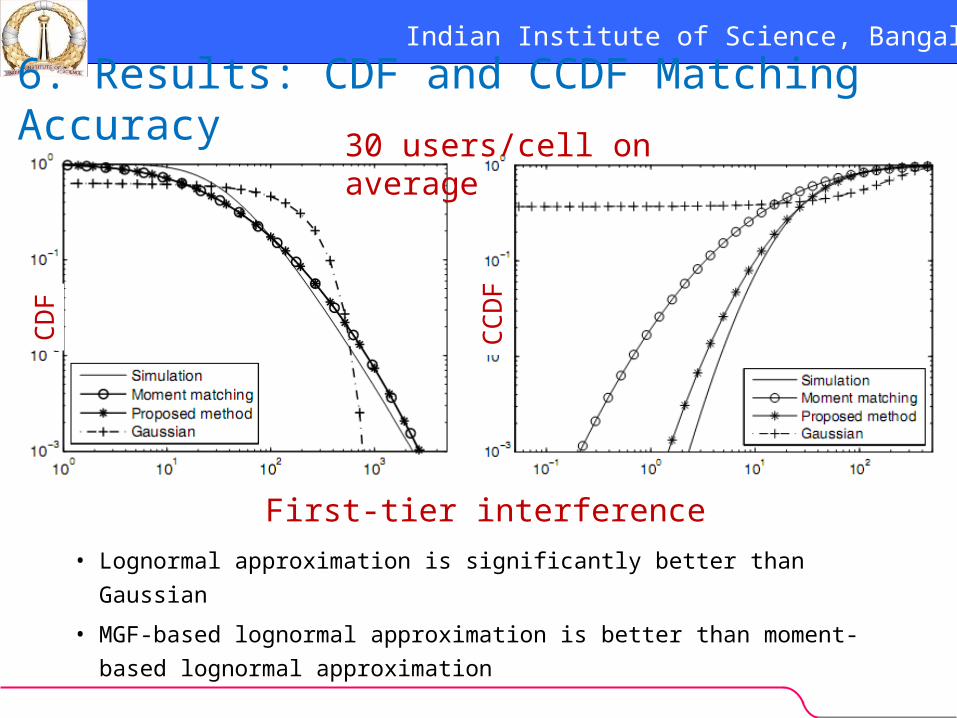
6. Results: CDF and CCDF Matching Accuracy
• Lognormal approximation is significantly better than Gaussian
• MGF-based lognormal approximation is better than moment-based lognormal approximation
CCDF
First-tier interference
CDF
30 users/cell on average
Indian Institute of Science, Bangalore
Conclusion
• Goal: Model inter-cell interference in uplink of CDMA
systems
• Showed: Lognormal is better than the conventional
Gaussian
• New methods: To determine parameters of approximating
lognormal
– First method :Based on moment-matching
– Second improved method: MGF-based moment matching

Indian Institute of Science, Bangalore
Extensions
Two model generalizations:
• Extend the femto cells
– Multiple femto cells within a macrocell
• Hybrid macrocell/microcell cellular layouts
Two other improvements:
– Include peak power constraints
– Better cell area approximation techniques

Indian Institute of Science, Bangalore
Inter-Cell Interference in CDMA Uplinks
• Spreading codes diminish interference but do not annul it
• Sum of signals from many users served by other BSs
• Undergoes shadowing/fading
Reference cell Neighboring cell
It is a random variable. How do we characterize it? It is a random variable. How do we characterize it?

Indian Institute of Science, Bangalore
System Model With Power Control
• Fading-averaged inter-cell interference
• Path loss and shadowing model:
• Interference power (with power control) at BS 0 from users served by BS k, located at x1(k), . . . , xNk(k) :
Reference cellInterfering cell

Indian Institute of Science, Bangalore
User Location and Number Modelling
• Model as a Poisson Spatial Process– Characterized by an intensity parameter (λ)
– Analytically tractable model
– Probability that Nk users occur within a cell of area A equals
Analysis approximation
Indian Institute of Science, Bangalore
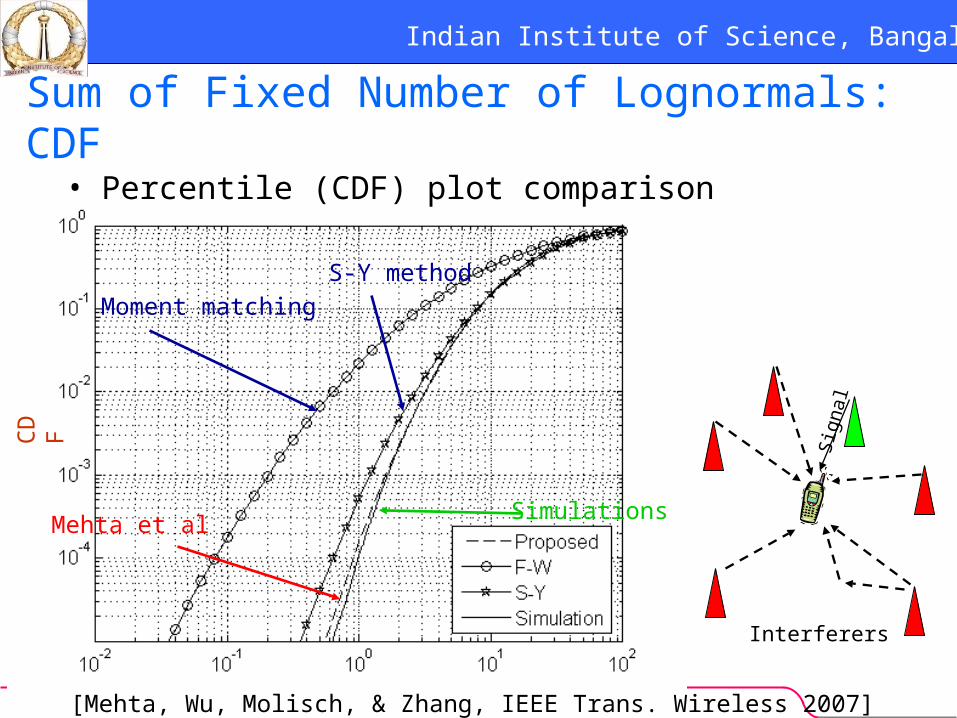
Sum of Fixed Number of Lognormals: CDF
Moment matching
SimulationsMehta et al
S-Y method
CD
F Sig
nal
Interferers
[Mehta, Wu, Molisch, & Zhang, IEEE Trans. Wireless 2007]
• Percentile (CDF) plot comparison

Indian Institute of Science, Bangalore
Sum of Fixed Number of Lognormals: CCDF
• Various approaches exist to accurately characterize the approximating lognormal
Simulation
Fenton-Wilkinson
Mehta et al
S-YLog scale
Com
plem
enta
ry
CD
F
[Mehta, Wu, Molisch, & Zhang, IEEE Trans. Wireless 2007]

Indian Institute of Science, Bangalore
CCDF Matching (Denser User Population)
• Lognormal approximation is still significantly better
• In sync with literature on sums of fixed number of
lognormals26
Ave. # of users/cell= 30First tier interference
Total interference
Com
plem
enta
ry C
DF
Indian Institute of Science, Bangalore
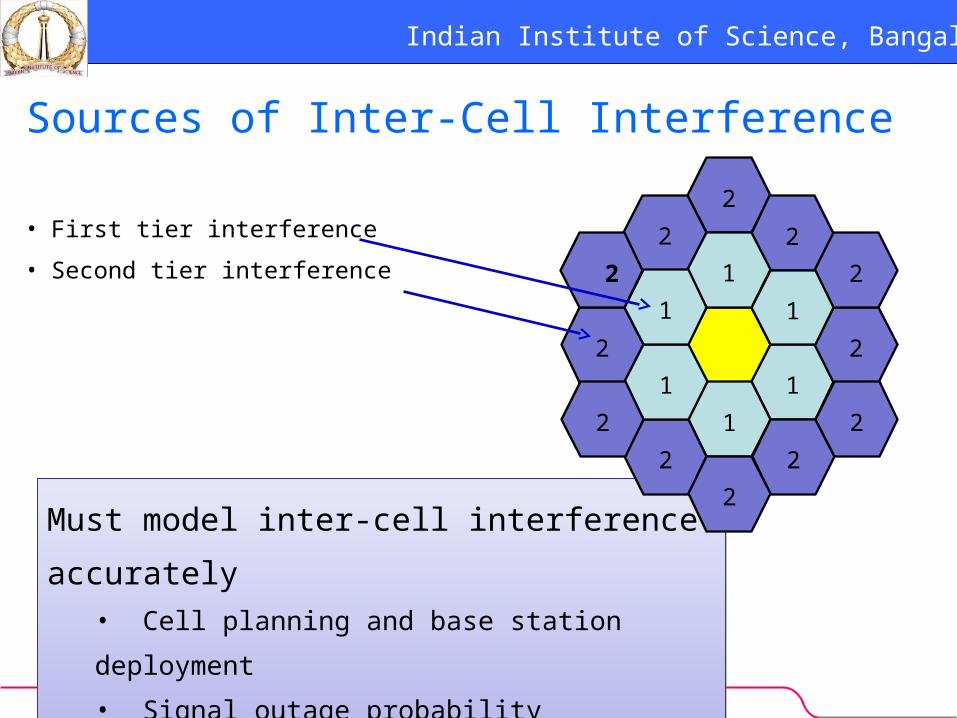
Must model inter-cell interference accurately• Cell planning and base station deployment
• Signal outage probability evaluation
• Performance of link adaptation
Must model inter-cell interference accurately• Cell planning and base station deployment
• Signal outage probability evaluation
• Performance of link adaptation
Sources of Inter-Cell Interference
• First tier interference
• Second tier interference
1
1
2
2
2
2
2
1
2
2
2
2
2
1
2
1
1
2
Indian Institute of Science, Bangalore
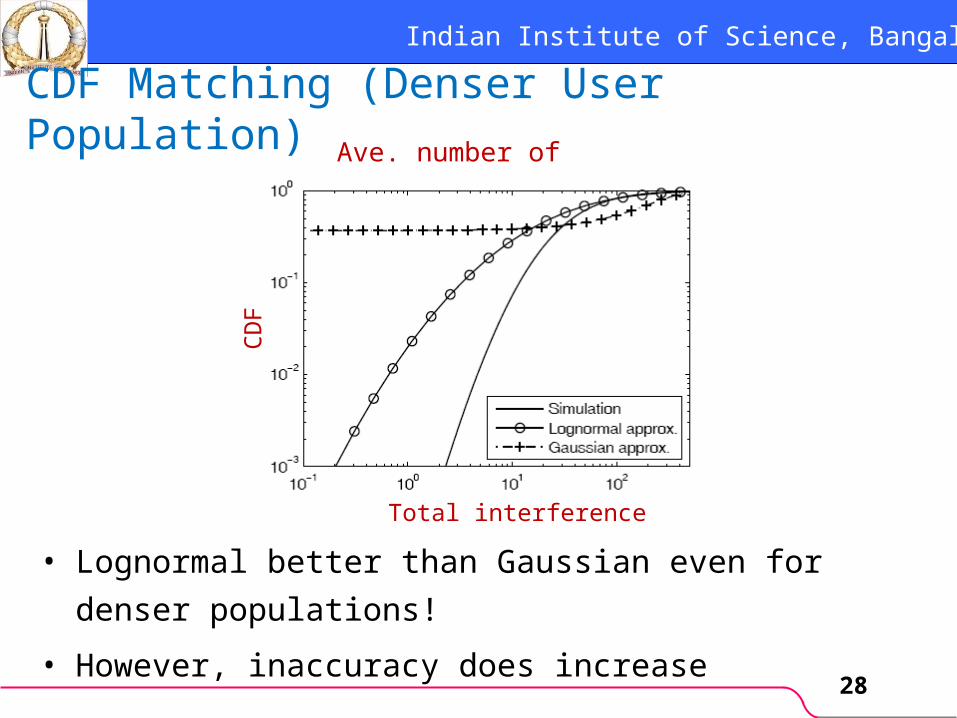
CDF Matching (Denser User Population)
• Lognormal better than Gaussian even for denser
populations!
• However, inaccuracy does increase28
Ave. number of users/cell= 30
Total interference
CD
F

Indian Institute of Science, Bangalore
With Cell Site Selection & Power Control
• Serving base station chosen by a user need not be the
geographically closest one
– Due to shadowing
• Depends on soft handoff set size
– The number of neighboring base stations a user tracks
Reference cell Neighboring interfering cell
Indian Institute of Science, Bangalore
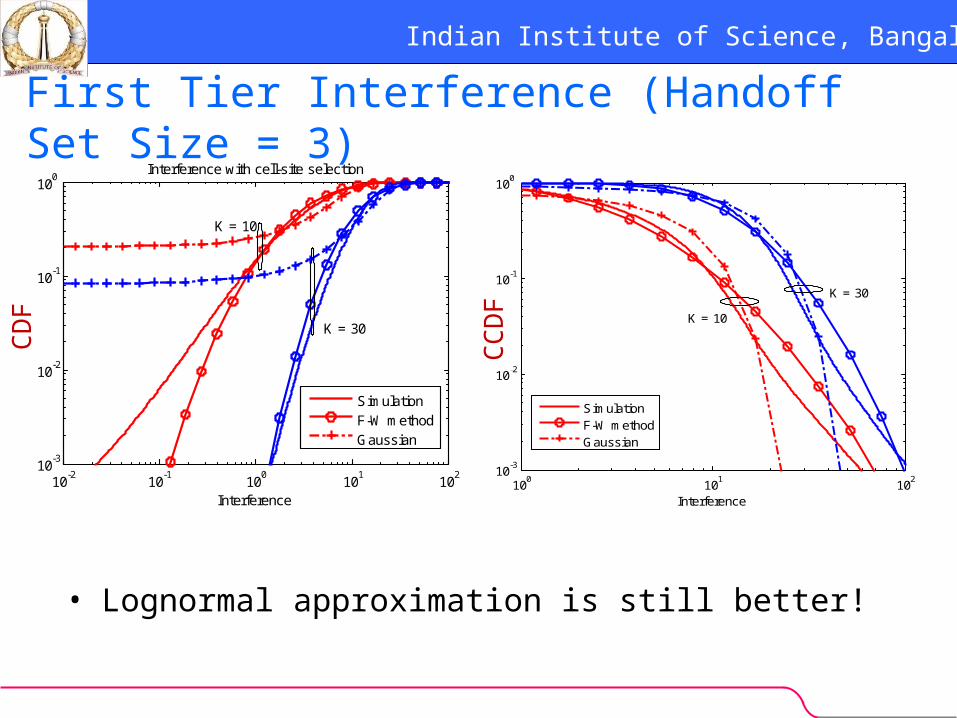
First Tier Interference (Handoff Set Size = 3)
• Lognormal approximation is still better!
100
101
102
10-3
10-2
10-1
100
CC
DF
Interference
SimulationF-W methodGaussian
K = 30
K = 10
10-2
10-1
100
101
102
10-3
10-2
10-1
100
Interference
CD
F
Interference with cell-site selection
SimulationF-W methodGaussian
K = 10
K = 30
CD
F
CC
DF

Indian Institute of Science, Bangalore
Second Tier Interference (Handoff Set Size = 2)
• Second-tier cells are further away
10-3
10-2
10-1
100
10-3
10-2
10-1
100
Sum of k interferers ;k~poiss(10)
CD
F
Simulation
F-W methodGaussian
K = 30
K = 10
10-1
100
101
102
10-3
10-2
10-1
100
InterferenceC
CD
F
Simulation
F-W methodGaussian
K = 30
K = 10
CD
F
CC
DF
Indian Institute of Science, Bangalore
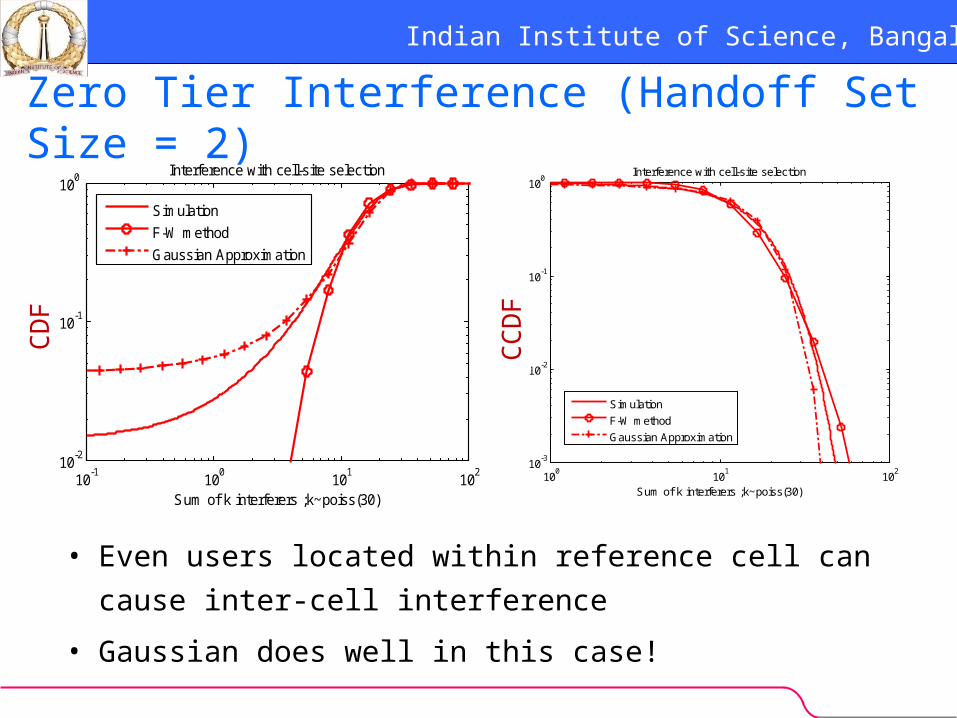
Zero Tier Interference (Handoff Set Size = 2)
• Even users located within reference cell can cause inter-cell
interference
• Gaussian does well in this case!
10-1
100
101
102
10-2
10-1
100
Sum of k interferers ;k~poiss(30)
CD
F
Interference with cell-site selection
Simulation
F-W method
Gaussian Approximation
100
101
102
10-3
10-2
10-1
100
Sum of k interferers ;k~poiss(30)
CC
DF
Interference with cell-site selection
Simulation
F-W method
Gaussian Approximation
CD
F
CC
DF