Embed Size (px)
Citation preview
Market Feasibility Analysis
Indian Creek Apartments
Decatur, DeKalb County, Georgia
Prepared for:
LGD Development
Effective Date: August 6, 2018
Site Inspection: August 6, 2018
Indian Creek Apartments | Table of Contents
Page i
TABLE OF CONTENTS
1. EXECUTIVE SUMMARY.................................................................................................... 12. INTRODUCTION .............................................................................................................. 7A. Overview of Subject..............................................................................................................................................7B. Purpose of Report.................................................................................................................................................7C. Format of Report ..................................................................................................................................................7D. Client, Intended User, and Intended Use .............................................................................................................7E. Applicable Requirements......................................................................................................................................7F. Scope of Work ......................................................................................................................................................7G. Report Limitations ................................................................................................................................................8
3. PROJECT DESCRIPTION.................................................................................................... 9A. Project Overview ..................................................................................................................................................9B. Project Type and Target Market ...........................................................................................................................9C. Building Types and Placement..............................................................................................................................9D. Detailed Project Description.................................................................................................................................9
1. Project Description.......................................................................................................................................92. Proposed Timing of Development .............................................................................................................10
4. SITE EVALUATION ......................................................................................................... 11A. Site Analysis ........................................................................................................................................................11
1. Site Location...............................................................................................................................................112. Existing and Proposed Uses .......................................................................................................................123. General Description of Land Uses Surrounding the Subject Site ...............................................................134. Land Uses Surrounding the Subject Site ....................................................................................................14
B. Neighborhood Analysis.......................................................................................................................................151. General Description of Neighborhood .......................................................................................................152. Neighborhood Planning Activities..............................................................................................................153. Public Safety...............................................................................................................................................15
C. Site Visibility and Accessibility ............................................................................................................................161. Visibility ......................................................................................................................................................162. Vehicular Access.........................................................................................................................................163. Availability of Public Transit .......................................................................................................................164. Availability of Inter-Regional Transit..........................................................................................................175. Accessibility Improvements under Construction and Planned ..................................................................176. Environmental Concerns ............................................................................................................................17
D. Residential Support Network..............................................................................................................................171. Key Facilities and Services near the Subject Site........................................................................................172. Essential Services .......................................................................................................................................183. Commercial Goods and Services ................................................................................................................194. Location of Low Income Housing ...............................................................................................................20
E. Site Conclusion ...................................................................................................................................................20
5. MARKET AREA .............................................................................................................. 21A. Introduction........................................................................................................................................................21B. Delineation of Market Area ................................................................................................................................21
6. COMMUNITY DEMOGRAPHIC DATA.............................................................................. 23A. Introduction and Methodology ..........................................................................................................................23B. Trends in Population and Households ................................................................................................................23
1. Recent Past Trends.....................................................................................................................................232. Projected Trends ........................................................................................................................................233. Building Permit Trends...............................................................................................................................24
C. Demographic Characteristics..............................................................................................................................251. Age Distribution and Household Type .......................................................................................................25
Indian Creek Apartments | Table of Contents
Page i i
2. Renter Household Characteristics..............................................................................................................263. Income Characteristics ...............................................................................................................................27
7. EMPLOYMENT TREND................................................................................................... 30A. Introduction........................................................................................................................................................30B. Labor Force, Resident Employment, and Unemployment..................................................................................30
1. Trends in County Labor Force and Resident Employment .........................................................................302. Trends in County Unemployment Rate......................................................................................................30
C. Commutation Patterns .......................................................................................................................................31D. At-Place Employment .........................................................................................................................................31
1. Trends in Total At-Place Employment........................................................................................................312. At-Place Employment by Industry Sector...................................................................................................323. Major Employers ........................................................................................................................................344. Recent Economic Expansions and Contractions ........................................................................................35
E. Conclusions on Local Economics.........................................................................................................................36
8. PROJECT-SPECIFIC AFFORDABILITY & DEMAND ANALYSIS ............................................. 37A. Affordability Analysis ..........................................................................................................................................37
1. Methodology..............................................................................................................................................372. Affordability Analysis .................................................................................................................................383. Conclusions of Affordability .......................................................................................................................39
B. Demand Estimates and Capture Rates ...............................................................................................................391. Methodology..............................................................................................................................................392. Demand Analysis ........................................................................................................................................403. DCA Demand Conclusions ..........................................................................................................................41
9. COMPETITIVE RENTAL ANALYSIS................................................................................... 42A. Introduction and Sources of Information ...........................................................................................................42B. Overview of Market Area Housing Stock............................................................................................................42C. Survey of General Occupancy Rental Communities ...........................................................................................44
1. Introduction to the Rental Housing Survey................................................................................................442. Location......................................................................................................................................................443. Size of Communities...................................................................................................................................454. Age of Communities...................................................................................................................................455. Structure Type............................................................................................................................................456. Vacancy Rates ............................................................................................................................................457. Rent Concessions .......................................................................................................................................458. Absorption History .....................................................................................................................................46
D. Analysis of Product Offerings .............................................................................................................................461. Payment of Utility Costs.............................................................................................................................462. Unit Features..............................................................................................................................................463. Parking .......................................................................................................................................................464. Community Amenities................................................................................................................................465. Unit Distribution.........................................................................................................................................476. Effective Rents ...........................................................................................................................................477. Scattered Site Rentals ................................................................................................................................488. DCA Average Market Rent .........................................................................................................................48
E. Multi-Family Pipeline..........................................................................................................................................49F. Housing Authority Data ......................................................................................................................................50G. Existing Low-Income Rental Housing..................................................................................................................50H. Impact of Abandoned, Vacant, or Foreclosed Homes ........................................................................................51
10. FINDINGS AND CONCLUSIONS ................................................................................... 53A. Key Findings ........................................................................................................................................................53B. Product Evaluation .............................................................................................................................................54C. Price Position ......................................................................................................................................................55
Indian Creek Apartments | Table of Contents
Page i i i
11. ABSORPTION AND STABILIZATION RATES .................................................................. 58A. Absorption Estimate ...........................................................................................................................................58B. Impact on Existing and Pipeline Rental Market..................................................................................................58
12. INTERVIEWS.............................................................................................................. 5913. CONCLUSIONS AND RECOMMENDATIONS ................................................................. 60APPENDIX 1 UNDERLYING ASSUMPTIONS AND LIMITING CONDITIONS ............................... 61APPENDIX 2 ANALYST CERTIFICATIONS ............................................................................... 63APPENDIX 3 NCHMA CERTIFICATION.................................................................................... 64APPENDIX 4 ANALYST RESUMES ......................................................................................... 65APPENDIX 5 DCA CHECKLIST ............................................................................................... 67APPENDIX 6 RENTAL COMMUNITY PROFILES ....................................................................... 72
TABLES, FIGURES AND MAPS
Table 1 Detailed Unit Mix and Rents, Indian Creek Apartments ..................................................................................9Table 2 Unit Features and Community Amenities ......................................................................................................10Table 3 Key Facilities and Services..............................................................................................................................18Table 4 Population and Household Projections..........................................................................................................23Table 5 Persons per Household, Indian Creek Market Area .......................................................................................24Table 6 Building Permits by Structure Type, DeKalb County ......................................................................................24Table 7 Age Distribution .............................................................................................................................................25Table 8 Households by Household Type......................................................................................................................26Table 9 Households by Tenure...................................................................................................................................26Table 10 Renter Households by Age of Householder ................................................................................................27Table 11 Renter Households by Household Size .........................................................................................................27Table 12 Household Income ........................................................................................................................................28Table 13 Household Income by Tenure, Indian Creek Market Area............................................................................28Table 14 Rent Burdened and Substandard Housing, Indian Creek Market Area.........................................................29Table 15 Labor Force and Unemployment Rates........................................................................................................30Table 16 Commutation Data, Indian Creek Market Area ............................................................................................31Table 17 Major Employers, DeKalb / Metro Atlanta ..................................................................................................34Table 18 Recent Economic Expansions and Contractions, DeKalb County.................................................................36Table 19 Total and Renter Income Distribution..........................................................................................................37Table 20 LIHTC Income and Rent Limits, Atlanta-Sandy Springs-Roswell MSA ........................................................38Table 21 Affordability Analysis, Indian Creek Apartments .........................................................................................39Table 22 Overall Demand Estimates, Indian Creek Apartments................................................................................40Table 23 Demand Estimates by Floor Plan, Indian Creek Apartments ......................................................................41Table 24 Dwelling Units by Structure and Tenure ......................................................................................................42Table 25 Dwelling Units by Year Built and Tenure......................................................................................................43Table 26 Value of Owner Occupied Housing Stock......................................................................................................43Table 27 Rental Summary, Surveyed Communities.....................................................................................................45Table 28 Utility Arrangement and Unit Features.......................................................................................................46Table 29 Community Amenities ..................................................................................................................................47Table 30 Unit Distribution, Size, and Pricing................................................................................................................48Table 31 Average Rents, Comparable Properties ........................................................................................................49Table 32 Average Market Rent and Rent Advantage Summary .................................................................................49Table 33 Subsidized Communities, Indian Creek Market Area...................................................................................51Table 34 Foreclosure Data, ZIP Code 30032, June 2018.............................................................................................52
Figure 2 Views of Subject Site......................................................................................................................................12Figure 3 Satellite Image of Subject Site .......................................................................................................................13Figure 4 Views of Surrounding Land Uses ...................................................................................................................14
Indian Creek Apartments | Table of Contents
Page iv
Figure 5 At-Place Employment, DeKalb County..........................................................................................................32Figure 6 Total Employment by Sector.........................................................................................................................33Figure 7 Employment Change by Sector, 2011-2017..................................................................................................33Figure 8 Price Position .................................................................................................................................................56
Map 1 Site Location ....................................................................................................................................................11Map 2 Crime Index Map .............................................................................................................................................16Map 3 Location of Key Facilities and Services ............................................................................................................19Map 4 Indian Creek Market Area................................................................................................................................22Map 5 Major Employers, Metro Atlanta......................................................................................................................35Map 6 Surveyed Rental Communities ........................................................................................................................44Map 7 Subsidized Rental Communities ......................................................................................................................51
Indian Creek Apartments | Executive Summary
Page 1
1. EXECUTIVE SUMMARY
LGD Development has retained Real Property Research Group, Inc. (RPRG) to conduct acomprehensive market feasibility analysis for Indian Creek Apartments, a proposed new constructionrental community in Decatur, Georgia. As proposed, Indian Creek Apartments will be financed in partwith four percent Low Income Housing Tax Credits (LIHTC) from the Georgia Department ofCommunity Affairs (DCA). The following report, including the executive summary, is based on DCA’s2018 Market Study Manual.
1. Project Description
The subject site is in Decatur, Georgia, which is part of greater Atlanta. The subject siteis situated on the south side of Redan Road, roughly one-half mile west of Interstate 285and 12 miles east of downtown Atlanta. The physical address of the site is 3854 RedanRoad in Decatur, Georgia.
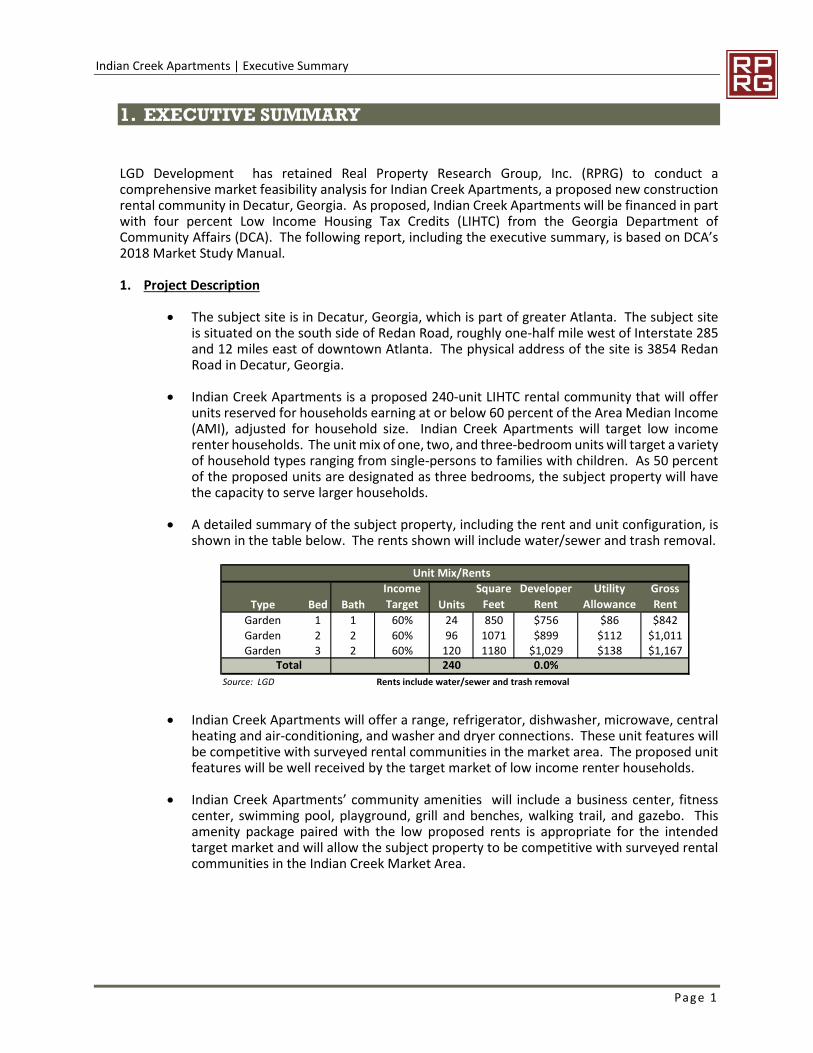
Indian Creek Apartments is a proposed 240-unit LIHTC rental community that will offerunits reserved for households earning at or below 60 percent of the Area Median Income(AMI), adjusted for household size. Indian Creek Apartments will target low incomerenter households. The unit mix of one, two, and three-bedroom units will target a varietyof household types ranging from single-persons to families with children. As 50 percentof the proposed units are designated as three bedrooms, the subject property will havethe capacity to serve larger households.
A detailed summary of the subject property, including the rent and unit configuration, isshown in the table below. The rents shown will include water/sewer and trash removal.
Indian Creek Apartments will offer a range, refrigerator, dishwasher, microwave, centralheating and air-conditioning, and washer and dryer connections. These unit features willbe competitive with surveyed rental communities in the market area. The proposed unitfeatures will be well received by the target market of low income renter households.
Indian Creek Apartments’ community amenities will include a business center, fitnesscenter, swimming pool, playground, grill and benches, walking trail, and gazebo. Thisamenity package paired with the low proposed rents is appropriate for the intendedtarget market and will allow the subject property to be competitive with surveyed rentalcommunities in the Indian Creek Market Area.
Unit Mix/Rents
Type Bed Bath
Income
Target Units
Square
Feet
Developer
Rent
Utility
Allowance
Gross
Rent
Garden 1 1 60% 24 850 $756 $86 $842
Garden 2 2 60% 96 1071 $899 $112 $1,011Garden 3 2 60% 120 1180 $1,029 $138 $1,167
Total 240 0.0%
Source: LGD Rents include water/sewer and trash removal

Indian Creek Apartments | Executive Summary
Page 2
2. Site Description / Evaluation:
The subject site is in Decatur, which is an established city with a population of 23,000 thatabuts the city limits of Atlanta. The subject site is roughly one-half mile west of Interstate 285and roughly 12 miles east of Downtown Atlanta.
Surrounding land uses include a mixture of residential, commercial, and light industrialdevelopment including old and new single-family detached homes, numerous multi-familyrental communities, townhomes, and warehouse/distribution facilities. Surrounding landuses are compatible with affordable rental housing development.
The subject site will be easily accessible and visible from an entrance on Redan Road, amoderately traveled two-lane roadway serving local residential and commercial traffic. Mostneighborhood amenities/services, shopping opportunities, and public transportation optionsare also easily accessible from the site.
The subject site’s crime risk is comparable to the densely developed areas along west ofInterstate 285, which contain majority of competing multi-family rental communities. Allother census tracts to the west and north of the subject site with lower Crime Risks consistalmost entirely of single-family detached homes. Based on this data, we do not expect crimeor the perception of crime to negatively impact the subject property’s marketability.
3. Market Area Definition
The Indian Creek Market Area consists of 26 census tracts located unincorporated DeKalbCounty, and in the cities of Clarkston, Scottdale, Avondale Estates, and Decatur. Theresidential neighborhoods throughout the Indian Creek Market Area share similarsurrounding land-use characteristics, accessibility from major thoroughfares, and contain themulti-family rental communities most likely to compete with the subject property. As such,we believe households living throughout the Indian Creek Market Area would consider IndianCreek Apartments as an acceptable shelter location.
The boundaries of the Indian Creek Market Area and their approximate distance from thesubject site are East Ponce de Leon and Church Street to the North (5.0 miles) ; SouthHarriston Road to the East (2.3 miles) ; Interstate 20 to the South (7.4 miles); and downtownDecatur/ State Highway 155 to the West (4.5 miles).
4. Community Demographic Data
The Indian Creek Market Area saw a contraction between the 2000 and 2010 Census counts,losing 1,251 people (-1.1 percent) and 173 households (-0.4 percent) per year. This trendreversed over the past eight years with population and household growth rates of 345 people(0.3 percent) and 171 households (0.4 percent) annually from 2010 to 2018. Esri projects themarket area will continue its steady growth with the addition of 830 people (0.8 percent) and342 households (0.8 percent) per year over the next two years. This will bring the populationin the market area to 110,597 and the household base to 40,988 in 2020.
The demographics of the Indian Creek Market Area are reflective of an urban neighborhoodwith a high renter percentage and modest median income.
o The two largest population cohorts in the market area are Adults age 35 to 44 (34.8percent) and Young Adults age 20 to 34 (22.6 percent).
Indian Creek Apartments | Executive Summary
Page 3
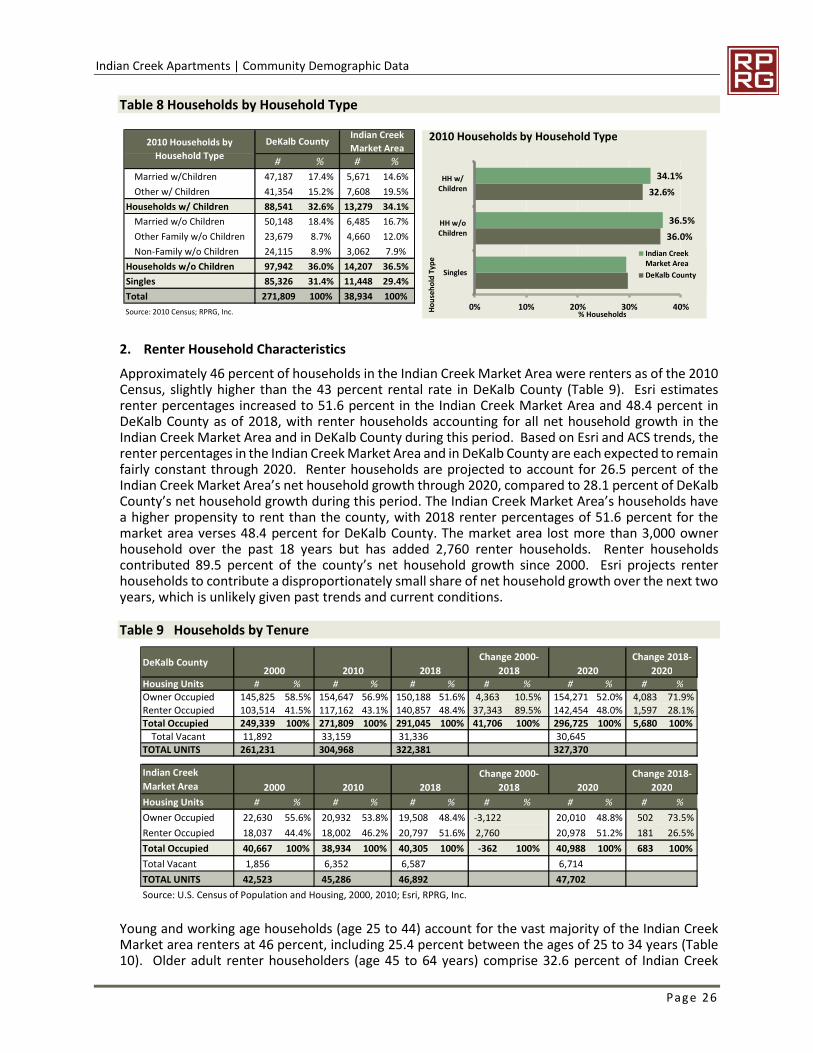
o As of the 2010 Census, the market area’s household base consisted of multi-personhouseholds without children (36.5 percent); households with children (34.1 percent);and singles (29.4 percent). These percentages were similar to rates in DeKalb County.
o Among renter households, young and working age households (age 25 to 44) accountfor most of the Indian Creek Market Area renters at 46 percent, including 25.4 percentwith ages of 25 to 34 years. Older adult renter householders (age 45 to 64 years)comprise 32.6 percent of Indian Creek Market Area renters. The Indian Creek MarketArea has a lower proportion of young adult renters age 25 to 34 (25.5 percent versus30.7 percent) and a larger proportion of older adult and senior renters age 55 andolder (28 percent versus 22 percent) relative to DeKalb County.
o As of the 2010 Census, more than half (55 percent) of renter households have one ortwo people. There are 45 percent of renter households with at least three people,including 17 percent with three people and 28 percent with four or more people.
o The Indian Creek Market Area’s households have a higher propensity to rent than thecounty with 2018 renter percentages of 51.6 percent and 48.4 percent. The marketarea lost more than 3,000 owner household over the past 18 years but has added2,760 renter households. Renter households contributed 89.5 percent of thecounty’s net household growth since 2000. Esri projects renter households tocontribute a disproportionately small share of net household growth over the nexttwo years, which is unlikely given past trends and current conditions.
o The Indian Creek Market Area’s 2018 median income of $45,512 was $8,324 (23.0percent) lower than the DeKalb County median of $59,141. By tenure, householdshad a median income of $34,659 among renters and median income of $61,073among owners. Over 6,252 renter households in the market area (30.1 percent) hadan annual income from $15,000 to $34,999, the approximate income target for thesubject property’s LIHTC units.
We do not believe foreclosed, abandoned, or vacant single/multi-family homes will impactthe subject property’s ability to lease its units given its affordable income target.
5. Economic Data:
The subject site is easily commutable to Downtown and Midtown Atlanta, both of which haveexperienced significant job growth over the past several years with continued growth expected. Thesite will benefit from proximity to employment concentrations and convenient access to majorthoroughfares and public transportation which expand accessibility to regional employmentconcentrations.
DeKalb County’s economy has steadily recovered from losses suffered during andimmediately following the national recession with the addition of more than 102,000 jobsover the past four years. The county’s unemployment rate fell to a ten-year low of 4.8 percentin 2017, which remains above state and national levels.
Strong job growth in DeKalb County is likely to continue over the next three to five years. Ofthe top 20 employers shown in Table 11, seven are in health care and two are in education.The 2017 average annual pay for the Education/Health sector in DeKalb County ($62,433) wassignificantly higher than comparable sector pay for the United States ($49,199), which willdraw workers to the area. Additionally, Atlanta continues to rank as a desirable place torelocate or start a business. The Atlanta Regional Commission projects employment in DeKalbCounty to increase from 400,230 workers in 2020 to 435,413 workers in 2030 to 468,335

Indian Creek Apartments | Executive Summary
Page 4
workers in 2040. This strong job growth will continue to drive housing demand in andthroughout DeKalb County.
Education-Health is the largest employment sector in DeKalb County, comprising 20.5 percentof all jobs in 2017 compared to 15.4 percent of jobs nationally. Trade-Transportation-Utilities,Professional – Business, and Government also each account for at least eleven percent of thecounty’s total employment. All but two sectors in DeKalb County added jobs from 2011 to2017 with the largest percentage gains in the Other (18.6 percent), Financial Activities (17.5percent), and Leisure-Hospitality (16.8 percent) sectors. DeKalb County saw a loss of 20.8percent in the National Resource/Mining sector, and a loss of 11.6 percent in the Governmentsector between 2011 and 2017.
6. Project Specific Affordability and Demand Analysis:
Indian Creek Apartments will offer 240 general occupancy rental units including 24 one-bedroom units, 96 two-bedroom units, and 120 three-bedroom units. All units will be rentand income restricted through the LIHTC program and target households earning up 60percent of the AMI.
The 60 percent AMI LIHTC units will target renter householders earning between $28,869 and$46,680. The proposed units would need to capture 5.8 percent of the 4,151 income-qualifiedrenter households to lease-up.
Based on DCA methodology, total net demand for all 240 proposed units in the Indian CreekMarket Area is 2,063 which results in a capture rate of 10.4 percent Capture rates by floorplan are 3.3 percent for one-bedroom units, 14.2 percent for two-bedroom units; and 29.5percent for three-bedroom units.
All capture rates are below DCA thresholds and indicate sufficient demand in the market areato support the proposed Indian Creek Apartments.
7. Competitive Rental Analysis
RPRG surveyed 18 rental communities in the Indian Creek Market Area including five LIHTC generaloccupancy communities.
Surveyed rental communities in the market area had an aggregate stabilized vacancy rate of3.6 percent. The five LIHTC community subset was also performing well, with an aggregatevacancy rate of just 2.6 percent.
Average effective rents among surveyed communities (including incentives, water/sewer, andtrash removal) were:
o One-bedroom units in the market area had an average effective rent of $741 with anaverage unit size of 727 square feet and an average rent per square foot of $1.02.
o Two-bedroom units in the market area had an average effective rent of $849 with anaverage unit size of 985 square feet and an average rent per square foot of $0.86.
o Three-bedroom units in the market area had an average effective rent of $1,075 withan average unit size of 1,277 square feet and an average rent per square foot of $0.84.
To determine average “market rents” as outlined in DCA’s 2018 Market Study Manual, marketrate rents were averaged at the most comparable communities to the proposed Indian CreekApartments. The “average market rent” is $868 for one-bedroom units, $1,007 for two-bedroom units, and $1,155 for three-bedroom units. The subject property’s proposed 60
Indian Creek Apartments | Executive Summary
Page 5
percent AMI rents are all below these averages and the project has a weighted averagemarket advantage of 11.0 percent.
RPRG identified five pipeline rental communities in the Indian Creek Market Area. Three willbe market rate or senior-restricted and are unlikely to directly compete with the subjectproperty. The fourth is a recent acquisition of vacant land that has been rezoned for 101multi-family units with no additional information available. One of the pipeline communitiesis a comparable 252-unit four percent LIHTC community proposed by the subjectdevelopment. This community has received initial approval from the county, but is consideredlong term given the current status of the LIHTC allocation (not applied).
8. Absorption/Stabilization Estimates
Based on projected renter household growth, the number of income-qualified renterhouseholds projected in the market area, low affordability and demand capture rates, rentalmarket conditions, and the marketability of the proposed site and product, we conservativelyestimate Indian Creek Apartments will lease-up at a rate of at least 18 units per month. Atthis rate, the subject property will reach a stabilized occupancy of at least 93 percent within13 months.
As the subject property will be new construction in the Indian Creek Market Area, it will havefew direct competitors serving general occupancy tenants. Taking this into considerationalong with strong projected household growth, low vacancy rates among surveyed rentalcommunities in the market area, and low affordability and DCA demand capture rates, we donot expect Indian Creek Apartments to have negative impact on existing or pipeline rentalcommunities in the Indian Creek Market Area.
9. Overall Conclusion / Recommendation
Based on projected renter household growth, low affordability and demand capture rates,and strong rental market conditions, sufficient demand exists to support the proposed unitsat Indian Creek Apartments. As such, RPRG believes that the proposed Indian CreekApartments will be able to successfully reach and maintain a stabilized occupancy of at least93 percent following its entrance into the rental market. The subject property will becompetitively positioned with existing LIHTC and market rate communities in the Indian CreekMarket Area and will offer a newly constructed, affordable rental alternative that does notcurrently exist in the market. We recommend proceeding with the project as planned.
The proposed development of Indian Creek Apartments will not have a negative impact onexisting or proposed general occupancy LIHTC communities in the market area.
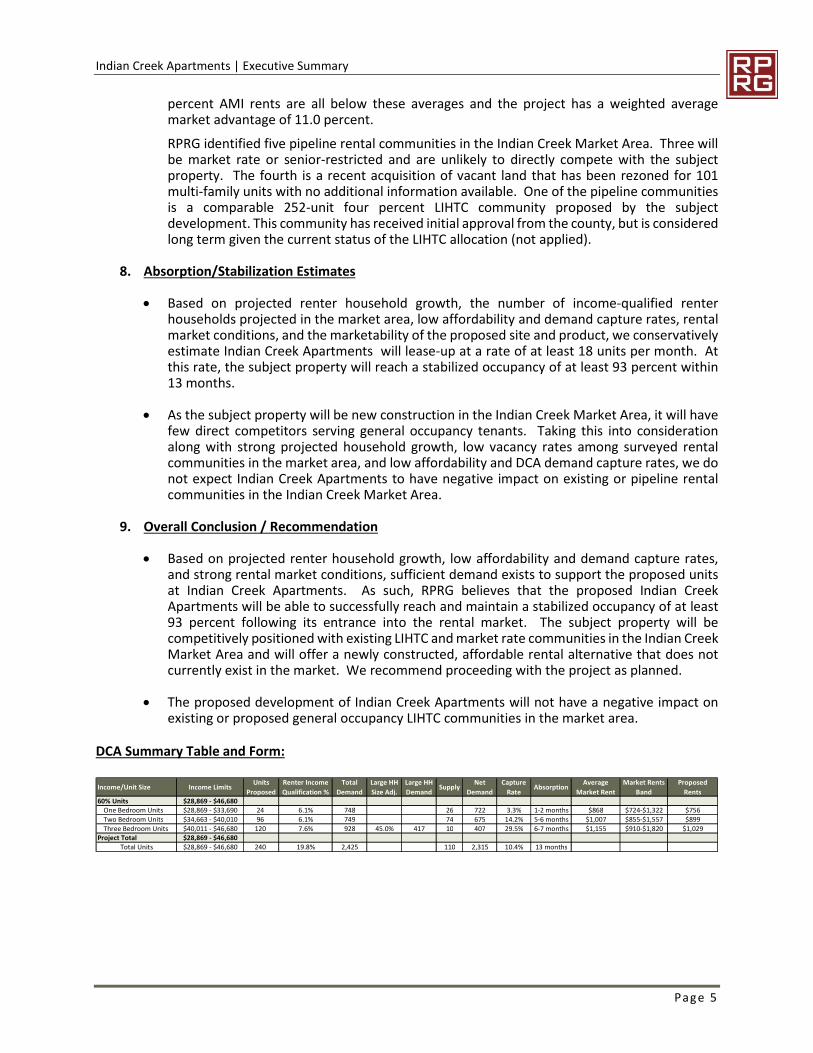
DCA Summary Table and Form:
Income/Unit Size Income LimitsUnits
Proposed
Renter Income
Qualification %
Total
Demand
Large HH
Size Adj.
Large HH
DemandSupply
Net
Demand
Capture
RateAbsorption
Average
Market Rent
Market Rents
Band
Proposed
Rents60% Units $28,869 - $46,680
One Bedroom Units $28,869 - $33,690 24 6.1% 748 26 722 3.3% 1-2 months $868 $724-$1,322 $756Two Bedroom Units $34,663 - $40,010 96 6.1% 749 74 675 14.2% 5-6 months $1,007 $855-$1,557 $899Three Bedroom Units $40,011 - $46,680 120 7.6% 928 45.0% 417 10 407 29.5% 6-7 months $1,155 $910-$1,820 $1,029
Project Total $28,869 - $46,680Total Units $28,869 - $46,680 240 19.8% 2,425 110 2,315 10.4% 13 months

Indian Creek Apartments | Executive Summary
Page 6
SUMMARY TABLE:
DevelopmentName:
Indian Creek ApartmentsTotal # Units: 240
Location: Redan Road & Holcomb Road , DeKalb County, GA # LIHTC Units: 240
PMA Boundary:North:E Ponce de Leon Rd / Church Street, South: I-20, East: S Harriston Rd.West: State Highway 155 /Downtown Decatur
Farthest Boundary Distance to Subject: 7.4 miles
RENTALHOUSINGSTOCK– (found onpages11, 49, 52-53)Type # Properties Total Units Vacant Units Average
Occupancy
All Rental Housing 18 3,367 118 96.4%
Market -Rate Housing 13 3,254 88 97.3%
Assisted/Subsidized Housing not toinclude LIHTC
LIHTC 5 1,136 30 97.4%
Stabilized Comps 18 3,367 118 96.4%
Properties in construction & lease up NAP NAP NAP
Subject Development AverageMarket Rent Highest U nadjustedComp Rent
#Units
#Bedrooms
#Baths Size (SF)
ProposedTenant Rent
Per Unit Per SF Advantage Per Unit Per SF
24 1 1 850 $756 $868 $1.16 12.9% $1,322 $1.54
96 2 2 1,070 $899 $1,007 $1.02 10.7% $1,557 $1.31
120 3 2 1,180 $1,029 $1,155 $0.92 10.9% $1,820 $1.32
DEMOGRAPHICDATA (found onpages29, 41)2014 2019 2021
Renter Households 20,418 52.4% 20,888 51.4% 21,066 51.0%
Income -Qualified Renter HHs (LIHTC) 4,097 20.1% 4,145 19.8% 4,155 19.7%
Income -Qual ified Renter HHs (MR)
TARGETEDINCOME-QUALIFIEDRENTERHOUSEHOLDDEMAND(found on page 43)
Type of Demand 50% 60% 80% OverallRenter Household Growth 70 70
Existing Households (Overburd + Substand) 2,355 2,355
Homeowner Conversion (Seniors ) - -
Secondary Market Demand (10 %) - -
Total Primary Market Demand 2,425 2,425
Less Comparable/Competitive Supply 110 110
Adjusted Income -qualified Renter HHs 2,315 2,315
CAPTURERATES (found on page 43)Targeted Population 50% 60% 80% Overall
Capture Rate 10.4% 10.4%
Indian Creek Apartments | Introduction
Page 7
2. INTRODUCTION
A. Overview of Subject
The subject of this report is Indian Creek Apartments, a proposed multi-family rental community inDecatur, DeKalb County, Georgia. Indian Creek Apartments will offer 240 newly constructed rentalunits financed in part by four percent Low Income Housing Tax Credits (LIHTC) allocated by theGeorgia Department of Community Affairs (DCA). All units will benefit from tax credits and will bereserved for households earning up to 60 percent of the Area Median Income (AMI), adjusted forhousehold size.
B. Purpose of Report
The purpose of this market study is to perform a market feasibility analysis through an examinationof the economic context, a demographic analysis of the defined market area, a competitive housinganalysis, a derivation of demand, and an affordability analysis.
C. Format of Report
The report format is comprehensive and conforms to DCA’s 2018 Market Study Manual and 2018Qualified Allocation Plan (QAP). The market study also considered the National Council of HousingMarket Analysts’ (NCHMA) recommended Model Content Standards and Market Study Index.
D. Client, Intended User, and Intended Use
The Client is LGD Development (Developer). Along with the Client, the Intended Users are DCA,potential lenders, and investors.
E. Applicable Requirements
This market study is intended to conform to the requirements of the following:
DCA’s 2018 Market Study Manual and Qualified Allocation Plan (QAP). The National Council of Housing Market Analysts’ (NCHMA) Recommended Model Content.
F. Scope of Work
To determine the appropriate scope of work for the assignment, we considered the intended use ofthe market study, the needs of the user, the complexity of the property, and other pertinent factors.Our concluded scope of work is described below:
Please refer to Appendix 5 for a detailed list of DCA requirements as well as the correspondingpages of requirements within the report.
Leslie Burke (Senior Analyst) conducted a site visit on August 6, 2018.
Primary information gathered through field and phone interviews was used throughout thevarious sections of this report. The interviewees included rental community propertymanagers and planning/development officials with DeKalb County and the cities of Decatur,Avondale Estates, and Clarkston.
All pertinent information obtained was incorporated in the appropriate section(s) of thisreport.
Indian Creek Apartments | Introduction
Page 8
G. Report Limitations
The conclusions reached in a market assessment are inherently subjective and should not be reliedupon as a determinative predictor of results that will actually occur in the marketplace. There can beno assurance that the estimates made or assumptions employed in preparing this report will in factbe realized or that other methods or assumptions might not be appropriate. The conclusionsexpressed in this report are as of the date of this report, and an analysis conducted as of another datemay require different conclusions. The actual results achieved will depend on a variety of factors,including the performance of management, the impact of changes in general and local economicconditions, and the absence of material changes in the regulatory or competitive environment.Reference is made to the statement of Underlying Assumptions and Limiting Conditions contained inAppendix I of this report.
Indian Creek Apartments | Project Description
Page 9
3. PROJECT DESCRIPTION
A. Project Overview
Indian Creek Apartments is a proposed 240-unit mixed-income rental community that will be fundedin part by Low Income Housing Tax Credits. All units are reserved for households earning at or below60 percent of the Area Median Income (AMI), adjusted for household size.
B. Project Type and Target Market
Indian Creek Apartments will target low income renter households. The unit mix of one, two, andthree-bedroom units will target a variety of household types ranging from single-persons to familieswith children. As 50 percent of the proposed units will have three bedrooms, the subject propertywill have the capacity to serve larger households.
C. Building Types and Placement
Indian Creek Apartments will be a three-story garden style complex on approximately 17 acres, with10 residential buildings and surface parking. Construction will include a masonry and HardiPlanksiding exterior.
D. Detailed Project Description
1. Project Description
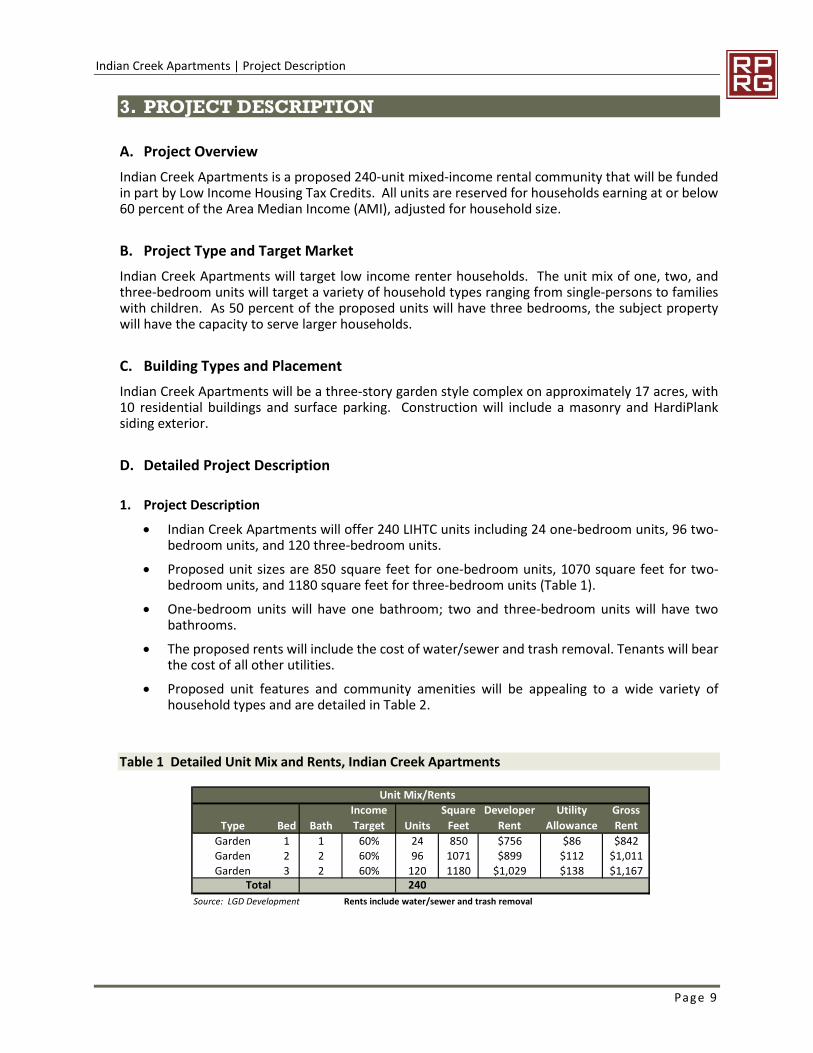
Indian Creek Apartments will offer 240 LIHTC units including 24 one-bedroom units, 96 two-bedroom units, and 120 three-bedroom units.
Proposed unit sizes are 850 square feet for one-bedroom units, 1070 square feet for two-bedroom units, and 1180 square feet for three-bedroom units (Table 1).
One-bedroom units will have one bathroom; two and three-bedroom units will have twobathrooms.
The proposed rents will include the cost of water/sewer and trash removal. Tenants will bearthe cost of all other utilities.
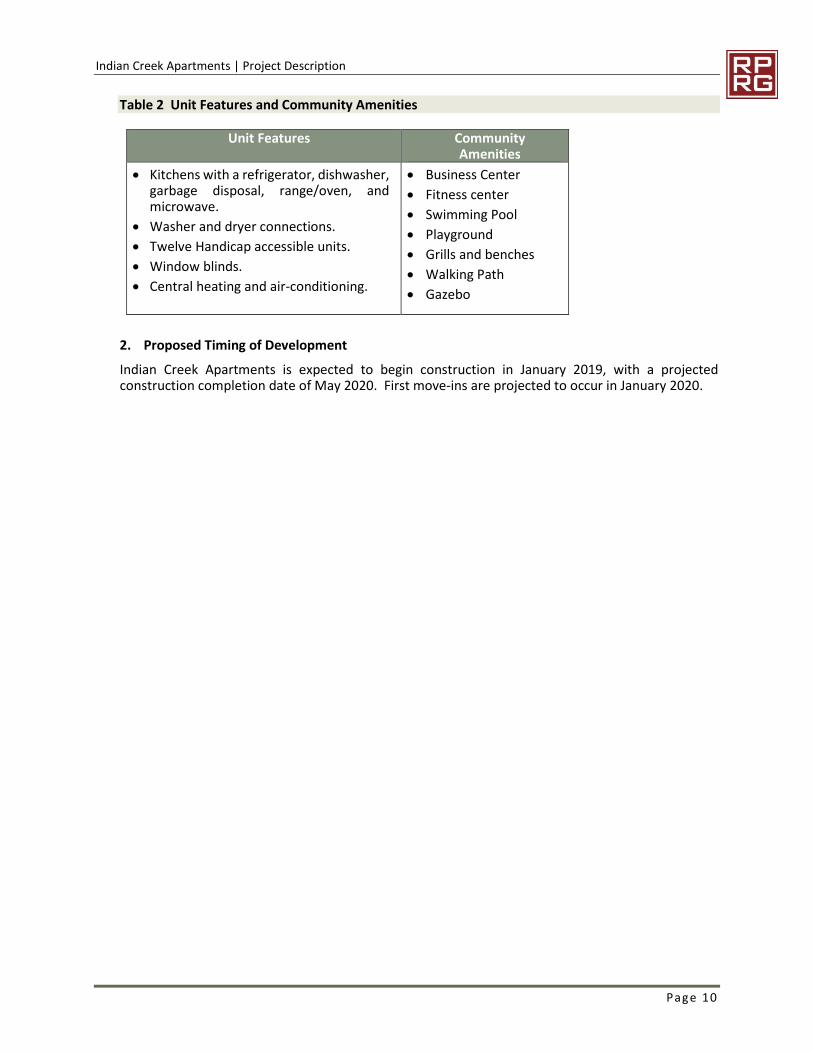
Proposed unit features and community amenities will be appealing to a wide variety ofhousehold types and are detailed in Table 2.
Table 1 Detailed Unit Mix and Rents, Indian Creek Apartments
Unit Mix/Rents
Type Bed Bath
Income
Target Units
Square
Feet
Developer
Rent
Utility
Allowance
Gross
Rent
Garden 1 1 60% 24 850 $756 $86 $842Garden 2 2 60% 96 1071 $899 $112 $1,011
Garden 3 2 60% 120 1180 $1,029 $138 $1,167Total 240
Source: LGD Development Rents include water/sewer and trash removal
Indian Creek Apartments | Project Description
Page 10
Table 2 Unit Features and Community Amenities
Unit Features CommunityAmenities
Kitchens with a refrigerator, dishwasher,garbage disposal, range/oven, andmicrowave.
Washer and dryer connections.
Twelve Handicap accessible units.
Window blinds.
Central heating and air-conditioning.
Business Center
Fitness center
Swimming Pool
Playground
Grills and benches
Walking Path
Gazebo
2. Proposed Timing of Development
Indian Creek Apartments is expected to begin construction in January 2019, with a projectedconstruction completion date of May 2020. First move-ins are projected to occur in January 2020.
Indian Creek Apartments | Site Evaluation
Page 11
4. SITE EVALUATION
A. Site Analysis
1. Site Location
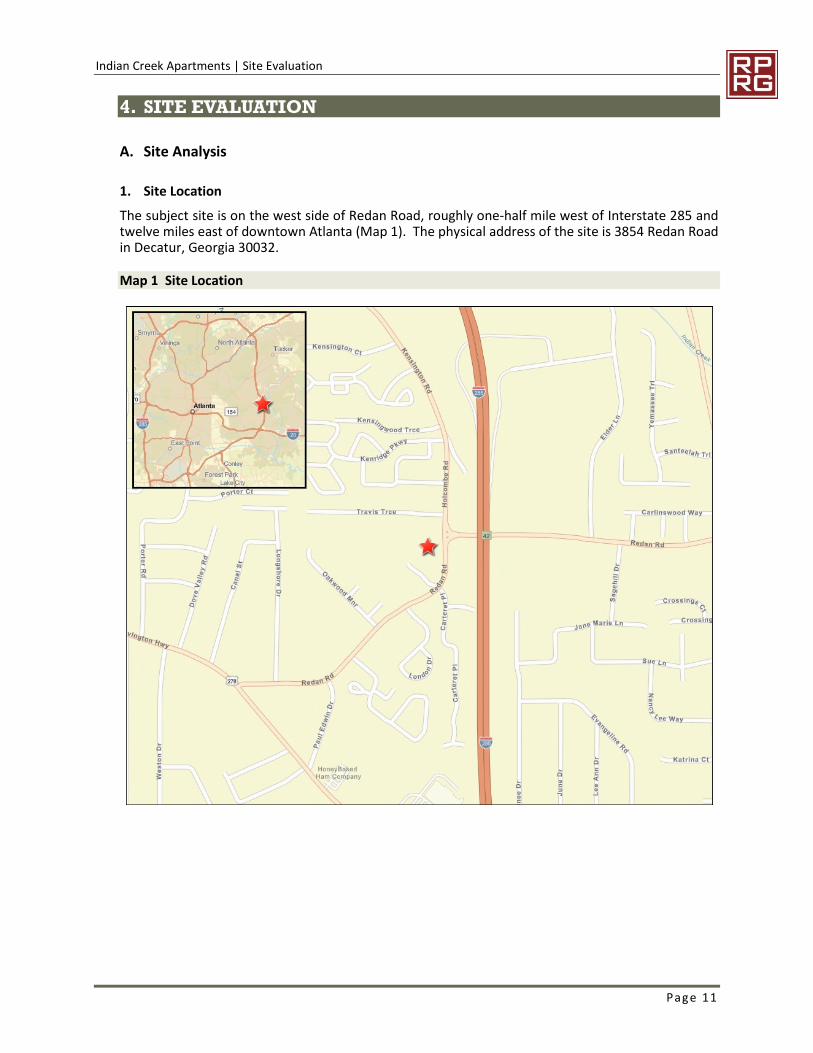
The subject site is on the west side of Redan Road, roughly one-half mile west of Interstate 285 andtwelve miles east of downtown Atlanta (Map 1). The physical address of the site is 3854 Redan Roadin Decatur, Georgia 30032.
Map 1 Site Location
Indian Creek Apartments | Site Evaluation
Page 12
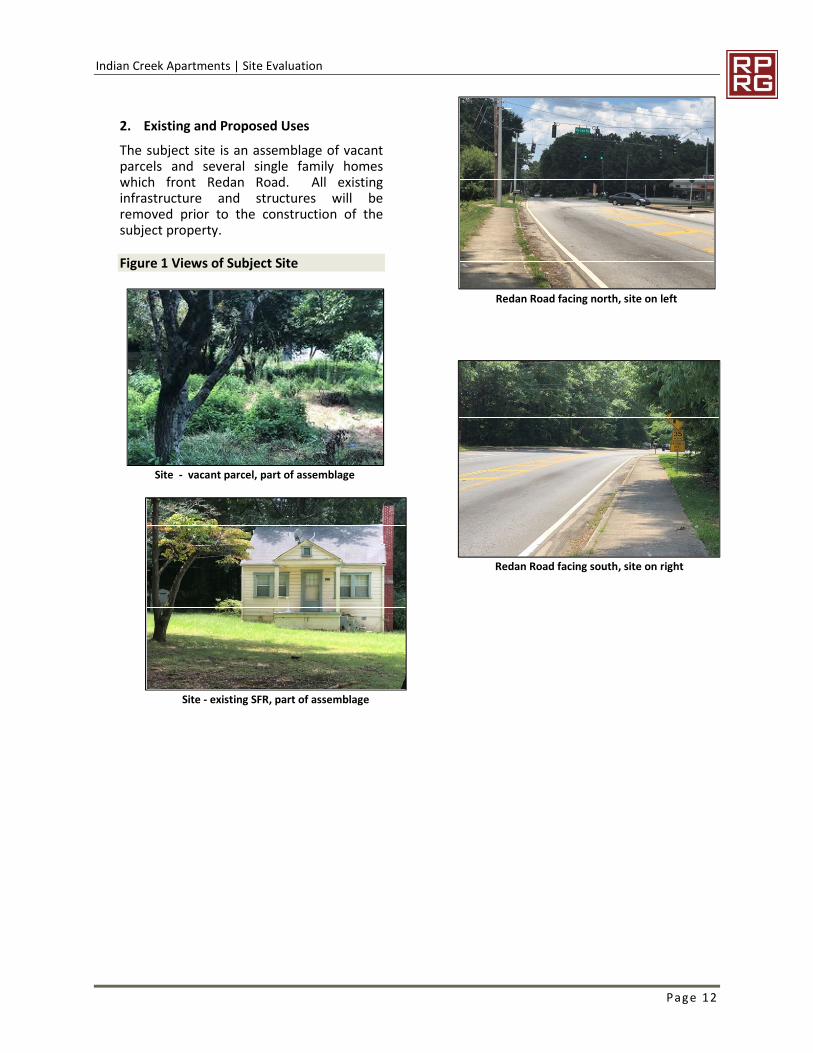
2. Existing and Proposed Uses
The subject site is an assemblage of vacantparcels and several single family homeswhich front Redan Road. All existinginfrastructure and structures will beremoved prior to the construction of thesubject property.
Figure 1 Views of Subject Site
Site - vacant parcel, part of assemblage
Site - existing SFR, part of assemblage
Redan Road facing north, site on left
Redan Road facing south, site on right
Indian Creek Apartments | Site Evaluation
Page 13
3. General Description of Land Uses Surrounding the Subject Site
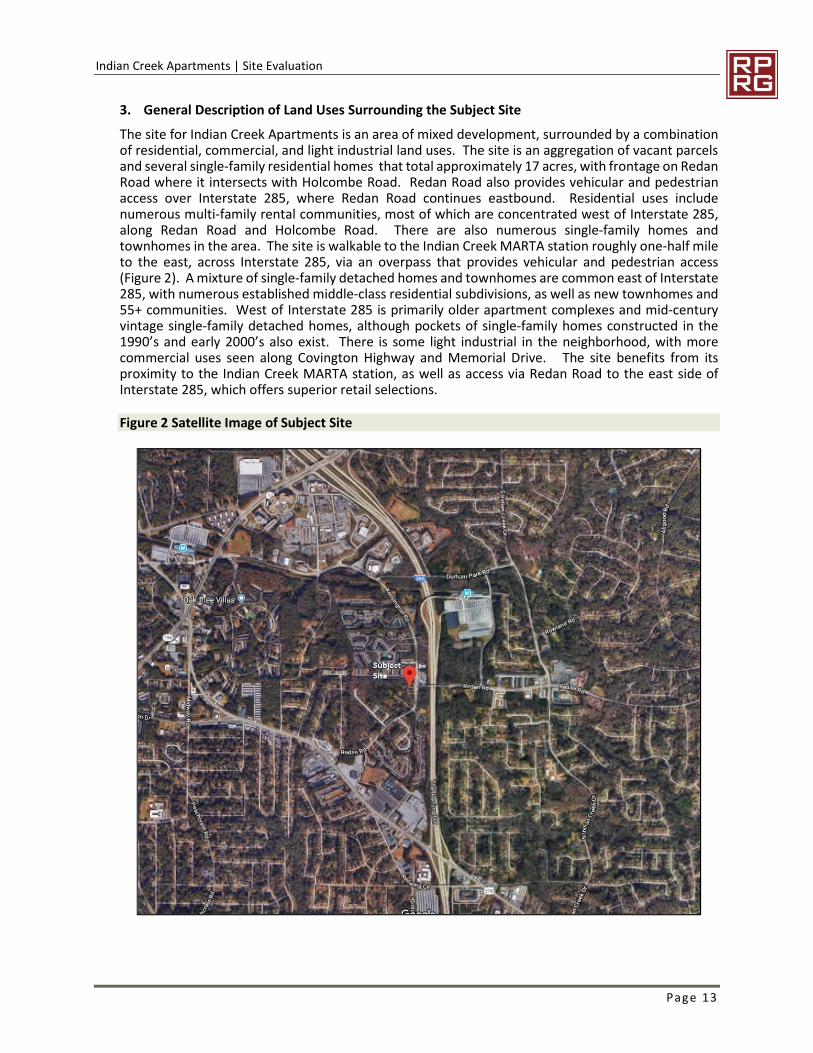
The site for Indian Creek Apartments is an area of mixed development, surrounded by a combinationof residential, commercial, and light industrial land uses. The site is an aggregation of vacant parcelsand several single-family residential homes that total approximately 17 acres, with frontage on RedanRoad where it intersects with Holcombe Road. Redan Road also provides vehicular and pedestrianaccess over Interstate 285, where Redan Road continues eastbound. Residential uses includenumerous multi-family rental communities, most of which are concentrated west of Interstate 285,along Redan Road and Holcombe Road. There are also numerous single-family homes andtownhomes in the area. The site is walkable to the Indian Creek MARTA station roughly one-half mileto the east, across Interstate 285, via an overpass that provides vehicular and pedestrian access(Figure 2). A mixture of single-family detached homes and townhomes are common east of Interstate285, with numerous established middle-class residential subdivisions, as well as new townhomes and55+ communities. West of Interstate 285 is primarily older apartment complexes and mid-centuryvintage single-family detached homes, although pockets of single-family homes constructed in the1990’s and early 2000’s also exist. There is some light industrial in the neighborhood, with morecommercial uses seen along Covington Highway and Memorial Drive. The site benefits from itsproximity to the Indian Creek MARTA station, as well as access via Redan Road to the east side ofInterstate 285, which offers superior retail selections.
Figure 2 Satellite Image of Subject Site
Indian Creek Apartments | Site Evaluation
Page 14
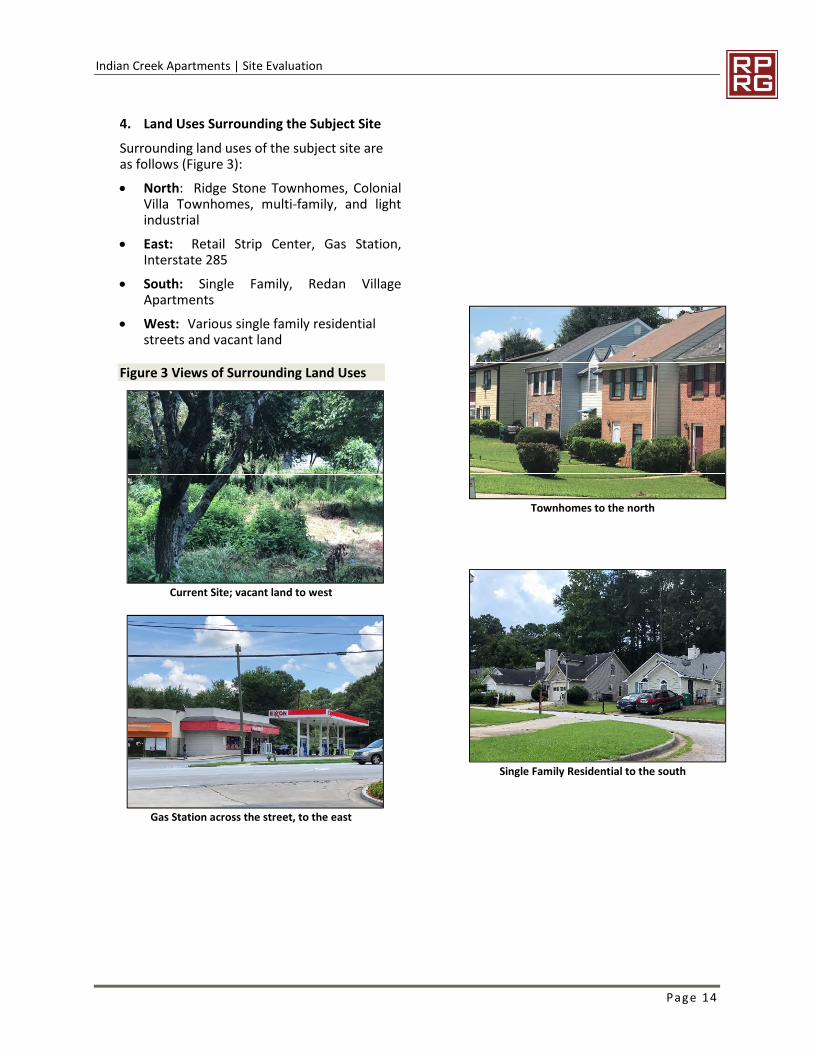
4. Land Uses Surrounding the Subject Site
Surrounding land uses of the subject site areas follows (Figure 3):
North: Ridge Stone Townhomes, ColonialVilla Townhomes, multi-family, and lightindustrial
East: Retail Strip Center, Gas Station,Interstate 285
South: Single Family, Redan VillageApartments
West: Various single family residentialstreets and vacant land
Figure 3 Views of Surrounding Land Uses
Current Site; vacant land to west
Gas Station across the street, to the east
Townhomes to the north
Single Family Residential to the south
Indian Creek Apartments | Site Evaluation
Page 15
B. Neighborhood Analysis
1. General Description of Neighborhood
The subject site is in east greater Atlanta, just immediately inside Interstate 285, on the most easternedge of the city limits of Decatur. Decatur has long been desirable due to its in-town location andproximity to employment centers in the Emory University area, as well as Midtown and DowntownAtlanta. Decatur has seen a boom in new, higher-end residential housing in the last five years, asolder structures have been demolished or gut-rehabbed, and denser housing built. HistoricDowntown Decatur is built on a square and is home to numerous shops, galleries, and restaurants.Festivals throughout the year are held on the square, and Decatur has become known as one of themost “walkable” and desirable areas of Atlanta. While the subject site technically has a Decaturaddress, its location on the far eastern edge of Decatur’s boundary places it too far away to takeadvantage of downtown Decatur’s attributes. The downtown Decatur area lies outside the subject’sPMA and reflects a different demographic. The subject site is situated in a “circle” formed by majorthoroughfares including Interstate 285 to the east; Covington Highway to the south; and MemorialDrive to the west and north. Inside this circle is a mixture of residential, industrial, and commercialuses. Residential uses include numerous (both subsidized and market rate) multi-family apartments,single family homes constructed primarily in the 1950’s and 1960’s, and pockets of newer single-family homes and townhomes built in the 1990’s and early 2000’s. Across Interstate 285 from thesubject site is the city of Stone Mountain. Housing on the Stone Mountain side of Interstate 285 islaid out in newer, larger residential subdivisions. Additionally, townhomes and active 55+ adultcommunities have been recently built, and retail options are more prevalent. The subject site enjoysdirect access to Stone Mountain via the Redan Road overpass on Interstate 285.
2. Neighborhood Planning Activities
The two most notable development projects in the immediate vicinity are two affordable projects:Phase II of Manor at Indian Creek, which will exclusively serve low-income seniors, is underconstruction in nearby Stone Mountain and is one mile from the subject site. A 218-unit generaloccupancy apartment complex financed with 4 percent LIHTC is being proposed for a site adjacent tothe Kensington MARTA station, approximately two miles from the subject site. A detailed overviewof upcoming multi-family rental development near the subject site is provided in the multi-familypipeline section of this report on page 49.
3. Public Safety
CrimeRisk is a census tract level index that measures the relative risk of crime compared to a nationalaverage. AGS analyzes known socio-economic indicators for local jurisdictions that report crimestatistics to the FBI under the Uniform Crime Reports (UCR) program. An index of 100 reflects a totalcrime risk on par with the national average, with values below 100 reflecting below average risk andvalues above 100 reflecting above average risk. Based on detailed modeling of these relationships,CrimeRisk provides a detailed view of the risk of total crime as well as specific crime types at thecensus tract level. In accordance with the reporting procedures used in the UCR reports, aggregateindexes have been prepared for personal and property crimes separately as well as a totalindex. However, it must be recognized that these are un-weighted indexes, in that a murder isweighted no more heavily than purse snatching in this computation. The analysis provides a usefulmeasure of the relative overall crime risk in an area but should be used in conjunction with othermeasures.
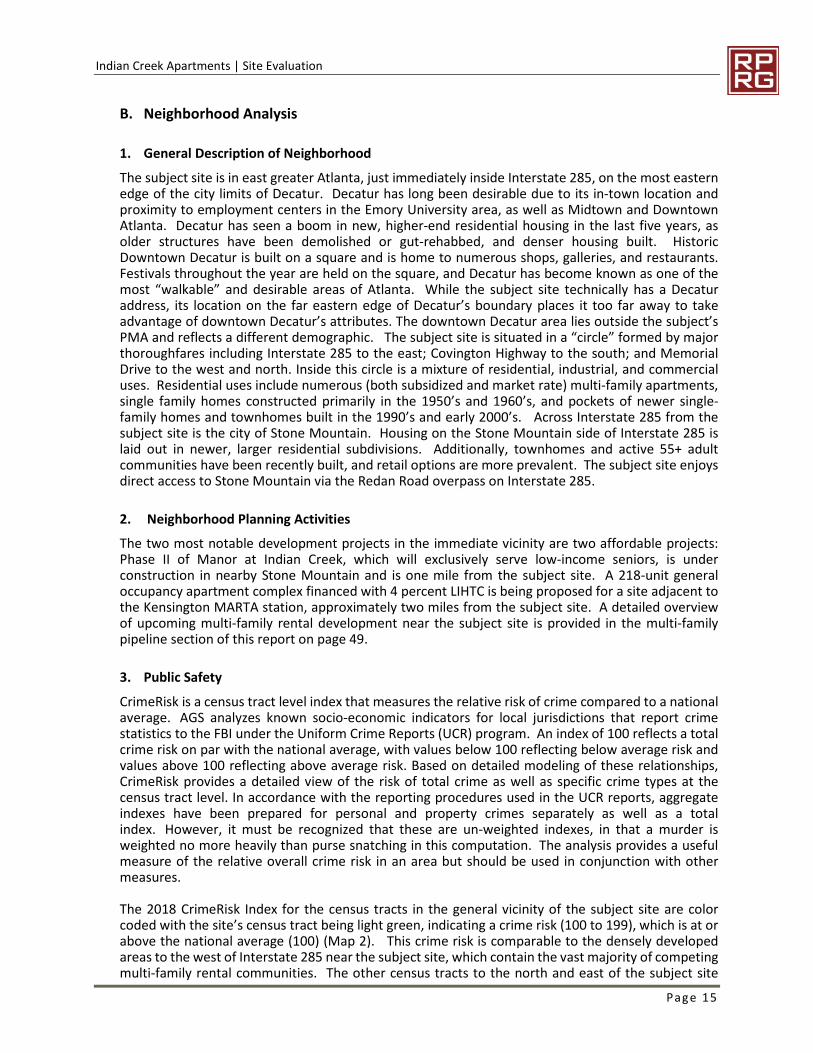
The 2018 CrimeRisk Index for the census tracts in the general vicinity of the subject site are colorcoded with the site’s census tract being light green, indicating a crime risk (100 to 199), which is at orabove the national average (100) (Map 2). This crime risk is comparable to the densely developedareas to the west of Interstate 285 near the subject site, which contain the vast majority of competingmulti-family rental communities. The other census tracts to the north and east of the subject site
Indian Creek Apartments | Site Evaluation
Page 16
with lower Crime Risks consist almost entirely of single-family detached homes. Based on this dataand our field research, we do not expect crime or the perception of crime to negatively impact thesubject property’s marketability.
Map 2 Crime Index Map
C. Site Visibility and Accessibility
1. Visibility
Indian Creek Apartments will have ample visibility from Redan Road, a moderately traveled two-laneroad that connects both sides of Interstate 285 and serves a variety of residential and commercialtraffic. The subject property will also benefit from traffic generated by nearby land uses, includingmultiple existing apartment complexes located along Redan Road and Holcombe Road, as well as theIndian Creek MARTA (rail and bus) station.
2. Vehicular Access
Indian Creek Apartments will be accessible from an entrance on Redan Road, which typicallyexperiences moderate traffic throughout the day. Traffic lights at Redan Road’s intersection withHolcombe Road to the north manage traffic flow in front of the site. RPRG does not anticipateproblems with ingress or egress to/from the subject site.
3. Availability of Public Transit
The Metropolitan Atlanta Rapid Transit Authority (MARTA) is the major provider of mass transit inMetro Atlanta. MARTA provides both fixed-route bus service and a heavy rail system travelingthroughout Fulton and DeKalb Counties. Indian Creek Apartments will be located within one-half mile
Indian Creek Apartments | Site Evaluation
Page 17
of the Indian Creek bus and rail station, which is accessible via car or a pedestrian walkway thattraverses Interstate 285 immediately east of the subject site. The Indian Creek MARTA station isserved by the 111, 115, 116, and 119 bus routes and is located along the Blue rail line, which travelseast to west inside the Atlanta perimeter (Interstate 285). Most major employment nodes can bereached from one of these public transportation options, including downtown Atlanta, Midtown,Buckhead, Pill Hill Medical Complex, Perimeter Center, and Hartsfield-Jackson International Airport.
4. Availability of Inter-Regional Transit
From a regional perspective, the subject site is convenient to numerous major thoroughfares includingInterstate 285, Interstate 75/85, Interstate 20, State Route 400, Stone Mountain Freeway, CovingtonHighway, and U.S. Highway 29 within five miles. From Memorial Drive and Covington Highway, thecities of Decatur, Clarkston, Avondale Estates, and Atlanta can all be reached within seven miles. Theclosest major airport to Indian Creek Apartments is Hartsfield-Jackson International Airport,approximately ten miles to the west.
5. Accessibility Improvements under Construction and Planned
Roadway Improvements under Construction and Planned
RPRG reviewed information from local stakeholders to assess whether any capital improvementprojects affecting road, transit, or pedestrian access to the subject site are currently underway orlikely to commence within the next few years. Observations made during the site visit contributed tothis process. Through this research, RPRG did not identify any major roadway improvements thatwould have a direct impact on the site.
Transit and Other Improvements under Construction and/or Planned
A Clifton Corridor Transit Initiative is proposed that would link the Lindbergh (Red and Gold lines) andAvondale (Blue line) MARTA rail stations, which will allow MARTA to serve the large employmentconcentration in and around Emory University, which includes the Centers for Disease Control, EmoryUniversity Hospital, Children’s Healthcare of Atlanta, and the Atlanta VA Hospital. The proposedcorridor is currently in the planning stages and has not been finalized or approved; however, assumingthe project continues to move forward, its projected placed-in-service year is 2025. While the subjectsite is already convenient to both bus and rail public transportation options, the construction of theClifton corridor would further enhance the subject site’s location on the Blue line MARTA rail.
6. Environmental Concerns
RPRG did not identify any visible environmental site concerns.
D. Residential Support Network
1. Key Facilities and Services near the Subject Site
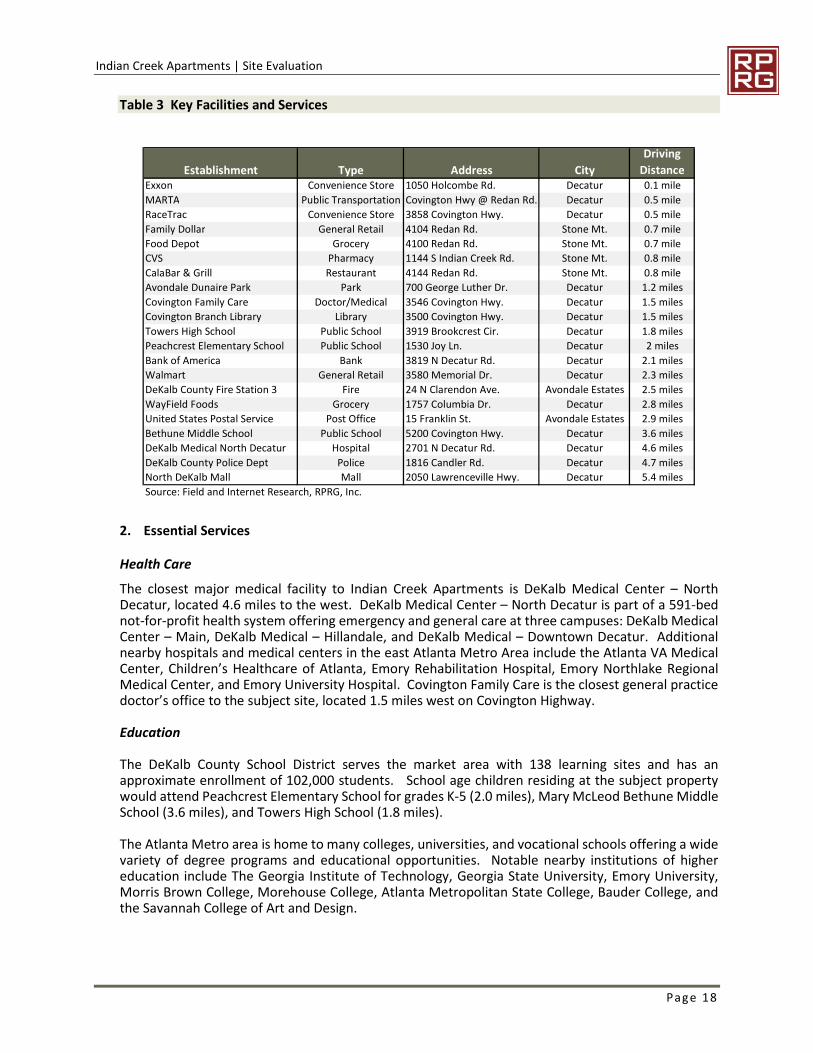
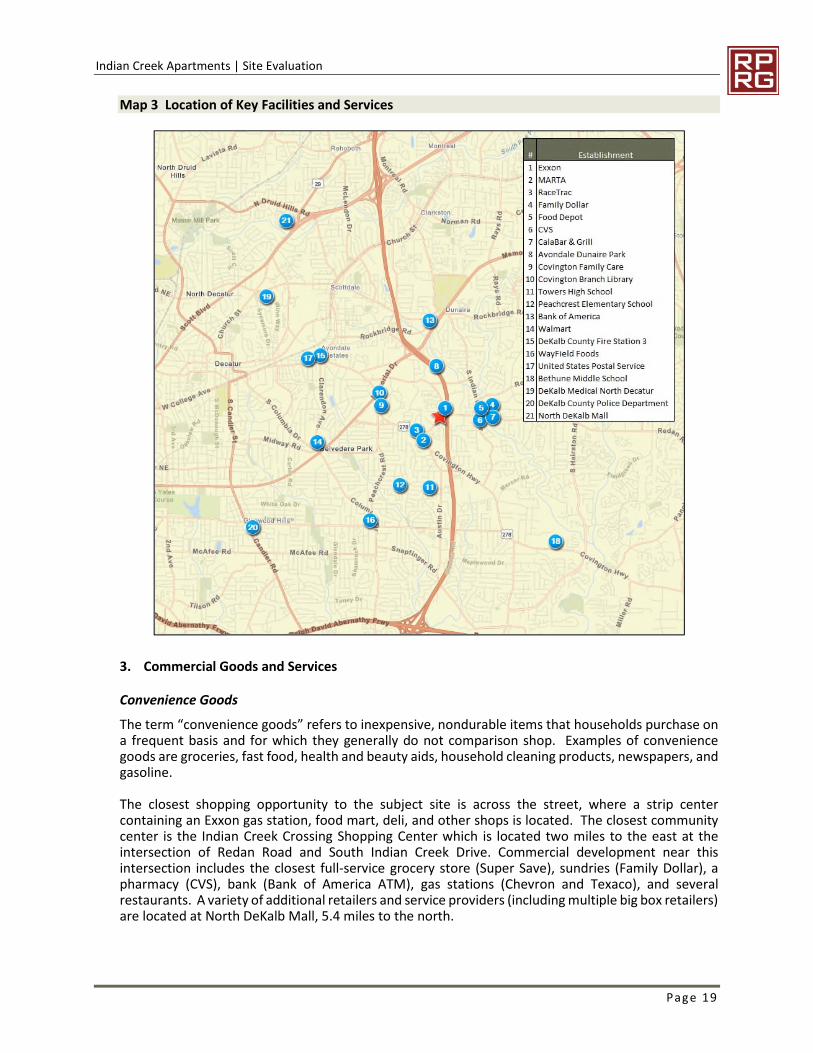
The appeal of any given community is often based in part to its proximity to those facilities andservices required daily. Key facilities and services and their distances from the subject site are listedin Table 3 and their locations are plotted on Map 3.
Indian Creek Apartments | Site Evaluation
Page 18
Table 3 Key Facilities and Services
2. Essential Services
Health Care
The closest major medical facility to Indian Creek Apartments is DeKalb Medical Center – NorthDecatur, located 4.6 miles to the west. DeKalb Medical Center – North Decatur is part of a 591-bednot-for-profit health system offering emergency and general care at three campuses: DeKalb MedicalCenter – Main, DeKalb Medical – Hillandale, and DeKalb Medical – Downtown Decatur. Additionalnearby hospitals and medical centers in the east Atlanta Metro Area include the Atlanta VA MedicalCenter, Children’s Healthcare of Atlanta, Emory Rehabilitation Hospital, Emory Northlake RegionalMedical Center, and Emory University Hospital. Covington Family Care is the closest general practicedoctor’s office to the subject site, located 1.5 miles west on Covington Highway.
Education
The DeKalb County School District serves the market area with 138 learning sites and has anapproximate enrollment of 102,000 students. School age children residing at the subject propertywould attend Peachcrest Elementary School for grades K-5 (2.0 miles), Mary McLeod Bethune MiddleSchool (3.6 miles), and Towers High School (1.8 miles).
The Atlanta Metro area is home to many colleges, universities, and vocational schools offering a widevariety of degree programs and educational opportunities. Notable nearby institutions of highereducation include The Georgia Institute of Technology, Georgia State University, Emory University,Morris Brown College, Morehouse College, Atlanta Metropolitan State College, Bauder College, andthe Savannah College of Art and Design.
Establishment Type Address City
Driving
DistanceExxon Convenience Store 1050 Holcombe Rd. Decatur 0.1 mile
MARTA Public Transportation Covington Hwy @ Redan Rd. Decatur 0.5 mile
RaceTrac Convenience Store 3858 Covington Hwy. Decatur 0.5 mile
Family Dollar General Retail 4104 Redan Rd. Stone Mt. 0.7 mile
Food Depot Grocery 4100 Redan Rd. Stone Mt. 0.7 mile
CVS Pharmacy 1144 S Indian Creek Rd. Stone Mt. 0.8 mile
CalaBar & Grill Restaurant 4144 Redan Rd. Stone Mt. 0.8 mile
Avondale Dunaire Park Park 700 George Luther Dr. Decatur 1.2 miles
Covington Family Care Doctor/Medical 3546 Covington Hwy. Decatur 1.5 miles
Covington Branch Library Library 3500 Covington Hwy. Decatur 1.5 miles
Towers High School Public School 3919 Brookcrest Cir. Decatur 1.8 miles
Peachcrest Elementary School Public School 1530 Joy Ln. Decatur 2 miles
Bank of America Bank 3819 N Decatur Rd. Decatur 2.1 miles
Walmart General Retail 3580 Memorial Dr. Decatur 2.3 miles
DeKalb County Fire Station 3 Fire 24 N Clarendon Ave. Avondale Estates 2.5 miles
WayField Foods Grocery 1757 Columbia Dr. Decatur 2.8 miles
United States Postal Service Post Office 15 Franklin St. Avondale Estates 2.9 miles
Bethune Middle School Public School 5200 Covington Hwy. Decatur 3.6 miles
DeKalb Medical North Decatur Hospital 2701 N Decatur Rd. Decatur 4.6 miles
DeKalb County Police Dept Police 1816 Candler Rd. Decatur 4.7 miles
North DeKalb Mall Mall 2050 Lawrenceville Hwy. Decatur 5.4 miles
Source: Field and Internet Research, RPRG, Inc.
Indian Creek Apartments | Site Evaluation
Page 19
Map 3 Location of Key Facilities and Services
3. Commercial Goods and Services
Convenience Goods
The term “convenience goods” refers to inexpensive, nondurable items that households purchase ona frequent basis and for which they generally do not comparison shop. Examples of conveniencegoods are groceries, fast food, health and beauty aids, household cleaning products, newspapers, andgasoline.
The closest shopping opportunity to the subject site is across the street, where a strip centercontaining an Exxon gas station, food mart, deli, and other shops is located. The closest communitycenter is the Indian Creek Crossing Shopping Center which is located two miles to the east at theintersection of Redan Road and South Indian Creek Drive. Commercial development near thisintersection includes the closest full-service grocery store (Super Save), sundries (Family Dollar), apharmacy (CVS), bank (Bank of America ATM), gas stations (Chevron and Texaco), and severalrestaurants. A variety of additional retailers and service providers (including multiple big box retailers)are located at North DeKalb Mall, 5.4 miles to the north.
Indian Creek Apartments | Site Evaluation
Page 20
Shoppers Goods
The term “comparison goods” refers to larger ticket merchandise that households purchase on aninfrequent basis and for which they usually comparison shop. The category is sometimes called“comparison goods.” Examples of shoppers’ goods are apparel and accessories, furniture and homefurnishings, appliances, jewelry, and sporting goods.
The closest regional shopping opportunities to the subject site is the area around North DeKalb Mall,roughly seven miles north of the subject site. In April 2018 it was announced this Mall will bedemolished and replaced with a mixed-use development including a Costco, hotel, housing options,numerous retail stores, and restaurants. Existing tenants AMC Theaters and Burlington are expectedto stay. The redevelopment must still be approved by DeKalb County and will then take two years tobuild. The subject site is also within eleven miles of numerous additional shopping opportunitiesthroughout Downtown and Midtown Atlanta to the west.
4. Location of Low Income Housing
A list and map of existing low-income housing in the Indian Creek Market Area are provided in theExisting Low-Income Rental Housing section of this report, starting on page 50.
E. Site Conclusion
The subject site is in an established neighborhood that is primarily lower income, with 28.1 percentof households earning less than $25,000 annually. Surrounding land uses include a mixture ofresidential (including numerous multi-family rental communities), commercial, and light industrialdevelopment, all of which are compatible with affordable multi-family rental housing. While thesubject site is within one-half mile of active rail lines, it is sufficiently buffered by Interstate 285 to theeast. The subject site is within a few miles of community amenities, shopping opportunities, andemployment concentrations in greater Atlanta, in addition to parks, public transportation options,and public schools. Based on these factors, the site for Indian Creek Apartments is appropriate forthe proposed development.
Indian Creek Apartments | Market Area
Page 21
5. MARKET AREA
A. Introduction
The primary market area for Indian Creek Apartments is defined as the geographic area from whichfuture residents of the community would primarily be drawn, and in which competitive rental housingalternatives are located. In defining the market area, RPRG sought to accommodate the joint interestsof conservatively estimating housing demand and reflecting the realities and dynamics of the localrental housing marketplace.
B. Delineation of Market Area
The Indian Creek Market Area consists of 26 census tracts located unincorporated DeKalb County, andin the communities of nearby Clarkston, Scottdale, Avondale Estates, and Decatur. The residentialneighborhoods throughout the Indian Creek Market Area share similar surrounding land-usecharacteristics, accessibility from major thoroughfares, and contain the multi-family rentalcommunities most likely to compete with the subject property. As such, we believe households livingthroughout the Indian Creek Market Area would consider Indian Creek Apartments as an acceptableshelter location. The market area does not extend further west into downtown Decatur given thedifferences with the area surrounding the site. Likewise, areas further from the site along Interstate285 are not included given the distance from the site and the availability of intervening multi-familyrental opportunities.
The approximate boundaries of the Indian Creek Market Area and their distance from the subject site:
North: East Ponce de Leon Road / Church Street .................... (5.0 miles)East: South Harriston Road .................................................... (2.3 miles)South: Interstate 20.......................................................... (7.4 miles)West: State Highway 155 / Downtown Decatur ...................... (4.5 miles)
The Indian Creek Market Area is compared to DeKalb County, which is considered the secondarymarket area for the purposes of this analysis. Demand estimates are based only on the Indian CreekMarket Area.

Indian Creek Apartments | Market Area
Page 22
Map 4 Indian Creek Market Area
Indian Creek Apartments | Community Demographic Data
Page 23
6. COMMUNITY DEMOGRAPHIC DATA
A. Introduction and Methodology
RPRG analyzed recent trends in population and households in the Indian Creek Market Area andDeKalb County using U.S. Census data and data from Esri, a national data vendor that prepares smallarea estimates and projections of population and households. We also considered building permittrends collected from the HUD State of the Cities Data Systems (SOCDS) database.
B. Trends in Population and Households
1. Recent Past Trends
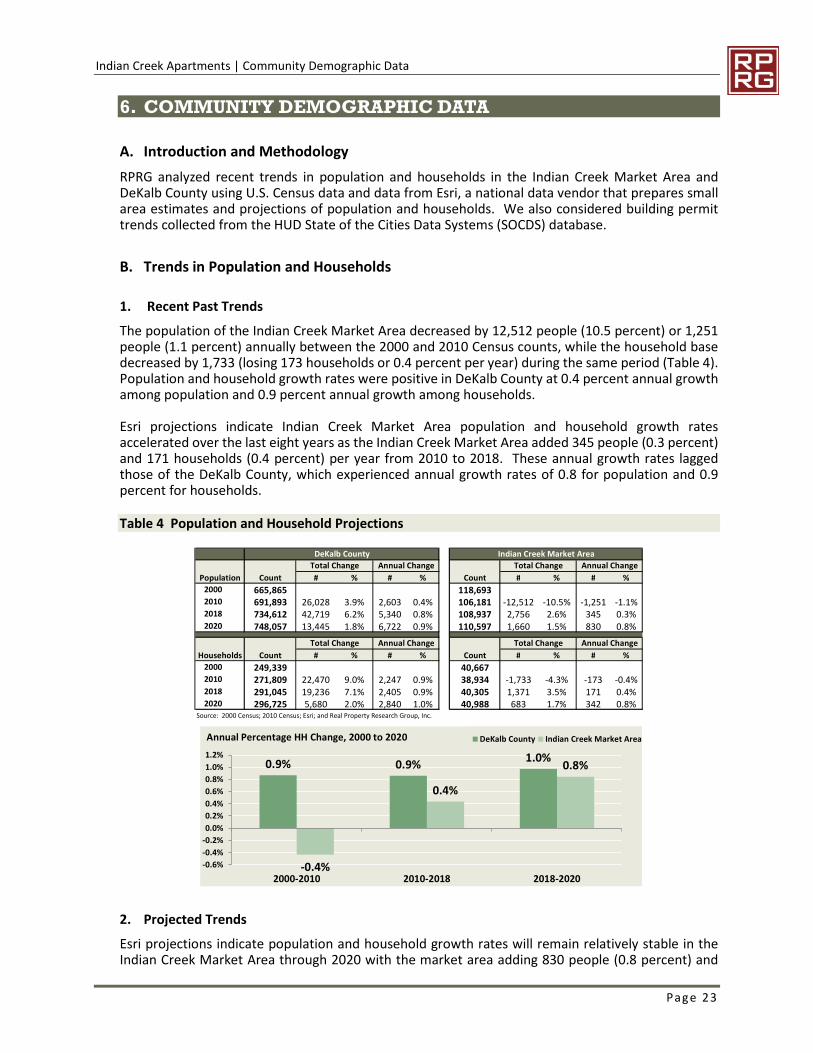
The population of the Indian Creek Market Area decreased by 12,512 people (10.5 percent) or 1,251people (1.1 percent) annually between the 2000 and 2010 Census counts, while the household basedecreased by 1,733 (losing 173 households or 0.4 percent per year) during the same period (Table 4).Population and household growth rates were positive in DeKalb County at 0.4 percent annual growthamong population and 0.9 percent annual growth among households.
Esri projections indicate Indian Creek Market Area population and household growth ratesaccelerated over the last eight years as the Indian Creek Market Area added 345 people (0.3 percent)and 171 households (0.4 percent) per year from 2010 to 2018. These annual growth rates laggedthose of the DeKalb County, which experienced annual growth rates of 0.8 for population and 0.9percent for households.
Table 4 Population and Household Projections
2. Projected Trends
Esri projections indicate population and household growth rates will remain relatively stable in theIndian Creek Market Area through 2020 with the market area adding 830 people (0.8 percent) and
DeKalb County Indian Creek Market Area
Total Change Annual Change Total Change Annual Change
Population Count # % # % Count # % # %
2000 665,865 118,6932010 691,893 26,028 3.9% 2,603 0.4% 106,181 -12,512 -10.5% -1,251 -1.1%2018 734,612 42,719 6.2% 5,340 0.8% 108,937 2,756 2.6% 345 0.3%2020 748,057 13,445 1.8% 6,722 0.9% 110,597 1,660 1.5% 830 0.8%
Total Change Annual Change Total Change Annual Change
Households Count # % # % Count # % # %
2000 249,339 40,6672010 271,809 22,470 9.0% 2,247 0.9% 38,934 -1,733 -4.3% -173 -0.4%2018 291,045 19,236 7.1% 2,405 0.9% 40,305 1,371 3.5% 171 0.4%2020 296,725 5,680 2.0% 2,840 1.0% 40,988 683 1.7% 342 0.8%
Source: 2000 Census; 2010 Census; Esri; and Real Property Research Group, Inc.
0.9% 0.9%1.0%
-0.4%
0.4%
0.8%
-0.6%
-0.4%
-0.2%
0.0%
0.2%
0.4%
0.6%
0.8%
1.0%
1.2%
2000-2010 2010-2018 2018-2020
DeKalb County Indian Creek Market AreaAnnual Percentage HH Change, 2000 to 2020
Indian Creek Apartments | Community Demographic Data
Page 24
342 households (0.8 percent) per year over the next two years. DeKalb County annual growth ratesare expected to increase slightly with the addition of 6,722 people (0.9 percent) and 2,840 households(1.0 percent) and will slightly outpace the Indian Creek Market Area’s annual projected growth.
The average household size in the market area remained stable at 2.6 from 2010 to 2018 and isexpected to stay at 2.6 through 2020 (Table 5).
Table 5 Persons per Household, Indian Creek Market Area
3. Building Permit Trends
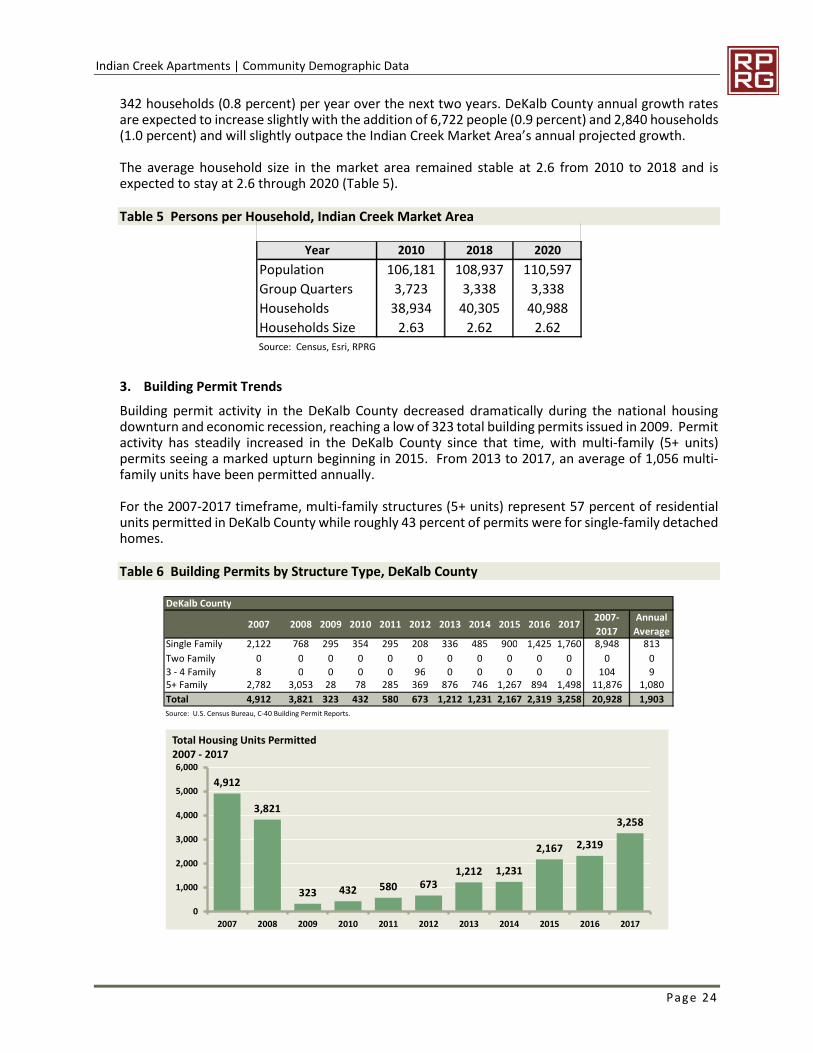
Building permit activity in the DeKalb County decreased dramatically during the national housingdownturn and economic recession, reaching a low of 323 total building permits issued in 2009. Permitactivity has steadily increased in the DeKalb County since that time, with multi-family (5+ units)permits seeing a marked upturn beginning in 2015. From 2013 to 2017, an average of 1,056 multi-family units have been permitted annually.
For the 2007-2017 timeframe, multi-family structures (5+ units) represent 57 percent of residentialunits permitted in DeKalb County while roughly 43 percent of permits were for single-family detachedhomes.
Table 6 Building Permits by Structure Type, DeKalb County
Year 2010 2018 2020
Population 106,181 108,937 110,597
Group Quarters 3,723 3,338 3,338
Households 38,934 40,305 40,988
Households Size 2.63 2.62 2.62Source: Census, Esri, RPRG
DeKalb County
2007 2008 2009 2010 2011 2012 2013 2014 2015 2016 20172007-
2017
Annual
AverageSingle Family 2,122 768 295 354 295 208 336 485 900 1,425 1,760 8,948 813
Two Family 0 0 0 0 0 0 0 0 0 0 0 0 0
3 - 4 Family 8 0 0 0 0 96 0 0 0 0 0 104 95+ Family 2,782 3,053 28 78 285 369 876 746 1,267 894 1,498 11,876 1,080
Total 4,912 3,821 323 432 580 673 1,212 1,231 2,167 2,319 3,258 20,928 1,903
Source: U.S. Census Bureau, C-40 Building Permit Reports.
4,912
3,821
323 432 580 6731,212 1,231
2,167 2,319
3,258
0
1,000
2,000
3,000
4,000
5,000
6,000
2007 2008 2009 2010 2011 2012 2013 2014 2015 2016 2017
Total Housing Units Permitted2007 - 2017
Indian Creek Apartments | Community Demographic Data
Page 25
C. Demographic Characteristics
1. Age Distribution and Household Type
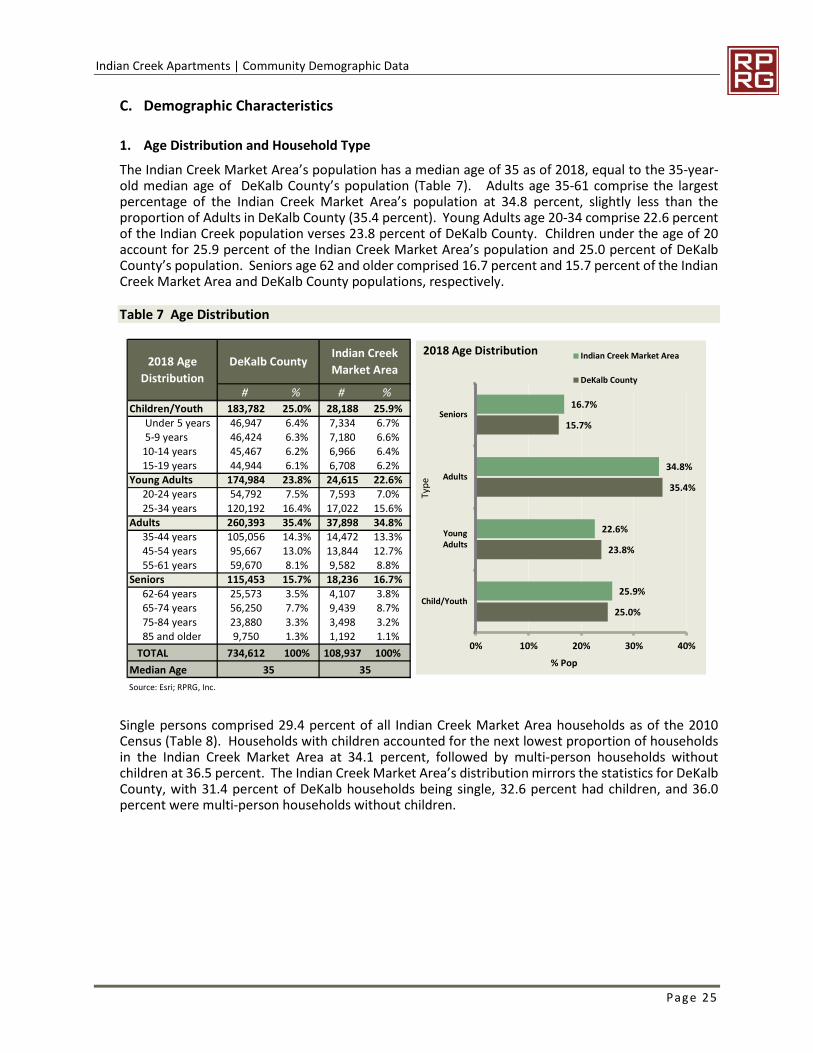
The Indian Creek Market Area’s population has a median age of 35 as of 2018, equal to the 35-year-old median age of DeKalb County’s population (Table 7). Adults age 35-61 comprise the largestpercentage of the Indian Creek Market Area’s population at 34.8 percent, slightly less than theproportion of Adults in DeKalb County (35.4 percent). Young Adults age 20-34 comprise 22.6 percentof the Indian Creek population verses 23.8 percent of DeKalb County. Children under the age of 20account for 25.9 percent of the Indian Creek Market Area’s population and 25.0 percent of DeKalbCounty’s population. Seniors age 62 and older comprised 16.7 percent and 15.7 percent of the IndianCreek Market Area and DeKalb County populations, respectively.
Table 7 Age Distribution
Single persons comprised 29.4 percent of all Indian Creek Market Area households as of the 2010Census (Table 8). Households with children accounted for the next lowest proportion of householdsin the Indian Creek Market Area at 34.1 percent, followed by multi-person households withoutchildren at 36.5 percent. The Indian Creek Market Area’s distribution mirrors the statistics for DeKalbCounty, with 31.4 percent of DeKalb households being single, 32.6 percent had children, and 36.0percent were multi-person households without children.
# % # %Children/Youth 183,782 25.0% 28,188 25.9%
Under 5 years 46,947 6.4% 7,334 6.7%5-9 years 46,424 6.3% 7,180 6.6%10-14 years 45,467 6.2% 6,966 6.4%15-19 years 44,944 6.1% 6,708 6.2%
Young Adults 174,984 23.8% 24,615 22.6%20-24 years 54,792 7.5% 7,593 7.0%
25-34 years 120,192 16.4% 17,022 15.6%Adults 260,393 35.4% 37,898 34.8%
35-44 years 105,056 14.3% 14,472 13.3%45-54 years 95,667 13.0% 13,844 12.7%55-61 years 59,670 8.1% 9,582 8.8%
Seniors 115,453 15.7% 18,236 16.7%
62-64 years 25,573 3.5% 4,107 3.8%65-74 years 56,250 7.7% 9,439 8.7%75-84 years 23,880 3.3% 3,498 3.2%85 and older 9,750 1.3% 1,192 1.1%
TOTAL 734,612 100% 108,937 100%
Median Age
Source: Esri; RPRG, Inc.
35 35
DeKalb CountyIndian Creek
Market Area2018 Age
Distribution
25.0%
23.8%
35.4%
15.7%
25.9%
22.6%
34.8%
16.7%
0% 10% 20% 30% 40%
Child/Youth
YoungAdults
Adults
Seniors
% Pop
Typ
e
2018 Age Distribution Indian Creek Market Area
DeKalb County
Indian Creek Apartments | Community Demographic Data
Page 26
Table 8 Households by Household Type
2. Renter Household Characteristics
Approximately 46 percent of households in the Indian Creek Market Area were renters as of the 2010Census, slightly higher than the 43 percent rental rate in DeKalb County (Table 9). Esri estimatesrenter percentages increased to 51.6 percent in the Indian Creek Market Area and 48.4 percent inDeKalb County as of 2018, with renter households accounting for all net household growth in theIndian Creek Market Area and in DeKalb County during this period. Based on Esri and ACS trends, therenter percentages in the Indian Creek Market Area and in DeKalb County are each expected to remainfairly constant through 2020. Renter households are projected to account for 26.5 percent of theIndian Creek Market Area’s net household growth through 2020, compared to 28.1 percent of DeKalbCounty’s net household growth during this period. The Indian Creek Market Area’s households havea higher propensity to rent than the county, with 2018 renter percentages of 51.6 percent for themarket area verses 48.4 percent for DeKalb County. The market area lost more than 3,000 ownerhousehold over the past 18 years but has added 2,760 renter households. Renter householdscontributed 89.5 percent of the county’s net household growth since 2000. Esri projects renterhouseholds to contribute a disproportionately small share of net household growth over the next twoyears, which is unlikely given past trends and current conditions.
Table 9 Households by Tenure
Young and working age households (age 25 to 44) account for the vast majority of the Indian CreekMarket area renters at 46 percent, including 25.4 percent between the ages of 25 to 34 years (Table10). Older adult renter householders (age 45 to 64 years) comprise 32.6 percent of Indian Creek
# % # %
Married w/Children 47,187 17.4% 5,671 14.6%
Other w/ Children 41,354 15.2% 7,608 19.5%
Households w/ Children 88,541 32.6% 13,279 34.1%
Married w/o Children 50,148 18.4% 6,485 16.7%
Other Family w/o Children 23,679 8.7% 4,660 12.0%
Non-Family w/o Children 24,115 8.9% 3,062 7.9%
Households w/o Children 97,942 36.0% 14,207 36.5%
Singles 85,326 31.4% 11,448 29.4%
Total 271,809 100% 38,934 100%
Source: 2010 Census; RPRG, Inc.
2010 Households by
Household Type
DeKalb CountyIndian Creek
Market Area
31.4%
36.0%
32.6%
29.4%
36.5%
34.1%
0% 10% 20% 30% 40%
Singles
HH w/oChildren
HH w/Children
% Households
Ho
use
ho
ldTy
pe
2010 Households by Household Type
Indian CreekMarket Area
DeKalb County
DeKalb County2000 2010 2018
Change 2000-
2018 2020
Change 2018-
2020Housing Units # % # % # % # % # % # %Owner Occupied 145,825 58.5% 154,647 56.9% 150,188 51.6% 4,363 10.5% 154,271 52.0% 4,083 71.9%
Renter Occupied 103,514 41.5% 117,162 43.1% 140,857 48.4% 37,343 89.5% 142,454 48.0% 1,597 28.1%Total Occupied 249,339 100% 271,809 100% 291,045 100% 41,706 100% 296,725 100% 5,680 100%
Total Vacant 11,892 33,159 31,336 30,645TOTAL UNITS 261,231 304,968 322,381 327,370
Indian Creek
Market Area 2000 2010 2018
Change 2000-
2018 2020
Change 2018-
2020
Housing Units # % # % # % # % # % # %
Owner Occupied 22,630 55.6% 20,932 53.8% 19,508 48.4% -3,122 20,010 48.8% 502 73.5%
Renter Occupied 18,037 44.4% 18,002 46.2% 20,797 51.6% 2,760 20,978 51.2% 181 26.5%
Total Occupied 40,667 100% 38,934 100% 40,305 100% -362 100% 40,988 100% 683 100%
Total Vacant 1,856 6,352 6,587 6,714
TOTAL UNITS 42,523 45,286 46,892 47,702
Source: U.S. Census of Population and Housing, 2000, 2010; Esri, RPRG, Inc.
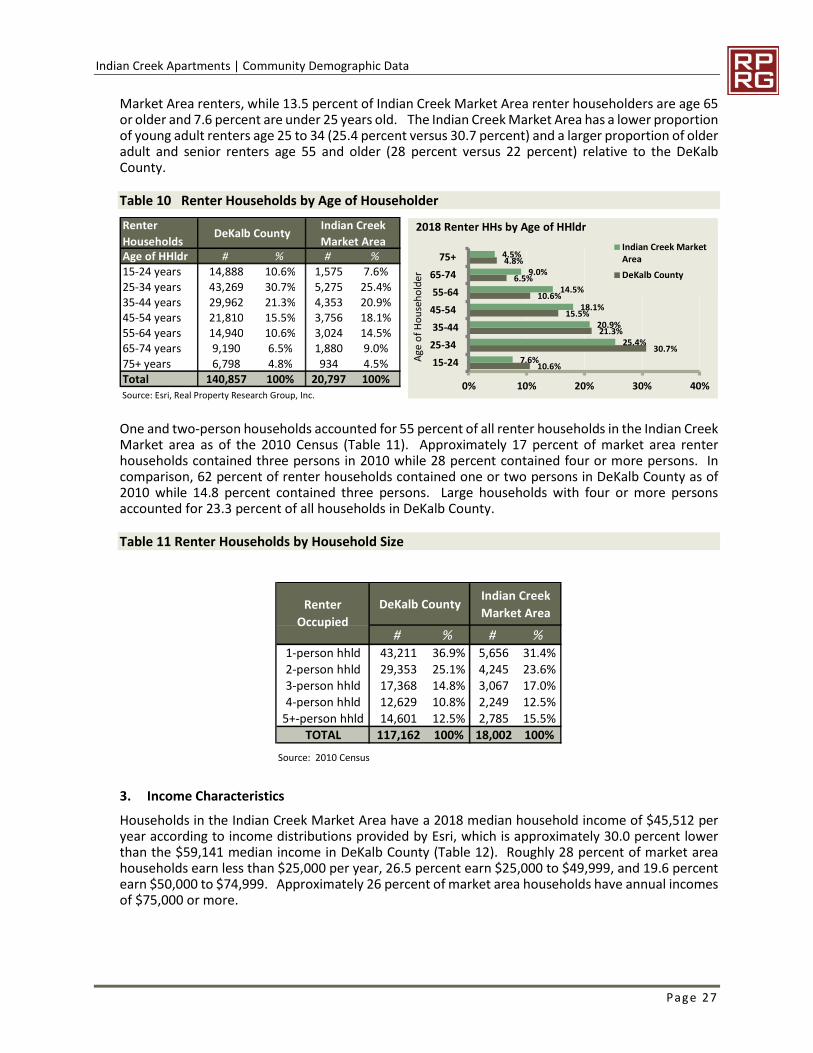
Indian Creek Apartments | Community Demographic Data
Page 27
Market Area renters, while 13.5 percent of Indian Creek Market Area renter householders are age 65or older and 7.6 percent are under 25 years old. The Indian Creek Market Area has a lower proportionof young adult renters age 25 to 34 (25.4 percent versus 30.7 percent) and a larger proportion of olderadult and senior renters age 55 and older (28 percent versus 22 percent) relative to the DeKalbCounty.
Table 10 Renter Households by Age of Householder
One and two-person households accounted for 55 percent of all renter households in the Indian CreekMarket area as of the 2010 Census (Table 11). Approximately 17 percent of market area renterhouseholds contained three persons in 2010 while 28 percent contained four or more persons. Incomparison, 62 percent of renter households contained one or two persons in DeKalb County as of2010 while 14.8 percent contained three persons. Large households with four or more personsaccounted for 23.3 percent of all households in DeKalb County.
Table 11 Renter Households by Household Size
3. Income Characteristics
Households in the Indian Creek Market Area have a 2018 median household income of $45,512 peryear according to income distributions provided by Esri, which is approximately 30.0 percent lowerthan the $59,141 median income in DeKalb County (Table 12). Roughly 28 percent of market areahouseholds earn less than $25,000 per year, 26.5 percent earn $25,000 to $49,999, and 19.6 percentearn $50,000 to $74,999. Approximately 26 percent of market area households have annual incomesof $75,000 or more.
Renter
HouseholdsDeKalb County
Indian Creek
Market AreaAge of HHldr # % # %15-24 years 14,888 10.6% 1,575 7.6% 2
25-34 years 43,269 30.7% 5,275 25.4% 235-44 years 29,962 21.3% 4,353 20.9% 245-54 years 21,810 15.5% 3,756 18.1% 155-64 years 14,940 10.6% 3,024 14.5%65-74 years 9,190 6.5% 1,880 9.0% 1
75+ years 6,798 4.8% 934 4.5% 2Total 140,857 100% 20,797 100%Source: Esri, Real Property Research Group, Inc.
10.6%
30.7%
21.3%
15.5%
10.6%
6.5%
4.8%
7.6%
25.4%
20.9%
18.1%
14.5%
9.0%
4.5%
0% 10% 20% 30% 40%
15-24
25-34
35-44
45-54
55-64
65-74
75+
Age
of
Ho
use
ho
lde
r
2018 Renter HHs by Age of HHldr
Indian Creek MarketArea
DeKalb County
DeKalb CountyIndian Creek
Market Area
# % # %1-person hhld 43,211 36.9% 5,656 31.4%2-person hhld 29,353 25.1% 4,245 23.6%3-person hhld 17,368 14.8% 3,067 17.0%4-person hhld 12,629 10.8% 2,249 12.5%
5+-person hhld 14,601 12.5% 2,785 15.5%TOTAL 117,162 100% 18,002 100%
Source: 2010 Census
Renter
Occupied
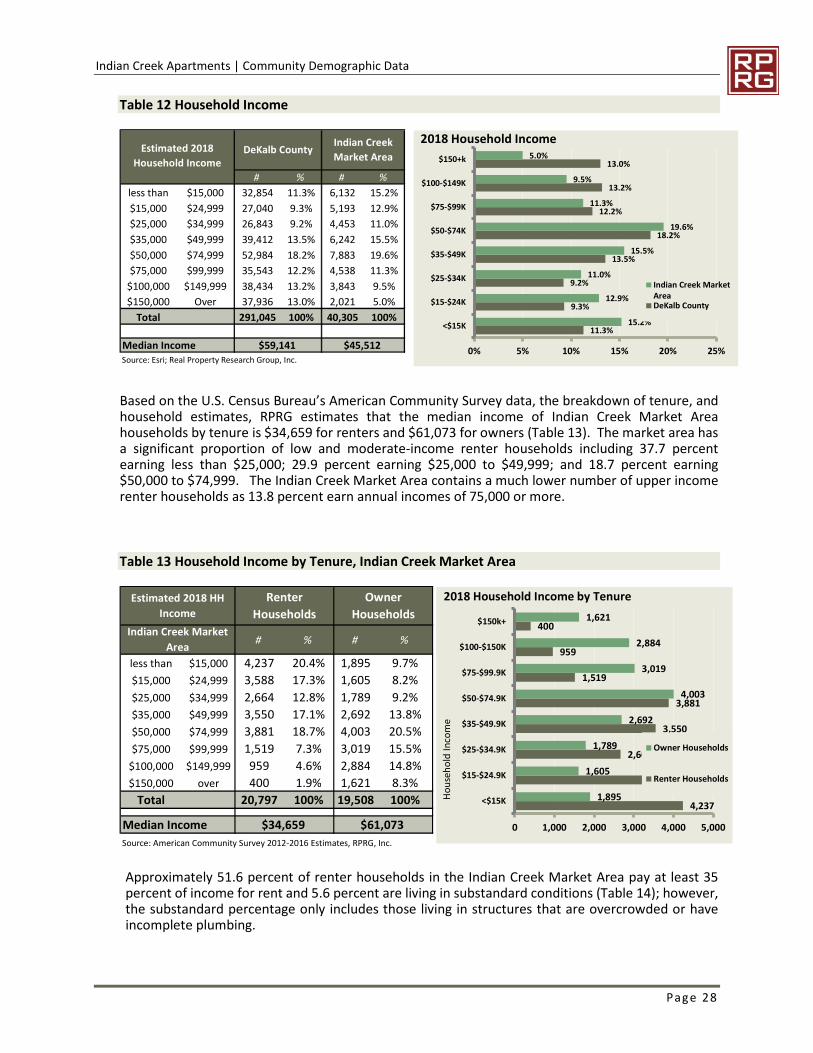
Indian Creek Apartments | Community Demographic Data
Page 28
Table 12 Household Income
Based on the U.S. Census Bureau’s American Community Survey data, the breakdown of tenure, andhousehold estimates, RPRG estimates that the median income of Indian Creek Market Areahouseholds by tenure is $34,659 for renters and $61,073 for owners (Table 13). The market area hasa significant proportion of low and moderate-income renter households including 37.7 percentearning less than $25,000; 29.9 percent earning $25,000 to $49,999; and 18.7 percent earning$50,000 to $74,999. The Indian Creek Market Area contains a much lower number of upper incomerenter households as 13.8 percent earn annual incomes of 75,000 or more.
Table 13 Household Income by Tenure, Indian Creek Market Area
Approximately 51.6 percent of renter households in the Indian Creek Market Area pay at least 35percent of income for rent and 5.6 percent are living in substandard conditions (Table 14); however,the substandard percentage only includes those living in structures that are overcrowded or haveincomplete plumbing.
# % # %
less than $15,000 32,854 11.3% 6,132 15.2% 2
$15,000 $24,999 27,040 9.3% 5,193 12.9% 3
$25,000 $34,999 26,843 9.2% 4,453 11.0% 4
$35,000 $49,999 39,412 13.5% 6,242 15.5% 5
$50,000 $74,999 52,984 18.2% 7,883 19.6% 6
$75,000 $99,999 35,543 12.2% 4,538 11.3% 7
$100,000 $149,999 38,434 13.2% 3,843 9.5% 8
$150,000 Over 37,936 13.0% 2,021 5.0% 9
Total 291,045 100% 40,305 100% 10
Median Income $59,141 $45,512Source: Esri; Real Property Research Group, Inc.
Indian Creek
Market AreaDeKalb CountyEstimated 2018
Household Income
11.3%
9.3%
9.2%
13.5%
18.2%
12.2%
13.2%
13.0%
15.2%
12.9%
11.0%
15.5%
19.6%
11.3%
9.5%
5.0%
0% 5% 10% 15% 20% 25%
<$15K
$15-$24K
$25-$34K
$35-$49K
$50-$74K
$75-$99K
$100-$149K
$150+k
2018 Household Income
Indian Creek MarketAreaDeKalb County
# % # %
less than $15,000 4,237 20.4% 1,895 9.7% 2
$15,000 $24,999 3,588 17.3% 1,605 8.2% 3
$25,000 $34,999 2,664 12.8% 1,789 9.2% 4
$35,000 $49,999 3,550 17.1% 2,692 13.8% 5
$50,000 $74,999 3,881 18.7% 4,003 20.5% 6
$75,000 $99,999 1,519 7.3% 3,019 15.5% 7
$100,000 $149,999 959 4.6% 2,884 14.8% 8
$150,000 over 400 1.9% 1,621 8.3% 9
Total 20,797 100% 19,508 100% 10
Median Income
Source: American Community Survey 2012-2016 Estimates, RPRG, Inc.
Estimated 2018 HH
Income
$34,659 $61,073
Renter
Households
Owner
Households
Indian Creek Market
Area
4,237
3,588
2,664
3,550
3,881
1,519
959
400
1,895
1,605
1,789
2,692
4,003
3,019
2,884
1,621
0 1,000 2,000 3,000 4,000 5,000
<$15K
$15-$24.9K
$25-$34.9K
$35-$49.9K
$50-$74.9K
$75-$99.9K
$100-$150K
$150k+
Ho
use
ho
ldIn
com
e
2018 Household Income by Tenure
Owner Households
Renter Households
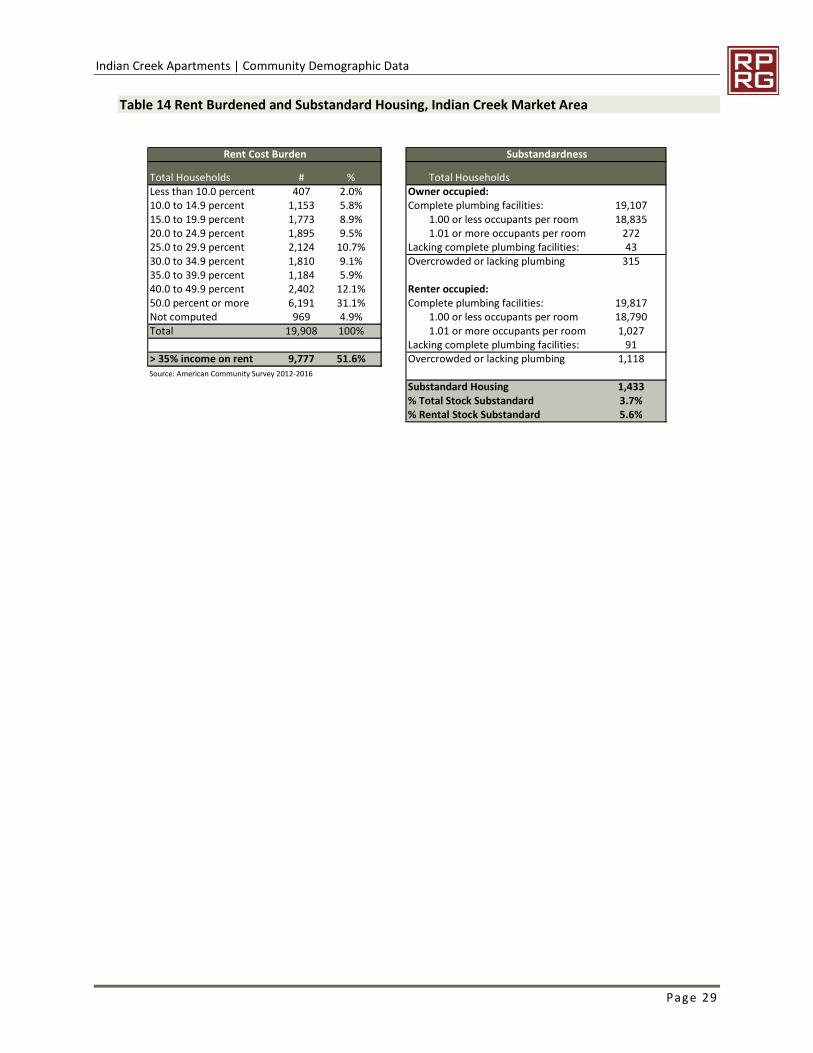
Indian Creek Apartments | Community Demographic Data
Page 29
Table 14 Rent Burdened and Substandard Housing, Indian Creek Market Area
Rent Cost Burden Substandardness
Total Households # % Total HouseholdsLess than 10.0 percent 407 2.0% Owner occupied:10.0 to 14.9 percent 1,153 5.8% Complete plumbing facilities: 19,10715.0 to 19.9 percent 1,773 8.9% 1.00 or less occupants per room 18,83520.0 to 24.9 percent 1,895 9.5% 1.01 or more occupants per room 27225.0 to 29.9 percent 2,124 10.7% Lacking complete plumbing facilities: 4330.0 to 34.9 percent 1,810 9.1% Overcrowded or lacking plumbing 31535.0 to 39.9 percent 1,184 5.9%40.0 to 49.9 percent 2,402 12.1% Renter occupied:50.0 percent or more 6,191 31.1% Complete plumbing facilities: 19,817Not computed 969 4.9% 1.00 or less occupants per room 18,790Total 19,908 100% 1.01 or more occupants per room 1,027
Lacking complete plumbing facilities: 91> 35% income on rent 9,777 51.6% Overcrowded or lacking plumbing 1,118Source: American Community Survey 2012-2016
Substandard Housing 1,433% Total Stock Substandard 3.7%% Rental Stock Substandard 5.6%
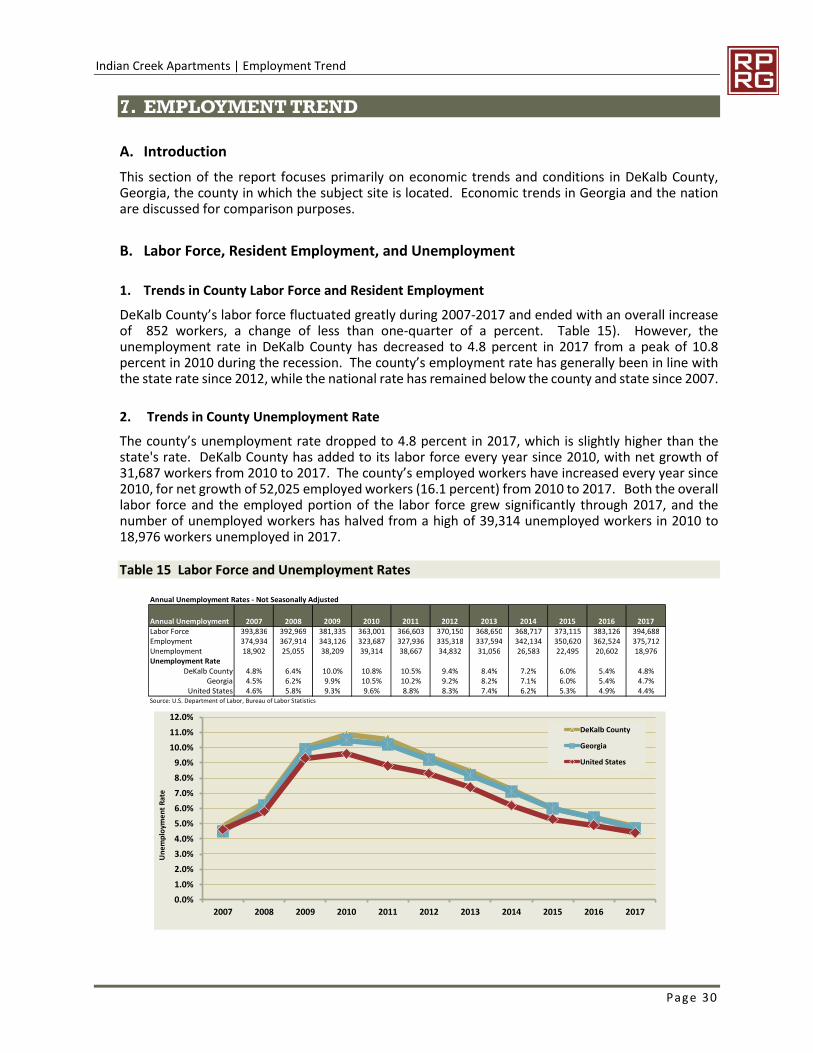
Indian Creek Apartments | Employment Trend
Page 30
7. EMPLOYMENT TREND
A. Introduction
This section of the report focuses primarily on economic trends and conditions in DeKalb County,Georgia, the county in which the subject site is located. Economic trends in Georgia and the nationare discussed for comparison purposes.
B. Labor Force, Resident Employment, and Unemployment
1. Trends in County Labor Force and Resident Employment
DeKalb County’s labor force fluctuated greatly during 2007-2017 and ended with an overall increaseof 852 workers, a change of less than one-quarter of a percent. Table 15). However, theunemployment rate in DeKalb County has decreased to 4.8 percent in 2017 from a peak of 10.8percent in 2010 during the recession. The county’s employment rate has generally been in line withthe state rate since 2012, while the national rate has remained below the county and state since 2007.
2. Trends in County Unemployment Rate
The county’s unemployment rate dropped to 4.8 percent in 2017, which is slightly higher than thestate's rate. DeKalb County has added to its labor force every year since 2010, with net growth of31,687 workers from 2010 to 2017. The county’s employed workers have increased every year since2010, for net growth of 52,025 employed workers (16.1 percent) from 2010 to 2017. Both the overalllabor force and the employed portion of the labor force grew significantly through 2017, and thenumber of unemployed workers has halved from a high of 39,314 unemployed workers in 2010 to18,976 workers unemployed in 2017.
Table 15 Labor Force and Unemployment Rates
Annual Unemployment Rates - Not Seasonally Adjusted
Annual Unemployment 2007 2008 2009 2010 2011 2012 2013 2014 2015 2016 2017Labor Force 393,836 392,969 381,335 363,001 366,603 370,150 368,650 368,717 373,115 383,126 394,688Employment 374,934 367,914 343,126 323,687 327,936 335,318 337,594 342,134 350,620 362,524 375,712Unemployment 18,902 25,055 38,209 39,314 38,667 34,832 31,056 26,583 22,495 20,602 18,976Unemployment Rate
DeKalb County 4.8% 6.4% 10.0% 10.8% 10.5% 9.4% 8.4% 7.2% 6.0% 5.4% 4.8%Georgia 4.5% 6.2% 9.9% 10.5% 10.2% 9.2% 8.2% 7.1% 6.0% 5.4% 4.7%
United States 4.6% 5.8% 9.3% 9.6% 8.8% 8.3% 7.4% 6.2% 5.3% 4.9% 4.4%Source: U.S. Department of Labor, Bureau of Labor Statistics
0.0%
1.0%
2.0%
3.0%
4.0%
5.0%
6.0%
7.0%
8.0%
9.0%
10.0%
11.0%
12.0%
2007 2008 2009 2010 2011 2012 2013 2014 2015 2016 2017
DeKalb County
Georgia
United States
Un
em
plo
yme
nt
Rat
e
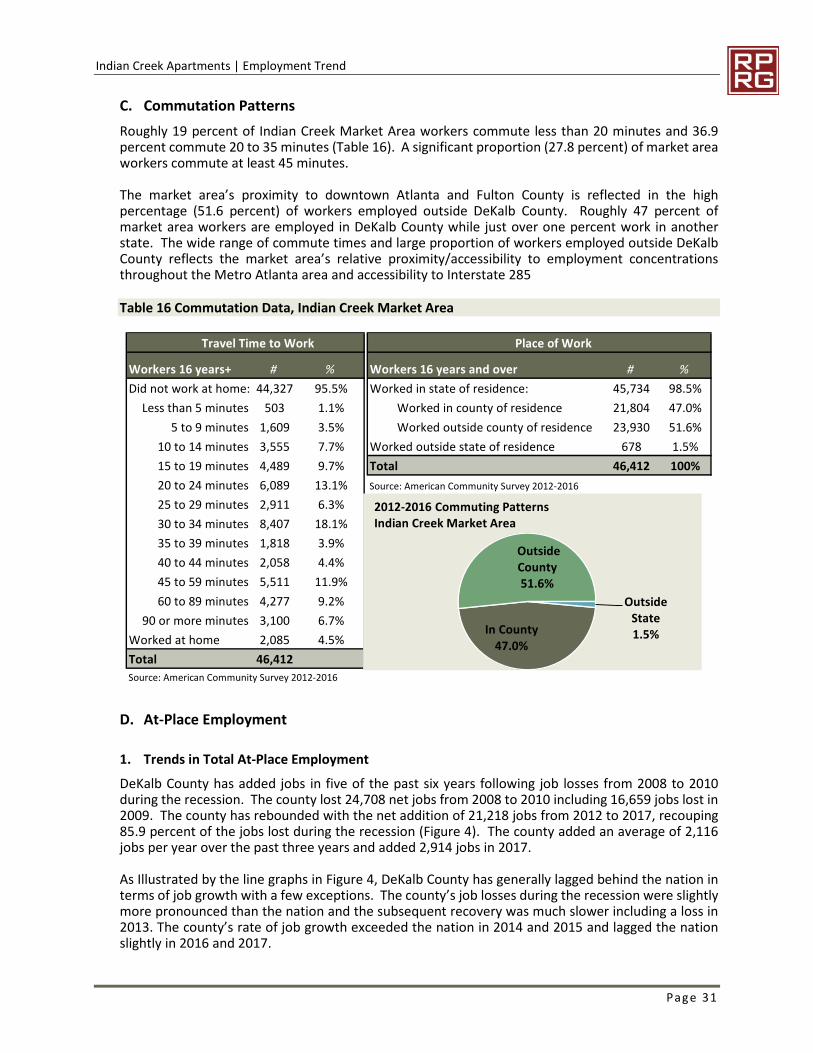
Indian Creek Apartments | Employment Trend
Page 31
C. Commutation Patterns
Roughly 19 percent of Indian Creek Market Area workers commute less than 20 minutes and 36.9percent commute 20 to 35 minutes (Table 16). A significant proportion (27.8 percent) of market areaworkers commute at least 45 minutes.
The market area’s proximity to downtown Atlanta and Fulton County is reflected in the highpercentage (51.6 percent) of workers employed outside DeKalb County. Roughly 47 percent ofmarket area workers are employed in DeKalb County while just over one percent work in anotherstate. The wide range of commute times and large proportion of workers employed outside DeKalbCounty reflects the market area’s relative proximity/accessibility to employment concentrationsthroughout the Metro Atlanta area and accessibility to Interstate 285
Table 16 Commutation Data, Indian Creek Market Area
D. At-Place Employment
1. Trends in Total At-Place Employment
DeKalb County has added jobs in five of the past six years following job losses from 2008 to 2010during the recession. The county lost 24,708 net jobs from 2008 to 2010 including 16,659 jobs lost in2009. The county has rebounded with the net addition of 21,218 jobs from 2012 to 2017, recouping85.9 percent of the jobs lost during the recession (Figure 4). The county added an average of 2,116jobs per year over the past three years and added 2,914 jobs in 2017.
As Illustrated by the line graphs in Figure 4, DeKalb County has generally lagged behind the nation interms of job growth with a few exceptions. The county’s job losses during the recession were slightlymore pronounced than the nation and the subsequent recovery was much slower including a loss in2013. The county’s rate of job growth exceeded the nation in 2014 and 2015 and lagged the nationslightly in 2016 and 2017.
Travel Time to Work Place of Work
Workers 16 years+ # % Workers 16 years and over # %
Did not work at home: 44,327 95.5% Worked in state of residence: 45,734 98.5%
Less than 5 minutes 503 1.1% Worked in county of residence 21,804 47.0%
5 to 9 minutes 1,609 3.5% Worked outside county of residence 23,930 51.6%
10 to 14 minutes 3,555 7.7% Worked outside state of residence 678 1.5%
15 to 19 minutes 4,489 9.7% Total 46,412 100%
20 to 24 minutes 6,089 13.1% Source: American Community Survey 2012-2016
25 to 29 minutes 2,911 6.3%
30 to 34 minutes 8,407 18.1%
35 to 39 minutes 1,818 3.9%
40 to 44 minutes 2,058 4.4%
45 to 59 minutes 5,511 11.9%
60 to 89 minutes 4,277 9.2%
90 or more minutes 3,100 6.7%
Worked at home 2,085 4.5%
Total 46,412
Source: American Community Survey 2012-2016
In County47.0%
OutsideCounty51.6%
OutsideState1.5%
2012-2016 Commuting PatternsIndian Creek Market Area
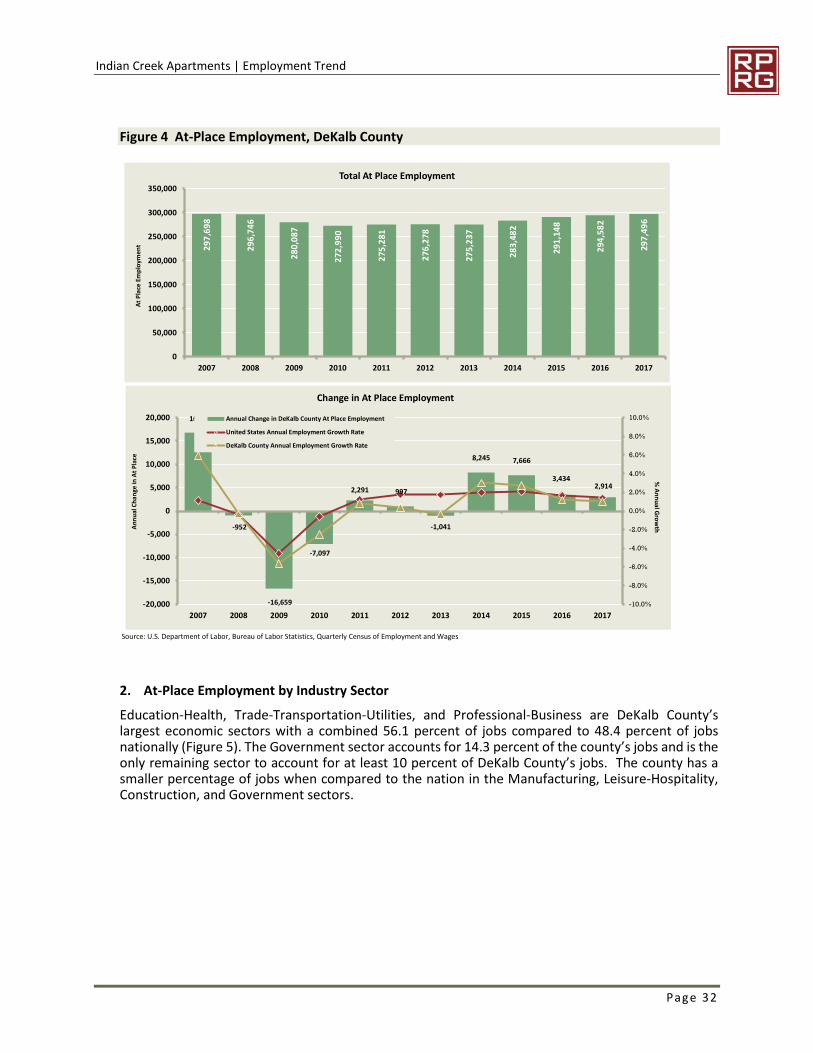
Indian Creek Apartments | Employment Trend
Page 32
Figure 4 At-Place Employment, DeKalb County
2. At-Place Employment by Industry Sector
Education-Health, Trade-Transportation-Utilities, and Professional-Business are DeKalb County’slargest economic sectors with a combined 56.1 percent of jobs compared to 48.4 percent of jobsnationally (Figure 5). The Government sector accounts for 14.3 percent of the county’s jobs and is theonly remaining sector to account for at least 10 percent of DeKalb County’s jobs. The county has asmaller percentage of jobs when compared to the nation in the Manufacturing, Leisure-Hospitality,Construction, and Government sectors.
Source: U.S. Department of Labor, Bureau of Labor Statistics, Quarterly Census of Employment and Wages
29
7,6
98
29
6,7
46
28
0,0
87
272
,99
0
275
,281
276
,278
275
,237
28
3,4
82
291
,14
8
294
,58
2
297
,49
6
0
50,000
100,000
150,000
200,000
250,000
300,000
350,000
2007 2008 2009 2010 2011 2012 2013 2014 2015 2016 2017
At
Pla
ceEm
plo
yme
nt
Total At Place Employment
16,781
-952
-16,659
-7,097
2,291 997
-1,041
8,245 7,666
3,4342,914
-10.0%
-8.0%
-6.0%
-4.0%
-2.0%
0.0%
2.0%
4.0%
6.0%
8.0%
10.0%
-20,000
-15,000
-10,000
-5,000
0
5,000
10,000
15,000
20,000
2007 2008 2009 2010 2011 2012 2013 2014 2015 2016 2017
Change in At Place Employment
Annual Change in DeKalb County At Place Employment
United States Annual Employment Growth Rate
DeKalb County Annual Employment Growth Rate
An
nu
alC
ha
nge
inA
tP
lace
%A
nn
ua
lGro
wth
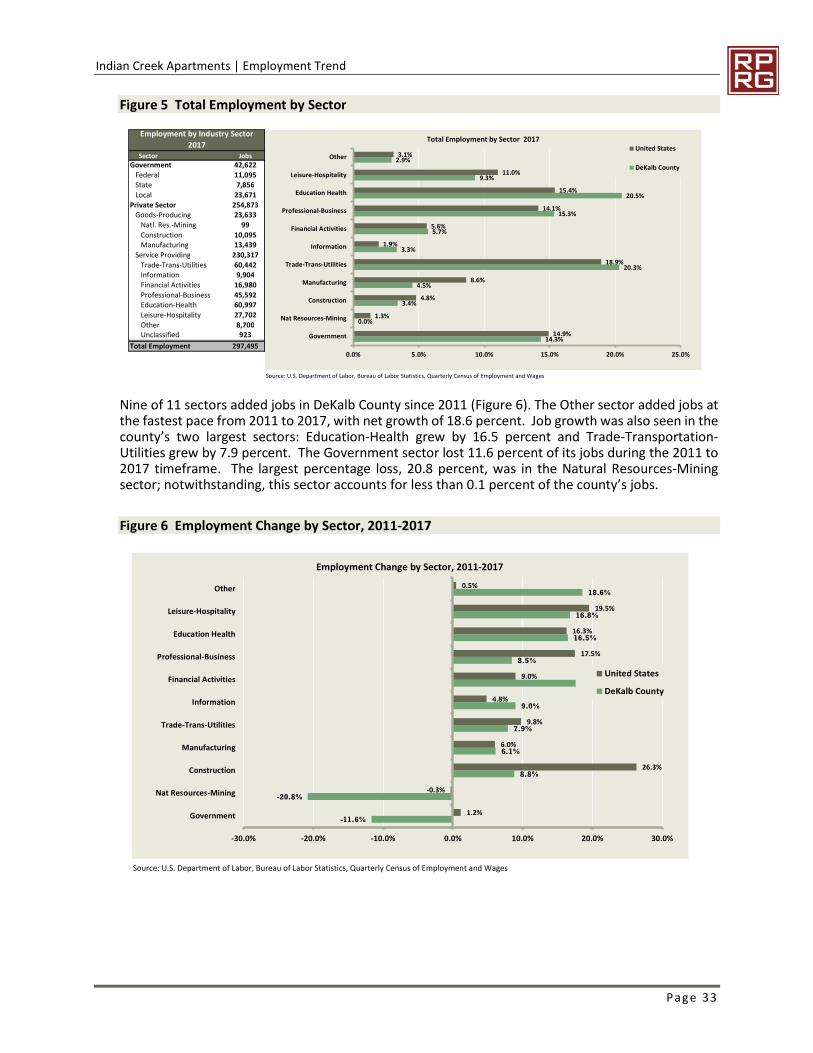
Indian Creek Apartments | Employment Trend
Page 33
Figure 5 Total Employment by Sector
Nine of 11 sectors added jobs in DeKalb County since 2011 (Figure 6). The Other sector added jobs atthe fastest pace from 2011 to 2017, with net growth of 18.6 percent. Job growth was also seen in thecounty’s two largest sectors: Education-Health grew by 16.5 percent and Trade-Transportation-Utilities grew by 7.9 percent. The Government sector lost 11.6 percent of its jobs during the 2011 to2017 timeframe. The largest percentage loss, 20.8 percent, was in the Natural Resources-Miningsector; notwithstanding, this sector accounts for less than 0.1 percent of the county’s jobs.
Figure 6 Employment Change by Sector, 2011-2017
Employment by Industry Sector
2017Sector Jobs
Government 42,622
Federal 11,095
State 7,856
Local 23,671
Private Sector 254,873Goods-Producing 23,633
Natl. Res.-Mining 99
Construction 10,095Manufacturing 13,439
Service Providing 230,317
Trade-Trans-Utilities 60,442
Information 9,904
Financial Activities 16,980
Professional-Business 45,592Education-Health 60,997
Leisure-Hospitality 27,702
Other 8,700Unclassified 923
Total Employment 297,495
Source: U.S. Department of Labor, Bureau of Labor Statistics, Quarterly Census of Employment and Wages
14.3%
0.0%
3.4%
4.5%
20.3%
3.3%
5.7%
15.3%
20.5%
9.3%
2.9%
14.9%
1.3%
4.8%
8.6%
18.9%
1.9%
5.6%
14.1%
15.4%
11.0%
3.1%
0.0% 5.0% 10.0% 15.0% 20.0% 25.0%
Government
Nat Resources-Mining
Construction
Manufacturing
Trade-Trans-Utilities
Information
Financial Activities
Professional-Business
Education Health
Leisure-Hospitality
Other
Total Employment by Sector 2017United States
DeKalb County
Source: U.S. Department of Labor, Bureau of Labor Statistics, Quarterly Census of Employment and Wages
-11.6%
-20.8%
8.8%
6.1%
7.9%
9.0%
24.8%
8.5%
16.5%
16.8%
18.6%
1.2%
-0.3%
26.3%
6.0%
9.8%
4.8%
9.0%
17.5%
16.3%
19.5%
0.5%
-30.0% -20.0% -10.0% 0.0% 10.0% 20.0% 30.0%
Government
Nat Resources-Mining
Construction
Manufacturing
Trade-Trans-Utilities
Information
Financial Activities
Professional-Business
Education Health
Leisure-Hospitality
Other
Employment Change by Sector, 2011-2017
United States
DeKalb County
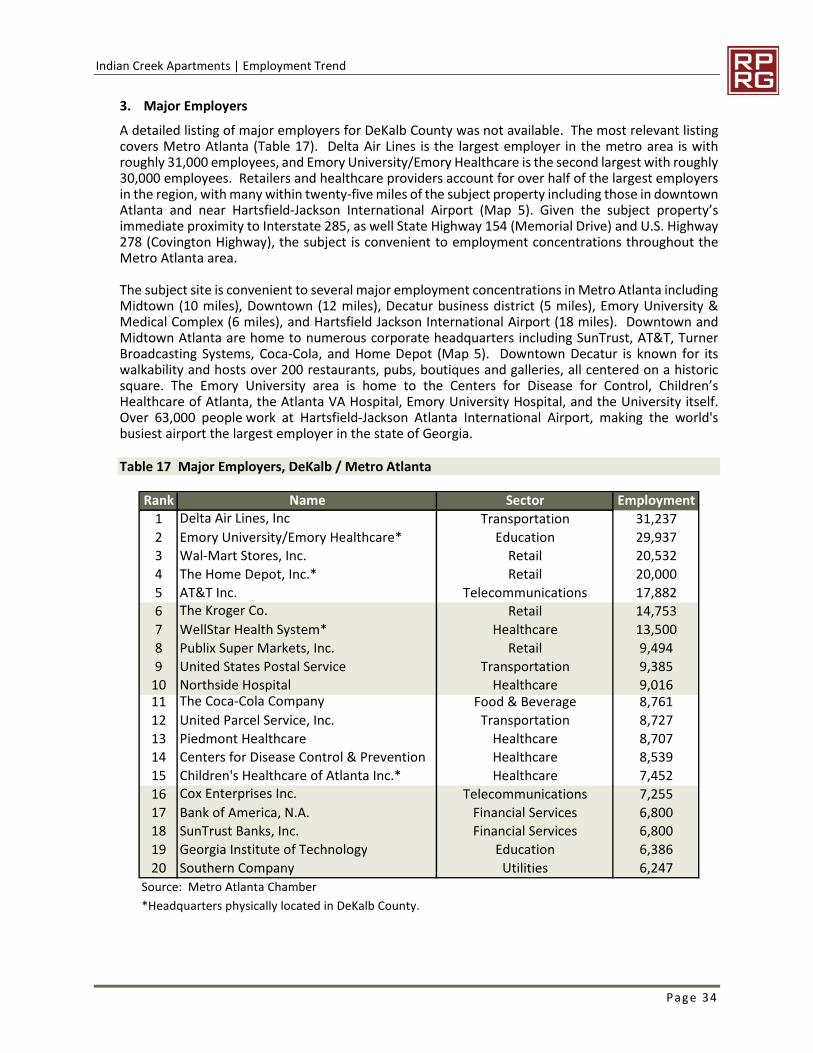
Indian Creek Apartments | Employment Trend
Page 34
3. Major Employers
A detailed listing of major employers for DeKalb County was not available. The most relevant listingcovers Metro Atlanta (Table 17). Delta Air Lines is the largest employer in the metro area is withroughly 31,000 employees, and Emory University/Emory Healthcare is the second largest with roughly30,000 employees. Retailers and healthcare providers account for over half of the largest employersin the region, with many within twenty-five miles of the subject property including those in downtownAtlanta and near Hartsfield-Jackson International Airport (Map 5). Given the subject property’simmediate proximity to Interstate 285, as well State Highway 154 (Memorial Drive) and U.S. Highway278 (Covington Highway), the subject is convenient to employment concentrations throughout theMetro Atlanta area.
The subject site is convenient to several major employment concentrations in Metro Atlanta includingMidtown (10 miles), Downtown (12 miles), Decatur business district (5 miles), Emory University &Medical Complex (6 miles), and Hartsfield Jackson International Airport (18 miles). Downtown andMidtown Atlanta are home to numerous corporate headquarters including SunTrust, AT&T, TurnerBroadcasting Systems, Coca-Cola, and Home Depot (Map 5). Downtown Decatur is known for itswalkability and hosts over 200 restaurants, pubs, boutiques and galleries, all centered on a historicsquare. The Emory University area is home to the Centers for Disease for Control, Children’sHealthcare of Atlanta, the Atlanta VA Hospital, Emory University Hospital, and the University itself.Over 63,000 people work at Hartsfield-Jackson Atlanta International Airport, making the world'sbusiest airport the largest employer in the state of Georgia.
Table 17 Major Employers, DeKalb / Metro Atlanta
Rank Name Sector Employment
1 Delta Air Lines, Inc Transportation 31,237
2 Emory University/Emory Healthcare* Education 29,937
3 Wal-Mart Stores, Inc. Retail 20,532
4 The Home Depot, Inc.* Retail 20,000
5 AT&T Inc. Telecommunications 17,882
6 The Kroger Co. Retail 14,753
7 WellStar Health System* Healthcare 13,500
8 Publix Super Markets, Inc. Retail 9,494
9 United States Postal Service Transportation 9,385
10 Northside Hospital Healthcare 9,01611 The Coca-Cola Company Food & Beverage 8,761
12 United Parcel Service, Inc. Transportation 8,727
13 Piedmont Healthcare Healthcare 8,707
14 Centers for Disease Control & Prevention Healthcare 8,539
15 Children's Healthcare of Atlanta Inc.* Healthcare 7,452
16 Cox Enterprises Inc. Telecommunications 7,255
17 Bank of America, N.A. Financial Services 6,800
18 SunTrust Banks, Inc. Financial Services 6,800
19 Georgia Institute of Technology Education 6,386
20 Southern Company Utilities 6,247
Source: Metro Atlanta Chamber
*Headquarters physically located in DeKalb County.

Indian Creek Apartments | Employment Trend
Page 35
Map 5 Major Employers, Metro Atlanta
4. Recent Economic Expansions and Contractions
Five large job expansions were identified in DeKalb County since 2016 totaling 2,363 new jobs. Thelargest expansion was announced by Home Chef in August 2016 which planned to invest $3.4 millionand create 1,200 jobs at a new facility in Lithonia by 2020; the facility is now operational. Fouradditional job expansion announcements were identified in the county in 2017 with a combined 1,163jobs expected to be created over the next several years. Two of these companies will create 500 jobseach, including Serta Simmons which announced an investment of $65 million to build a newheadquarters located on a five-acre site as part of the redevelopment of the 165-acre General Motorsplant in Doraville, GA, renamed Assembly. Construction is underway and expected to be completedin early 2019 (Table 18). Five companies announced layoffs in the county since 2016 with a combined715 jobs lost.
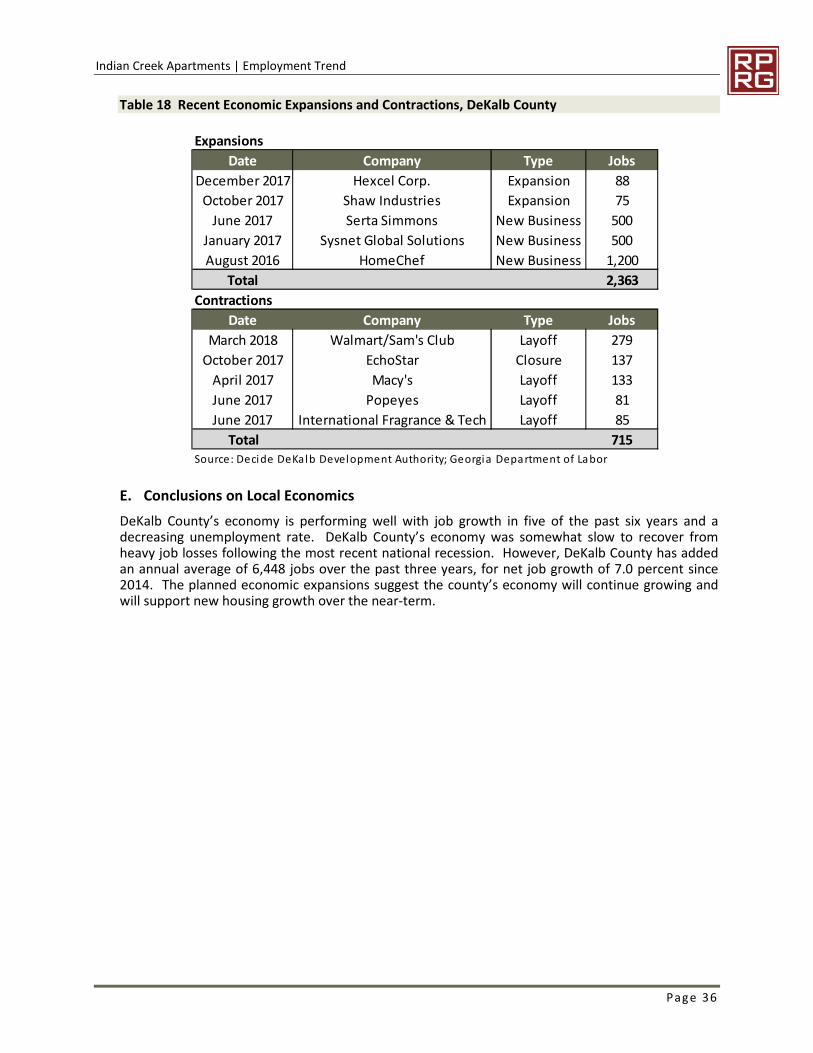
Indian Creek Apartments | Employment Trend
Page 36
Table 18 Recent Economic Expansions and Contractions, DeKalb County
E. Conclusions on Local Economics
DeKalb County’s economy is performing well with job growth in five of the past six years and adecreasing unemployment rate. DeKalb County’s economy was somewhat slow to recover fromheavy job losses following the most recent national recession. However, DeKalb County has addedan annual average of 6,448 jobs over the past three years, for net job growth of 7.0 percent since2014. The planned economic expansions suggest the county’s economy will continue growing andwill support new housing growth over the near-term.
Expansions
Date Company Type Jobs
December 2017 Hexcel Corp. Expansion 88
October 2017 Shaw Industries Expansion 75
June 2017 Serta Simmons New Business 500
January 2017 Sysnet Global Solutions New Business 500
August 2016 HomeChef New Business 1,200
Total 2,363
Contractions
Date Company Type Jobs
March 2018 Walmart/Sam's Club Layoff 279
October 2017 EchoStar Closure 137
April 2017 Macy's Layoff 133
June 2017 Popeyes Layoff 81
June 2017 International Fragrance & Tech Layoff 85
Total 715Source: Decide DeKalb Development Authori ty; Georgia Department of Labor
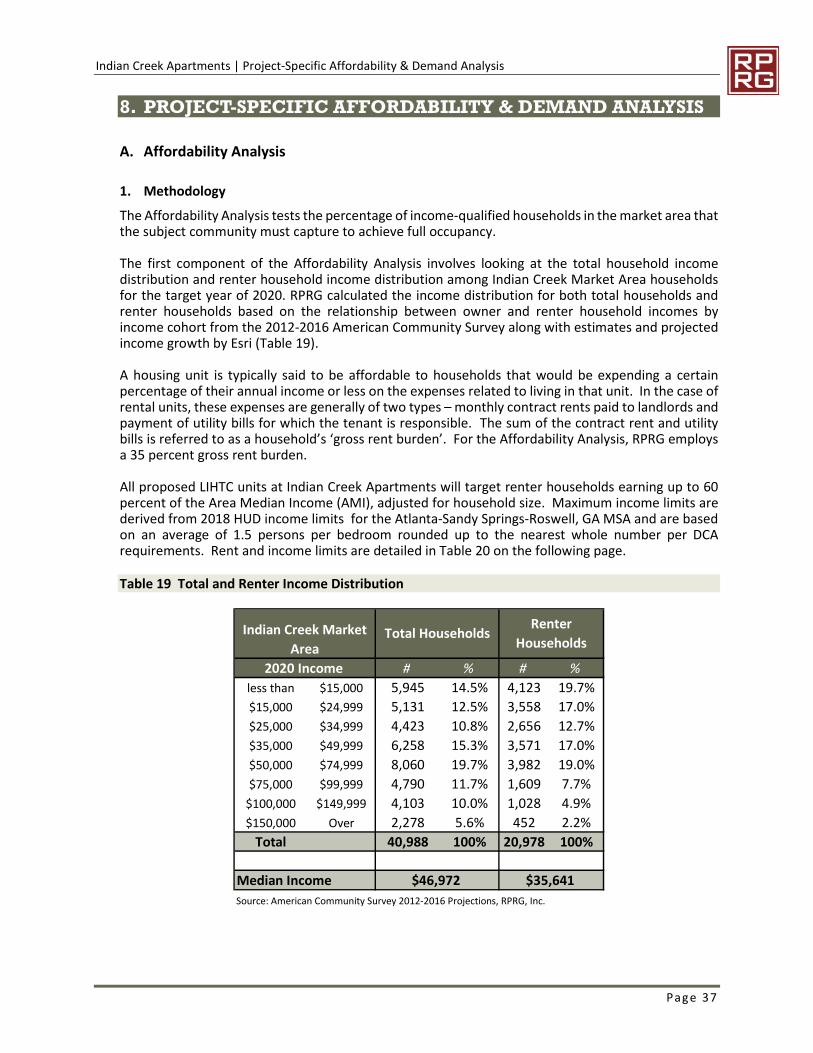
Indian Creek Apartments | Project-Specific Affordability & Demand Analysis
Page 37
8. PROJECT-SPECIFIC AFFORDABILITY & DEMAND ANALYSIS
A. Affordability Analysis
1. Methodology
The Affordability Analysis tests the percentage of income-qualified households in the market area thatthe subject community must capture to achieve full occupancy.
The first component of the Affordability Analysis involves looking at the total household incomedistribution and renter household income distribution among Indian Creek Market Area householdsfor the target year of 2020. RPRG calculated the income distribution for both total households andrenter households based on the relationship between owner and renter household incomes byincome cohort from the 2012-2016 American Community Survey along with estimates and projectedincome growth by Esri (Table 19).
A housing unit is typically said to be affordable to households that would be expending a certainpercentage of their annual income or less on the expenses related to living in that unit. In the case ofrental units, these expenses are generally of two types – monthly contract rents paid to landlords andpayment of utility bills for which the tenant is responsible. The sum of the contract rent and utilitybills is referred to as a household’s ‘gross rent burden’. For the Affordability Analysis, RPRG employsa 35 percent gross rent burden.
All proposed LIHTC units at Indian Creek Apartments will target renter households earning up to 60percent of the Area Median Income (AMI), adjusted for household size. Maximum income limits arederived from 2018 HUD income limits for the Atlanta-Sandy Springs-Roswell, GA MSA and are basedon an average of 1.5 persons per bedroom rounded up to the nearest whole number per DCArequirements. Rent and income limits are detailed in Table 20 on the following page.
Table 19 Total and Renter Income Distribution
2020 Income # % # %
less than $15,000 5,945 14.5% 4,123 19.7%
$15,000 $24,999 5,131 12.5% 3,558 17.0%
$25,000 $34,999 4,423 10.8% 2,656 12.7%
$35,000 $49,999 6,258 15.3% 3,571 17.0%
$50,000 $74,999 8,060 19.7% 3,982 19.0%
$75,000 $99,999 4,790 11.7% 1,609 7.7%
$100,000 $149,999 4,103 10.0% 1,028 4.9%
$150,000 Over 2,278 5.6% 452 2.2%
Total 40,988 100% 20,978 100%
Median Income
Source: American Community Survey 2012-2016 Projections, RPRG, Inc.
Indian Creek Market
Area
$46,972 $35,641
Total HouseholdsRenter
Households

Indian Creek Apartments | Project-Specific Affordability & Demand Analysis
Page 38
Table 20 LIHTC Income and Rent Limits, Atlanta-Sandy Springs-Roswell MSA
2. Affordability Analysis
The steps in the affordability analysis (Table 21) are as follows:
Looking at the three-bedroom units at 60 percent AMI (most common floor plan), the overallshelter cost at the proposed units would be $1,167 ($1,029 net rent plus a $138 allowance tocover all utilities except water/sewer and trash removal).
We determined that a 60 percent three-bedroom unit would be affordable to householdsearning at least $40,011 per year by applying a 35 percent rent burden to this gross rent. Aprojected 23,398 households in the market area will earn at least this amount in 2020.
The maximum income limit for a three-bedroom unit at 60 percent AMI is $46,680 based ona household size of five people. According to the interpolated income distribution for 2020,20,616 households in the Indian Creek Market Area will have incomes exceeding this 60percent LIHTC income limit.
Subtracting the 20,616 households with incomes above the maximum income limit from the23,398 households that could afford to rent this unit, RPRG computes that an estimated 2,782households in the Indian Creek Market Area will fall within the band of affordability for thesubject’s three-bedroom units at 60 percent AMI. The subject property would need to capture4.3 percent of these income-qualified households to absorb the proposed three-bedroomunits at 60 percent AMI.
RPRG next tested the range of qualified households that are currently renters and determinedthat 1,588 renter households are within the income band for a three-bedroom 60 percentAMI unit at the subject property. To absorb the proposed 120 three-bedroom 60 percent AMI
HUD 2018 Median Household IncomeAtlanta-Sandy Springs-Roswell, GA HUD Metro FMR Area $74,800
Very Low Income for 4 Person Household $37,4002018 Computed Area Median Gross Income $74,800
Utility Allowance: $0
$86$112$138
$0
Household Income Limits by Household Size:Household Size 30% 40% 50% 60% 80% 100% 120% 150% 200%
1 Person $15,720 $20,960 $26,200 $31,440 $41,920 $52,400 $62,880 $78,600 $104,800
2 Persons $17,970 $23,960 $29,950 $35,940 $47,920 $59,900 $71,880 $89,850 $119,800
3 Persons $20,220 $26,960 $33,700 $40,440 $53,920 $67,400 $80,880 $101,100 $134,800
4 Persons $22,440 $29,920 $37,400 $44,880 $59,840 $74,800 $89,760 $112,200 $149,600
5 Persons $24,240 $32,320 $40,400 $48,480 $64,640 $80,800 $96,960 $121,200 $161,600
6 Persons $26,040 $34,720 $43,400 $52,080 $69,440 $86,800 $104,160 $130,200 $173,6007 Persons $0 $0 $0 $0 $0 $08 Persons $0 $0 $0 $0 $0 $0
Imputed Income Limits by Number of Bedroom (Assuming 1.5 persons per bedroom):
Persons
# Bed-
rooms 30% 40% 50% 60% 80% 100% 120% 150% 200%
1 0 $15,720 $20,960 $26,200 $31,440 $41,920 $52,400 $62,880 $78,600 $104,800
1.5 1 $16,845 $22,460 $28,075 $33,690 $44,920 $56,150 $67,380 $84,225 $112,300
3 2 $20,220 $26,960 $33,700 $40,440 $53,920 $67,400 $80,880 $101,100 $134,800
4.5 3 $23,340 $31,120 $38,900 $46,680 $62,240 $77,800 $93,360 $116,700 $155,600
6 4 $26,040 $34,720 $43,400 $52,080 $69,440 $86,800 $104,160 $130,200 $173,600
LIHTC Tenant Rent Limits by Number of Bedrooms (assumes 1.5 persons per bedroom:
30% 40% 50% 60% 80%
Gross Net Gross Net Gross Net Gross Net Gross Net
Efficiency $393 $524 $655 $786 $1,048
1 Bedroom $421 $335 $561 $475 $701 $615 $842 $756 $1,123 $1,037
2 Bedroom $505 $393 $674 $562 $842 $730 $1,011 $899 $1,348 $1,236
3 Bedroom $583 $445 $778 $640 $972 $834 $1,167 $1,029 $1,556 $1,418
4 Bedroom $651 $868 $1,085 $1,302 $1,736Source: U.S. Department of Housing and Urban Development
# Persons
Efficiency
1 Bedroom2 Bedroom3 Bedroom4 Bedroom
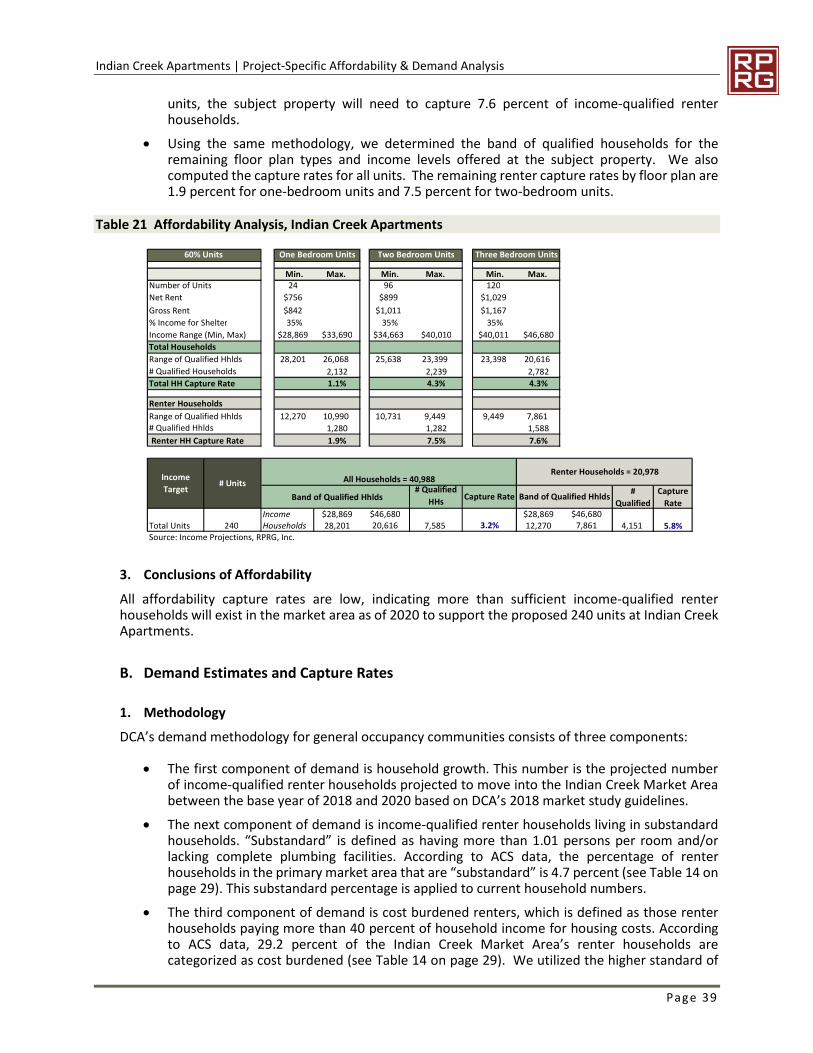
Indian Creek Apartments | Project-Specific Affordability & Demand Analysis
Page 39
units, the subject property will need to capture 7.6 percent of income-qualified renterhouseholds.
Using the same methodology, we determined the band of qualified households for theremaining floor plan types and income levels offered at the subject property. We alsocomputed the capture rates for all units. The remaining renter capture rates by floor plan are1.9 percent for one-bedroom units and 7.5 percent for two-bedroom units.
Table 21 Affordability Analysis, Indian Creek Apartments
3. Conclusions of Affordability
All affordability capture rates are low, indicating more than sufficient income-qualified renterhouseholds will exist in the market area as of 2020 to support the proposed 240 units at Indian CreekApartments.
B. Demand Estimates and Capture Rates
1. Methodology
DCA’s demand methodology for general occupancy communities consists of three components:
The first component of demand is household growth. This number is the projected numberof income-qualified renter households projected to move into the Indian Creek Market Areabetween the base year of 2018 and 2020 based on DCA’s 2018 market study guidelines.
The next component of demand is income-qualified renter households living in substandardhouseholds. “Substandard” is defined as having more than 1.01 persons per room and/orlacking complete plumbing facilities. According to ACS data, the percentage of renterhouseholds in the primary market area that are “substandard” is 4.7 percent (see Table 14 onpage 29). This substandard percentage is applied to current household numbers.
The third component of demand is cost burdened renters, which is defined as those renterhouseholds paying more than 40 percent of household income for housing costs. Accordingto ACS data, 29.2 percent of the Indian Creek Market Area’s renter households arecategorized as cost burdened (see Table 14 on page 29). We utilized the higher standard of
60% Units One Bedroom Units Two Bedroom Units Three Bedroom Units No Data
Min. Max. Min. Max. Min. Max. Min. Max.Number of Units 24 96 120 0
Net Rent $756 $899 $1,029 --
Gross Rent $842 $1,011 $1,167 --
% Income for Shelter 35% 35% 35% 35%
Income Range (Min, Max) $28,869 $33,690 $34,663 $40,010 $40,011 $46,680 na na
Total Households
Range of Qualified Hhlds 28,201 26,068 25,638 23,399 23,398 20,616 0 0
2,132 2,239 2,782 0
Total HH Capture Rate 1.1% 4.3% 4.3% 0
Renter Households
Range of Qualified Hhlds 12,270 10,990 10,731 9,449 9,449 7,861 0 0
1,280 1,282 1,588 0
Renter HH Capture Rate 1.9% 7.5% 7.6% na
Band of Qualified Hhlds# Qualified
HHs#
Qualified
Capture
RateIncome $28,869 $28,869
Total Units 240 Households 28,201 7,585 12,270 4,151 5.8%Source: Income Projections, RPRG, Inc.
# Qualified Households
# Qualified Hhlds
Income
Target# Units
$46,680 $46,68020,616 3.2% 7,861
Renter Households = 20,978All Households = 40,988
Capture Rate Band of Qualified Hhlds
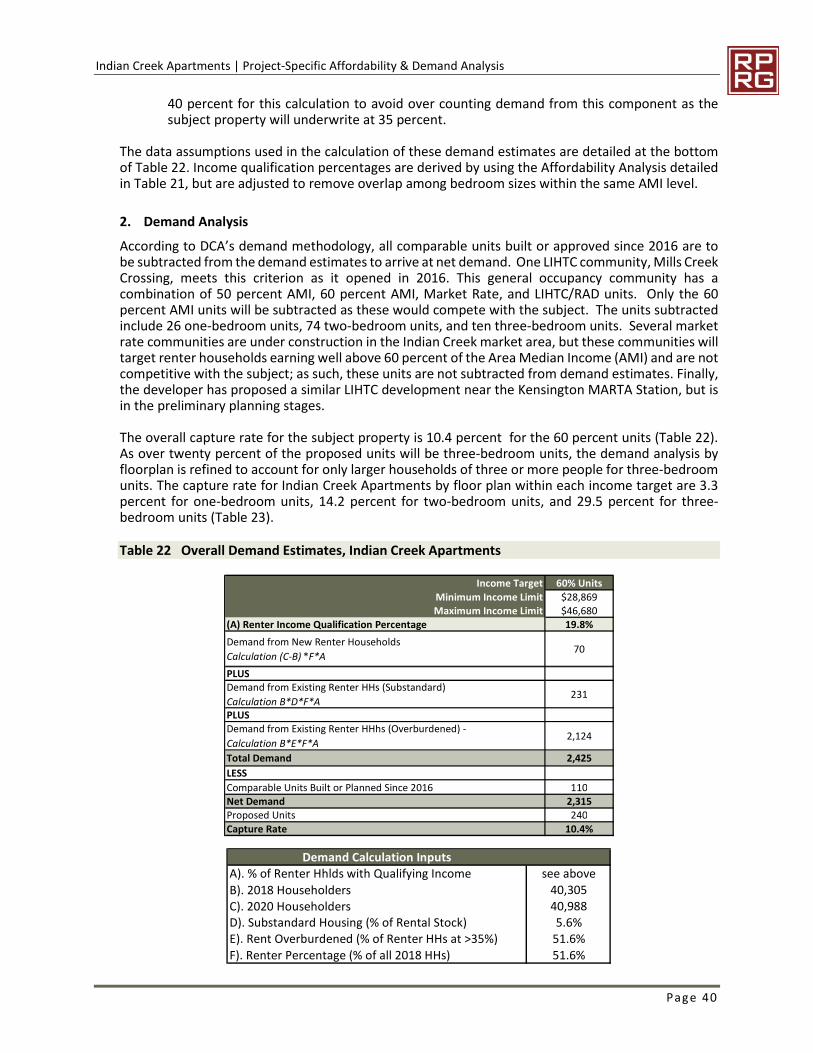
Indian Creek Apartments | Project-Specific Affordability & Demand Analysis
Page 40
40 percent for this calculation to avoid over counting demand from this component as thesubject property will underwrite at 35 percent.
The data assumptions used in the calculation of these demand estimates are detailed at the bottomof Table 22. Income qualification percentages are derived by using the Affordability Analysis detailedin Table 21, but are adjusted to remove overlap among bedroom sizes within the same AMI level.
2. Demand Analysis
According to DCA’s demand methodology, all comparable units built or approved since 2016 are tobe subtracted from the demand estimates to arrive at net demand. One LIHTC community, Mills CreekCrossing, meets this criterion as it opened in 2016. This general occupancy community has acombination of 50 percent AMI, 60 percent AMI, Market Rate, and LIHTC/RAD units. Only the 60percent AMI units will be subtracted as these would compete with the subject. The units subtractedinclude 26 one-bedroom units, 74 two-bedroom units, and ten three-bedroom units. Several marketrate communities are under construction in the Indian Creek market area, but these communities willtarget renter households earning well above 60 percent of the Area Median Income (AMI) and are notcompetitive with the subject; as such, these units are not subtracted from demand estimates. Finally,the developer has proposed a similar LIHTC development near the Kensington MARTA Station, but isin the preliminary planning stages.
The overall capture rate for the subject property is 10.4 percent for the 60 percent units (Table 22).As over twenty percent of the proposed units will be three-bedroom units, the demand analysis byfloorplan is refined to account for only larger households of three or more people for three-bedroomunits. The capture rate for Indian Creek Apartments by floor plan within each income target are 3.3percent for one-bedroom units, 14.2 percent for two-bedroom units, and 29.5 percent for three-bedroom units (Table 23).
Table 22 Overall Demand Estimates, Indian Creek Apartments
Income Target 60% Units
Minimum Income Limit $28,869Maximum Income Limit $46,680
(A) Renter Income Qualification Percentage 19.8%
Demand from New Renter Households
Calculation (C-B) *F*A70
PLUSDemand from Existing Renter HHs (Substandard)
Calculation B*D*F*A231
PLUSDemand from Existing Renter HHhs (Overburdened) -
Calculation B*E*F*A2,124
Total Demand 2,425
LESS
Comparable Units Built or Planned Since 2016 110Net Demand 2,315Proposed Units 240
Capture Rate 10.4%
Demand Calculation InputsA). % of Renter Hhlds with Qualifying Income see above
B). 2018 Householders 40,305C). 2020 Householders 40,988D). Substandard Housing (% of Rental Stock) 5.6%E). Rent Overburdened (% of Renter HHs at >35%) 51.6%F). Renter Percentage (% of all 2018 HHs) 51.6%
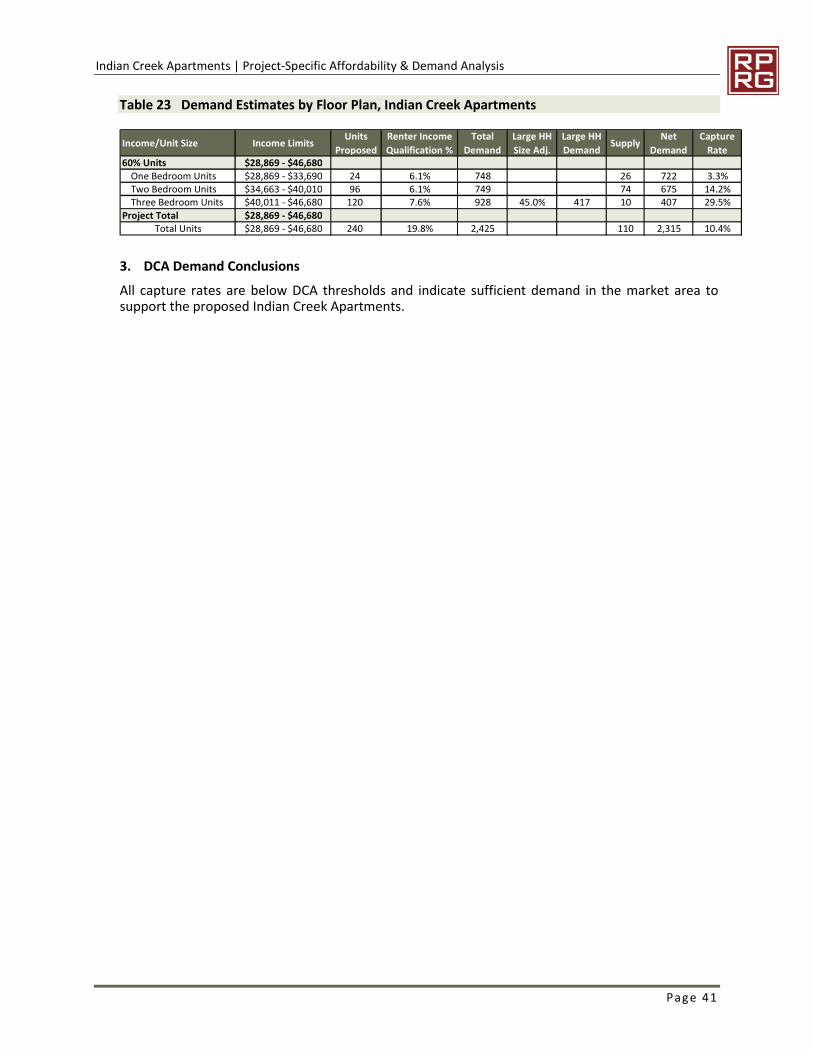
Indian Creek Apartments | Project-Specific Affordability & Demand Analysis
Page 41
Table 23 Demand Estimates by Floor Plan, Indian Creek Apartments
3. DCA Demand Conclusions
All capture rates are below DCA thresholds and indicate sufficient demand in the market area tosupport the proposed Indian Creek Apartments.
Income/Unit Size Income LimitsUnits
Proposed
Renter Income
Qualification %
Total
Demand
Large HH
Size Adj.
Large HH
DemandSupply
Net
Demand
Capture
Rate60% Units $28,869 - $46,680
One Bedroom Units $28,869 - $33,690 24 6.1% 748 26 722 3.3%Two Bedroom Units $34,663 - $40,010 96 6.1% 749 74 675 14.2%Three Bedroom Units $40,011 - $46,680 120 7.6% 928 45.0% 417 10 407 29.5%
Project Total $28,869 - $46,680Total Units $28,869 - $46,680 240 19.8% 2,425 110 2,315 10.4%
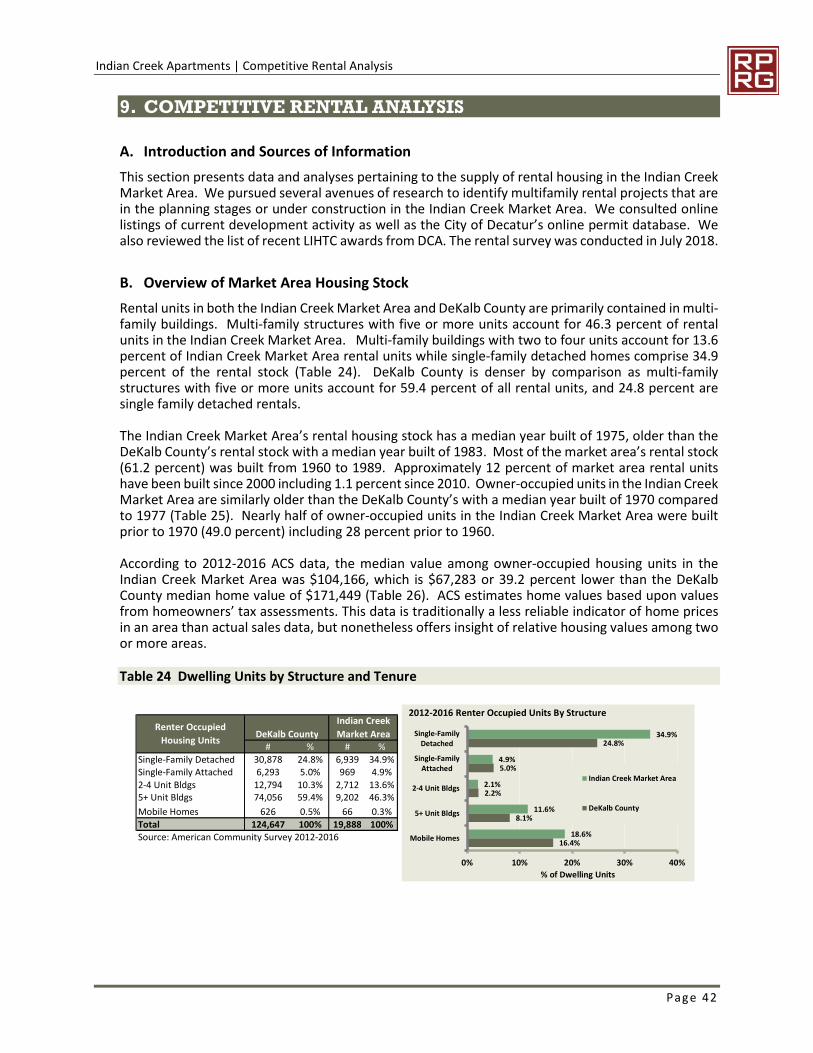
Indian Creek Apartments | Competitive Rental Analysis
Page 42
9. COMPETITIVE RENTAL ANALYSIS
A. Introduction and Sources of Information
This section presents data and analyses pertaining to the supply of rental housing in the Indian CreekMarket Area. We pursued several avenues of research to identify multifamily rental projects that arein the planning stages or under construction in the Indian Creek Market Area. We consulted onlinelistings of current development activity as well as the City of Decatur’s online permit database. Wealso reviewed the list of recent LIHTC awards from DCA. The rental survey was conducted in July 2018.
B. Overview of Market Area Housing Stock
Rental units in both the Indian Creek Market Area and DeKalb County are primarily contained in multi-family buildings. Multi-family structures with five or more units account for 46.3 percent of rentalunits in the Indian Creek Market Area. Multi-family buildings with two to four units account for 13.6percent of Indian Creek Market Area rental units while single-family detached homes comprise 34.9percent of the rental stock (Table 24). DeKalb County is denser by comparison as multi-familystructures with five or more units account for 59.4 percent of all rental units, and 24.8 percent aresingle family detached rentals.
The Indian Creek Market Area’s rental housing stock has a median year built of 1975, older than theDeKalb County’s rental stock with a median year built of 1983. Most of the market area’s rental stock(61.2 percent) was built from 1960 to 1989. Approximately 12 percent of market area rental unitshave been built since 2000 including 1.1 percent since 2010. Owner-occupied units in the Indian CreekMarket Area are similarly older than the DeKalb County’s with a median year built of 1970 comparedto 1977 (Table 25). Nearly half of owner-occupied units in the Indian Creek Market Area were builtprior to 1970 (49.0 percent) including 28 percent prior to 1960.
According to 2012-2016 ACS data, the median value among owner-occupied housing units in theIndian Creek Market Area was $104,166, which is $67,283 or 39.2 percent lower than the DeKalbCounty median home value of $171,449 (Table 26). ACS estimates home values based upon valuesfrom homeowners’ tax assessments. This data is traditionally a less reliable indicator of home pricesin an area than actual sales data, but nonetheless offers insight of relative housing values among twoor more areas.
Table 24 Dwelling Units by Structure and Tenure
DeKalb County
Indian Creek
Market Area# % # %
Single-Family Detached 30,878 24.8% 6,939 34.9%Single-Family Attached 6,293 5.0% 969 4.9%
2-4 Unit Bldgs 12,794 10.3% 2,712 13.6%5+ Unit Bldgs 74,056 59.4% 9,202 46.3%
Mobile Homes 626 0.5% 66 0.3%Total 124,647 100% 19,888 100%Source: American Community Survey 2012-2016
Renter Occupied
Housing Units34.9%
4.9%
2.1%
11.6%
18.6%
24.8%
5.0%
2.2%
8.1%
16.4%
0% 10% 20% 30% 40%
Single-FamilyDetached
Single-FamilyAttached
2-4 Unit Bldgs
5+ Unit Bldgs
Mobile Homes
% of Dwelling Units
2012-2016 Renter Occupied Units By Structure
Indian Creek Market Area
DeKalb County
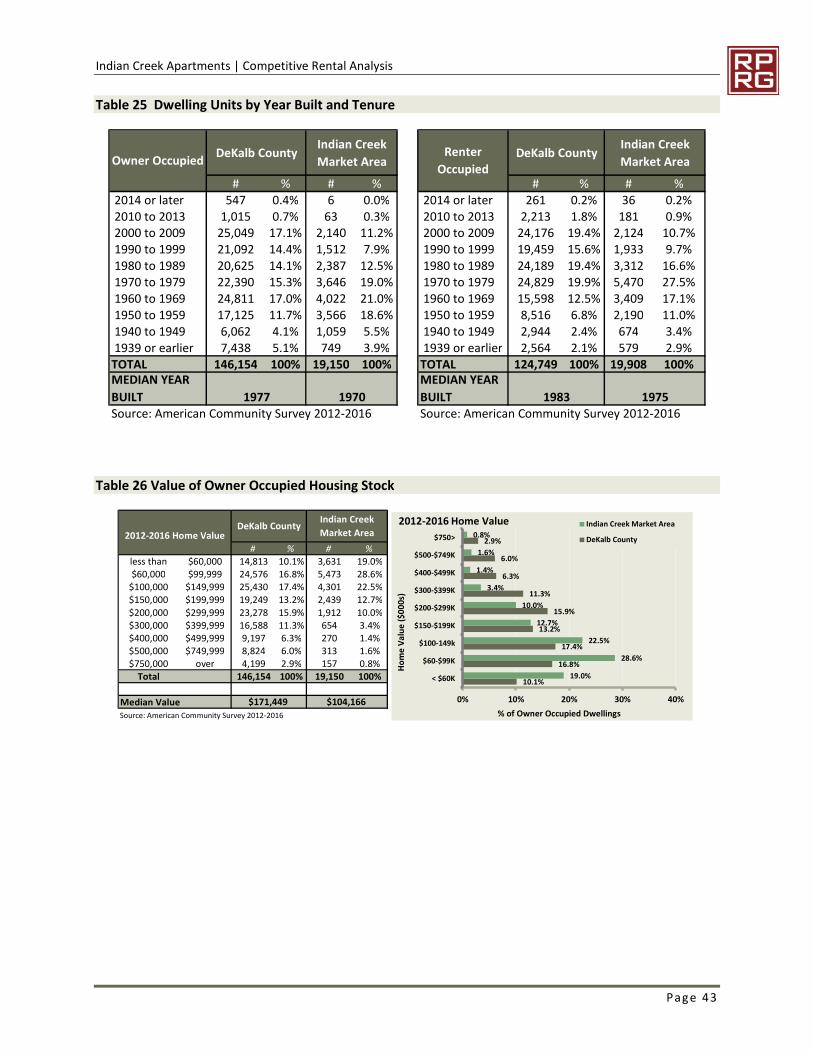
Indian Creek Apartments | Competitive Rental Analysis
Page 43
Table 25 Dwelling Units by Year Built and Tenure
Table 26 Value of Owner Occupied Housing Stock
DeKalb CountyIndian Creek
Market AreaDeKalb County
Indian Creek
Market Area
# % # % # % # %2014 or later 547 0.4% 6 0.0% 2014 or later 261 0.2% 36 0.2%2010 to 2013 1,015 0.7% 63 0.3% 2010 to 2013 2,213 1.8% 181 0.9%2000 to 2009 25,049 17.1% 2,140 11.2% 2000 to 2009 24,176 19.4% 2,124 10.7%1990 to 1999 21,092 14.4% 1,512 7.9% 1990 to 1999 19,459 15.6% 1,933 9.7%1980 to 1989 20,625 14.1% 2,387 12.5% 1980 to 1989 24,189 19.4% 3,312 16.6%1970 to 1979 22,390 15.3% 3,646 19.0% 1970 to 1979 24,829 19.9% 5,470 27.5%1960 to 1969 24,811 17.0% 4,022 21.0% 1960 to 1969 15,598 12.5% 3,409 17.1%1950 to 1959 17,125 11.7% 3,566 18.6% 1950 to 1959 8,516 6.8% 2,190 11.0%1940 to 1949 6,062 4.1% 1,059 5.5% 1940 to 1949 2,944 2.4% 674 3.4%1939 or earlier 7,438 5.1% 749 3.9% 1939 or earlier 2,564 2.1% 579 2.9%
TOTAL 146,154 100% 19,150 100% TOTAL 124,749 100% 19,908 100%MEDIAN YEAR
BUILT 1977 1970
MEDIAN YEAR
BUILT 1983 1975Source: American Community Survey 2012-2016 Source: American Community Survey 2012-2016
Owner OccupiedRenter
Occupied
# % # %less than $60,000 14,813 10.1% 3,631 19.0%$60,000 $99,999 24,576 16.8% 5,473 28.6%
$100,000 $149,999 25,430 17.4% 4,301 22.5%$150,000 $199,999 19,249 13.2% 2,439 12.7%
$200,000 $299,999 23,278 15.9% 1,912 10.0%$300,000 $399,999 16,588 11.3% 654 3.4%$400,000 $499,999 9,197 6.3% 270 1.4%$500,000 $749,999 8,824 6.0% 313 1.6%$750,000 over 4,199 2.9% 157 0.8%
Total 146,154 100% 19,150 100%
Median ValueSource: American Community Survey 2012-2016
2012-2016 Home ValueDeKalb County
Indian Creek
Market Area
$171,449 $104,166
10.1%
16.8%
17.4%
13.2%
15.9%
11.3%
6.3%
6.0%
2.9%
19.0%
28.6%
22.5%
12.7%
10.0%
3.4%
1.4%
1.6%
0.8%
0% 10% 20% 30% 40%
< $60K
$60-$99K
$100-149k
$150-$199K
$200-$299K
$300-$399K
$400-$499K
$500-$749K
$750>
% of Owner Occupied Dwellings
Ho
me
Val
ue
($0
00s
)
2012-2016 Home Value Indian Creek Market Area
DeKalb County
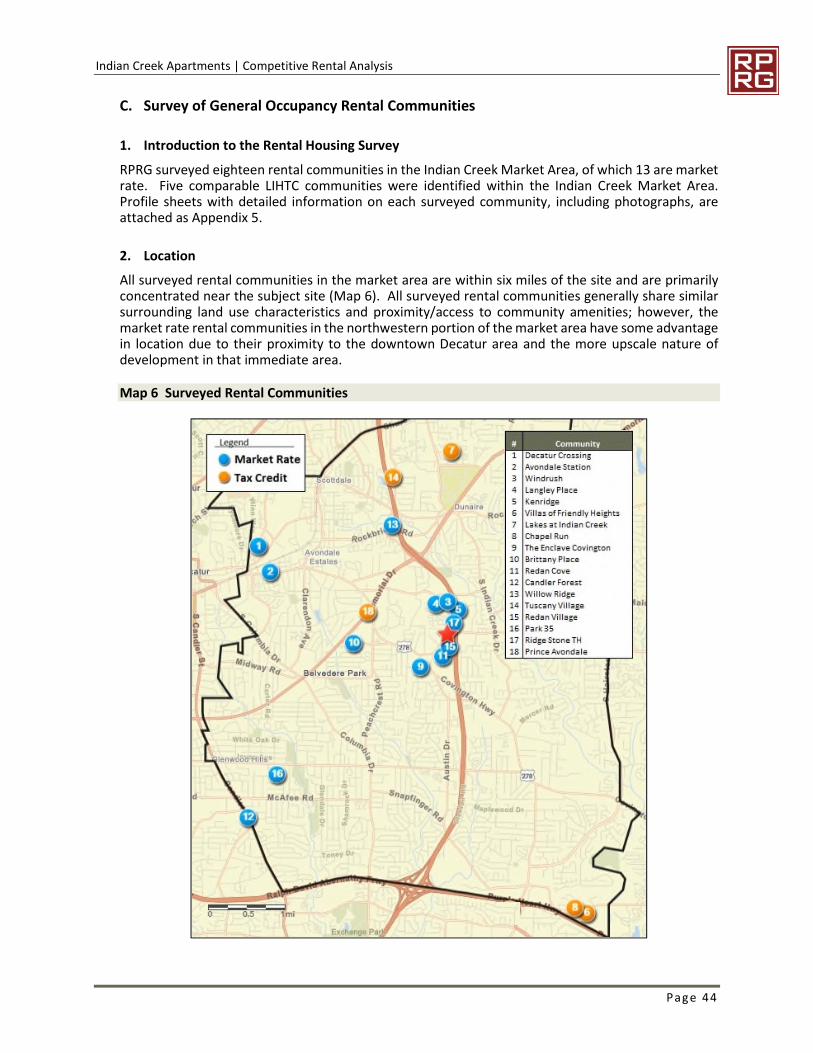
Indian Creek Apartments | Competitive Rental Analysis
Page 44
C. Survey of General Occupancy Rental Communities
1. Introduction to the Rental Housing Survey
RPRG surveyed eighteen rental communities in the Indian Creek Market Area, of which 13 are marketrate. Five comparable LIHTC communities were identified within the Indian Creek Market Area.Profile sheets with detailed information on each surveyed community, including photographs, areattached as Appendix 5.
2. Location
All surveyed rental communities in the market area are within six miles of the site and are primarilyconcentrated near the subject site (Map 6). All surveyed rental communities generally share similarsurrounding land use characteristics and proximity/access to community amenities; however, themarket rate rental communities in the northwestern portion of the market area have some advantagein location due to their proximity to the downtown Decatur area and the more upscale nature ofdevelopment in that immediate area.
Map 6 Surveyed Rental Communities
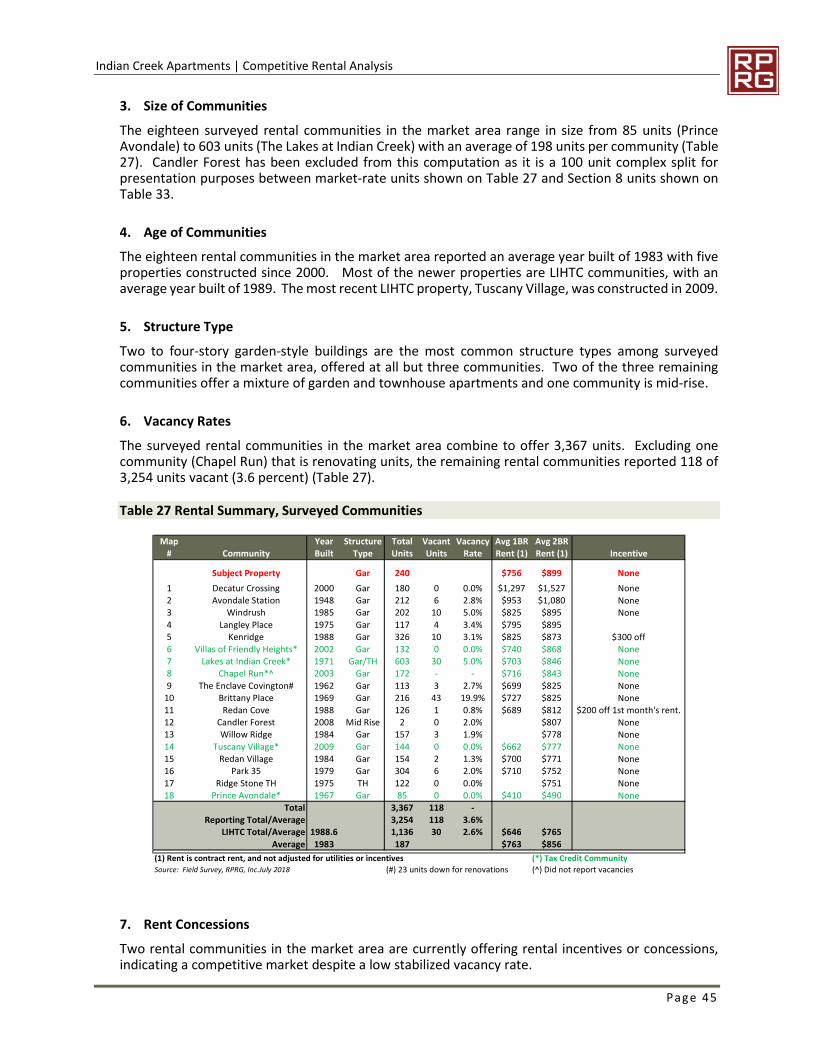
Indian Creek Apartments | Competitive Rental Analysis
Page 45
3. Size of Communities
The eighteen surveyed rental communities in the market area range in size from 85 units (PrinceAvondale) to 603 units (The Lakes at Indian Creek) with an average of 198 units per community (Table27). Candler Forest has been excluded from this computation as it is a 100 unit complex split forpresentation purposes between market-rate units shown on Table 27 and Section 8 units shown onTable 33.
4. Age of Communities
The eighteen rental communities in the market area reported an average year built of 1983 with fiveproperties constructed since 2000. Most of the newer properties are LIHTC communities, with anaverage year built of 1989. The most recent LIHTC property, Tuscany Village, was constructed in 2009.
5. Structure Type
Two to four-story garden-style buildings are the most common structure types among surveyedcommunities in the market area, offered at all but three communities. Two of the three remainingcommunities offer a mixture of garden and townhouse apartments and one community is mid-rise.
6. Vacancy Rates
The surveyed rental communities in the market area combine to offer 3,367 units. Excluding onecommunity (Chapel Run) that is renovating units, the remaining rental communities reported 118 of3,254 units vacant (3.6 percent) (Table 27).
Table 27 Rental Summary, Surveyed Communities
7. Rent Concessions
Two rental communities in the market area are currently offering rental incentives or concessions,indicating a competitive market despite a low stabilized vacancy rate.
Map Year Structure Total Vacant Vacancy Avg 1BR Avg 2BR# Community Built Type Units Units Rate Rent (1) Rent (1) Incentive
Subject Property Gar 240 $756 $899 None
1 Decatur Crossing 2000 Gar 180 0 0.0% $1,297 $1,527 None2 Avondale Station 1948 Gar 212 6 2.8% $953 $1,080 None3 Windrush 1985 Gar 202 10 5.0% $825 $895 None4 Langley Place 1975 Gar 117 4 3.4% $795 $8955 Kenridge 1988 Gar 326 10 3.1% $825 $873 $300 off6 Villas of Friendly Heights* 2002 Gar 132 0 0.0% $740 $868 None7 Lakes at Indian Creek* 1971 Gar/TH 603 30 5.0% $703 $846 None8 Chapel Run*^ 2003 Gar 172 - - $716 $843 None9 The Enclave Covington# 1962 Gar 113 3 2.7% $699 $825 None
10 Brittany Place 1969 Gar 216 43 19.9% $727 $825 None11 Redan Cove 1988 Gar 126 1 0.8% $689 $812 $200 off 1st month's rent.12 Candler Forest 2008 Mid Rise 2 0 2.0% $807 None13 Willow Ridge 1984 Gar 157 3 1.9% $778 None14 Tuscany Village* 2009 Gar 144 0 0.0% $662 $777 None15 Redan Village 1984 Gar 154 2 1.3% $700 $771 None16 Park 35 1979 Gar 304 6 2.0% $710 $752 None17 Ridge Stone TH 1975 TH 122 0 0.0% $751 None18 Prince Avondale* 1967 Gar 85 0 0.0% $410 $490 None
Total 3,367 118 -Reporting Total/Average 3,254 118 3.6%
LIHTC Total/Average 1988.6 1,136 30 2.6% $646 $765
Average 1983 187 $763 $856
(1) Rent is contract rent, and not adjusted for utilities or incentives (*) Tax Credit CommunitySource: Field Survey, RPRG, Inc.July 2018 (#) 23 units down for renovations (^) Did not report vacancies
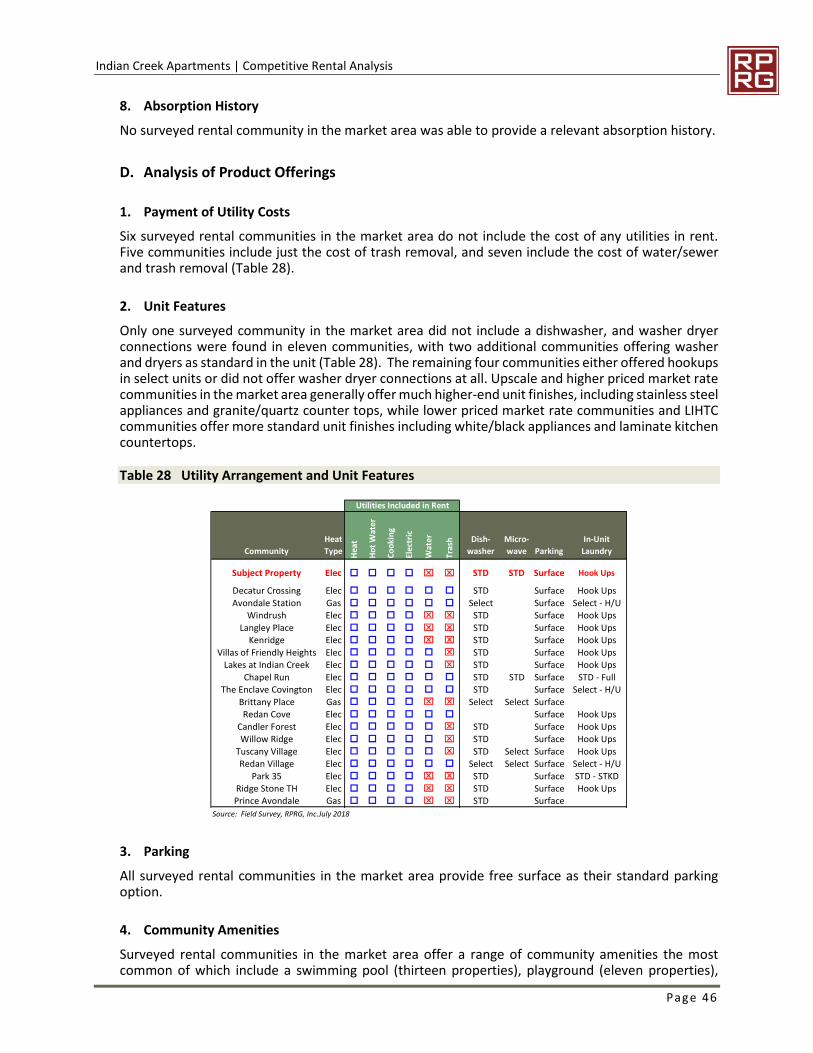
Indian Creek Apartments | Competitive Rental Analysis
Page 46
8. Absorption History
No surveyed rental community in the market area was able to provide a relevant absorption history.
D. Analysis of Product Offerings
1. Payment of Utility Costs
Six surveyed rental communities in the market area do not include the cost of any utilities in rent.Five communities include just the cost of trash removal, and seven include the cost of water/sewerand trash removal (Table 28).
2. Unit Features
Only one surveyed community in the market area did not include a dishwasher, and washer dryerconnections were found in eleven communities, with two additional communities offering washerand dryers as standard in the unit (Table 28). The remaining four communities either offered hookupsin select units or did not offer washer dryer connections at all. Upscale and higher priced market ratecommunities in the market area generally offer much higher-end unit finishes, including stainless steelappliances and granite/quartz counter tops, while lower priced market rate communities and LIHTCcommunities offer more standard unit finishes including white/black appliances and laminate kitchencountertops.
Table 28 Utility Arrangement and Unit Features
3. Parking
All surveyed rental communities in the market area provide free surface as their standard parkingoption.
4. Community Amenities
Surveyed rental communities in the market area offer a range of community amenities the mostcommon of which include a swimming pool (thirteen properties), playground (eleven properties),
Community
Heat
Type Hea
t
Ho
tW
ate
r
Co
oki
ng
Ele
ctri
c
Wat
er
Tra
sh Dish-
washer
Micro-
wave Parking
In-Unit
Laundry
Subject Property Elec o o o o x x STD STD Surface Hook Ups
Decatur Crossing Elec o o o o o o STD Surface Hook Ups
Avondale Station Gas o o o o o o Select Surface Select - H/UWindrush Elec o o o o x x STD Surface Hook Ups
Langley Place Elec o o o o x x STD Surface Hook UpsKenridge Elec o o o o x x STD Surface Hook Ups
Villas of Friendly Heights Elec o o o o o x STD Surface Hook UpsLakes at Indian Creek Elec o o o o o x STD Surface Hook Ups
Chapel Run Elec o o o o o o STD STD Surface STD - FullThe Enclave Covington Elec o o o o o o STD Surface Select - H/U
Brittany Place Gas o o o o x x Select Select SurfaceRedan Cove Elec o o o o o o Surface Hook Ups
Candler Forest Elec o o o o o x STD Surface Hook UpsWillow Ridge Elec o o o o o x STD Surface Hook Ups
Tuscany Village Elec o o o o o x STD Select Surface Hook UpsRedan Village Elec o o o o o o Select Select Surface Select - H/U
Park 35 Elec o o o o x x STD Surface STD - STKDRidge Stone TH Elec o o o o x x STD Surface Hook UpsPrince Avondale Gas o o o o x x STD Surface
Source: Field Survey, RPRG, Inc.July 2018
Utilities Included in Rent
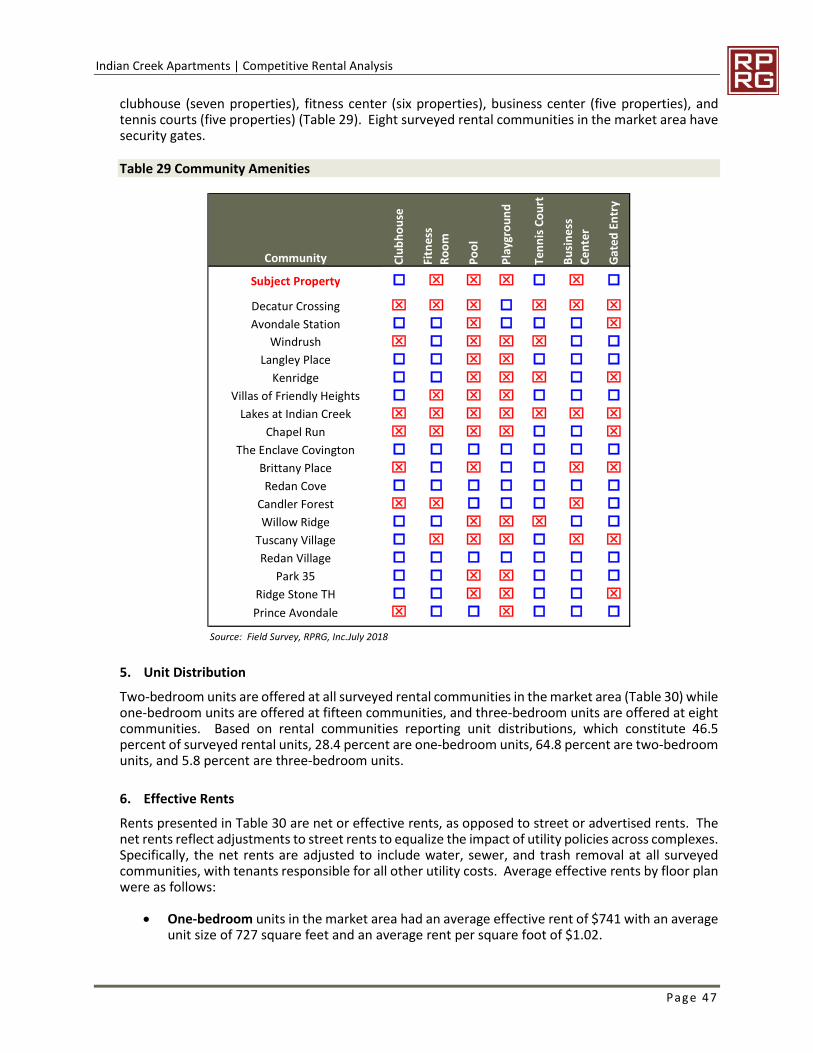
Indian Creek Apartments | Competitive Rental Analysis
Page 47
clubhouse (seven properties), fitness center (six properties), business center (five properties), andtennis courts (five properties) (Table 29). Eight surveyed rental communities in the market area havesecurity gates.
Table 29 Community Amenities
5. Unit Distribution
Two-bedroom units are offered at all surveyed rental communities in the market area (Table 30) whileone-bedroom units are offered at fifteen communities, and three-bedroom units are offered at eightcommunities. Based on rental communities reporting unit distributions, which constitute 46.5percent of surveyed rental units, 28.4 percent are one-bedroom units, 64.8 percent are two-bedroomunits, and 5.8 percent are three-bedroom units.
6. Effective Rents
Rents presented in Table 30 are net or effective rents, as opposed to street or advertised rents. Thenet rents reflect adjustments to street rents to equalize the impact of utility policies across complexes.Specifically, the net rents are adjusted to include water, sewer, and trash removal at all surveyedcommunities, with tenants responsible for all other utility costs. Average effective rents by floor planwere as follows:
One-bedroom units in the market area had an average effective rent of $741 with an averageunit size of 727 square feet and an average rent per square foot of $1.02.
Community Clu
bh
ou
se
Fitn
ess
Ro
om
Po
ol
Pla
ygro
un
d
Ten
nis
Co
urt
Bu
sin
ess
Ce
nte
r
Gat
edEn
try
Subject Property o x x x o x o
Decatur Crossing x x x o x x xAvondale Station o o x o o o x
Windrush x o x x x o oLangley Place o o x x o o o
Kenridge o o x x x o xVillas of Friendly Heights o x x x o o o
Lakes at Indian Creek x x x x x x xChapel Run x x x x o o x
The Enclave Covington o o o o o o oBrittany Place x o x o o x xRedan Cove o o o o o o o
Candler Forest x x o o o x oWillow Ridge o o x x x o o
Tuscany Village o x x x o x xRedan Village o o o o o o o
Park 35 o o x x o o oRidge Stone TH o o x x o o xPrince Avondale x o o x o o o
Source: Field Survey, RPRG, Inc.July 2018

Indian Creek Apartments | Competitive Rental Analysis
Page 48
Two-bedroom units in the market area had an average effective rent of $849 with an averageunit size of 985 square feet and an average rent per square foot of $0.86.
Three-bedroom units in the market area had an average effective rent of $1,075 with anaverage unit size of 1,277 square feet and an average rent per square foot of $0.84.
Table 30 Unit Distribution, Size, and Pricing
7. Scattered Site Rentals
Approximately 35 percent of the rental housing stock in the Indian Creek market area is single familydetached, as compared to 25 percent for DeKalb County. As shown on Table 24, approximately one-third of all rental dwellings in the Indian Creek market area were constructed prior to 1970, and three-quarters constructed prior to 1990. While there is a strong supply of single family homes for rent, thishousing stock is generally much older and unlikely to compete directly with new construction.Additionally, all of the proposed units will be rent and income restricted, targeting households at orbelow 60 percent of the Area Median Income (AMI).
8. DCA Average Market Rent
To determine average “market rents” as outlined in DCA’s 2018 Market Study Manual, market raterents were averaged at the most comparable communities to the proposed Indian Creek Apartments.We eliminated several market rate rental communities to represent the most comparablecommunities to the proposed Indian Creek Apartments. It is important to note, “average marketrents” are not adjusted to reflect differences in age, unit size, or amenities relative to the subjectproperty. LIHTC rents are not utilized in this calculation.
The “average market rent” is $868 for one-bedroom units, $1,007 for two-bedroom units, and $1,155for three-bedroom units (Table 31). The subject property’s proposed 60 percent AMI LIHTC rents areall below these averages and the project has a weighted average LIHTC market advantage of 11.0
Total One Bedroom Units Two Bedroom Units Three Bedroom UnitsCommunity Units Units Rent(1) SF Rent/SF Units Rent(1) SF Rent/SF Units Rent(1) SF Rent/SF
Subject Property 240 24 $756 850 $0.89 96 $899 1,070 $0.84 120 $1,029 1,180 $0.87
Decatur Crossing 180 84 $1,322 859 $1.54 84 $1,557 1,188 $1.31 12 $1,820 1,384 $1.32Avondale Station 212 28 $978 875 $1.12 184 $1,110 1,075 $1.03
Tuscany Village 44 22 $810 770 $1.05 22 $970 1,016 $0.95Windrush 202 $825 688 $1.20 $895 906 $0.99 $1,025 1,219 $0.84
Langley Place 117 $795 600 $1.33 $895 900 $0.99Villas of Friendly Heights 60% AMI/MKT* 132 $755 740 $1.02 $888 982 $0.90 $1,009 1,212 $0.83
Lakes at Indian Creek - $739 657 $1.12 $886 947 $0.94 $1,009 1,260 $0.80Chapel Run 60% AMI* 172 36 $741 835 $0.89 88 $873 1,087 $0.80 36 $994 1,227 $0.81
Tuscany Village 60% AMI* 48 24 $731 770 $0.95 24 $863 1,016 $0.85The Enclave Covington 113 40 $724 780 $0.93 85 $855 888 $0.96 11 $910 1,200 $0.76
Kenridge 326 $800 700 $1.14 $848 955 $0.89Lakes at Indian Creek 60% AMI* 603 $697 657 $1.06 $845 947 $0.89
Park 35 304 40 $710 705 $1.01 224 $832 853 $0.97 32 $1,004 1,260 $0.80
Candler Forest 2 2 $827 1,008 $0.82Redan Cove 126 26 $697 576 $1.21 98 $825 864 $0.96
Brittany Place 216 $727 940 $0.77 $825 1,140 $0.72Redan Village^ 154 119 $725 539 $1.35 20 $801 864 $0.93
Willow Ridge 157 157 $798 980 $0.81Ridge Stone TH 122 $751 1,200 $0.63 $826 1,450 $0.57
Tuscany Village 50% AMI* 37 19 $590 770 $0.77 18 $694 1,016 $0.68Prince Avondale 60% AMI* 85 $410 574 $0.71 $490 820 $0.60
Tuscany Village 30% AMI* 15 7 $310 770 $0.40 8 $357 1,016 $0.35Total/Average 3,367 $741 727 $1.02 $849 985 $0.86 $1,075 1,277 $0.84
Unit Distribution 1,565 445 1,014 91% of Total 46.5% 28.4% 64.8% 5.8%
(1) Rent is adjusted to include water/sewer, trash, and Incentives (*) Tax Credit Community (^) Has 15 EFF units, $533 / 288SF
Source: Field Survey, RPRG, Inc.July 2018
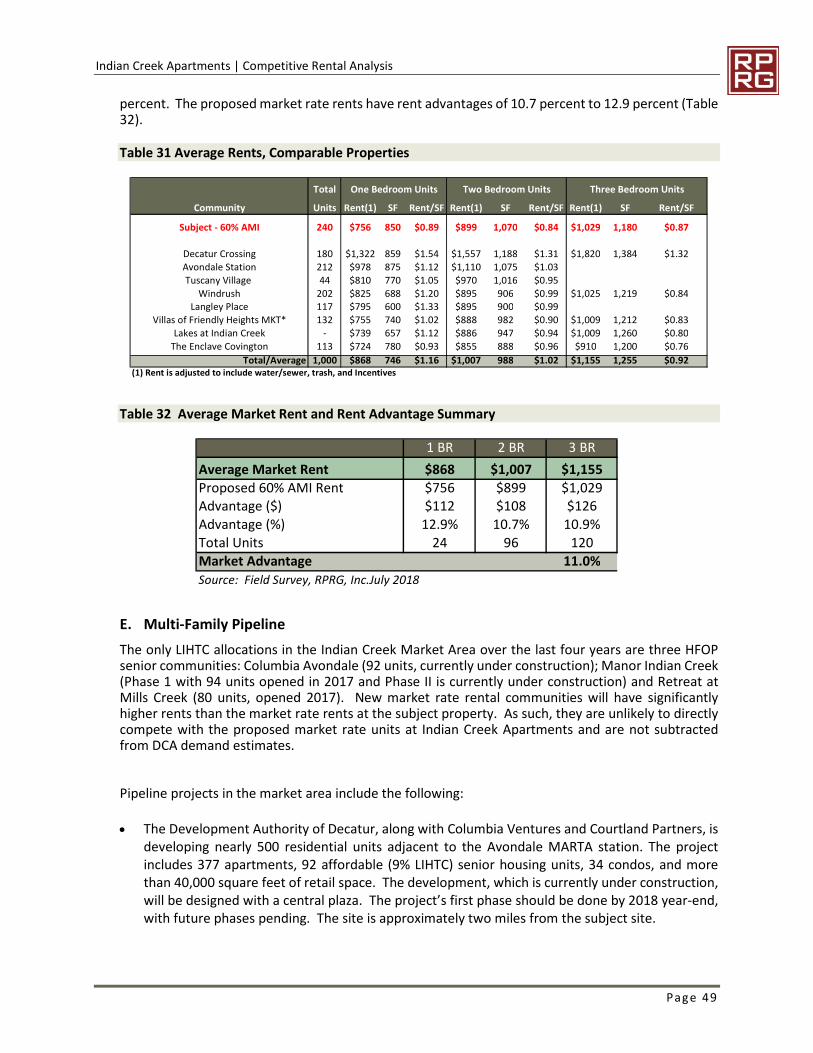
Indian Creek Apartments | Competitive Rental Analysis
Page 49
percent. The proposed market rate rents have rent advantages of 10.7 percent to 12.9 percent (Table32).
Table 31 Average Rents, Comparable Properties
Table 32 Average Market Rent and Rent Advantage Summary
E. Multi-Family Pipeline
The only LIHTC allocations in the Indian Creek Market Area over the last four years are three HFOPsenior communities: Columbia Avondale (92 units, currently under construction); Manor Indian Creek(Phase 1 with 94 units opened in 2017 and Phase II is currently under construction) and Retreat atMills Creek (80 units, opened 2017). New market rate rental communities will have significantlyhigher rents than the market rate rents at the subject property. As such, they are unlikely to directlycompete with the proposed market rate units at Indian Creek Apartments and are not subtractedfrom DCA demand estimates.
Pipeline projects in the market area include the following:
The Development Authority of Decatur, along with Columbia Ventures and Courtland Partners, isdeveloping nearly 500 residential units adjacent to the Avondale MARTA station. The projectincludes 377 apartments, 92 affordable (9% LIHTC) senior housing units, 34 condos, and morethan 40,000 square feet of retail space. The development, which is currently under construction,will be designed with a central plaza. The project’s first phase should be done by 2018 year-end,with future phases pending. The site is approximately two miles from the subject site.
Total One Bedroom Units Three Bedroom Units
Community Units Rent(1) SF Rent/SF Rent(1) SF Rent/SF Rent(1) SF Rent/SF
Subject - 60% AMI 240 $756 850 $0.89 $899 1,070 $0.84 $1,029 1,180 $0.87
Decatur Crossing 180 $1,322 859 $1.54 $1,557 1,188 $1.31 $1,820 1,384 $1.32
Avondale Station 212 $978 875 $1.12 $1,110 1,075 $1.03
Tuscany Village 44 $810 770 $1.05 $970 1,016 $0.95
Windrush 202 $825 688 $1.20 $895 906 $0.99 $1,025 1,219 $0.84Langley Place 117 $795 600 $1.33 $895 900 $0.99
Villas of Friendly Heights MKT* 132 $755 740 $1.02 $888 982 $0.90 $1,009 1,212 $0.83
Lakes at Indian Creek - $739 657 $1.12 $886 947 $0.94 $1,009 1,260 $0.80
The Enclave Covington 113 $724 780 $0.93 $855 888 $0.96 $910 1,200 $0.76
Total/Average 1,000 $868 746 $1.16 $1,007 988 $1.02 $1,155 1,255 $0.92(1) Rent is adjusted to include water/sewer, trash, and Incentives
Two Bedroom Units
1 BR 2 BR 3 BR
Average Market Rent $868 $1,007 $1,155
Proposed 60% AMI Rent $756 $899 $1,029Advantage ($) $112 $108 $126
Advantage (%) 12.9% 10.7% 10.9%
Total Units 24 96 120
Market Advantage 11.0%
Source: Field Survey, RPRG, Inc.July 2018
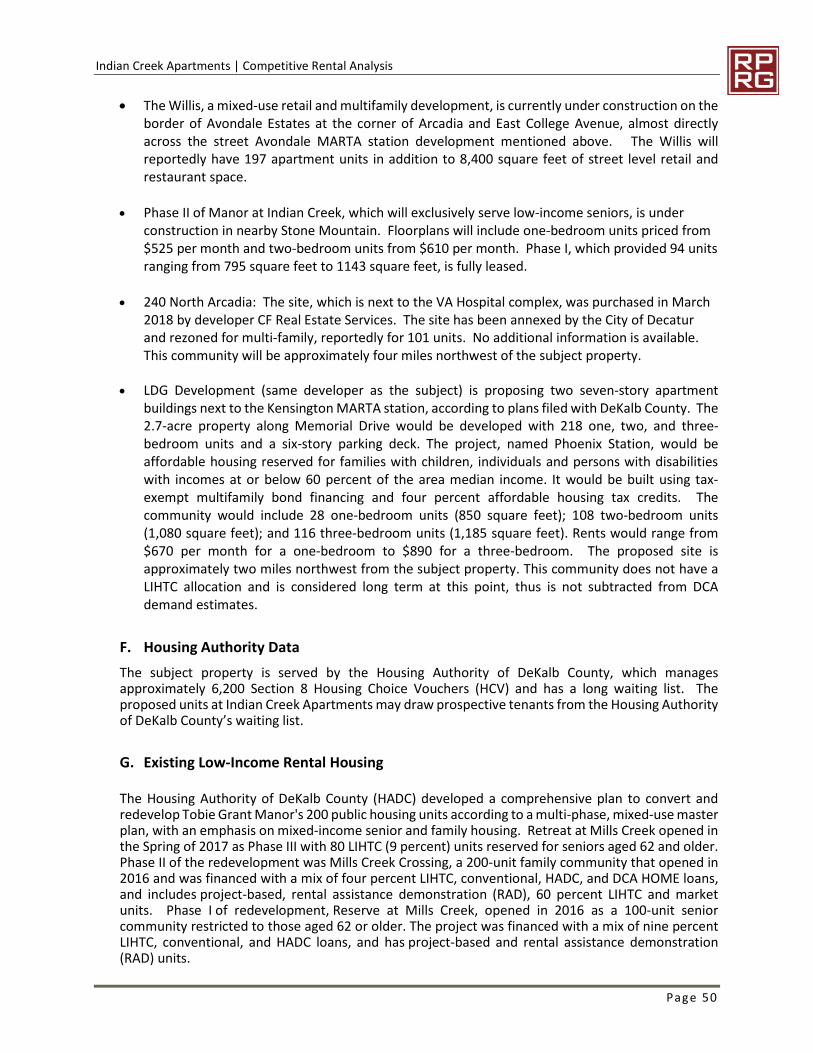
Indian Creek Apartments | Competitive Rental Analysis
Page 50
The Willis, a mixed-use retail and multifamily development, is currently under construction on theborder of Avondale Estates at the corner of Arcadia and East College Avenue, almost directlyacross the street Avondale MARTA station development mentioned above. The Willis willreportedly have 197 apartment units in addition to 8,400 square feet of street level retail andrestaurant space.
Phase II of Manor at Indian Creek, which will exclusively serve low-income seniors, is underconstruction in nearby Stone Mountain. Floorplans will include one-bedroom units priced from$525 per month and two-bedroom units from $610 per month. Phase I, which provided 94 unitsranging from 795 square feet to 1143 square feet, is fully leased.
240 North Arcadia: The site, which is next to the VA Hospital complex, was purchased in March2018 by developer CF Real Estate Services. The site has been annexed by the City of Decaturand rezoned for multi-family, reportedly for 101 units. No additional information is available.This community will be approximately four miles northwest of the subject property.
LDG Development (same developer as the subject) is proposing two seven-story apartmentbuildings next to the Kensington MARTA station, according to plans filed with DeKalb County. The2.7-acre property along Memorial Drive would be developed with 218 one, two, and three-bedroom units and a six-story parking deck. The project, named Phoenix Station, would beaffordable housing reserved for families with children, individuals and persons with disabilitieswith incomes at or below 60 percent of the area median income. It would be built using tax-exempt multifamily bond financing and four percent affordable housing tax credits. Thecommunity would include 28 one-bedroom units (850 square feet); 108 two-bedroom units(1,080 square feet); and 116 three-bedroom units (1,185 square feet). Rents would range from$670 per month for a one-bedroom to $890 for a three-bedroom. The proposed site isapproximately two miles northwest from the subject property. This community does not have aLIHTC allocation and is considered long term at this point, thus is not subtracted from DCAdemand estimates.
F. Housing Authority Data
The subject property is served by the Housing Authority of DeKalb County, which managesapproximately 6,200 Section 8 Housing Choice Vouchers (HCV) and has a long waiting list. Theproposed units at Indian Creek Apartments may draw prospective tenants from the Housing Authorityof DeKalb County’s waiting list.
G. Existing Low-Income Rental Housing
The Housing Authority of DeKalb County (HADC) developed a comprehensive plan to convert andredevelop Tobie Grant Manor's 200 public housing units according to a multi-phase, mixed-use masterplan, with an emphasis on mixed-income senior and family housing. Retreat at Mills Creek opened inthe Spring of 2017 as Phase III with 80 LIHTC (9 percent) units reserved for seniors aged 62 and older.Phase II of the redevelopment was Mills Creek Crossing, a 200-unit family community that opened in2016 and was financed with a mix of four percent LIHTC, conventional, HADC, and DCA HOME loans,and includes project-based, rental assistance demonstration (RAD), 60 percent LIHTC and marketunits. Phase I of redevelopment, Reserve at Mills Creek, opened in 2016 as a 100-unit seniorcommunity restricted to those aged 62 or older. The project was financed with a mix of nine percentLIHTC, conventional, and HADC loans, and has project-based and rental assistance demonstration(RAD) units.
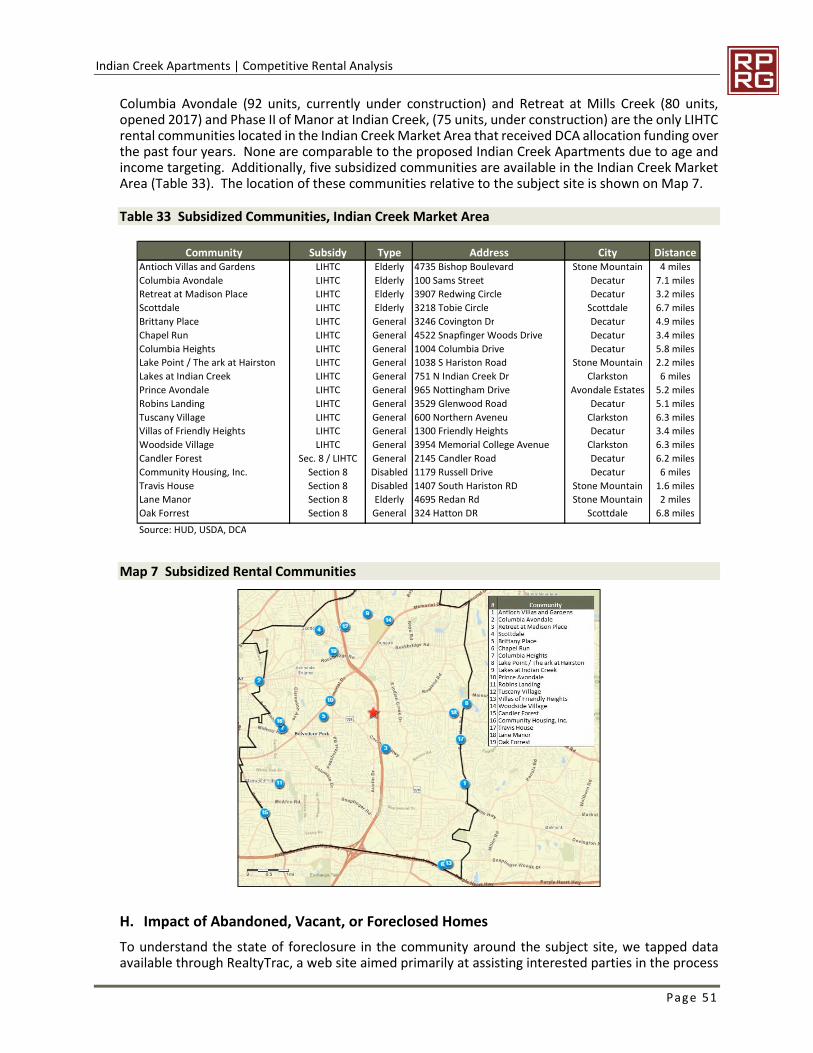
Indian Creek Apartments | Competitive Rental Analysis
Page 51
Columbia Avondale (92 units, currently under construction) and Retreat at Mills Creek (80 units,opened 2017) and Phase II of Manor at Indian Creek, (75 units, under construction) are the only LIHTCrental communities located in the Indian Creek Market Area that received DCA allocation funding overthe past four years. None are comparable to the proposed Indian Creek Apartments due to age andincome targeting. Additionally, five subsidized communities are available in the Indian Creek MarketArea (Table 33). The location of these communities relative to the subject site is shown on Map 7.
Table 33 Subsidized Communities, Indian Creek Market Area
Map 7 Subsidized Rental Communities
H. Impact of Abandoned, Vacant, or Foreclosed Homes
To understand the state of foreclosure in the community around the subject site, we tapped dataavailable through RealtyTrac, a web site aimed primarily at assisting interested parties in the process
Community Subsidy Type Address City DistanceAntioch Villas and Gardens LIHTC Elderly 4735 Bishop Boulevard Stone Mountain 4 miles
Columbia Avondale LIHTC Elderly 100 Sams Street Decatur 7.1 miles
Retreat at Madison Place LIHTC Elderly 3907 Redwing Circle Decatur 3.2 miles
Scottdale LIHTC Elderly 3218 Tobie Circle Scottdale 6.7 miles
Brittany Place LIHTC General 3246 Covington Dr Decatur 4.9 miles
Chapel Run LIHTC General 4522 Snapfinger Woods Drive Decatur 3.4 miles
Columbia Heights LIHTC General 1004 Columbia Drive Decatur 5.8 miles
Lake Point / The ark at Hairston LIHTC General 1038 S Hariston Road Stone Mountain 2.2 miles
Lakes at Indian Creek LIHTC General 751 N Indian Creek Dr Clarkston 6 miles
Prince Avondale LIHTC General 965 Nottingham Drive Avondale Estates 5.2 miles
Robins Landing LIHTC General 3529 Glenwood Road Decatur 5.1 miles
Tuscany Village LIHTC General 600 Northern Aveneu Clarkston 6.3 miles
Villas of Friendly Heights LIHTC General 1300 Friendly Heights Decatur 3.4 miles
Woodside Village LIHTC General 3954 Memorial College Avenue Clarkston 6.3 miles
Candler Forest Sec. 8 / LIHTC General 2145 Candler Road Decatur 6.2 miles
Community Housing, Inc. Section 8 Disabled 1179 Russell Drive Decatur 6 miles
Travis House Section 8 Disabled 1407 South Hariston RD Stone Mountain 1.6 miles
Lane Manor Section 8 Elderly 4695 Redan Rd Stone Mountain 2 miles
Oak Forrest Section 8 General 324 Hatton DR Scottdale 6.8 milesGreenville
Source: HUD, USDA, DCA
Indian Creek Apartments | Competitive Rental Analysis
Page 52
of locating and purchasing properties in foreclosure and at risk of foreclosure. RealtyTrac classifiesproperties in its database into several different categories, among them three that are relevant to ouranalysis: 1.) pre-foreclosure property – a property with loans in default and in danger of beingrepossessed or auctioned, 2.) auction property – a property that lien holders decide to sell at publicauctions, once the homeowner’s grace period has expired, in order to dispose of the property asquickly as possible, and 3.) bank-owned property – a unit that has been repossessed by lenders. Weincluded properties within these three foreclosure categories in our analysis. We queried theRealtyTrac database for ZIP code 30032 in which the subject property will be located and the broaderareas of Decatur, DeKalb County, Georgia, and the United States for comparison purposes.
Our RealtyTrac search revealed June 2018 foreclosure rates of 0.06 percent in the subject property’sZIP Code (30032), 0.07 percent in DeKalb County, 0.06 percent in Georgia, and 0.06 percent in thenation (Table 34). The monthly number of foreclosures in the subject site’s ZIP Code peaked at 30for the month of March 2018 and has averaged 23 foreclosures per month year to date. In June 2018the number of properties that received a foreclosure filing in 30032 was seven percent lower than thesame time last year. Based on RealtyTrac statistics, the most common features for foreclosures in thiszip code indicate a three-bedroom, 1100 square foot home built in the 1950’s, with an estimatedvalue in the $100,000 to $200,000 bracket. The median sales price of a non-distressed homewas $156,000, which is seven percent higher than a year ago.
While the conversion of foreclosure properties can affect the demand for new multi-family rentalhousing in some markets, the impact on a primarily affordable housing community is typically limiteddue to their tenant rent and income restrictions. Furthermore, current foreclosure activity in thesubject site’s ZIP Code was very low over the past year. As such, we do not believe foreclosed,abandoned, or vacant single/multi-family homes will impact the subject property’s ability to lease itsunits.
Table 34 Foreclosure Data, ZIP Code 30032, June 2018
Geography
June 2018
Foreclosure
Rate
ZIP Code: 30032 0.06%
Decatur 0.07%
DeKalb 0.07%
Georgia 0.06%
National 0.06%
Source: Realtytrac.com
ZIP Code: 30032
Month# of
Foreclosures
July 2017 8
August 2017 7
September 2017 10
October 2017 15
November 2017 11
December 2017 19
January 2018 14
February 2018 15
March 2018 30
April 2018 22
May 2018 23
June 2018 13
Source: Realtytrac.com
0.06%0.07% 0.07%
0.06% 0.06%
0.00%0.02%0.04%0.06%0.08%0.10%
8 7
10
15
11
19
14 15
30
2223
13
0
10
20
30
Pro
pe
rtie
s
Indian Creek Apartments | Findings and Conclusions
Page 53
10. FINDINGS AND CONCLUSIONS
A. Key Findings
Based on the preceding review of the subject project and demographic and competitive housingtrends in the Indian Creek Market Area, RPRG offers the following key findings:
Site and Neighborhood Analysis: The subject site is in Decatur, Georgia, which is part ofgreater Atlanta. The subject site is situated on the west side of Redan Road, roughly one-halfmile west of Interstate 285 and 12 miles east of downtown Atlanta. The site for Indian CreekApartments is an area of mixed development, surrounded by a combination of residential,commercial, and light industrial land uses. The site is an aggregation of several vacant parcelsand single-family homes that total approximately 17 acres, with frontage on Redan Roadwhere it intersects with Holcombe Road. Residential uses include numerous multi-familyrental communities, most of which are concentrated west of Interstate 285, along Redan Roadand Holcombe Road. There are also numerous single-family homes and townhomes in thearea. The site is walkable to the Indian Creek MARTA station roughly one-half mile to theeast, across Interstate 285, via a pedestrian bridge. A mixture of single-family detachedhomes and townhomes are common east of Interstate 285, with numerous establishedmiddle-class residential subdivisions, as well as new townhomes and 55+ communities. Westof Interstate 285, where the subject site is located, is primarily older apartment complexesand mid-century vintage single-family detached homes, although pockets of single-familyhomes constructed in the 1990’s and early 2000’s also exist. There is some light industrial inthe neighborhood, with more commercial uses seen along Covington Highway and MemorialDrive. The site benefits from its proximity to the Indian Creek MARTA station, as well asaccess via Redan Road to the east side of Interstate 285, which offers superior retailselections.
Economic Context: DeKalb County’s labor force fluctuated greatly during 2007-2017 andended with an overall increase of 852 workers, a change of less than one-quarter of a percent.The county’s unemployment rate dropped to 4.8 percent in 2017; the county’s employmentrate has generally been in line with the state rate since 2012, while the national rate hasremained below the county and state since 2007. The number of unemployed workers hashalved from a high of 39,314 unemployed workers in 2010 to 18,976 workers unemployed in2017. Strong job growth in DeKalb County is likely to continue over the next three to fiveyears as economic expansions benefiting Atlanta and strong job growth will continue,furthering housing demand throughout the Metro Atlanta area.
Growth Trends: The population of the Indian Creek Market Area decreased by 12,512 people(10.5 percent) or 1,251 people (1.1 percent) annually between the 2000 and 2010 Censuscounts, while the household base decreased by 1,733 (losing 173 households or 0.4 percentper year) during the same period. Esri projections indicate the Indian Creek Market Areapopulation and household growth rates accelerated over the last eight years, as the IndianCreek Market Area added 345 people (0.3 percent) and 171 households (0.4 percent) per yearfrom 2010 to 2018. Esri projections indicate population and household growth rates willremain relatively stable in the Indian Creek Market Area through 2020 with the market areaadding 830 people (0.8 percent) and 342 households (0.8 percent) per year over the next twoyears. Anticipated population by 2020 for the Indian Creek Market Area is 110,597 personswith 40,988 households projected.
Demographic Analysis: The Indian Creek Market Area’s population has a median age of 35as of 2018, equal to the 35-year-old median age of the DeKalb County’s population. Adultsage 35-61 comprise the largest percentage of the Indian Creek Market Area’s population at34.8 percent. Children under the age of 20 account for 25.9 percent of the Indian Creek
Indian Creek Apartments | Findings and Conclusions
Page 54
Market Area’s population and Young Adults age 20-34 comprise 22.6 percent. Seniorscomprise 16.7 percent of the market area. These percentages generally mirror those seen inDeKalb County.
Approximately 46 percent of households in the Indian Creek Market Area were renters as ofthe 2010 Census, slightly higher than the 43 percent rental rate in DeKalb County. IndianCreek Market Area households have a higher propensity to rent than the county with 2018renter percentages of 51.6 percent and 48.4 percent. The market area lost more than 3,000owner household over the past 18 years but has added 2,760 renter households. Renterhouseholds contributed 89.5 percent of the county’s net household growth since 2000. Esriprojects renter households to contribute a disproportionately small share of net householdgrowth over the next two years, which is unlikely given past trends and current conditions.
Households in the Indian Creek Market Area have a 2018 median household income of$45,512 per year according to income distributions provided by Esri, which is approximately30.0 percent lower than the $59,141 median income in DeKalb County. RPRG estimates thatthe median income of Indian Creek Market Area households by tenure is $34,659 for rentersand $61,073 for owners. Over 6,000 renter households in the market area (29.9 percent) hadan annual income from $25,000 to $50,000, the approximate income target for the subjectproperty’s LIHTC units.
Competitive Housing Analysis: RPRG surveyed 18 rental communities in the Indian CreekMarket Area including five LIHTC general occupancy communities. Surveyed rentalcommunities in the market area had an aggregate stabilized vacancy rate of 3.6 percent. Thefive LIHTC community subset was also performing well, with an aggregate vacancy rate of just2.6 percent. Average effective rents among surveyed communities (including incentives,water/sewer, and trash removal) were:
o One-bedroom units in the market area had an average effective rent of $741 with anaverage unit size of 727 square feet and an average rent per square foot of $1.02.
o Two-bedroom units in the market area had an average effective rent of $849 with anaverage unit size of 985 square feet and an average rent per square foot of $0.86.
o Three-bedroom units in the market area had an average effective rent of $1,075 withan average unit size of 1,277 square feet and an average rent per square foot of $0.84.
To determine average “market rents” as outlined in DCA’s 2018 Market Study Manual, marketrate rents were averaged at the most comparable communities to the proposed Indian CreekApartments. The “average market rent” is $868 for one-bedroom units, $1,007 for two-bedroom units, and $1,155 for three-bedroom units. The subject property’s proposed 60percent AMI rents are all below these averages and the project has a weighted averagemarket advantage of 11.0 percent.
RPRG identified five pipeline rental communities in the Indian Creek Market Area. Three willbe market rate or senior-restricted and are unlikely to directly compete with the subjectproperty. The fourth is a recent acquisition of vacant land that has been rezoned for 101multi-family units with no additional information available. One of the pipeline communitiesis a comparable 252-unit four percent LIHTC community proposed by the subjectdevelopment. This community has received initial approval from the county, but is consideredlong term given the current status of the LIHTC allocation (not applied).
B. Product Evaluation
Considered in the context of the competitive environment, the relative position of Indian CreekApartments is as follows:
Indian Creek Apartments | Findings and Conclusions
Page 55
Site: The subject site is acceptable for a rental housing development targeting low incomerenter households. Surrounding residential, commercial, and light industrial land uses arecompatible with multi-family development and are appropriate for an affordable rentalcommunity. Indian Creek Apartments will be convenient to traffic arteries, publictransportation, major employers, and neighborhood amenities/services. The subject site issuitable for the proposed development.
Unit Distribution: The proposed unit mix for Indian Creek Apartments includes 24 one-bedroom units (10 percent), 96 two-bedroom units (40 percent), and 120 three-bedroomunits (50 percent). This unit distribution contains a much higher percentage of three-bedroom units than those surveyed in the market area. Given the lack of three-bedroomaffordable rental units in the market area, the subject property will among the only rentalcommunities serving larger households, which are common in the market area Taking thisinto consideration along with tendency for lower income renter households to skew largerthan moderate and upper income households, the proposed unit distribution appearsreasonable and appropriate for its intended target market.
Unit Size: The proposed unit sizes at Indian Creek Apartments are 850 square feet for one-bedroom units, 1,070 square feet for two-bedroom units, and 1,180 square feet for three-bedroom units. The subject’s proposed unit sizes exceed the market for one-bedroom andtwo-bedroom floor plans. The subject’s proposed unit size is roughly 100 square feet lessthan the market for three-bedroom floor plans. However, the smaller size is not deemeddetrimental as there are few three-bedroom rental options that will compete directly withnew construction. This lack of supply will bode well for Indian Creek Apartments, as thethree-bedroom floor plan constitutes 50 percent of the subject’s unit mix.
Unit Features: Indian Creek Apartments will offer a range, refrigerator, dishwasher,microwave, central heating and air-conditioning, and washer and dryer connections. Theseunit features will be competitive with surveyed rental communities in the market area. Theproposed unit features will be well received by the target market of low income renterhouseholds.
Community Amenities: Indian Creek Apartments will have a community amenity packagethat will include a business center, fitness center, swimming pool, playground, grills andbenches, walking path, and gazebo. This amenity package paired with the low proposed rentsis appropriate for the intended target market and will allow the subject property to becompetitive with surveyed rental communities in the Indian Creek Market Area.
Marketability: The subject property will offer an attractive product that is suitable for thetarget market and will be the only new construction for LIHTC general occupancy in themarket area.
C. Price Position
The subject’s proposed 60 percent LIHTC rents will be positioned differently depending on the floorplan. Proposed one-bedroom and two-bedroom LIHTC rents will be in the middle tier of rents seenin the market area. Alternatively, proposed three-bedroom LIHTC rents will be in the top tier of rentsseen in the market area (Figure 7). However, the subject should benefit from the number of three-bedroom units in its unit mix, as this floorplan is not prevalent in the market. Given the overall priceposition and reasonable unit sizes, all units will also be priced competitively on a rent per square footbasis.
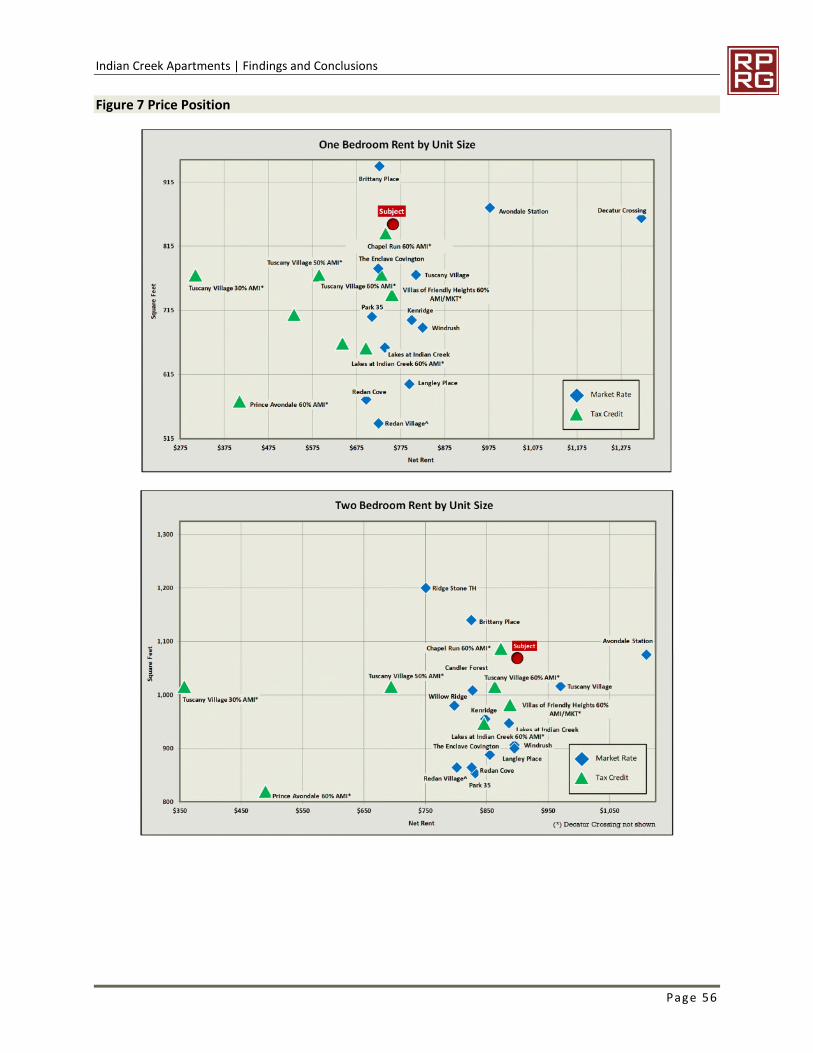
Indian Creek Apartments | Findings and Conclusions
Page 56
Figure 7 Price Position
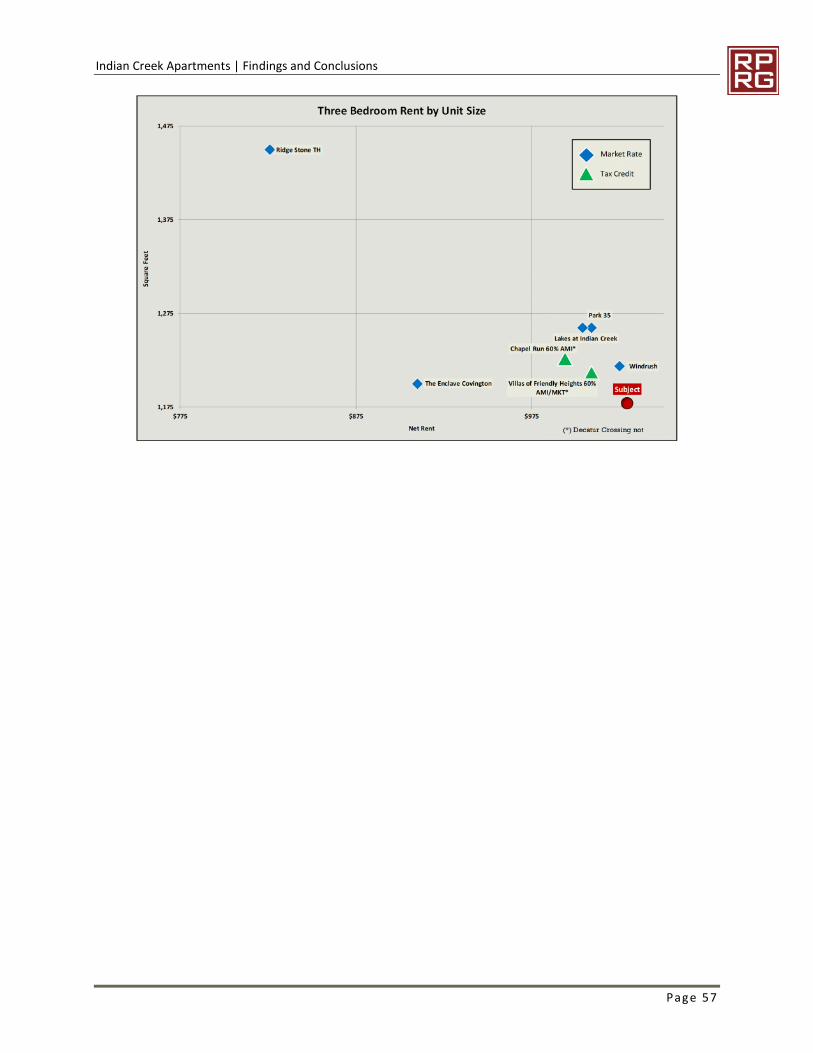
Indian Creek Apartments | Findings and Conclusions
Page 57
Indian Creek Apartments | Absorption and Stabilization Rates
Page 58
11. ABSORPTION AND STABILIZATION RATES
A. Absorption Estimate
No surveyed rental communities in the market area were able to provide a relevant absorption historydue to the length of time since lease-up occurred. Therefore, the absorption rate for Indian CreekApartments is based on projected renter household growth, income-qualified renter households inthe market area, demand estimates, rental market conditions, and the marketability of the proposedsite and product.
The Indian Creek Market Area is projected to add 342 households per year over the next twoyears, an annual growth rate of 0.8 percent.
Roughly 4,150 renter households will be income-qualified for one or more units proposed atIndian Creek Apartments by 2020. The project has a low overall renter affordability capturerate of 5.8 percent.
All DCA demand capture rates are below DCA thresholds including a low overall capture rateof 10.4 percent.
The surveyed overall rental market in the Indian Creek Market Area is performing well with astabilized aggregate vacancy rate of 3.6 percent. The surveyed LIHTC communities within theoverall rental market also were performing well with an aggregate vacancy rate of just 2.6percent.
Indian Creek Apartments will offer a competitive product with rents that will be desirable forlow income renters in the Indian Creek Market Area.
Based on the product to be constructed and the factors discussed above, we conservatively estimateIndian Creek Apartments will lease-up at a rate of at least 18 units per month. At this rate, the subjectproperty will reach a stabilized occupancy of at least 93 percent within 13 months.
B. Impact on Existing and Pipeline Rental Market
Given the lack of new construction affordable housing in the Indian Creek Market Area, the subjectwill have few direct competitors. Taking this into consideration along with strong projectedhousehold growth, low vacancy rates among surveyed rental communities in the market area, andaffordability and DCA demand capture rates below DCA thresholds, we do not expect Indian CreekApartments to have negative impact on existing or pipeline rental communities in the Indian CreekMarket Area.

Indian Creek Apartments | Interviews
Page 59
12. INTERVIEWS
Primary information gathered through field and phone interviews was used throughout the varioussections of this report. The interviewees included rental community property managers and planningofficials with the City of Decatur, City of Clarkston, City of Avondale Estates, City of Scottdale, andplanners responsible for unincorporated DeKalb County.

Indian Creek Apartments | Conclusions and Recommendations
Page 60
13. CONCLUSIONS AND RECOMMENDATIONS
Based on projected renter household growth, low affordability and demand capture rates, and strongrental market conditions, sufficient demand exists to support the proposed units at Indian CreekApartments. As such, RPRG believes that the proposed Indian Creek Apartments will be able tosuccessfully reach and maintain a stabilized occupancy of at least 93 percent following its entranceinto the rental market. The subject property will be competitively positioned with the existing marketrate communities in the Indian Creek Market Area given its significantly lower price position and willoffer a high-quality affordable rental alternative that does not currently exist in the market. Werecommend proceeding with the project as planned.
The proposed development of Indian Creek Apartments will not have a negative impact on LIHTCcommunities in the market area.
Leslie Burke Tad ScepaniakSenior Analyst Managing Principal
Income/Unit Size Income LimitsUnits
Proposed
Renter Income
Qualification %
Total
Demand
Large HH
Size Adj.
Large HH
DemandSupply
Net
Demand
Capture
RateAbsorption
Average
Market Rent
Market Rents
Band
Proposed
Rents60% Units $28,869 - $46,680
One Bedroom Units $28,869 - $33,690 24 6.1% 748 26 722 3.3% 1-2 months $868 $724-$1,322 $756Two Bedroom Units $34,663 - $40,010 96 6.1% 749 74 675 14.2% 5-6 months $1,007 $855-$1,557 $899
Three Bedroom Units $40,011 - $46,680 120 7.6% 928 45.0% 417 10 407 29.5% 6-7 months $1,155 $910-$1,820 $1,029Project Total $28,869 - $46,680
Total Units $28,869 - $46,680 240 19.8% 2,425 110 2,315 10.4% 13 months

Indian Creek Apartments | Appendix 1 Underlying Assumptions and Limiting Conditions
Page 61
APPENDIX 1 UNDERLYING ASSUMPTIONS AND LIMITINGCONDITIONS
In conducting the analysis, we will make the following assumptions, except as otherwise noted in ourreport:
1. There are no zoning, building, safety, environmental or other federal, state or local laws,regulations or codes which would prohibit or impair the development, marketing or operation of thesubject project in the manner contemplated in our report, and the subject project will be developed,marketed and operated in compliance with all applicable laws, regulations and codes.
2. No material changes will occur in (a) any federal, state or local law, regulation or code (including,without limitation, the Internal Revenue Code) affecting the subject project, or (b) any federal, stateor local grant, financing or other program which is to be utilized in connection with the subject project.
3. The local, national and international economies will not deteriorate, and there will be nosignificant changes in interest rates or in rates of inflation or deflation.
4. The subject project will be served by adequate transportation, utilities and governmentalfacilities.
5. The subject project will not be subjected to any war, energy crisis, embargo, strike, earthquake,flood, fire or other casualty or act of God.
6. The subject project will be on the market at the time and with the product anticipated in ourreport, and at the price position specified in our report.
7. The subject project will be developed, marketed and operated in a highly professional manner.
8. No projects will be developed which will be in competition with the subject project, except as setforth in our report.
9. There are neither existing judgments nor any pending or threatened litigation, which could hinderthe development, marketing or operation of the subject project.
Indian Creek Apartments | Appendix 1 Underlying Assumptions and Limiting Conditions
Page 62
The analysis will be subject to the following limiting conditions, except as otherwise noted in ourreport:
1. The analysis contained in this report necessarily incorporates numerous estimates andassumptions with respect to property performance, general and local business and economicconditions, the absence of material changes in the competitive environment and other matters. Someestimates or assumptions, however, inevitably will not materialize, and unanticipated events andcircumstances may occur; therefore, actual results achieved during the period covered by our analysiswill vary from our estimates and the variations may be material.
2. Our absorption estimates are based on the assumption that the product recommendations setforth in our report will be followed without material deviation.
3. All estimates of future dollar amounts are based on the current value of the dollar, without anyallowance for inflation or deflation.
4. We have no responsibility for considerations requiring expertise in other fields. Suchconsiderations include, but are not limited to, legal matters, environmental matters, architecturalmatters, geologic considerations, such as soils and seismic stability, and civil, mechanical, electrical,structural and other engineering matters.
5. Information, estimates and opinions contained in or referred to in our report, which we haveobtained from sources outside of this office, are assumed to be reliable and have not beenindependently verified.
6. The conclusions and recommendations in our report are subject to these Underlying Assumptionsand Limiting Conditions and to any additional assumptions or conditions set forth in the body of ourreport.
Indian Creek Apartments | Appendix 2 Analyst Certifications
Page 63
APPENDIX 2 ANALYST CERTIFICATIONS
I certify that, to the best of my knowledge and belief:
I affirm that I have made a physical inspection of the market area and the subject propertyand that information has been uses in the full study of the need and demand for theproposed units. The report was written according to DCA’s market study requirements,the information included is accurate and the report can be relied upon by DCA as a trueassessment of the low-income housing rental market.
To the best of my knowledge, the market can support the project as shown in the study.I understand that any misrepresentation of this statement may result in the denial offurther participation in DCA’s rental housing programs. I also affirm that I have no interestin the project or relationship with the ownership entity and my compensation is notcontingent on this project being funded.
DCA may rely on the representation made in the market study provided and thedocument is assignable to other lenders that are parties to the DCA loan transaction.
The reported analyses, opinions, and conclusions are limited only by the reportedassumptions and limiting conditions, and is my personal, unbiased professional analyses,opinions, and conclusions.
My compensation is not contingent on an action or event resulting from the analysis,opinions, or conclusions in, or the use of, this report.
The market study was not based on tax credit approval or approval of a loan. Mycompensation is not contingent upon the reporting of a predetermined demand thatfavors the cause of the client, the attainment of a stipulated result, or the occurrence ofa subsequent event.
My analyses, opinions, and conclusions were developed, and this report has beenprepared, in conformity with the requirements of the Code of Professional Ethics and theStandards of Professional Practice as set forth in the Uniform Standards of ProfessionalAppraisal Practice (USPAP) as adopted by the Appraisal Standards Board of the AppraisalFoundation.
__________________
Leslie Burke
Senior Analyst
Real Property Research Group, Inc.
Warning: Title 18 U.S.C. 1001, provides in part that whoever knowingly and willfully makes or uses a document containing
any false, fictitious, or fraudulent statement or entry, in any manner in the jurisdiction of any department or agency of the
United States, shall be fined not more than $10,000 or imprisoned for not more than five years or both.
Indian Creek Apartments | Appendix 3 NCHMA Certification
Page 64
APPENDIX 3 NCHMA CERTIFICATION
This market study has been prepared by Real Property Research Group, Inc., a member in goodstanding of the National Council of Housing Market Analysts (NCHMA). This study has been preparedin conformance with the standards adopted by NCHMA for the market analysts’ industry. Thesestandards include the Standard Definitions of Key Terms Used in Market Studies for AffordableHousing Projects and Model Content Standards for the Content of Market Studies for AffordableHousing Projects. These Standards are designed to enhance the quality of market studies and to makethem easier to prepare, understand, and use by market analysts and by the end users. TheseStandards are voluntary only, and no legal responsibility regarding their use is assumed by theNational Council of Housing Market Analysts.
Real Property Research Group, Inc. is duly qualified and experienced in providing market analysis forAffordable Housing. The company’s principals participate in NCHMA educational and informationsharing programs to maintain the highest professional standards and state-of-the-art knowledge. RealProperty Research Group, Inc. is an independent market analyst. No principal or employee of RealProperty Research Group, Inc. has any financial interest whatsoever in the development for which thisanalysis has been undertaken.
While the document specifies Real Property Research Group, Inc., the certification is always signed bythe individual completing the study and attesting to the certification.
Real Property Research Group, Inc.
____ Tad Scepaniak___ _Name
_ Managing Principal___ _Title
_________August 6, 2018 _______
Date
Indian Creek Apartments | Appendix 4 Analyst Resumes
Page 65
APPENDIX 4 ANALYST RESUMES
TAD SCEPANIAKManaging Principal
Tad Scepaniak assumed the role of Real Property Research Group’s Managing Principal in November2017 following more than 15 years with the firm. Tad has extensive experience conducting marketfeasibility studies on a wide range of residential and mixed-use developments for developers, lenders,and government entities. Tad directs the firm’s research and production of feasibility studies includinglarge-scale housing assessments to detailed reports for a specific project on a specific site. He hasextensive experience analyzing affordable rental communities developed under the Low IncomeHousing Tax Credit (LIHTC) program and market-rate apartments developed under the HUD 221(d)(4)program and conventional financing. Tad is the key contact for research contracts many state housingfinance agencies, including several that commission market studies for LIHTC applications.
Tad is National Chair of the National Council of Housing Market Analysts (NCHMA) and previouslyserved as Vice Chair and Co-Chair of Standards Committee. He has taken a lead role in thedevelopment of the organization's Standard Definitions and Recommended Market Study Content,and he has authored and co-authored white papers on market areas, derivation of market rents, andselection of comparable properties. Tad is also a founding member of the Atlanta chapter of theLambda Alpha Land Economics Society.
Areas of Concentration:
Low Income Tax Credit Rental Housing: Mr. Scepaniak has worked extensively with the LowIncome Tax Credit program throughout the United States, with special emphasis on theSoutheast and Mid-Atlantic regions.
Senior Housing: Mr. Scepaniak has conducted feasibility analysis for a variety of senior orientedrental housing. The majority of this work has been under the Low Income Tax Credit program;however his experience includes assisted living facilities and market rate senior rentalcommunities.
Market Rate Rental Housing: Mr. Scepaniak has conducted various projects for developers ofmarket rate rental housing. The studies produced for these developers are generally used todetermine the rental housing needs of a specific submarket and to obtain financing.
Public Housing Authority Consultation: Tad has worked with Housing Authorities throughoutthe United States to document trends rental and for sale housing market trends to betterunderstand redevelopment opportunities. He has completed studies examining developmentopportunities for housing authorities through the Choice Neighborhood Initiative or otherprograms in Florida, Georgia, North Carolina, South Carolina, Texas, and Tennessee.
Education:Bachelor of Science – Marketing; Berry College – Rome, Georgia
Indian Creek Apartments | Appendix 4 Analyst Resumes
Page 66
ROBERT M. LEFENFELDFounding Principal
Mr. Lefenfeld, Founding Principal of the firm, with over 30 years of experience in the field ofresidential market research. Before founding Real Property Research Group in 2001, Bob served asan officer of research subsidiaries of Reznick Fedder & Silverman and Legg Mason. Between 1998 and2001, Bob was Managing Director of RF&S Realty Advisors, conducting residential market studiesthroughout the United States. From 1987 to 1995, Bob served as Senior Vice President of Legg MasonRealty Group, managing the firm’s consulting practice and serving as publisher of a Mid-Atlanticresidential data service, Housing Market Profiles. Prior to joining Legg Mason, Bob spent ten yearswith the Baltimore Metropolitan Council as a housing economist. Bob also served as ResearchDirector for Regency Homes between 1995 and 1998, analyzing markets throughout the EasternUnited States and evaluating the company’s active building operation.
Bob provides input and guidance for the completion of the firm’s research and analysis products. Hecombines extensive experience in the real estate industry with capabilities in database developmentand information management. Over the years, he has developed a series of information products andproprietary databases serving real estate professionals.
Bob has lectured and written extensively about residential real estate market analysis. Bob hascreated and teaches the market study module for the MBA HUD Underwriting course and has servedas an adjunct professor for the Graduate Programs in Real Estate Development, School ofArchitecture, Planning and Preservation, University of Maryland College Park. He is the past NationalChair of the National Council of Housing Market Analysts (NCHMA) and currently chairs its FHACommittee.
Areas of Concentration:
Strategic Assessments: Mr. Lefenfeld has conducted numerous corridor analyses throughoutthe United States to assist building and real estate companies in evaluating developmentopportunities. Such analyses document demographic, economic, competitive, and proposeddevelopment activity by submarket and discuss opportunities for development.
Feasibility Analysis: Mr. Lefenfeld has conducted feasibility studies for various types ofresidential developments for builders and developers. Subjects for these analyses haveincluded for-sale single-family and townhouse developments, age-restricted rental and for-sale developments, large multi-product PUDs, urban renovations and continuing care facilitiesfor the elderly.
Information Products: Bob has developed a series of proprietary databases to assist clients inmonitoring growth trends. Subjects of these databases have included for sale housing,pipeline information, and rental communities.
Education:
Master of Urban and Regional Planning; The George Washington University.Bachelor of Arts - Political Science; Northeastern University.
Indian Creek Apartments | Appendix 5 DCA Checklist
Page 67
APPENDIX 5 DCA CHECKLIST
I understand that by initializing (or checking) the following items, I am stating that those items are includedand/or addressed in the report. If an item is not checked, a full explanation is included in the report. Alist listing of page number(s) is equivalent to check or initializing.
The report was written according to DCA's market study requirements, that the information included isaccurate and that the report can be relied upon by DCA as a true assessment of the low-income housingrental market.
I also certify that I have inspected the subject property as well as all rent comparables.
Signed: Date: August 6, 2018
Leslie Burke
A. Executive Summary
1. Project Description:
i. Brief description of the project location including address and/or position
relative to the closest cross-street............................................................................................Page(s) 1
ii. Construction and Occupancy Types ........................................................................................Page(s) 1
iii. Unit mix, including bedrooms, bathrooms, square footage, Income targeting,
rents, and utility allowance .......................................................................................................Page(s) 1
iv. Any additional subsidies available, including project based rental assistance
(PBRA) ....................................................................................................................................Page(s) 1
v. Brief description of proposed amenities and how they compare with existing
properties .................................................................................................................................Page(s) 1
2. Site Description/Evaluation:
i. A brief description of physical features of the site and adjacent parcels..................................Page(s) 2
ii. A brief overview of the neighborhood land composition (residential,
commercial, industrial, agricultural)..........................................................................................Page(s) 2
iii. A discussion of site access and visibility ..................................................................................Page(s) 2
iv. Any significant positive or negative aspects of the subject site................................................Page(s) 2
v. A brief summary of the site’s proximity to neighborhood services including
shopping, medical care, employment concentrations, public transportation, etc .....................Page(s) 2
vi. A bried discussion of public safety, including comments on local perceptions,
maps, or statistics of crime in the area.....................................................................................Page(s) 2
vii. An overall conclusion of the site’s appropriateness for the proposed
development.............................................................................................................................Page(s) 2
3. Market Area Definition:
i. A brief definition of the primary market area (PMA) including boundaries and
their approximate distance from the subject property .............................................................Page(s) 2
4. Community Demographic Data:
i. Current and projected household and population counts for the PMA.....................................Page(s) 3
ii. Household tenure including any trends in rental rates. ............................................................Page(s) 3
Indian Creek Apartments | Appendix 5 DCA Checklist
Page 68
iii. Household income level. ..........................................................................................................Page(s) 3
iv. Impact of foreclosed, abandoned / vacant, single and multi-family homes, and
commercial properties in the PMA of the proposed development............................................Page(s) 3
5. Economic Data:
i. Trends in employment for the county and/or region.................................................................Page(s) 3
ii. Employment by sector for the primary market area. ................................................................Page(s) 4
iii. Unemployment trends for the county and/or region for the past five years..............................Page(s) 4
iv. Brief discussion of recent or planned employment contractions or expansions.......................Page(s) 4
v. Overall conclusion regarding the stability of the county’s economic environment. ..................Page(s) 4
6. Project Specific Affordability and Demand Analysis:
i. Number of renter households income qualified for the proposed development.
For senior projects, this should be age and income qualified renter households.....................Page(s) 4
ii. Overall estimate of demand based on DCA’s demand methodology.......................................Page(s) 4
iii. Capture rates for the proposed development including the overall project, all
LIHTC units (excluding any PBRA or market rate units), bi AMI targeting, by
bedroom type, and a conclusion regarding the achievability of these capture
rates. ........................................................................................................................................Page(s) 4
7. Competitive Rental Analysis
i. An analysis of the competitive properties in the PMA. ............................................................Page(s) 5
ii. Number of properties................................................................................................................Page(s) 5
iii. Rent bands for each bedroom type proposed. .........................................................................Page(s) 5
iv. Average market rents. ..............................................................................................................Page(s) 5
8. Absorption/Stabilization Estimate:
i. Expected absorption rate of the subject property (units per month).........................................Page(s) 6
ii. Months required for the project to reach a stabilized occupancy of 93 percent. ......................Page(s) 6
9. Overall Conclusion:
i. A narrative detailing key conclusions of the report including the analyst’s
opinion regarding the potential for success of the proposed development. .............................Page(s) 6
10. Summary Table.............................................................................................................................Page(s) 6-7
B. Project Description
1. Project address and location. ..............................................................................................................Page(s) 11
2. Construction type. ...............................................................................................................................Page(s) 9
3. Occupancy Type. ................................................................................................................................Page(s) 9
4. Special population target (if applicable). .............................................................................................Page(s) 9
5. Number of units by bedroom type and income targeting (AMI)...........................................................Page(s) 9
6. Unit size, number of bedrooms, and structure type. ...........................................................................Page(s) 9
7. Rents and Utility Allowances. ..............................................................................................................Page(s) 9
8. Existing or proposed project based rental assistance. ........................................................................Page(s) 9
9. Proposed development amenities. ......................................................................................................Page(s) 10
10. For rehab proposals, current occupancy levels, rents, tenant incomes (if applicable),
and scope of work including an estimate of the total and per unit construction cost. .........................Page(s) N/A
11. Projected placed-in-service date. ........................................................................................................Page(s) 10
C. Site Evaluation
1. Date of site / comparables visit and name of site inspector. ...........................................................Page(s) 7
2. Site description
i. Physical features of the site. .......................................................................................................Page(s) 12
Indian Creek Apartments | Appendix 5 DCA Checklist
Page 69
ii. Positive and negative attributes of the site..................................................................................Page(s) 20
iii. Detailed description of surrounding land uses including their condition......................................Page(s) 13
3. Description of the site’s physical proximity to surrounding roads, transportation,
amenities, employment, and community services...............................................................................Page(s) 16-20
4. Color photographs of the subject property, surrounding neighborhood, and street
scenes with a description of each vantage point.................................................................................Page(s) 12, 13
5. Neighborhood Characteristics
i. Map identifying the location of the project. ..................................................................................Page(s) 11
ii. List of area amenities including their distance (in miles) to the subject site. ...............................Page(s) 18
iii. Map of the subject site in proximity to neighborhood amenities..................................................Page(s) 19
6. Describe the land use and structures of the area immediately surrounding the site
including significant concentrations of residential, commercial, industrial, vacant, or
agricultural uses; comment on the condition of these existing land uses. ..........................................Page(s) 13
7. Discuss any public safety issues in the area ......................................................................................Page(s) 15
8. Map identifying existing low-income housing in the market area .......................................................Page(s) 51
9. Road or infrastructure improvements planned or under construction in the PMA...............................Page(s) 17
10. Discussion of accessibility, ingress/egress, and visibility of the subject site. ......................................Page(s) 16,16
11. Overall conclusions about the subject site, as it relates to the marketability of the
proposed development........................................................................................................................Page(s) 20
D. Market Area
1. Definition of the primary market area (PMA) including boundaries and their
approximate distance from the subject site........................................................................................Page(s) 21
2. Map Identifying subject property’s location within market area...........................................................Page(s) 22
E. Community Demographic Data
1. Population Trends
i. Total Population. .........................................................................................................................Page(s) 23-23
ii. Population by age group. ............................................................................................................Page(s) 25
iii. Number of elderly and non-elderly. .............................................................................................Page(s) N/A
iv. Special needs population (if applicable)......................................................................................Page(s) N/A
2. Household Trends
i. Total number of households and average household size. Page(s) 23
ii. Household by tenure. ..................................................................................................................Page(s) 26
iii. Households by income Page(s)
28-28
iv. Renter households by number of persons in the household. ......................................................Page(s) 27
F. Employment Trends
1. Total jobs in the county or region. .......................................................................................................Page(s) 31
2. Total jobs by industry – numbers and percentages. ...........................................................................Page(s) 32
3. Major current employers, product or service, total employees, anticipated
expansions/contractions, as well as newly planned employers and their impact on
employment in the market area.........................................................................................................Page(s) 34, 35
4. Unemployment trends, total workforce figures, and number and percentage
unemployed for the county over the past five years..........................................................................Page(s) 30
5. Map of the site and location of major employment concentrations. ..................................................Page(s) 35
Indian Creek Apartments | Appendix 5 DCA Checklist
Page 70
6. Analysis of data and overall conclusions relating to the impact on housing demand........................Page(s) 36
G. Project-specific Affordability and Demand Analysis
1. Income Restrictions / Limits. .............................................................................................................Page(s) 38
2. Affordability estimates. ...........................................................................................................Page(s) 37-39
3. Components of Demand
i. Demand from new households..................................................................................................Page(s) 39-41
ii. Demand from existing households. ...........................................................................................Page(s) 39-41
iii. Elderly Homeowners likely to convert to rentership. .................................................................Page(s) 39-41
iv. Other sources of demand (if applicable). Page(s) N/A
4. Net Demand, Capture Rate, and Stabilization Calculations
i. Net demand
1. By AMI Level .......................................................................................................................Page(s) 40
2. By floor plan ........................................................................................................................Page(s) 41
ii. Capture rates
1. By AMI level ........................................................................................................................Page(s) 40
2. By floor plan ........................................................................................................................Page(s) 41
5. Capture rate analysis chart .................................................................................................................Page(s) 41
H. Competitive Rental Analysis (Existing Competitive Rental Environment
1. Detailed project information for each competitive rental community surveyed
i. Name and address of the competitive property development. ..................................................Page(s) App. 7
ii. Name, title, and phone number of contact person and date contact was made. ......................Page(s) App. 7
iii. Description of property. .............................................................................................................Page(s) App. 7
iv. Photographs of each competitive development. .......................................................................Page(s) App. 7
v. Square footages for each competitive unit type. .......................................................................Page(s) 48
vi. Monthly rents and the utilities included in the rents of each unit type. ......................................Page(s) 46, 48,
App. 7
vii. Project age and current physical condition................................................................................Page(s) 45
viii. Concessions given if any...........................................................................................................Page(s) 45
ix. Current vacancy rates, historic vacancy factors, waiting lists, and turnover
rates, broken down by bedroom size and structure type...........................................................Page(s) 45
2. Additional rental market information
i. An analysis of voucher and certificates available in the market area..........................................Page(s) 50
ii. Lease-up history of competitive developments in the market area. ............................................Page(s) 45
iii. Tenant profile and waiting list of existing phase (if applicable) ...................................................Page(s) N/A
iv. Competitive data for single-family rentals, mobile homes, etc. in rural areas if
lacking sufficient comparables (if applicable). .............................................................................Page(s) 48
3. Map showing competitive projects in relation to the subject property. Page(s) 44
4. Description of proposed amenities for the subject property and assessment of
quality and compatibility with competitive rental communities. ...........................................................Page(s) 46-47
5. For senior communities, an overview / evaluation of family properties in the PMA. ...........................Page(s) N/A
6. Subject property’s long-term impact on competitive rental communities in the PMA..........................Page(s) 58
7. Competitive units planned or under construction the market area
i. Name, address/location, owner, number of units, configuration, rent structure,
estimated date of market entry, and any other relevant information. ..........................................Page(s) 49
8. Narrative or chart discussing how competitive properties compare with the proposed
development with respect to total units, rents, occupancy, location, etc.............................................Page(s) 45-47,
54
Indian Creek Apartments | Appendix 5 DCA Checklist
Page 71
i. Average market rent and rent advantage....................................................................................Page(s) 48
9. Discussion of demand as it relates to the subject property and all comparable DCA
funded projects in the market area......................................................................................................Page(s) 39-41
10. Rental trends in the PMA for the last five years including average occupancy trends
and projection for the next two years. ..........................................................................................Page(s) N/A
11. Impact of foreclosed, abandoned, and vacant single and multi-family homes as well
commercial properties in the market area. ..........................................................................................Page(s) 51
12. Discussion of primary housing voids in the PMA as they relate to the subject property. ....................Page(s) N/A
13. Note whether or not the proposed project adversely impacts the long term occupancy
and health of existing assisted rental housing projects in the PMA. ...................................................Page(s) 58
I. Absorption and Stabilization Rates
1. Anticipated absorption rate of the subject property.............................................................................Page(s) 58
2. Stabilization period. .............................................................................................................................Page(s) 58
J. Interviews..............................................................................................................................................Page(s) 59
K. Conclusions and Recommendations
1. Conclusion as to the impact of the subject property on PMA..............................................................Page(s) 58
2. Recommendation as the subject property’s viability in PMA...............................................................Page(s) 60
L. Signed Statement Requirements.............................................................................................................Page(s) App. 2
M. Market Study Representation ..................................................................................................................Page(s) App. 2
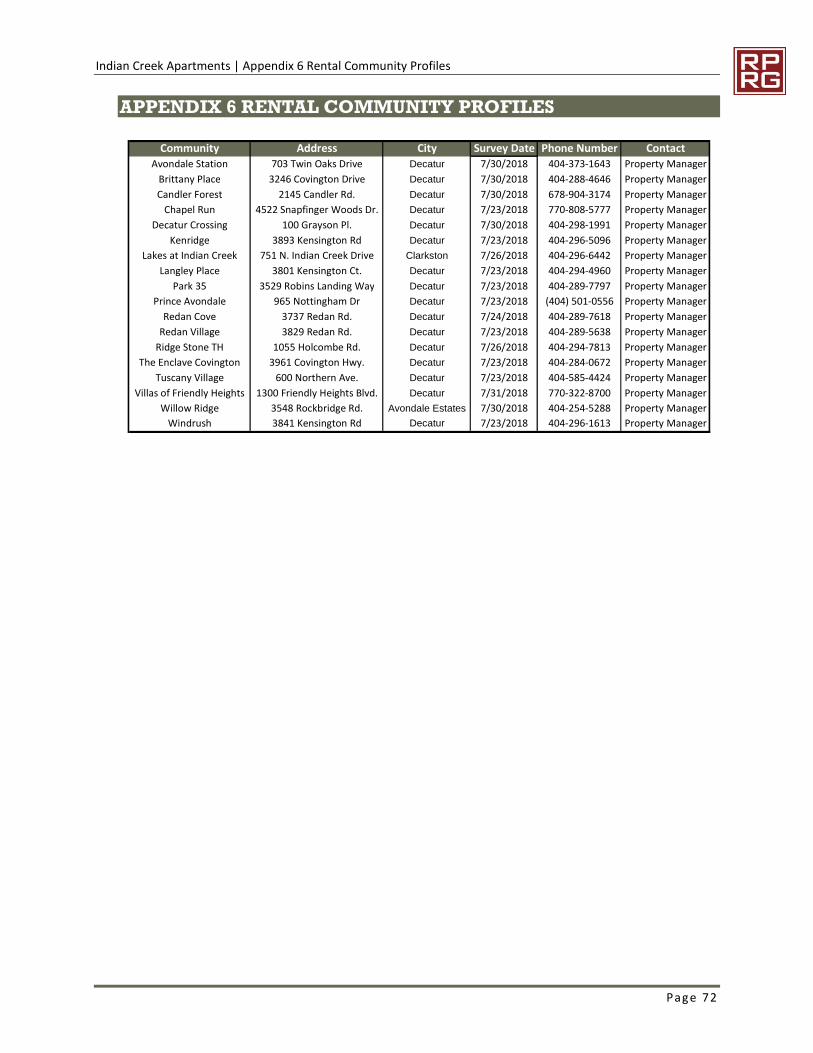
Indian Creek Apartments | Appendix 6 Rental Community Profiles
Page 72
APPENDIX 6 RENTAL COMMUNITY PROFILES
Community Address City Survey Date Phone Number Contact
Avondale Station 703 Twin Oaks Drive Decatur 7/30/2018 404-373-1643 Property Manager
Brittany Place 3246 Covington Drive Decatur 7/30/2018 404-288-4646 Property Manager
Candler Forest 2145 Candler Rd. Decatur 7/30/2018 678-904-3174 Property Manager
Chapel Run 4522 Snapfinger Woods Dr. Decatur 7/23/2018 770-808-5777 Property Manager
Decatur Crossing 100 Grayson Pl. Decatur 7/30/2018 404-298-1991 Property Manager
Kenridge 3893 Kensington Rd Decatur 7/23/2018 404-296-5096 Property Manager
Lakes at Indian Creek 751 N. Indian Creek Drive Clarkston 7/26/2018 404-296-6442 Property Manager
Langley Place 3801 Kensington Ct. Decatur 7/23/2018 404-294-4960 Property Manager
Park 35 3529 Robins Landing Way Decatur 7/23/2018 404-289-7797 Property Manager
Prince Avondale 965 Nottingham Dr Decatur 7/23/2018 (404) 501-0556 Property Manager
Redan Cove 3737 Redan Rd. Decatur 7/24/2018 404-289-7618 Property Manager
Redan Village 3829 Redan Rd. Decatur 7/23/2018 404-289-5638 Property Manager
Ridge Stone TH 1055 Holcombe Rd. Decatur 7/26/2018 404-294-7813 Property Manager
The Enclave Covington 3961 Covington Hwy. Decatur 7/23/2018 404-284-0672 Property Manager
Tuscany Village 600 Northern Ave. Decatur 7/23/2018 404-585-4424 Property Manager
Villas of Friendly Heights 1300 Friendly Heights Blvd. Decatur 7/31/2018 770-322-8700 Property Manager
Willow Ridge 3548 Rockbridge Rd. Avondale Estates 7/30/2018 404-254-5288 Property Manager
Windrush 3841 Kensington Rd Decatur 7/23/2018 404-296-1613 Property Manager
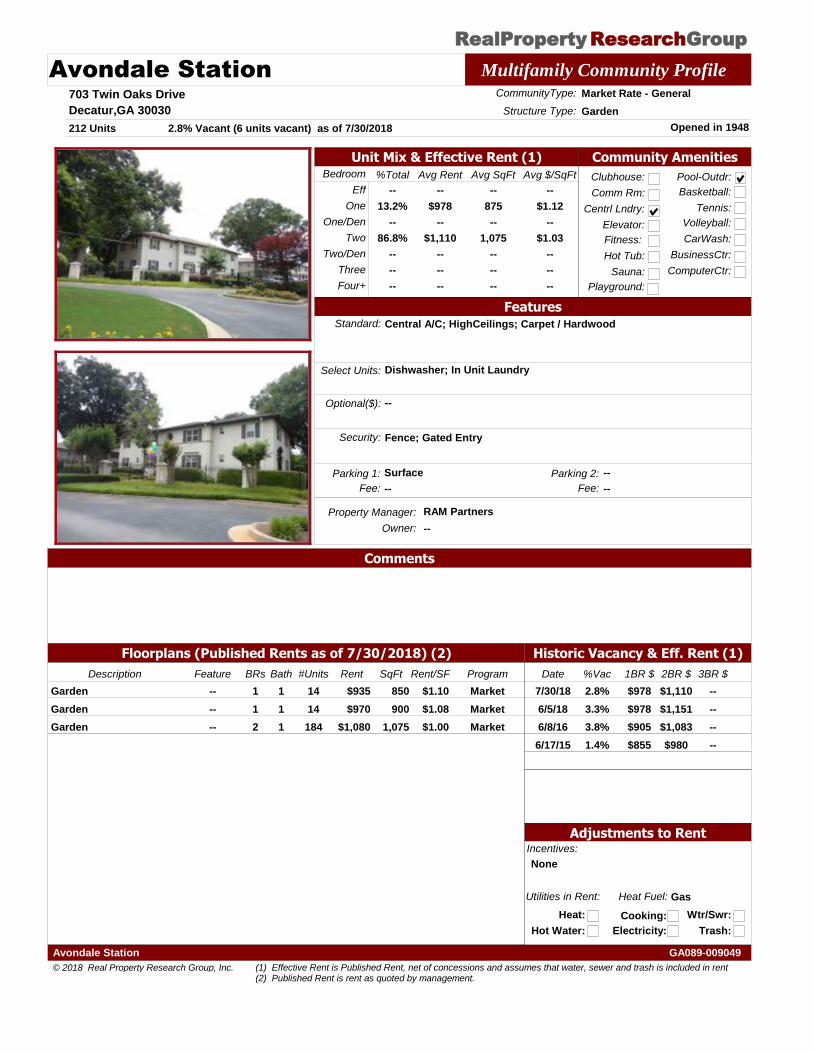
RealProperty Group Research
Avondale Station Multifamily Community Profile
703 Twin Oaks Drive
Decatur,GA 30030
Property Manager: RAM Partners
Opened in 1948
CommunityType: Market Rate - General
212 Units
Structure Type: Garden
Owner: --
Historic Vacancy & Eff. Rent (1)
Bedroom Avg $/SqFtAvg SqFt%Total Avg Rent
Eff
One
Two
Three
Four+
One/Den
Two/Den
--
$978
--
$1,110
--
--
--
--
875
--
1,075
--
--
--
--
$1.12
--
$1.03
--
--
--
--
13.2%
--
86.8%
--
--
--
Utilities in Rent:
Heat:
Heat Fuel: Gas
Hot Water:
Cooking:
Electricity:
Wtr/Swr:
Trash:
Community Amenities
Clubhouse:
Comm Rm:
Centrl Lndry:
Fitness:
Hot Tub:
Sauna:
Pool-Outdr:
Playground:
Basketball:
Tennis:
Volleyball:
CarWash:
BusinessCtr:
ComputerCtr:
Floorplans (Published Rents as of 7/30/2018) (2)
Elevator:
2.8% Vacant (6 units vacant) as of 7/30/2018
FeaturesStandard: Central A/C; HighCeilings; Carpet / Hardwood
Select Units: Dishwasher; In Unit Laundry
Optional($): --
Incentives:
None
Security: Fence; Gated Entry
Unit Mix & Effective Rent (1)
Adjustments to Rent
Parking 1: Surface
Comments
Parking 2: --
Fee: -- Fee: --
Date %Vac 1BR $ 2BR $ 3BR $
2.8%7/30/18 $978 $1,110 --
3.3%6/5/18 $978 $1,151 --
3.8%6/8/16 $905 $1,083 --
1.4%6/17/15 $855 $980 --
Description BRs Bath Rent SqFt ProgramRent/SF#UnitsFeature
1 1Garden $935 850 Market$1.1014--
1 1Garden $970 900 Market$1.0814--
2 1Garden $1,080 1,075 Market$1.00184--
© 2018 Real Property Research Group, Inc.
GA089-009049Avondale Station
(1) Effective Rent is Published Rent, net of concessions and assumes that water, sewer and trash is included in rent (2) Published Rent is rent as quoted by management.
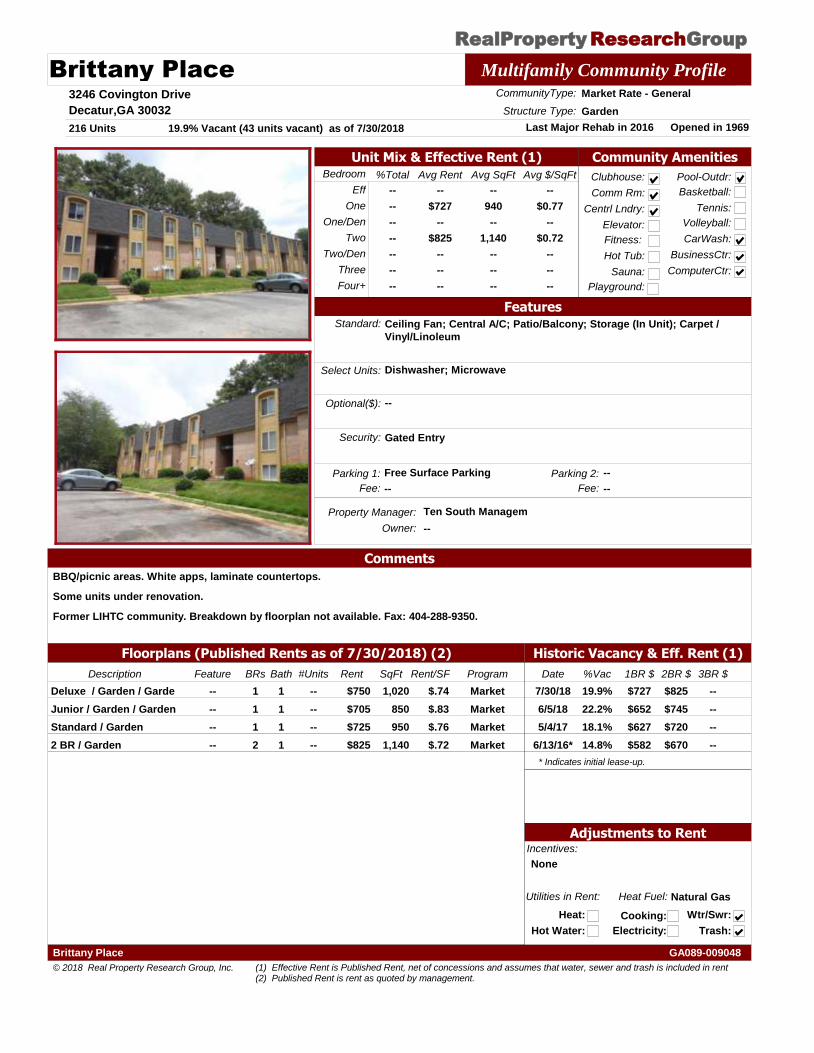
RealProperty Group Research
Brittany Place Multifamily Community Profile
3246 Covington Drive
Decatur,GA 30032
Property Manager: Ten South Managem
Opened in 1969Last Major Rehab in 2016
CommunityType: Market Rate - General
216 Units
Structure Type: Garden
Owner: --
Historic Vacancy & Eff. Rent (1)
Bedroom Avg $/SqFtAvg SqFt%Total Avg Rent
Eff
One
Two
Three
Four+
One/Den
Two/Den
--
$727
--
$825
--
--
--
--
940
--
1,140
--
--
--
--
$0.77
--
$0.72
--
--
--
--
--
--
--
--
--
--
Utilities in Rent:
Heat:
Heat Fuel: Natural Gas
Hot Water:
Cooking:
Electricity:
Wtr/Swr:
Trash:
Community Amenities
Clubhouse:
Comm Rm:
Centrl Lndry:
Fitness:
Hot Tub:
Sauna:
Pool-Outdr:
Playground:
Basketball:
Tennis:
Volleyball:
CarWash:
BusinessCtr:
ComputerCtr:
Floorplans (Published Rents as of 7/30/2018) (2)
Elevator:
19.9% Vacant (43 units vacant) as of 7/30/2018
FeaturesStandard: Ceiling Fan; Central A/C; Patio/Balcony; Storage (In Unit); Carpet /
Vinyl/Linoleum
Select Units: Dishwasher; Microwave
Optional($): --
Incentives:
None
Security: Gated Entry
Unit Mix & Effective Rent (1)
Adjustments to Rent
Parking 1: Free Surface Parking
Comments
BBQ/picnic areas. White apps, laminate countertops.
Some units under renovation.
Former LIHTC community. Breakdown by floorplan not available. Fax: 404-288-9350.
Parking 2: --
Fee: -- Fee: --
Date %Vac 1BR $ 2BR $ 3BR $
19.9%7/30/18 $727 $825 --
22.2%6/5/18 $652 $745 --
18.1%5/4/17 $627 $720 --
14.8%6/13/16* $582 $670 --
* Indicates initial lease-up.
Description BRs Bath Rent SqFt ProgramRent/SF#UnitsFeature
1 1Deluxe / Garden / Garde $750 1,020 Market$.74----
1 1Junior / Garden / Garden $705 850 Market$.83----
1 1Standard / Garden $725 950 Market$.76----
2 12 BR / Garden $825 1,140 Market$.72----
© 2018 Real Property Research Group, Inc.
GA089-009048Brittany Place
(1) Effective Rent is Published Rent, net of concessions and assumes that water, sewer and trash is included in rent (2) Published Rent is rent as quoted by management.
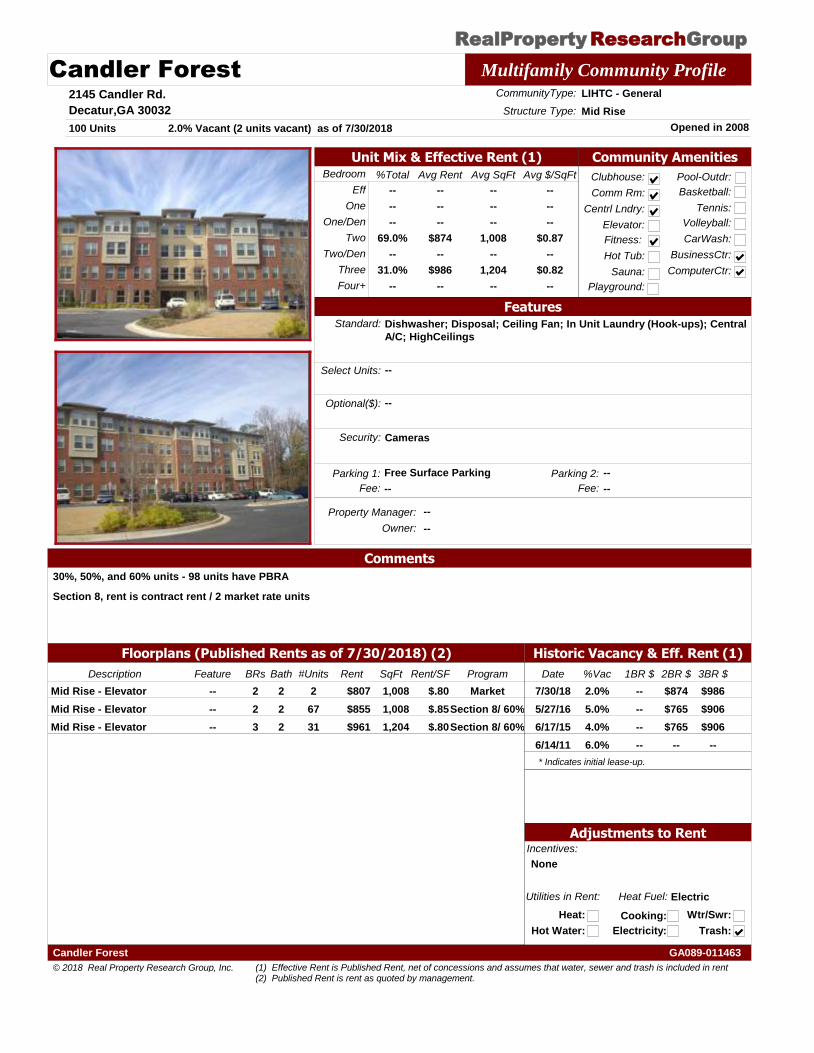
RealProperty Group Research
Candler Forest Multifamily Community Profile
2145 Candler Rd.
Decatur,GA 30032
Property Manager: --
Opened in 2008
CommunityType: LIHTC - General
100 Units
Structure Type: Mid Rise
Owner: --
Historic Vacancy & Eff. Rent (1)
Bedroom Avg $/SqFtAvg SqFt%Total Avg Rent
Eff
One
Two
Three
Four+
One/Den
Two/Den
--
--
--
$874
--
$986
--
--
--
--
1,008
--
1,204
--
--
--
--
$0.87
--
$0.82
--
--
--
--
69.0%
--
31.0%
--
Utilities in Rent:
Heat:
Heat Fuel: Electric
Hot Water:
Cooking:
Electricity:
Wtr/Swr:
Trash:
Community Amenities
Clubhouse:
Comm Rm:
Centrl Lndry:
Fitness:
Hot Tub:
Sauna:
Pool-Outdr:
Playground:
Basketball:
Tennis:
Volleyball:
CarWash:
BusinessCtr:
ComputerCtr:
Floorplans (Published Rents as of 7/30/2018) (2)
Elevator:
2.0% Vacant (2 units vacant) as of 7/30/2018
FeaturesStandard: Dishwasher; Disposal; Ceiling Fan; In Unit Laundry (Hook-ups); Central
A/C; HighCeilings
Select Units: --
Optional($): --
Incentives:
None
Security: Cameras
Unit Mix & Effective Rent (1)
Adjustments to Rent
Parking 1: Free Surface Parking
Comments
30%, 50%, and 60% units - 98 units have PBRA
Section 8, rent is contract rent / 2 market rate units
Parking 2: --
Fee: -- Fee: --
Date %Vac 1BR $ 2BR $ 3BR $
2.0%7/30/18 -- $874 $986
5.0%5/27/16 -- $765 $906
4.0%6/17/15 -- $765 $906
6.0%6/14/11 -- -- --
* Indicates initial lease-up.
Description BRs Bath Rent SqFt ProgramRent/SF#UnitsFeature
2 2Mid Rise - Elevator $807 1,008 Market$.802--
2 2Mid Rise - Elevator $855 1,008 Section 8/ 60%$.8567--
3 2Mid Rise - Elevator $961 1,204 Section 8/ 60%$.8031--
© 2018 Real Property Research Group, Inc.
GA089-011463Candler Forest
(1) Effective Rent is Published Rent, net of concessions and assumes that water, sewer and trash is included in rent (2) Published Rent is rent as quoted by management.
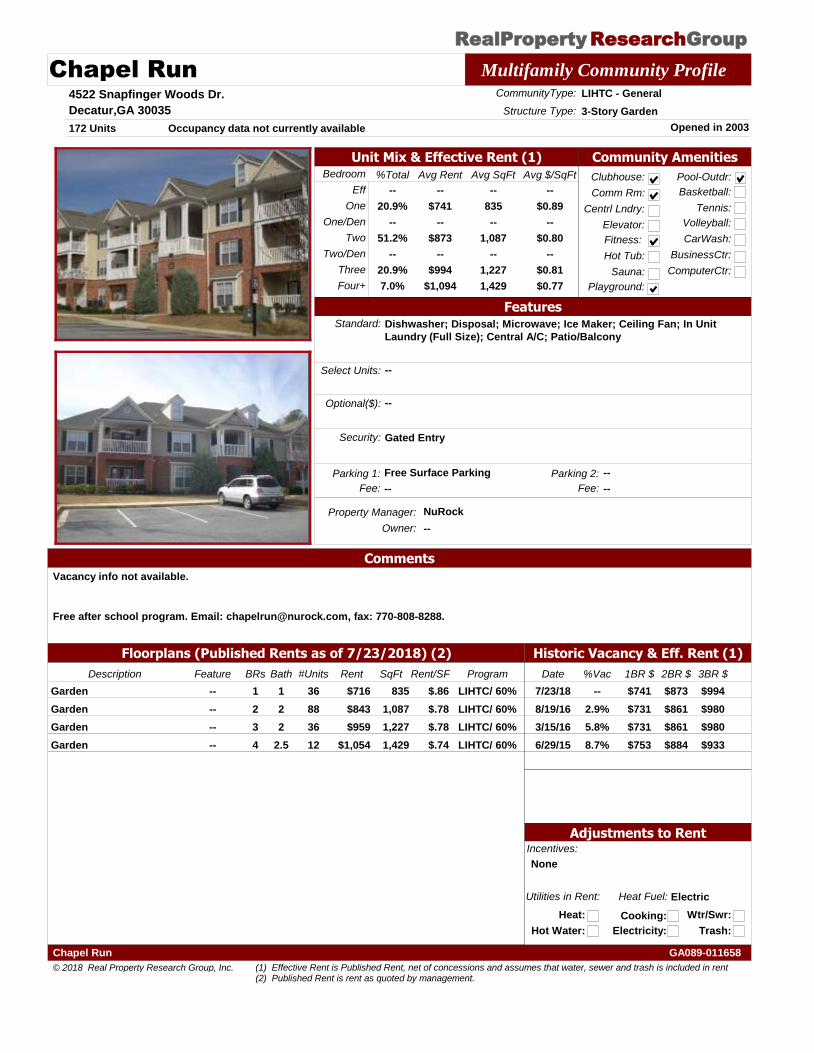
RealProperty Group Research
Chapel Run Multifamily Community Profile
4522 Snapfinger Woods Dr.
Decatur,GA 30035
Property Manager: NuRock
Opened in 2003
CommunityType: LIHTC - General
172 Units
Structure Type: 3-Story Garden
Owner: --
Historic Vacancy & Eff. Rent (1)
Bedroom Avg $/SqFtAvg SqFt%Total Avg Rent
Eff
One
Two
Three
Four+
One/Den
Two/Den
--
$741
--
$873
--
$994
$1,094
--
835
--
1,087
--
1,227
1,429
--
$0.89
--
$0.80
--
$0.81
$0.77
--
20.9%
--
51.2%
--
20.9%
7.0%
Utilities in Rent:
Heat:
Heat Fuel: Electric
Hot Water:
Cooking:
Electricity:
Wtr/Swr:
Trash:
Community Amenities
Clubhouse:
Comm Rm:
Centrl Lndry:
Fitness:
Hot Tub:
Sauna:
Pool-Outdr:
Playground:
Basketball:
Tennis:
Volleyball:
CarWash:
BusinessCtr:
ComputerCtr:
Floorplans (Published Rents as of 7/23/2018) (2)
Elevator:
Occupancy data not currently available
FeaturesStandard: Dishwasher; Disposal; Microwave; Ice Maker; Ceiling Fan; In Unit
Laundry (Full Size); Central A/C; Patio/Balcony
Select Units: --
Optional($): --
Incentives:
None
Security: Gated Entry
Unit Mix & Effective Rent (1)
Adjustments to Rent
Parking 1: Free Surface Parking
Comments
Vacancy info not available.
Free after school program. Email: [email protected], fax: 770-808-8288.
Parking 2: --
Fee: -- Fee: --
Date %Vac 1BR $ 2BR $ 3BR $
--7/23/18 $741 $873 $994
2.9%8/19/16 $731 $861 $980
5.8%3/15/16 $731 $861 $980
8.7%6/29/15 $753 $884 $933
Description BRs Bath Rent SqFt ProgramRent/SF#UnitsFeature
1 1Garden $716 835 LIHTC/ 60%$.8636--
2 2Garden $843 1,087 LIHTC/ 60%$.7888--
3 2Garden $959 1,227 LIHTC/ 60%$.7836--
4 2.5Garden $1,054 1,429 LIHTC/ 60%$.7412--
© 2018 Real Property Research Group, Inc.
GA089-011658Chapel Run
(1) Effective Rent is Published Rent, net of concessions and assumes that water, sewer and trash is included in rent (2) Published Rent is rent as quoted by management.
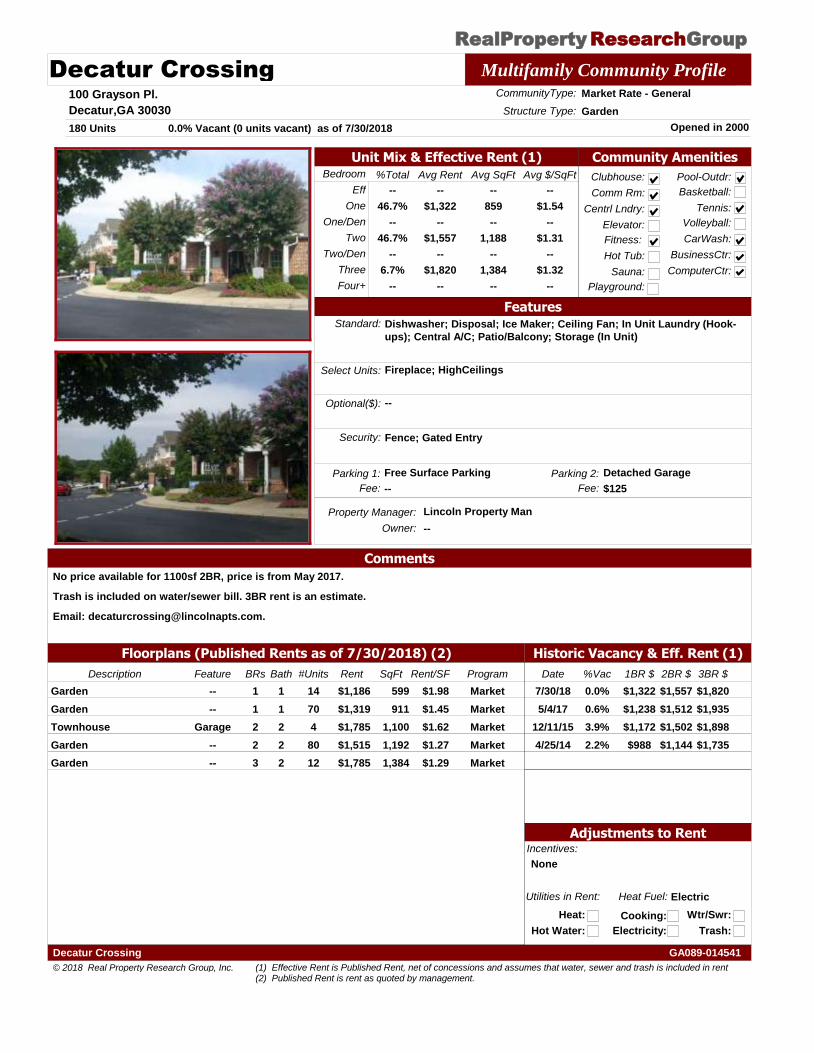
RealProperty Group Research
Decatur Crossing Multifamily Community Profile
100 Grayson Pl.
Decatur,GA 30030
Property Manager: Lincoln Property Man
Opened in 2000
CommunityType: Market Rate - General
180 Units
Structure Type: Garden
Owner: --
Historic Vacancy & Eff. Rent (1)
Bedroom Avg $/SqFtAvg SqFt%Total Avg Rent
Eff
One
Two
Three
Four+
One/Den
Two/Den
--
$1,322
--
$1,557
--
$1,820
--
--
859
--
1,188
--
1,384
--
--
$1.54
--
$1.31
--
$1.32
--
--
46.7%
--
46.7%
--
6.7%
--
Utilities in Rent:
Heat:
Heat Fuel: Electric
Hot Water:
Cooking:
Electricity:
Wtr/Swr:
Trash:
Community Amenities
Clubhouse:
Comm Rm:
Centrl Lndry:
Fitness:
Hot Tub:
Sauna:
Pool-Outdr:
Playground:
Basketball:
Tennis:
Volleyball:
CarWash:
BusinessCtr:
ComputerCtr:
Floorplans (Published Rents as of 7/30/2018) (2)
Elevator:
0.0% Vacant (0 units vacant) as of 7/30/2018
FeaturesStandard: Dishwasher; Disposal; Ice Maker; Ceiling Fan; In Unit Laundry (Hook-
ups); Central A/C; Patio/Balcony; Storage (In Unit)
Select Units: Fireplace; HighCeilings
Optional($): --
Incentives:
None
Security: Fence; Gated Entry
Unit Mix & Effective Rent (1)
Adjustments to Rent
Parking 1: Free Surface Parking
Comments
No price available for 1100sf 2BR, price is from May 2017.
Trash is included on water/sewer bill. 3BR rent is an estimate.
Email: [email protected].
Parking 2: Detached Garage
Fee: -- Fee: $125
Date %Vac 1BR $ 2BR $ 3BR $
0.0%7/30/18 $1,322 $1,557 $1,820
0.6%5/4/17 $1,238 $1,512 $1,935
3.9%12/11/15 $1,172 $1,502 $1,898
2.2%4/25/14 $988 $1,144 $1,735
Description BRs Bath Rent SqFt ProgramRent/SF#UnitsFeature
1 1Garden $1,186 599 Market$1.9814--
1 1Garden $1,319 911 Market$1.4570--
2 2Townhouse $1,785 1,100 Market$1.624Garage
2 2Garden $1,515 1,192 Market$1.2780--
3 2Garden $1,785 1,384 Market$1.2912--
© 2018 Real Property Research Group, Inc.
GA089-014541Decatur Crossing
(1) Effective Rent is Published Rent, net of concessions and assumes that water, sewer and trash is included in rent (2) Published Rent is rent as quoted by management.
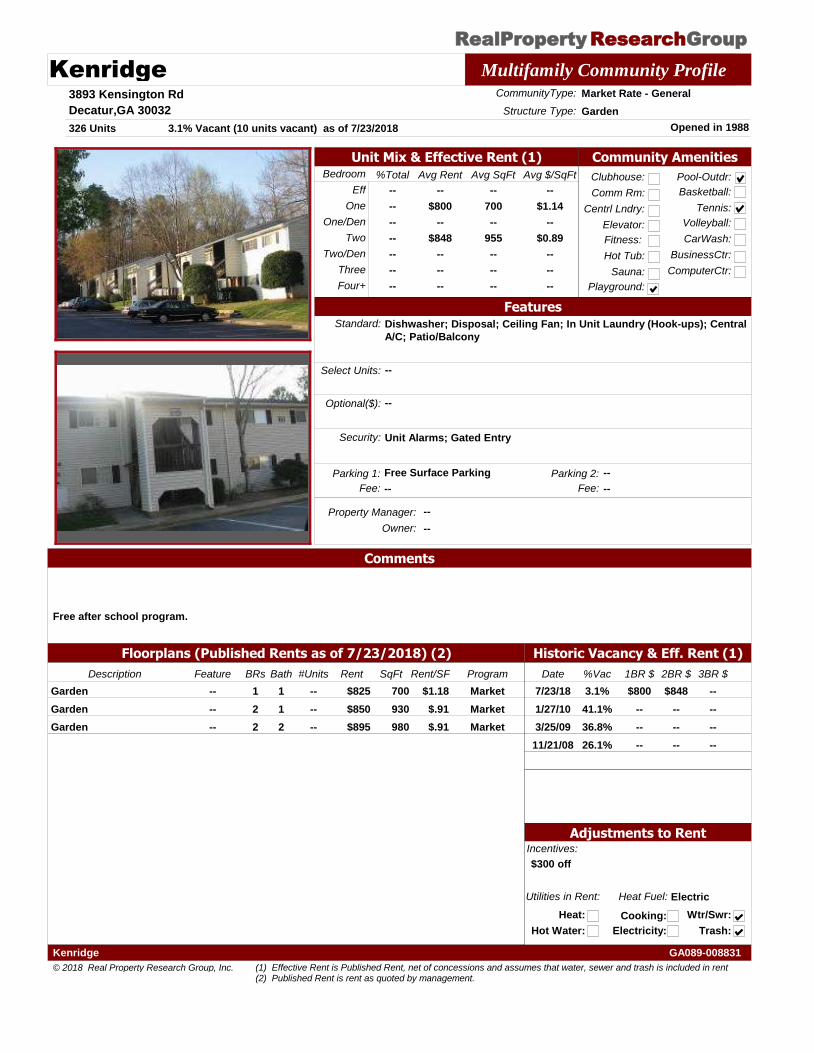
RealProperty Group Research
Kenridge Multifamily Community Profile
3893 Kensington Rd
Decatur,GA 30032
Property Manager: --
Opened in 1988
CommunityType: Market Rate - General
326 Units
Structure Type: Garden
Owner: --
Historic Vacancy & Eff. Rent (1)
Bedroom Avg $/SqFtAvg SqFt%Total Avg Rent
Eff
One
Two
Three
Four+
One/Den
Two/Den
--
$800
--
$848
--
--
--
--
700
--
955
--
--
--
--
$1.14
--
$0.89
--
--
--
--
--
--
--
--
--
--
Utilities in Rent:
Heat:
Heat Fuel: Electric
Hot Water:
Cooking:
Electricity:
Wtr/Swr:
Trash:
Community Amenities
Clubhouse:
Comm Rm:
Centrl Lndry:
Fitness:
Hot Tub:
Sauna:
Pool-Outdr:
Playground:
Basketball:
Tennis:
Volleyball:
CarWash:
BusinessCtr:
ComputerCtr:
Floorplans (Published Rents as of 7/23/2018) (2)
Elevator:
3.1% Vacant (10 units vacant) as of 7/23/2018
FeaturesStandard: Dishwasher; Disposal; Ceiling Fan; In Unit Laundry (Hook-ups); Central
A/C; Patio/Balcony
Select Units: --
Optional($): --
Incentives:
$300 off
Security: Unit Alarms; Gated Entry
Unit Mix & Effective Rent (1)
Adjustments to Rent
Parking 1: Free Surface Parking
Comments
Free after school program.
Parking 2: --
Fee: -- Fee: --
Date %Vac 1BR $ 2BR $ 3BR $
3.1%7/23/18 $800 $848 --
41.1%1/27/10 -- -- --
36.8%3/25/09 -- -- --
26.1%11/21/08 -- -- --
Description BRs Bath Rent SqFt ProgramRent/SF#UnitsFeature
1 1Garden $825 700 Market$1.18----
2 1Garden $850 930 Market$.91----
2 2Garden $895 980 Market$.91----
© 2018 Real Property Research Group, Inc.
GA089-008831Kenridge
(1) Effective Rent is Published Rent, net of concessions and assumes that water, sewer and trash is included in rent (2) Published Rent is rent as quoted by management.
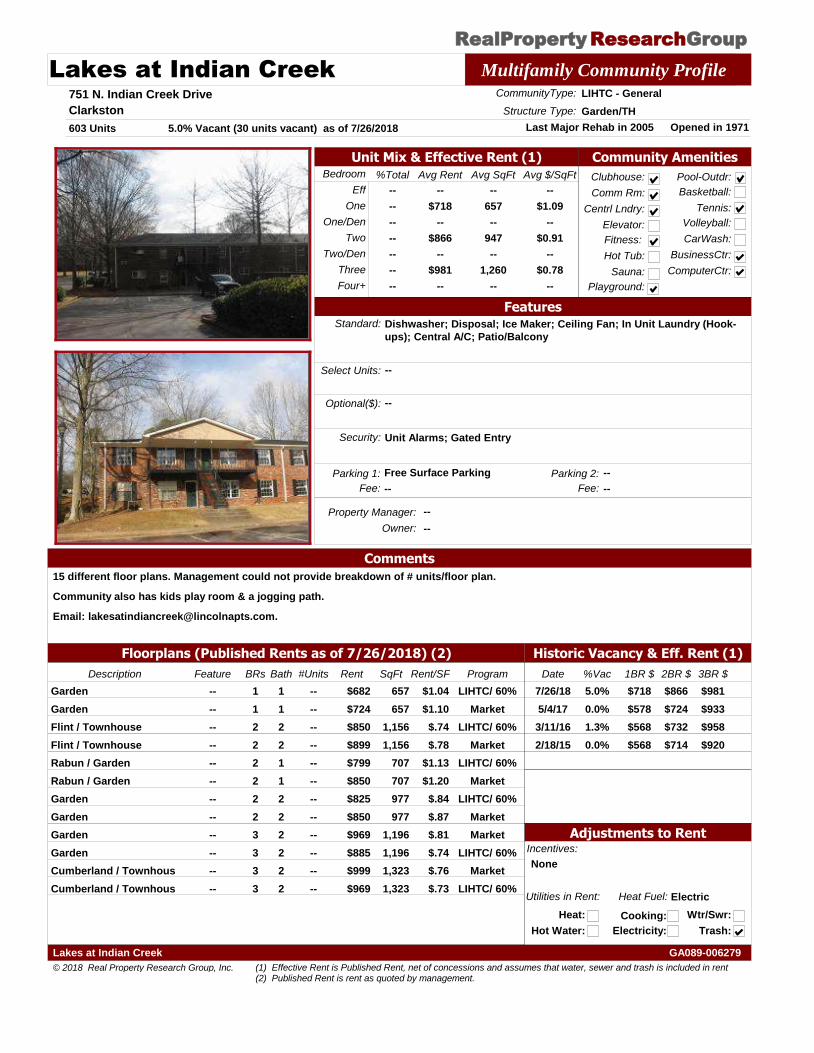
RealProperty Group Research
Lakes at Indian Creek Multifamily Community Profile
751 N. Indian Creek Drive
Clarkston
Property Manager: --
Opened in 1971Last Major Rehab in 2005
CommunityType: LIHTC - General
603 Units
Structure Type: Garden/TH
Owner: --
Historic Vacancy & Eff. Rent (1)
Bedroom Avg $/SqFtAvg SqFt%Total Avg Rent
Eff
One
Two
Three
Four+
One/Den
Two/Den
--
$718
--
$866
--
$981
--
--
657
--
947
--
1,260
--
--
$1.09
--
$0.91
--
$0.78
--
--
--
--
--
--
--
--
Utilities in Rent:
Heat:
Heat Fuel: Electric
Hot Water:
Cooking:
Electricity:
Wtr/Swr:
Trash:
Community Amenities
Clubhouse:
Comm Rm:
Centrl Lndry:
Fitness:
Hot Tub:
Sauna:
Pool-Outdr:
Playground:
Basketball:
Tennis:
Volleyball:
CarWash:
BusinessCtr:
ComputerCtr:
Floorplans (Published Rents as of 7/26/2018) (2)
Elevator:
5.0% Vacant (30 units vacant) as of 7/26/2018
FeaturesStandard: Dishwasher; Disposal; Ice Maker; Ceiling Fan; In Unit Laundry (Hook-
ups); Central A/C; Patio/Balcony
Select Units: --
Optional($): --
Incentives:
None
Security: Unit Alarms; Gated Entry
Unit Mix & Effective Rent (1)
Adjustments to Rent
Parking 1: Free Surface Parking
Comments
15 different floor plans. Management could not provide breakdown of # units/floor plan.
Community also has kids play room & a jogging path.
Email: [email protected].
Parking 2: --
Fee: -- Fee: --
Date %Vac 1BR $ 2BR $ 3BR $
5.0%7/26/18 $718 $866 $981
0.0%5/4/17 $578 $724 $933
1.3%3/11/16 $568 $732 $958
0.0%2/18/15 $568 $714 $920
Description BRs Bath Rent SqFt ProgramRent/SF#UnitsFeature
1 1Garden $682 657 LIHTC/ 60%$1.04----
1 1Garden $724 657 Market$1.10----
2 2Flint / Townhouse $850 1,156 LIHTC/ 60%$.74----
2 2Flint / Townhouse $899 1,156 Market$.78----
2 1Rabun / Garden $799 707 LIHTC/ 60%$1.13----
2 1Rabun / Garden $850 707 Market$1.20----
2 2Garden $825 977 LIHTC/ 60%$.84----
2 2Garden $850 977 Market$.87----
3 2Garden $969 1,196 Market$.81----
3 2Garden $885 1,196 LIHTC/ 60%$.74----
3 2Cumberland / Townhous $999 1,323 Market$.76----
3 2Cumberland / Townhous $969 1,323 LIHTC/ 60%$.73----
© 2018 Real Property Research Group, Inc.
GA089-006279Lakes at Indian Creek
(1) Effective Rent is Published Rent, net of concessions and assumes that water, sewer and trash is included in rent (2) Published Rent is rent as quoted by management.
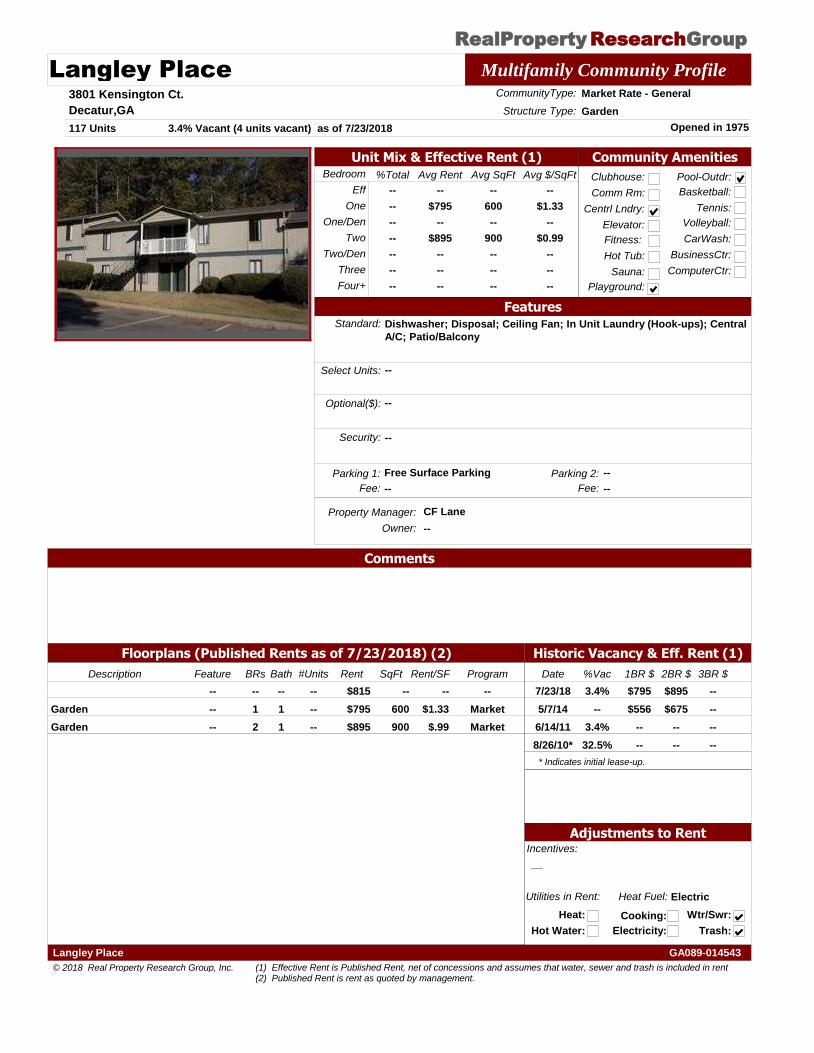
RealProperty Group Research
Langley Place Multifamily Community Profile
3801 Kensington Ct.
Decatur,GA
Property Manager: CF Lane
Opened in 1975
CommunityType: Market Rate - General
117 Units
Structure Type: Garden
Owner: --
Historic Vacancy & Eff. Rent (1)
Bedroom Avg $/SqFtAvg SqFt%Total Avg Rent
Eff
One
Two
Three
Four+
One/Den
Two/Den
--
$795
--
$895
--
--
--
--
600
--
900
--
--
--
--
$1.33
--
$0.99
--
--
--
--
--
--
--
--
--
--
Utilities in Rent:
Heat:
Heat Fuel: Electric
Hot Water:
Cooking:
Electricity:
Wtr/Swr:
Trash:
Community Amenities
Clubhouse:
Comm Rm:
Centrl Lndry:
Fitness:
Hot Tub:
Sauna:
Pool-Outdr:
Playground:
Basketball:
Tennis:
Volleyball:
CarWash:
BusinessCtr:
ComputerCtr:
Floorplans (Published Rents as of 7/23/2018) (2)
Elevator:
3.4% Vacant (4 units vacant) as of 7/23/2018
FeaturesStandard: Dishwasher; Disposal; Ceiling Fan; In Unit Laundry (Hook-ups); Central
A/C; Patio/Balcony
Select Units: --
Optional($): --
Incentives:
__
Security: --
Unit Mix & Effective Rent (1)
Adjustments to Rent
Parking 1: Free Surface Parking
Comments
Parking 2: --
Fee: -- Fee: --
Date %Vac 1BR $ 2BR $ 3BR $
3.4%7/23/18 $795 $895 --
--5/7/14 $556 $675 --
3.4%6/14/11 -- -- --
32.5%8/26/10* -- -- --
* Indicates initial lease-up.
Description BRs Bath Rent SqFt ProgramRent/SF#UnitsFeature
-- -- $815 -- --------
1 1Garden $795 600 Market$1.33----
2 1Garden $895 900 Market$.99----
© 2018 Real Property Research Group, Inc.
GA089-014543Langley Place
(1) Effective Rent is Published Rent, net of concessions and assumes that water, sewer and trash is included in rent (2) Published Rent is rent as quoted by management.
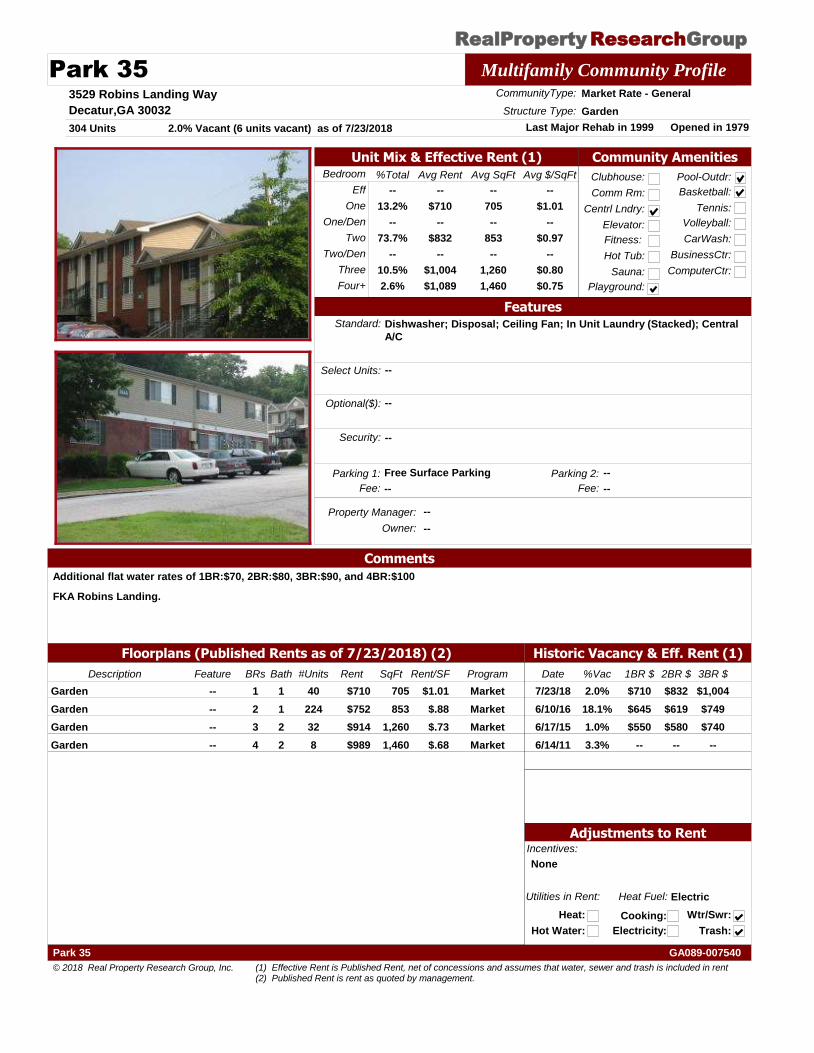
RealProperty Group Research
Park 35 Multifamily Community Profile
3529 Robins Landing Way
Decatur,GA 30032
Property Manager: --
Opened in 1979Last Major Rehab in 1999
CommunityType: Market Rate - General
304 Units
Structure Type: Garden
Owner: --
Historic Vacancy & Eff. Rent (1)
Bedroom Avg $/SqFtAvg SqFt%Total Avg Rent
Eff
One
Two
Three
Four+
One/Den
Two/Den
--
$710
--
$832
--
$1,004
$1,089
--
705
--
853
--
1,260
1,460
--
$1.01
--
$0.97
--
$0.80
$0.75
--
13.2%
--
73.7%
--
10.5%
2.6%
Utilities in Rent:
Heat:
Heat Fuel: Electric
Hot Water:
Cooking:
Electricity:
Wtr/Swr:
Trash:
Community Amenities
Clubhouse:
Comm Rm:
Centrl Lndry:
Fitness:
Hot Tub:
Sauna:
Pool-Outdr:
Playground:
Basketball:
Tennis:
Volleyball:
CarWash:
BusinessCtr:
ComputerCtr:
Floorplans (Published Rents as of 7/23/2018) (2)
Elevator:
2.0% Vacant (6 units vacant) as of 7/23/2018
FeaturesStandard: Dishwasher; Disposal; Ceiling Fan; In Unit Laundry (Stacked); Central
A/C
Select Units: --
Optional($): --
Incentives:
None
Security: --
Unit Mix & Effective Rent (1)
Adjustments to Rent
Parking 1: Free Surface Parking
Comments
Additional flat water rates of 1BR:$70, 2BR:$80, 3BR:$90, and 4BR:$100
FKA Robins Landing.
Parking 2: --
Fee: -- Fee: --
Date %Vac 1BR $ 2BR $ 3BR $
2.0%7/23/18 $710 $832 $1,004
18.1%6/10/16 $645 $619 $749
1.0%6/17/15 $550 $580 $740
3.3%6/14/11 -- -- --
Description BRs Bath Rent SqFt ProgramRent/SF#UnitsFeature
1 1Garden $710 705 Market$1.0140--
2 1Garden $752 853 Market$.88224--
3 2Garden $914 1,260 Market$.7332--
4 2Garden $989 1,460 Market$.688--
© 2018 Real Property Research Group, Inc.
GA089-007540Park 35
(1) Effective Rent is Published Rent, net of concessions and assumes that water, sewer and trash is included in rent (2) Published Rent is rent as quoted by management.
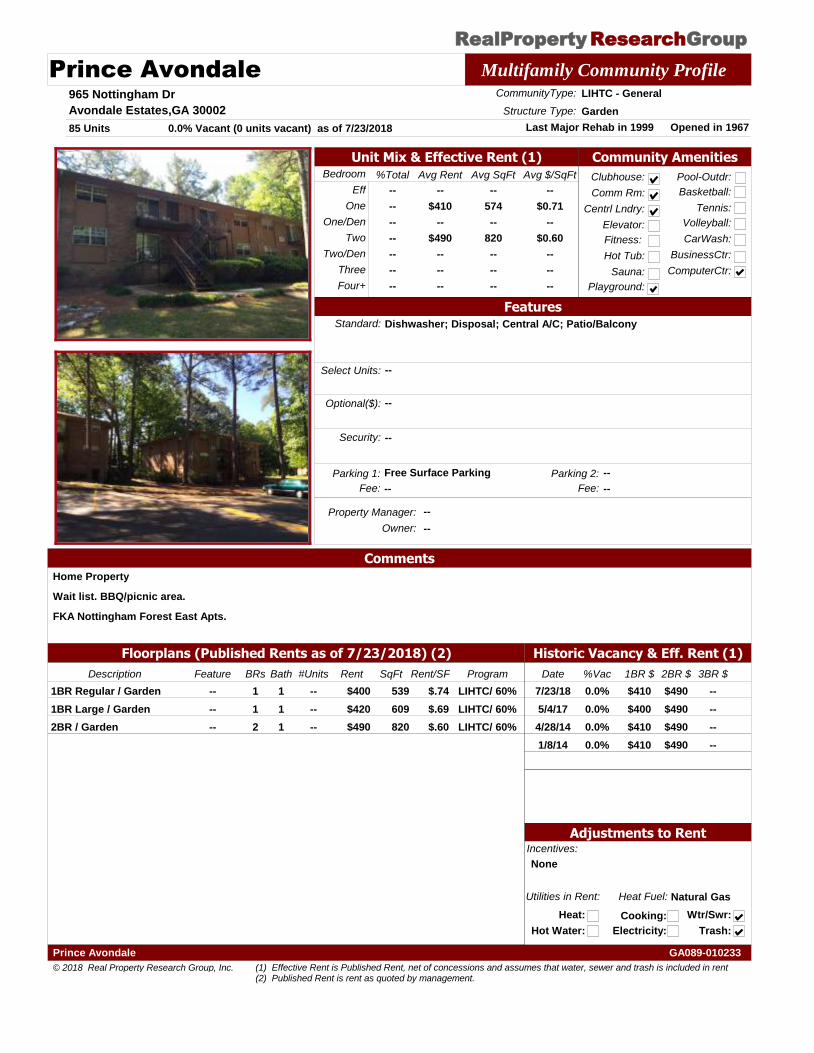
RealProperty Group Research
Prince Avondale Multifamily Community Profile
965 Nottingham Dr
Avondale Estates,GA 30002
Property Manager: --
Opened in 1967Last Major Rehab in 1999
CommunityType: LIHTC - General
85 Units
Structure Type: Garden
Owner: --
Historic Vacancy & Eff. Rent (1)
Bedroom Avg $/SqFtAvg SqFt%Total Avg Rent
Eff
One
Two
Three
Four+
One/Den
Two/Den
--
$410
--
$490
--
--
--
--
574
--
820
--
--
--
--
$0.71
--
$0.60
--
--
--
--
--
--
--
--
--
--
Utilities in Rent:
Heat:
Heat Fuel: Natural Gas
Hot Water:
Cooking:
Electricity:
Wtr/Swr:
Trash:
Community Amenities
Clubhouse:
Comm Rm:
Centrl Lndry:
Fitness:
Hot Tub:
Sauna:
Pool-Outdr:
Playground:
Basketball:
Tennis:
Volleyball:
CarWash:
BusinessCtr:
ComputerCtr:
Floorplans (Published Rents as of 7/23/2018) (2)
Elevator:
0.0% Vacant (0 units vacant) as of 7/23/2018
FeaturesStandard: Dishwasher; Disposal; Central A/C; Patio/Balcony
Select Units: --
Optional($): --
Incentives:
None
Security: --
Unit Mix & Effective Rent (1)
Adjustments to Rent
Parking 1: Free Surface Parking
Comments
Home Property
Wait list. BBQ/picnic area.
FKA Nottingham Forest East Apts.
Parking 2: --
Fee: -- Fee: --
Date %Vac 1BR $ 2BR $ 3BR $
0.0%7/23/18 $410 $490 --
0.0%5/4/17 $400 $490 --
0.0%4/28/14 $410 $490 --
0.0%1/8/14 $410 $490 --
Description BRs Bath Rent SqFt ProgramRent/SF#UnitsFeature
1 11BR Regular / Garden $400 539 LIHTC/ 60%$.74----
1 11BR Large / Garden $420 609 LIHTC/ 60%$.69----
2 12BR / Garden $490 820 LIHTC/ 60%$.60----
© 2018 Real Property Research Group, Inc.
GA089-010233Prince Avondale
(1) Effective Rent is Published Rent, net of concessions and assumes that water, sewer and trash is included in rent (2) Published Rent is rent as quoted by management.
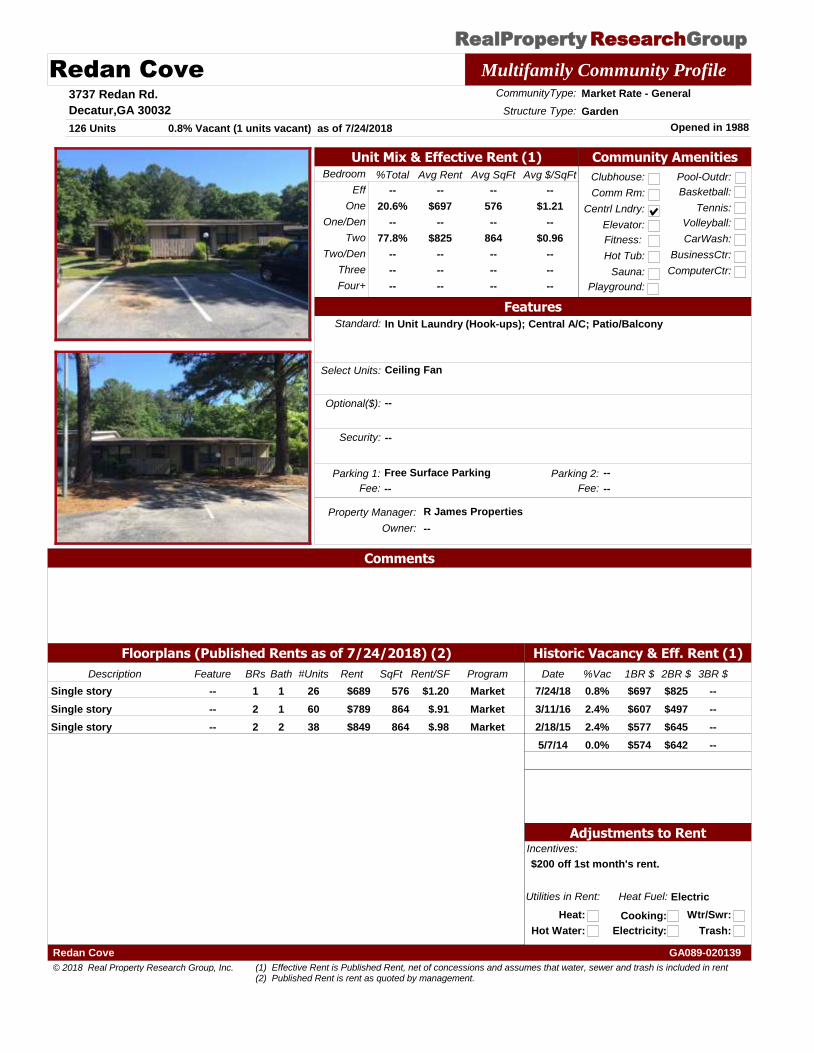
RealProperty Group Research
Redan Cove Multifamily Community Profile
3737 Redan Rd.
Decatur,GA 30032
Property Manager: R James Properties
Opened in 1988
CommunityType: Market Rate - General
126 Units
Structure Type: Garden
Owner: --
Historic Vacancy & Eff. Rent (1)
Bedroom Avg $/SqFtAvg SqFt%Total Avg Rent
Eff
One
Two
Three
Four+
One/Den
Two/Den
--
$697
--
$825
--
--
--
--
576
--
864
--
--
--
--
$1.21
--
$0.96
--
--
--
--
20.6%
--
77.8%
--
--
--
Utilities in Rent:
Heat:
Heat Fuel: Electric
Hot Water:
Cooking:
Electricity:
Wtr/Swr:
Trash:
Community Amenities
Clubhouse:
Comm Rm:
Centrl Lndry:
Fitness:
Hot Tub:
Sauna:
Pool-Outdr:
Playground:
Basketball:
Tennis:
Volleyball:
CarWash:
BusinessCtr:
ComputerCtr:
Floorplans (Published Rents as of 7/24/2018) (2)
Elevator:
0.8% Vacant (1 units vacant) as of 7/24/2018
FeaturesStandard: In Unit Laundry (Hook-ups); Central A/C; Patio/Balcony
Select Units: Ceiling Fan
Optional($): --
Incentives:
$200 off 1st month's rent.
Security: --
Unit Mix & Effective Rent (1)
Adjustments to Rent
Parking 1: Free Surface Parking
Comments
Parking 2: --
Fee: -- Fee: --
Date %Vac 1BR $ 2BR $ 3BR $
0.8%7/24/18 $697 $825 --
2.4%3/11/16 $607 $497 --
2.4%2/18/15 $577 $645 --
0.0%5/7/14 $574 $642 --
Description BRs Bath Rent SqFt ProgramRent/SF#UnitsFeature
1 1Single story $689 576 Market$1.2026--
2 1Single story $789 864 Market$.9160--
2 2Single story $849 864 Market$.9838--
© 2018 Real Property Research Group, Inc.
GA089-020139Redan Cove
(1) Effective Rent is Published Rent, net of concessions and assumes that water, sewer and trash is included in rent (2) Published Rent is rent as quoted by management.
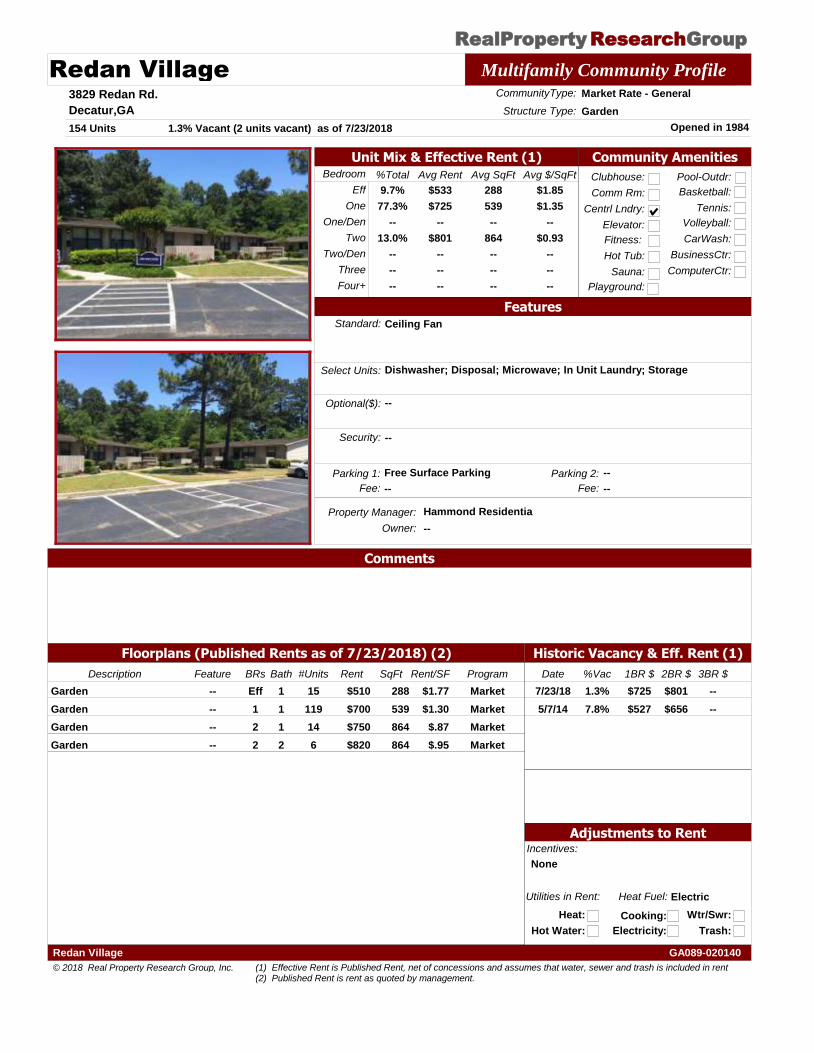
RealProperty Group Research
Redan Village Multifamily Community Profile
3829 Redan Rd.
Decatur,GA
Property Manager: Hammond Residentia
Opened in 1984
CommunityType: Market Rate - General
154 Units
Structure Type: Garden
Owner: --
Historic Vacancy & Eff. Rent (1)
Bedroom Avg $/SqFtAvg SqFt%Total Avg Rent
Eff
One
Two
Three
Four+
One/Den
Two/Den
$533
$725
--
$801
--
--
--
288
539
--
864
--
--
--
$1.85
$1.35
--
$0.93
--
--
--
9.7%
77.3%
--
13.0%
--
--
--
Utilities in Rent:
Heat:
Heat Fuel: Electric
Hot Water:
Cooking:
Electricity:
Wtr/Swr:
Trash:
Community Amenities
Clubhouse:
Comm Rm:
Centrl Lndry:
Fitness:
Hot Tub:
Sauna:
Pool-Outdr:
Playground:
Basketball:
Tennis:
Volleyball:
CarWash:
BusinessCtr:
ComputerCtr:
Floorplans (Published Rents as of 7/23/2018) (2)
Elevator:
1.3% Vacant (2 units vacant) as of 7/23/2018
FeaturesStandard: Ceiling Fan
Select Units: Dishwasher; Disposal; Microwave; In Unit Laundry; Storage
Optional($): --
Incentives:
None
Security: --
Unit Mix & Effective Rent (1)
Adjustments to Rent
Parking 1: Free Surface Parking
Comments
Parking 2: --
Fee: -- Fee: --
Date %Vac 1BR $ 2BR $ 3BR $
1.3%7/23/18 $725 $801 --
7.8%5/7/14 $527 $656 --
Description BRs Bath Rent SqFt ProgramRent/SF#UnitsFeature
Eff 1Garden $510 288 Market$1.7715--
1 1Garden $700 539 Market$1.30119--
2 1Garden $750 864 Market$.8714--
2 2Garden $820 864 Market$.956--
© 2018 Real Property Research Group, Inc.
GA089-020140Redan Village
(1) Effective Rent is Published Rent, net of concessions and assumes that water, sewer and trash is included in rent (2) Published Rent is rent as quoted by management.
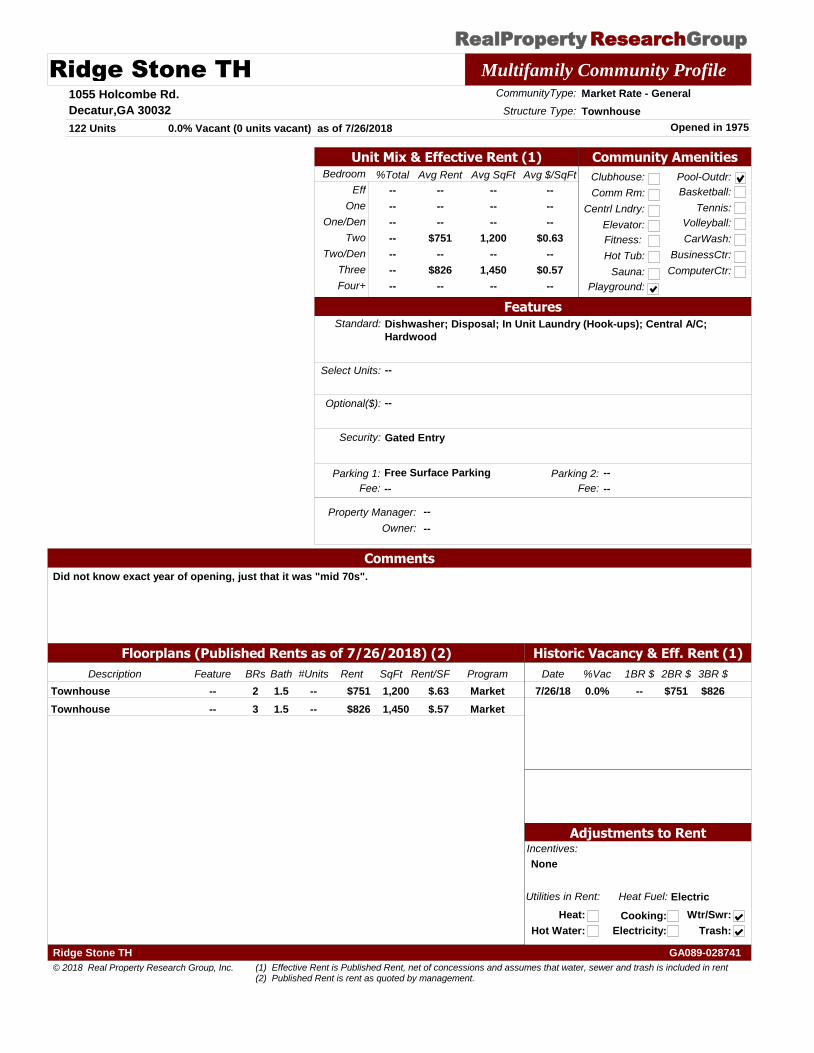
RealProperty Group Research
Ridge Stone TH Multifamily Community Profile
1055 Holcombe Rd.
Decatur,GA 30032
Property Manager: --
Opened in 1975
CommunityType: Market Rate - General
122 Units
Structure Type: Townhouse
Owner: --
Historic Vacancy & Eff. Rent (1)
Bedroom Avg $/SqFtAvg SqFt%Total Avg Rent
Eff
One
Two
Three
Four+
One/Den
Two/Den
--
--
--
$751
--
$826
--
--
--
--
1,200
--
1,450
--
--
--
--
$0.63
--
$0.57
--
--
--
--
--
--
--
--
Utilities in Rent:
Heat:
Heat Fuel: Electric
Hot Water:
Cooking:
Electricity:
Wtr/Swr:
Trash:
Community Amenities
Clubhouse:
Comm Rm:
Centrl Lndry:
Fitness:
Hot Tub:
Sauna:
Pool-Outdr:
Playground:
Basketball:
Tennis:
Volleyball:
CarWash:
BusinessCtr:
ComputerCtr:
Floorplans (Published Rents as of 7/26/2018) (2)
Elevator:
0.0% Vacant (0 units vacant) as of 7/26/2018
FeaturesStandard: Dishwasher; Disposal; In Unit Laundry (Hook-ups); Central A/C;
Hardwood
Select Units: --
Optional($): --
Incentives:
None
Security: Gated Entry
Unit Mix & Effective Rent (1)
Adjustments to Rent
Parking 1: Free Surface Parking
Comments
Did not know exact year of opening, just that it was "mid 70s".
Parking 2: --
Fee: -- Fee: --
Date %Vac 1BR $ 2BR $ 3BR $
0.0%7/26/18 -- $751 $826
Description BRs Bath Rent SqFt ProgramRent/SF#UnitsFeature
2 1.5Townhouse $751 1,200 Market$.63----
3 1.5Townhouse $826 1,450 Market$.57----
© 2018 Real Property Research Group, Inc.
GA089-028741Ridge Stone TH
(1) Effective Rent is Published Rent, net of concessions and assumes that water, sewer and trash is included in rent (2) Published Rent is rent as quoted by management.
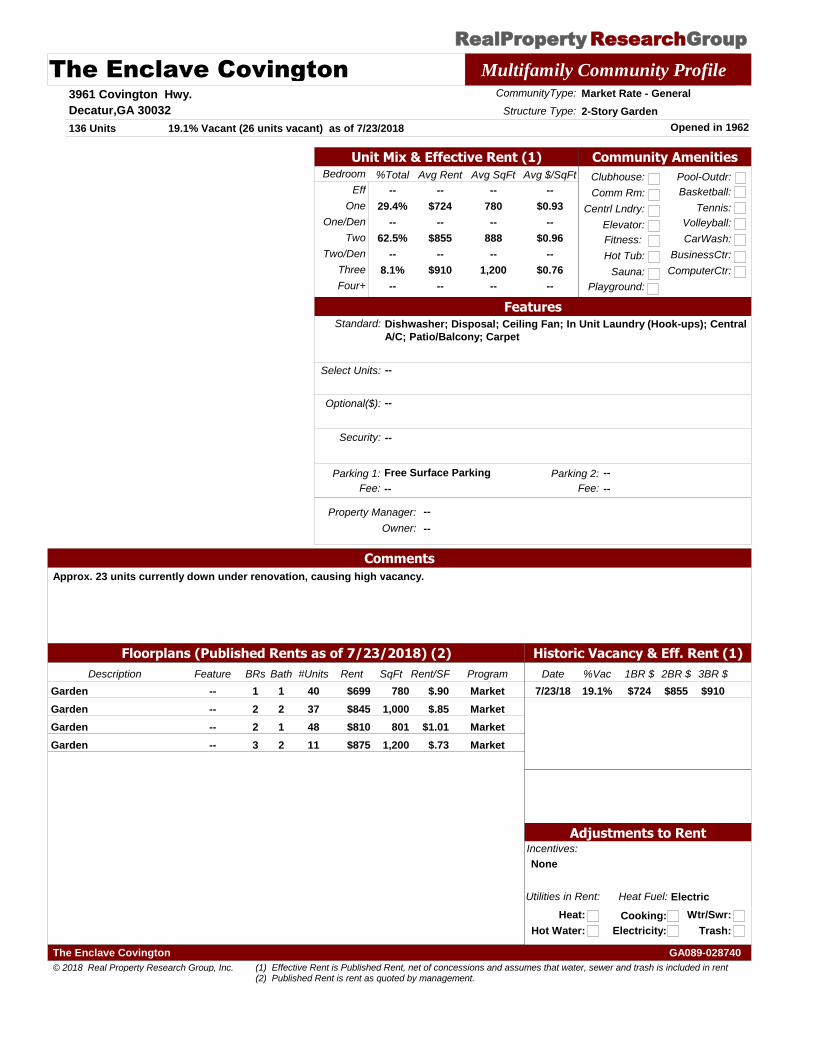
RealProperty Group Research
The Enclave Covington Multifamily Community Profile
3961 Covington Hwy.
Decatur,GA 30032
Property Manager: --
Opened in 1962
CommunityType: Market Rate - General
136 Units
Structure Type: 2-Story Garden
Owner: --
Historic Vacancy & Eff. Rent (1)
Bedroom Avg $/SqFtAvg SqFt%Total Avg Rent
Eff
One
Two
Three
Four+
One/Den
Two/Den
--
$724
--
$855
--
$910
--
--
780
--
888
--
1,200
--
--
$0.93
--
$0.96
--
$0.76
--
--
29.4%
--
62.5%
--
8.1%
--
Utilities in Rent:
Heat:
Heat Fuel: Electric
Hot Water:
Cooking:
Electricity:
Wtr/Swr:
Trash:
Community Amenities
Clubhouse:
Comm Rm:
Centrl Lndry:
Fitness:
Hot Tub:
Sauna:
Pool-Outdr:
Playground:
Basketball:
Tennis:
Volleyball:
CarWash:
BusinessCtr:
ComputerCtr:
Floorplans (Published Rents as of 7/23/2018) (2)
Elevator:
19.1% Vacant (26 units vacant) as of 7/23/2018
FeaturesStandard: Dishwasher; Disposal; Ceiling Fan; In Unit Laundry (Hook-ups); Central
A/C; Patio/Balcony; Carpet
Select Units: --
Optional($): --
Incentives:
None
Security: --
Unit Mix & Effective Rent (1)
Adjustments to Rent
Parking 1: Free Surface Parking
Comments
Approx. 23 units currently down under renovation, causing high vacancy.
Parking 2: --
Fee: -- Fee: --
Date %Vac 1BR $ 2BR $ 3BR $
19.1%7/23/18 $724 $855 $910
Description BRs Bath Rent SqFt ProgramRent/SF#UnitsFeature
1 1Garden $699 780 Market$.9040--
2 2Garden $845 1,000 Market$.8537--
2 1Garden $810 801 Market$1.0148--
3 2Garden $875 1,200 Market$.7311--
© 2018 Real Property Research Group, Inc.
GA089-028740The Enclave Covington
(1) Effective Rent is Published Rent, net of concessions and assumes that water, sewer and trash is included in rent (2) Published Rent is rent as quoted by management.
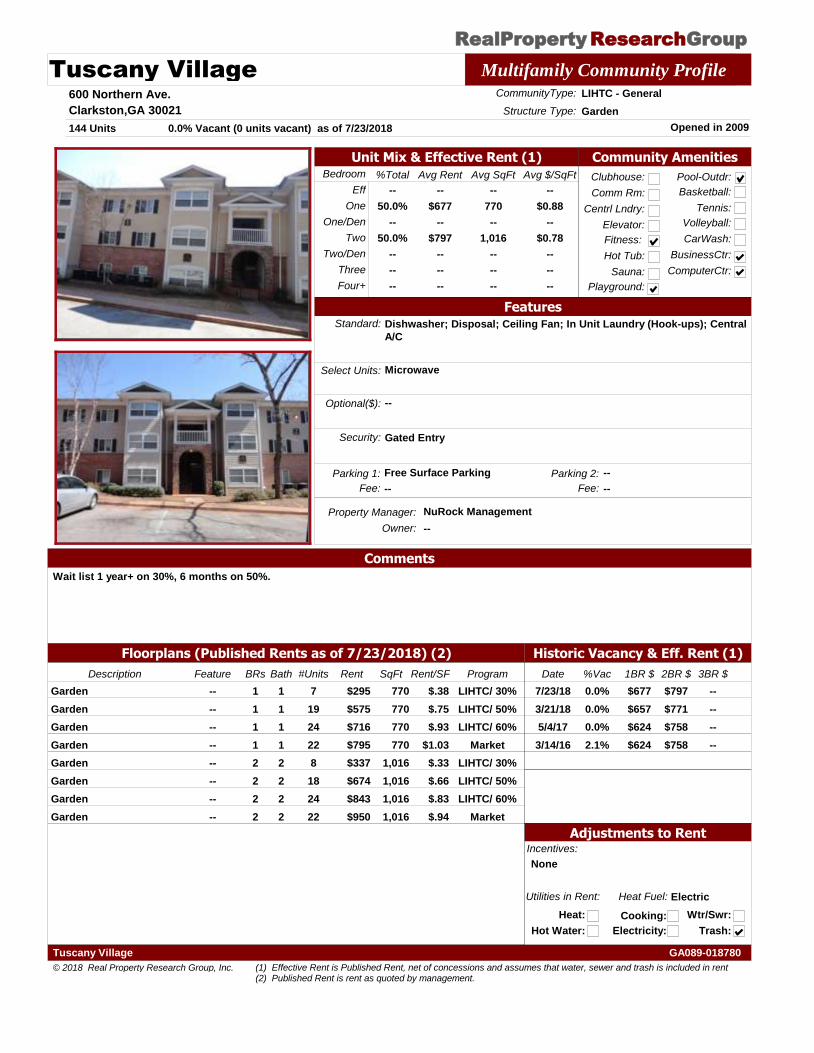
RealProperty Group Research
Tuscany Village Multifamily Community Profile
600 Northern Ave.
Clarkston,GA 30021
Property Manager: NuRock Management
Opened in 2009
CommunityType: LIHTC - General
144 Units
Structure Type: Garden
Owner: --
Historic Vacancy & Eff. Rent (1)
Bedroom Avg $/SqFtAvg SqFt%Total Avg Rent
Eff
One
Two
Three
Four+
One/Den
Two/Den
--
$677
--
$797
--
--
--
--
770
--
1,016
--
--
--
--
$0.88
--
$0.78
--
--
--
--
50.0%
--
50.0%
--
--
--
Utilities in Rent:
Heat:
Heat Fuel: Electric
Hot Water:
Cooking:
Electricity:
Wtr/Swr:
Trash:
Community Amenities
Clubhouse:
Comm Rm:
Centrl Lndry:
Fitness:
Hot Tub:
Sauna:
Pool-Outdr:
Playground:
Basketball:
Tennis:
Volleyball:
CarWash:
BusinessCtr:
ComputerCtr:
Floorplans (Published Rents as of 7/23/2018) (2)
Elevator:
0.0% Vacant (0 units vacant) as of 7/23/2018
FeaturesStandard: Dishwasher; Disposal; Ceiling Fan; In Unit Laundry (Hook-ups); Central
A/C
Select Units: Microwave
Optional($): --
Incentives:
None
Security: Gated Entry
Unit Mix & Effective Rent (1)
Adjustments to Rent
Parking 1: Free Surface Parking
Comments
Wait list 1 year+ on 30%, 6 months on 50%.
Parking 2: --
Fee: -- Fee: --
Date %Vac 1BR $ 2BR $ 3BR $
0.0%7/23/18 $677 $797 --
0.0%3/21/18 $657 $771 --
0.0%5/4/17 $624 $758 --
2.1%3/14/16 $624 $758 --
Description BRs Bath Rent SqFt ProgramRent/SF#UnitsFeature
1 1Garden $295 770 LIHTC/ 30%$.387--
1 1Garden $575 770 LIHTC/ 50%$.7519--
1 1Garden $716 770 LIHTC/ 60%$.9324--
1 1Garden $795 770 Market$1.0322--
2 2Garden $337 1,016 LIHTC/ 30%$.338--
2 2Garden $674 1,016 LIHTC/ 50%$.6618--
2 2Garden $843 1,016 LIHTC/ 60%$.8324--
2 2Garden $950 1,016 Market$.9422--
© 2018 Real Property Research Group, Inc.
GA089-018780Tuscany Village
(1) Effective Rent is Published Rent, net of concessions and assumes that water, sewer and trash is included in rent (2) Published Rent is rent as quoted by management.
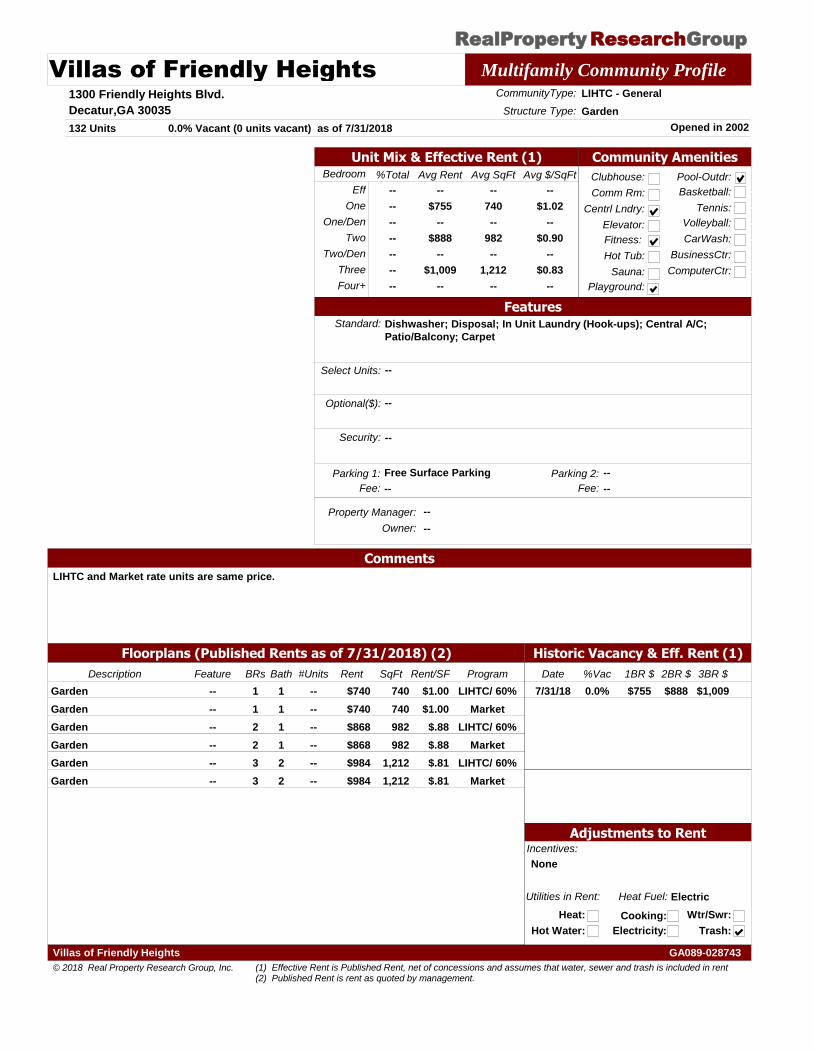
RealProperty Group Research
Villas of Friendly Heights Multifamily Community Profile
1300 Friendly Heights Blvd.
Decatur,GA 30035
Property Manager: --
Opened in 2002
CommunityType: LIHTC - General
132 Units
Structure Type: Garden
Owner: --
Historic Vacancy & Eff. Rent (1)
Bedroom Avg $/SqFtAvg SqFt%Total Avg Rent
Eff
One
Two
Three
Four+
One/Den
Two/Den
--
$755
--
$888
--
$1,009
--
--
740
--
982
--
1,212
--
--
$1.02
--
$0.90
--
$0.83
--
--
--
--
--
--
--
--
Utilities in Rent:
Heat:
Heat Fuel: Electric
Hot Water:
Cooking:
Electricity:
Wtr/Swr:
Trash:
Community Amenities
Clubhouse:
Comm Rm:
Centrl Lndry:
Fitness:
Hot Tub:
Sauna:
Pool-Outdr:
Playground:
Basketball:
Tennis:
Volleyball:
CarWash:
BusinessCtr:
ComputerCtr:
Floorplans (Published Rents as of 7/31/2018) (2)
Elevator:
0.0% Vacant (0 units vacant) as of 7/31/2018
FeaturesStandard: Dishwasher; Disposal; In Unit Laundry (Hook-ups); Central A/C;
Patio/Balcony; Carpet
Select Units: --
Optional($): --
Incentives:
None
Security: --
Unit Mix & Effective Rent (1)
Adjustments to Rent
Parking 1: Free Surface Parking
Comments
LIHTC and Market rate units are same price.
Parking 2: --
Fee: -- Fee: --
Date %Vac 1BR $ 2BR $ 3BR $
0.0%7/31/18 $755 $888 $1,009
Description BRs Bath Rent SqFt ProgramRent/SF#UnitsFeature
1 1Garden $740 740 LIHTC/ 60%$1.00----
1 1Garden $740 740 Market$1.00----
2 1Garden $868 982 LIHTC/ 60%$.88----
2 1Garden $868 982 Market$.88----
3 2Garden $984 1,212 LIHTC/ 60%$.81----
3 2Garden $984 1,212 Market$.81----
© 2018 Real Property Research Group, Inc.
GA089-028743Villas of Friendly Heights
(1) Effective Rent is Published Rent, net of concessions and assumes that water, sewer and trash is included in rent (2) Published Rent is rent as quoted by management.
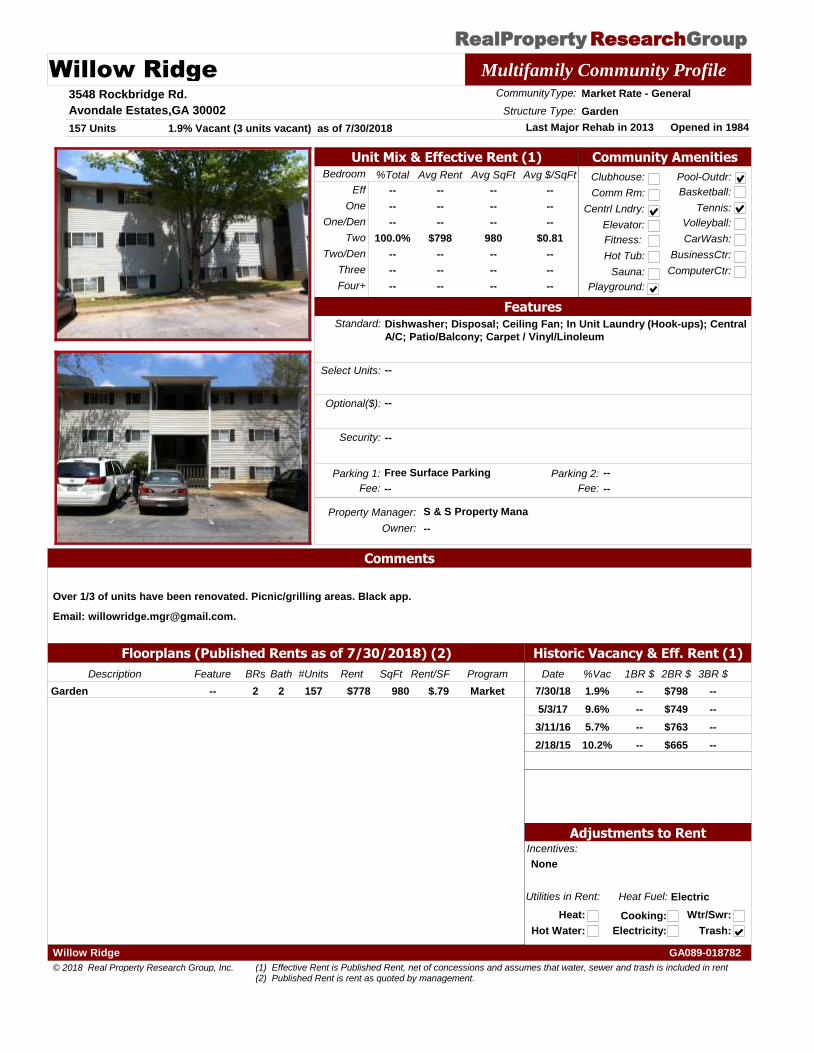
RealProperty Group Research
Willow Ridge Multifamily Community Profile
3548 Rockbridge Rd.
Avondale Estates,GA 30002
Property Manager: S & S Property Mana
Opened in 1984Last Major Rehab in 2013
CommunityType: Market Rate - General
157 Units
Structure Type: Garden
Owner: --
Historic Vacancy & Eff. Rent (1)
Bedroom Avg $/SqFtAvg SqFt%Total Avg Rent
Eff
One
Two
Three
Four+
One/Den
Two/Den
--
--
--
$798
--
--
--
--
--
--
980
--
--
--
--
--
--
$0.81
--
--
--
--
--
--
100.0%
--
--
--
Utilities in Rent:
Heat:
Heat Fuel: Electric
Hot Water:
Cooking:
Electricity:
Wtr/Swr:
Trash:
Community Amenities
Clubhouse:
Comm Rm:
Centrl Lndry:
Fitness:
Hot Tub:
Sauna:
Pool-Outdr:
Playground:
Basketball:
Tennis:
Volleyball:
CarWash:
BusinessCtr:
ComputerCtr:
Floorplans (Published Rents as of 7/30/2018) (2)
Elevator:
1.9% Vacant (3 units vacant) as of 7/30/2018
FeaturesStandard: Dishwasher; Disposal; Ceiling Fan; In Unit Laundry (Hook-ups); Central
A/C; Patio/Balcony; Carpet / Vinyl/Linoleum
Select Units: --
Optional($): --
Incentives:
None
Security: --
Unit Mix & Effective Rent (1)
Adjustments to Rent
Parking 1: Free Surface Parking
Comments
Over 1/3 of units have been renovated. Picnic/grilling areas. Black app.
Email: [email protected].
Parking 2: --
Fee: -- Fee: --
Date %Vac 1BR $ 2BR $ 3BR $
1.9%7/30/18 -- $798 --
9.6%5/3/17 -- $749 --
5.7%3/11/16 -- $763 --
10.2%2/18/15 -- $665 --
Description BRs Bath Rent SqFt ProgramRent/SF#UnitsFeature
2 2Garden $778 980 Market$.79157--
© 2018 Real Property Research Group, Inc.
GA089-018782Willow Ridge
(1) Effective Rent is Published Rent, net of concessions and assumes that water, sewer and trash is included in rent (2) Published Rent is rent as quoted by management.
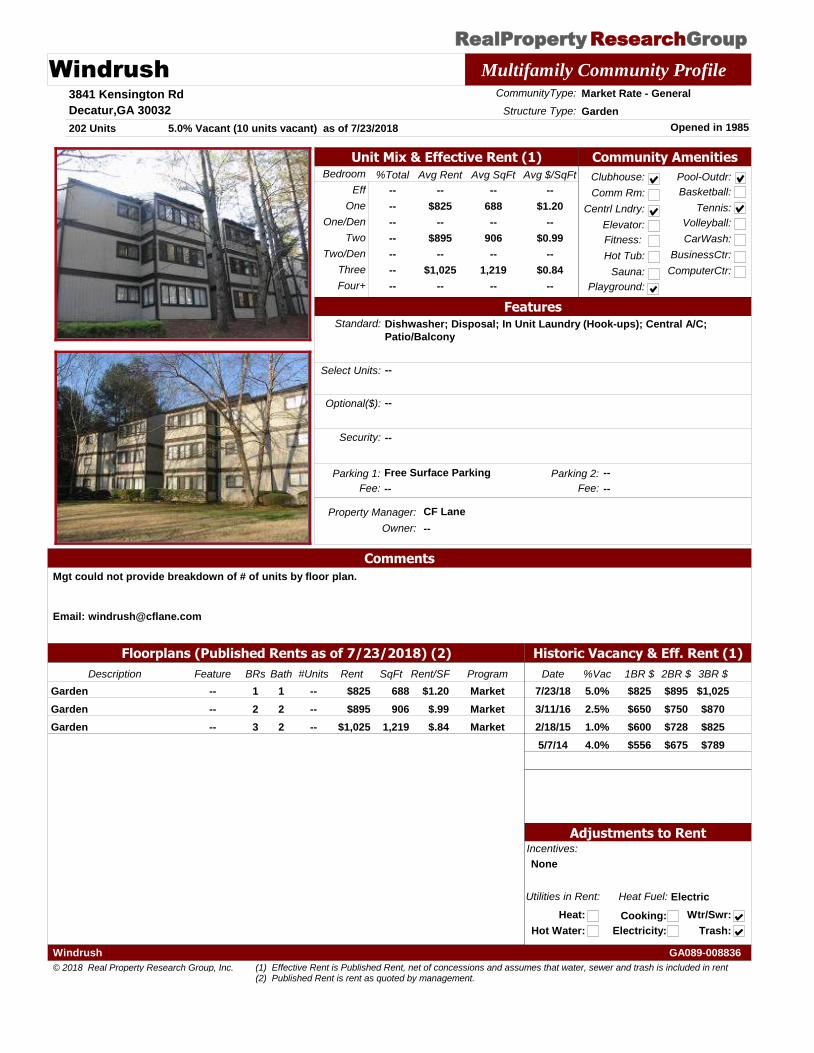
RealProperty Group Research
Windrush Multifamily Community Profile
3841 Kensington Rd
Decatur,GA 30032
Property Manager: CF Lane
Opened in 1985
CommunityType: Market Rate - General
202 Units
Structure Type: Garden
Owner: --
Historic Vacancy & Eff. Rent (1)
Bedroom Avg $/SqFtAvg SqFt%Total Avg Rent
Eff
One
Two
Three
Four+
One/Den
Two/Den
--
$825
--
$895
--
$1,025
--
--
688
--
906
--
1,219
--
--
$1.20
--
$0.99
--
$0.84
--
--
--
--
--
--
--
--
Utilities in Rent:
Heat:
Heat Fuel: Electric
Hot Water:
Cooking:
Electricity:
Wtr/Swr:
Trash:
Community Amenities
Clubhouse:
Comm Rm:
Centrl Lndry:
Fitness:
Hot Tub:
Sauna:
Pool-Outdr:
Playground:
Basketball:
Tennis:
Volleyball:
CarWash:
BusinessCtr:
ComputerCtr:
Floorplans (Published Rents as of 7/23/2018) (2)
Elevator:
5.0% Vacant (10 units vacant) as of 7/23/2018
FeaturesStandard: Dishwasher; Disposal; In Unit Laundry (Hook-ups); Central A/C;
Patio/Balcony
Select Units: --
Optional($): --
Incentives:
None
Security: --
Unit Mix & Effective Rent (1)
Adjustments to Rent
Parking 1: Free Surface Parking
Comments
Mgt could not provide breakdown of # of units by floor plan.
Email: [email protected]
Parking 2: --
Fee: -- Fee: --
Date %Vac 1BR $ 2BR $ 3BR $
5.0%7/23/18 $825 $895 $1,025
2.5%3/11/16 $650 $750 $870
1.0%2/18/15 $600 $728 $825
4.0%5/7/14 $556 $675 $789
Description BRs Bath Rent SqFt ProgramRent/SF#UnitsFeature
1 1Garden $825 688 Market$1.20----
2 2Garden $895 906 Market$.99----
3 2Garden $1,025 1,219 Market$.84----
© 2018 Real Property Research Group, Inc.
GA089-008836Windrush
(1) Effective Rent is Published Rent, net of concessions and assumes that water, sewer and trash is included in rent (2) Published Rent is rent as quoted by management.