Embed Size (px)
Citation preview
1
Indian Commercial Vehicle Industry Sector Report
Auto & Auto Ancillary Outlook : BULLISH
Ashok Leyland - Buy CMP: Rs69 Target price : Rs85 Upside: 23.1% Atul Auto – Buy CMP: Rs583 Target price : Rs740 Upside: 26.9% Eicher Motors – Buy CMP: Rs16938 Target price : Rs20079 Upside: 18.5% Force Motors - Accumulate CMP: Rs1413 Target price : Rs1538 Upside: 8.8% SML Isuzu - Buy CMP: Rs1005 Target price : Rs1222 Upside: 21.5% Indag Rubber- Buy CMP: Rs876 Target price : Rs1092 Upside: 24.7% Vidrum Mehta Research Analyst [email protected] Arun Gopalan VP – Research & Investments [email protected] February 19, 2015
The Indian Commercial Vehicle (CV) Industry is all set for a cyclical revival in demand going forward. The green shoots are visible as the overall domestic CV volumes is likely to grow by 10% in FY15 as against de-growth of 20% and 2% during FY14 and FY13 respectively. The recovery further looks promising as the volumes of Medium & Heavy Commercial Vehicle (M&HCV) one of the leading indicator grew by 13.9% in 9MFY15 as against a de-growth of more than 20% each in FY13 and FY14. Further the strong correlation between GDP and the growth in CV Industry emphasis that overall revival in the economy is bound to have a positive impact on the CV. The Government’s policy actions like diesel deregulation, opening up infrastructure and mining activity, plans to construct 30kms of road a day from FY16 onwards, faster project clearances is likely to result into higher industrial activities. The health of fleet operators is also better, after the steep fall in crude prices has resulted in lower fuel costs (which account for 40%-50% of operating cost), higher freight rates, improved utilization and softening of interest rates is likely to lower the cost of borrowing. With overall economic and industrial activity likely to improve we expect the demand for CVs to revive from FY16E and expect a cyclical revival in the entire CV segment. The bigger growth opportunities lies in the smaller companies and hence are positive on Ashok Leyland, Eicher Motors, Atul Auto and SML Isuzu. We are also positive on Indag rubber, which is a leading tyre re-treading company and would benefit directly from a revival in the CV cycle.
The new Central Government focuses on reforms --
Acceleration in reforms – The Government has undertaken various measures/steps and initiatives like faster clearances of projects, opening up mining sector are likely to boost Industrial activity. According to media reports, the Goa state government has issued an order revoking its 2012 decision that had halted over 60-year-old-mining industry. The new order will pave the way for the resumption of mining activities in the states. In addition government has taken various indirect measures like 100% FDI allowance under the automatic route in the road and highways sector and Standardized processes for PPP projects resulting into clear policy framework relating to bidding and tolling. We believe the governments reformist actions is a key positive for overall economic and the CV Industry growth going forward.
Focus on infrastructure development - The government has kept infrastructure development as one of its key priority to revive the economic growth. At present India has an extensive road network of 4.9 million kms and is the 2
nd largest in the
world after US. Government is focusing on construction of roads, extension and expansion of national highways (NH) (2 lanes to 4 lanes to 6 lanes) which is likely to boost infrastructure in India. According to reports, Road Transport and Highways minister has set the road construction target of 30 km per day from FY16 onwards. The actual road construction during 8MFY15 (April to Nov 2014) was ~8.5 km/day as against the targeted of 17 km/day. Of the total road network, NH accounts less than 2%, ~92,850 kms as of FY14 and is likely to touch 100,000 kms by FY17. Since ~40% of the vehicle traffic is carried by NH, development of the same is likely positive for the overall Auto industry and especially CV space.
Fleet operators in a much better state: The fleet operating cost is likely to come down mainly after lower diesel prices and softening of interest rates. Over the last 8 months, Brent Crude prices have declined ~46% to $62 per barrel (at five and half year low) resulting into lower fuel cost. Even though the benefit is not fully passed on, the prices of petrol and diesel are down ~20% each during the same period. The operating cost of the fleet owners has also reduced as fuel accounts for 40%-50% of the overall cost. Despite the fall in fuel cost, domestic freight rates in India have not fallen over the last 6 to 8 months. We believe this is positive for the fleet owners which faced severe headwinds in the past 3 years and are now likely to generate higher cash flows not only from lower operating cost but also from steady realizations. RBI also lowered the interest rate which is likely to reduce the cost of borrowing and aid profitability of the fleet-owners.
Green shoots visible: The overall CV volumes are likely to grow ~ 10% for FY15 as compared to de-growth of 20% in FY14 and 2% in FY13. We believe strong revival in demand coupled with governments focus towards infrastructure development and favorable industry dynamics like lower fuel cost and softening of interest rates would further revive the CV demand going forward and hence we are positive of the CV Industry.
2
Indian Commercial Vehicle Industry
Government’s strong policy initiatives…
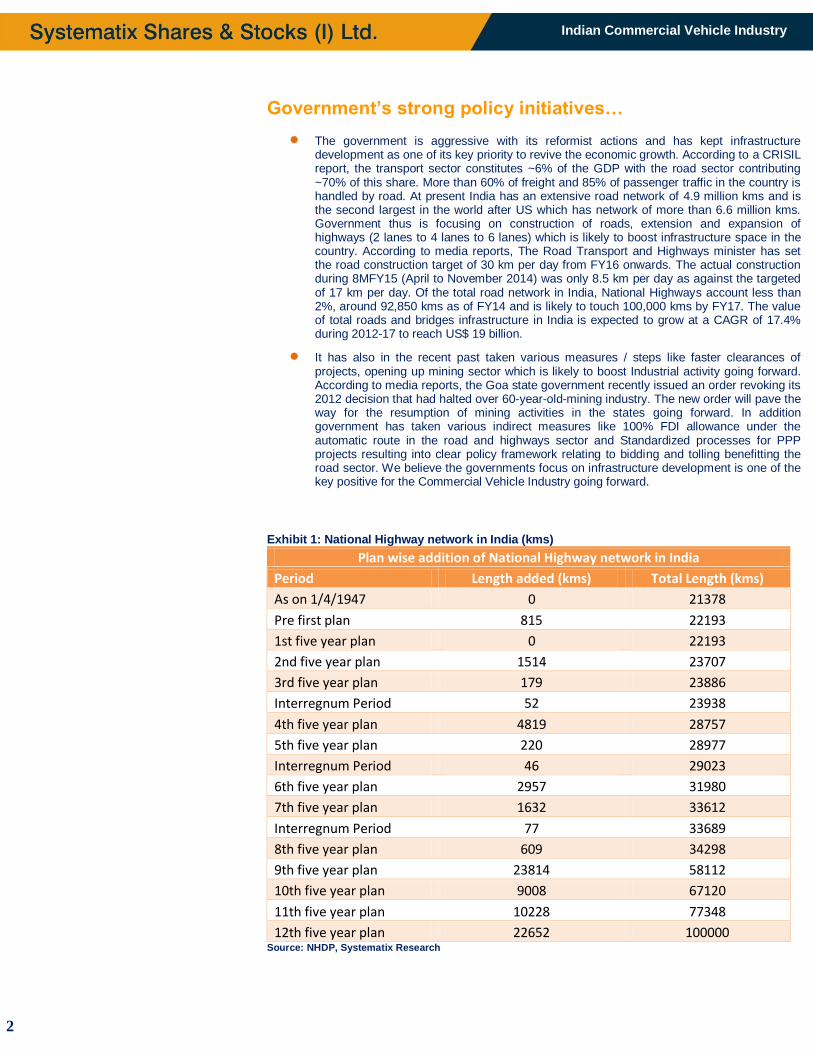
The government is aggressive with its reformist actions and has kept infrastructure development as one of its key priority to revive the economic growth. According to a CRISIL report, the transport sector constitutes ~6% of the GDP with the road sector contributing ~70% of this share. More than 60% of freight and 85% of passenger traffic in the country is handled by road. At present India has an extensive road network of 4.9 million kms and is the second largest in the world after US which has network of more than 6.6 million kms. Government thus is focusing on construction of roads, extension and expansion of highways (2 lanes to 4 lanes to 6 lanes) which is likely to boost infrastructure space in the country. According to media reports, The Road Transport and Highways minister has set the road construction target of 30 km per day from FY16 onwards. The actual construction during 8MFY15 (April to November 2014) was only 8.5 km per day as against the targeted of 17 km per day. Of the total road network in India, National Highways account less than 2%, around 92,850 kms as of FY14 and is likely to touch 100,000 kms by FY17. The value of total roads and bridges infrastructure in India is expected to grow at a CAGR of 17.4% during 2012-17 to reach US$ 19 billion.
It has also in the recent past taken various measures / steps like faster clearances of projects, opening up mining sector which is likely to boost Industrial activity going forward. According to media reports, the Goa state government recently issued an order revoking its 2012 decision that had halted over 60-year-old-mining industry. The new order will pave the way for the resumption of mining activities in the states going forward. In addition government has taken various indirect measures like 100% FDI allowance under the automatic route in the road and highways sector and Standardized processes for PPP projects resulting into clear policy framework relating to bidding and tolling benefitting the road sector. We believe the governments focus on infrastructure development is one of the key positive for the Commercial Vehicle Industry going forward.
Exhibit 1: National Highway network in India (kms)
Plan wise addition of National Highway network in India
Period Length added (kms) Total Length (kms)
As on 1/4/1947 0 21378
Pre first plan 815 22193
1st five year plan 0 22193
2nd five year plan 1514 23707
3rd five year plan 179 23886
Interregnum Period 52 23938
4th five year plan 4819 28757
5th five year plan 220 28977
Interregnum Period 46 29023
6th five year plan 2957 31980
7th five year plan 1632 33612
Interregnum Period 77 33689
8th five year plan 609 34298
9th five year plan 23814 58112
10th five year plan 9008 67120
11th five year plan 10228 77348
12th five year plan 22652 100000 Source: NHDP, Systematix Research
3
Indian Commercial Vehicle Industry
Strong Correlation with GDP growth
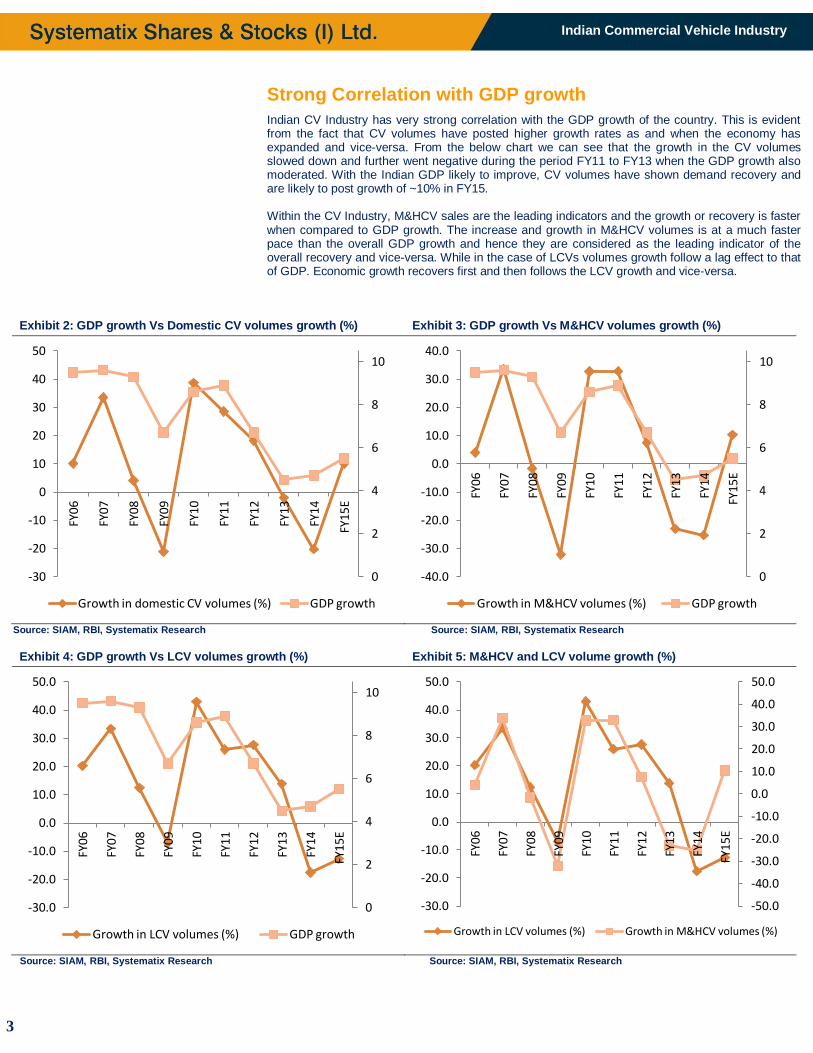
Indian CV Industry has very strong correlation with the GDP growth of the country. This is evident from the fact that CV volumes have posted higher growth rates as and when the economy has expanded and vice-versa. From the below chart we can see that the growth in the CV volumes slowed down and further went negative during the period FY11 to FY13 when the GDP growth also moderated. With the Indian GDP likely to improve, CV volumes have shown demand recovery and are likely to post growth of ~10% in FY15. Within the CV Industry, M&HCV sales are the leading indicators and the growth or recovery is faster when compared to GDP growth. The increase and growth in M&HCV volumes is at a much faster pace than the overall GDP growth and hence they are considered as the leading indicator of the overall recovery and vice-versa. While in the case of LCVs volumes growth follow a lag effect to that of GDP. Economic growth recovers first and then follows the LCV growth and vice-versa.
Exhibit 2: GDP growth Vs Domestic CV volumes growth (%) Exhibit 3: GDP growth Vs M&HCV volumes growth (%)
Source: SIAM, RBI, Systematix Research Source: SIAM, RBI, Systematix Research
Exhibit 4: GDP growth Vs LCV volumes growth (%) Exhibit 5: M&HCV and LCV volume growth (%)
Source: SIAM, RBI, Systematix Research Source: SIAM, RBI, Systematix Research
0
2
4
6
8
10
-30
-20
-10
0
10
20
30
40
50
FY06
FY07
FY08
FY09
FY10
FY11
FY12
FY13
FY14
FY15
E
Growth in domestic CV volumes (%) GDP growth
0
2
4
6
8
10
-40.0
-30.0
-20.0
-10.0
0.0
10.0
20.0
30.0
40.0
FY06
FY07
FY08
FY09
FY10
FY11
FY12
FY13
FY14
FY15
E
Growth in M&HCV volumes (%) GDP growth
0
2
4
6
8
10
-30.0
-20.0
-10.0
0.0
10.0
20.0
30.0
40.0
50.0
FY0
6
FY0
7
FY0
8
FY0
9
FY1
0
FY1
1
FY1
2
FY1
3
FY1
4
FY15
E
Growth in LCV volumes (%) GDP growth
-50.0
-40.0
-30.0
-20.0
-10.0
0.0
10.0
20.0
30.0
40.0
50.0
-30.0
-20.0
-10.0
0.0
10.0
20.0
30.0
40.0
50.0
FY06
FY07
FY08
FY09
FY10
FY11
FY12
FY13
FY14
FY1
5E
Growth in LCV volumes (%) Growth in M&HCV volumes (%)
4
Indian Commercial Vehicle Industry
Mining activity improves over the last 12 months.
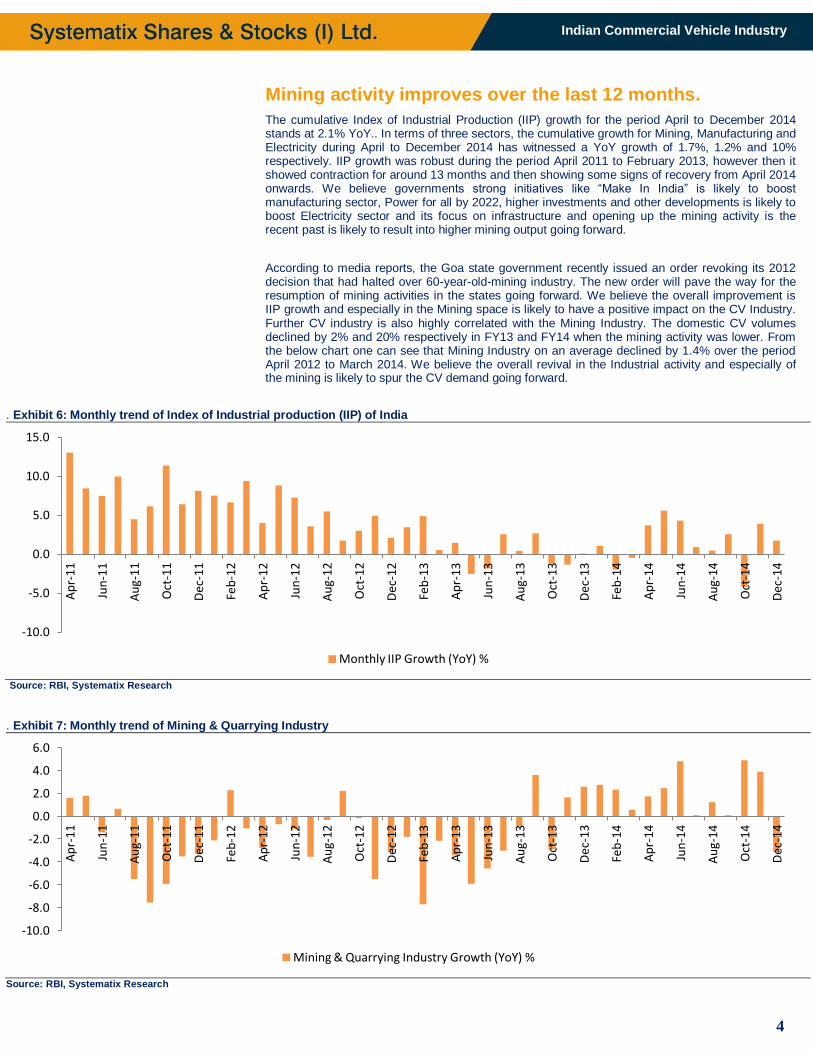
The cumulative Index of Industrial Production (IIP) growth for the period April to December 2014 stands at 2.1% YoY.. In terms of three sectors, the cumulative growth for Mining, Manufacturing and Electricity during April to December 2014 has witnessed a YoY growth of 1.7%, 1.2% and 10% respectively. IIP growth was robust during the period April 2011 to February 2013, however then it showed contraction for around 13 months and then showing some signs of recovery from April 2014 onwards. We believe governments strong initiatives like “Make In India” is likely to boost manufacturing sector, Power for all by 2022, higher investments and other developments is likely to boost Electricity sector and its focus on infrastructure and opening up the mining activity is the recent past is likely to result into higher mining output going forward.
According to media reports, the Goa state government recently issued an order revoking its 2012 decision that had halted over 60-year-old-mining industry. The new order will pave the way for the resumption of mining activities in the states going forward. We believe the overall improvement is IIP growth and especially in the Mining space is likely to have a positive impact on the CV Industry. Further CV industry is also highly correlated with the Mining Industry. The domestic CV volumes declined by 2% and 20% respectively in FY13 and FY14 when the mining activity was lower. From the below chart one can see that Mining Industry on an average declined by 1.4% over the period April 2012 to March 2014. We believe the overall revival in the Industrial activity and especially of the mining is likely to spur the CV demand going forward.
. Exhibit 6: Monthly trend of Index of Industrial production (IIP) of India
Source: RBI, Systematix Research
. Exhibit 7: Monthly trend of Mining & Quarrying Industry
Source: RBI, Systematix Research
-10.0
-5.0
0.0
5.0
10.0
15.0
Ap
r-1
1
Jun
-11
Au
g-11
Oct
-11
Dec
-11
Feb
-12
Ap
r-1
2
Jun
-12
Au
g-12
Oct
-12
Dec
-12
Feb
-13
Ap
r-1
3
Jun
-13
Au
g-13
Oct
-13
Dec
-13
Feb
-14
Ap
r-1
4
Jun
-14
Au
g-14
Oct
-14
Dec
-14
Monthly IIP Growth (YoY) %
-10.0
-8.0
-6.0
-4.0
-2.0
0.0
2.0
4.0
6.0
Ap
r-11
Jun
-11
Au
g-11
Oct
-11
Dec
-11
Feb
-12
Ap
r-12
Jun
-12
Au
g-12
Oct
-12
Dec
-12
Feb
-13
Ap
r-13
Jun
-13
Au
g-13
Oct
-13
Dec
-13
Feb
-14
Ap
r-14
Jun
-14
Au
g-14
Oct
-14
Dec
-14
Mining & Quarrying Industry Growth (YoY) %
5
Indian Commercial Vehicle Industry
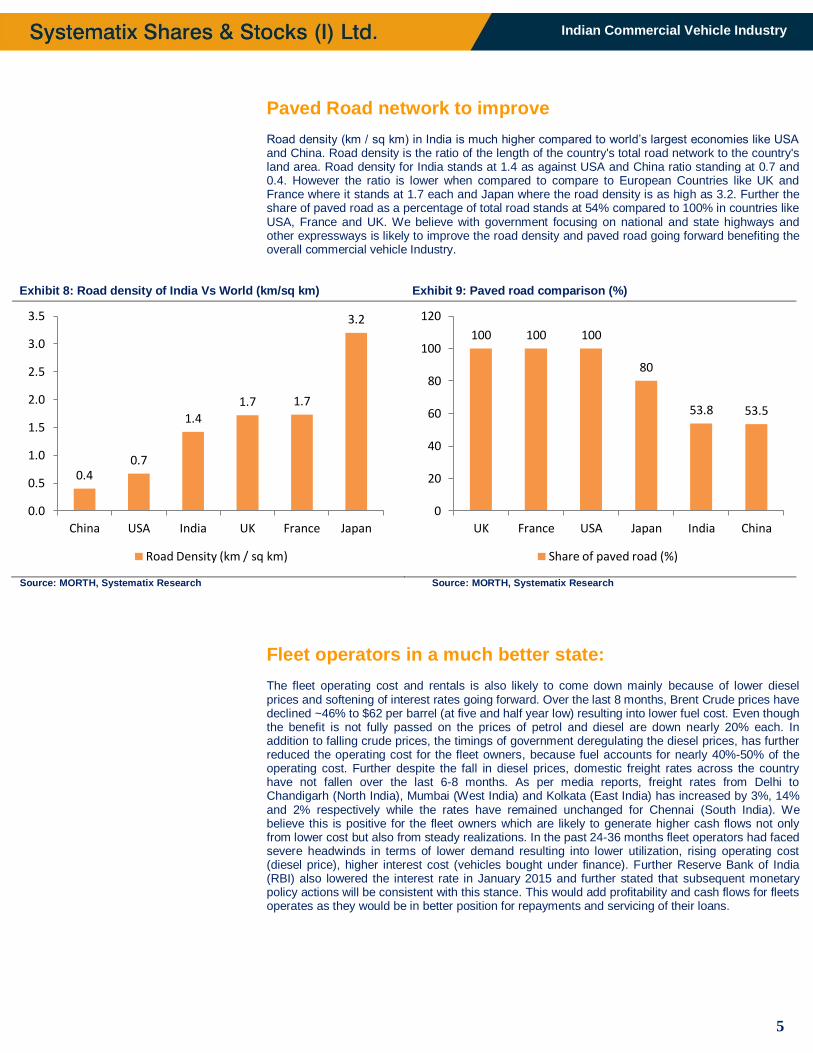
Paved Road network to improve Road density (km / sq km) in India is much higher compared to world’s largest economies like USA and China. Road density is the ratio of the length of the country's total road network to the country's land area. Road density for India stands at 1.4 as against USA and China ratio standing at 0.7 and 0.4. However the ratio is lower when compared to compare to European Countries like UK and France where it stands at 1.7 each and Japan where the road density is as high as 3.2. Further the share of paved road as a percentage of total road stands at 54% compared to 100% in countries like USA, France and UK. We believe with government focusing on national and state highways and other expressways is likely to improve the road density and paved road going forward benefiting the overall commercial vehicle Industry.
Exhibit 8: Road density of India Vs World (km/sq km) Exhibit 9: Paved road comparison (%)
Source: MORTH, Systematix Research Source: MORTH, Systematix Research
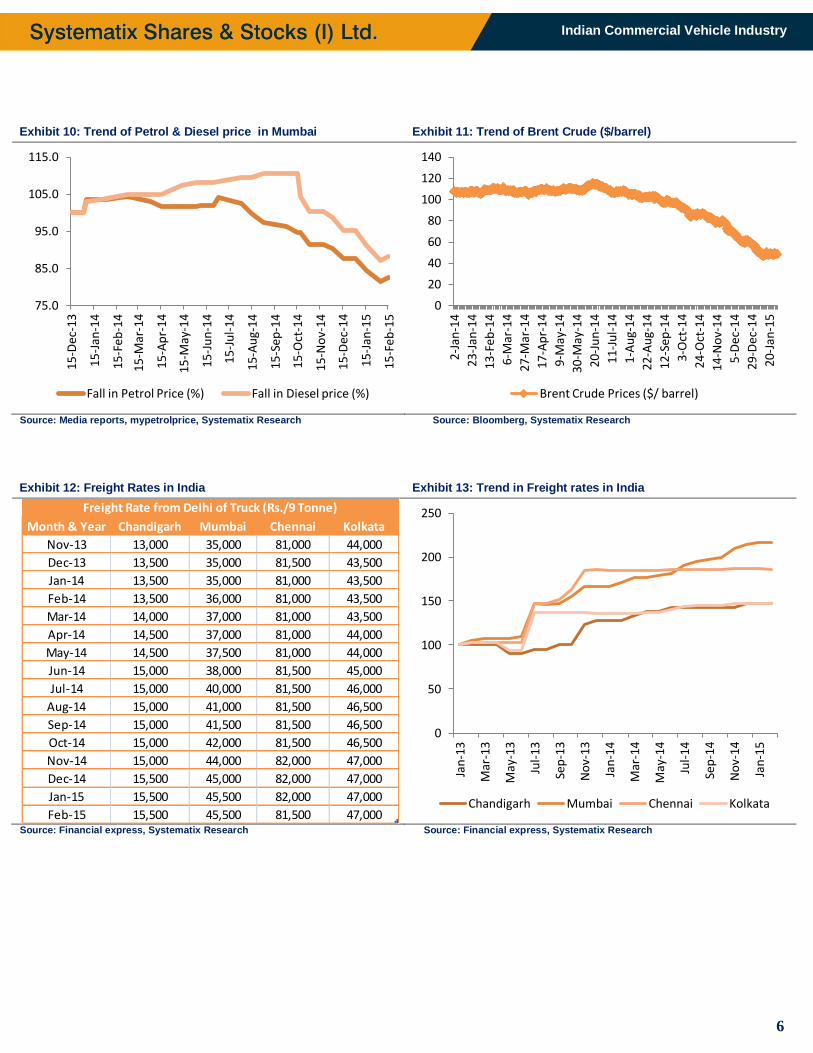
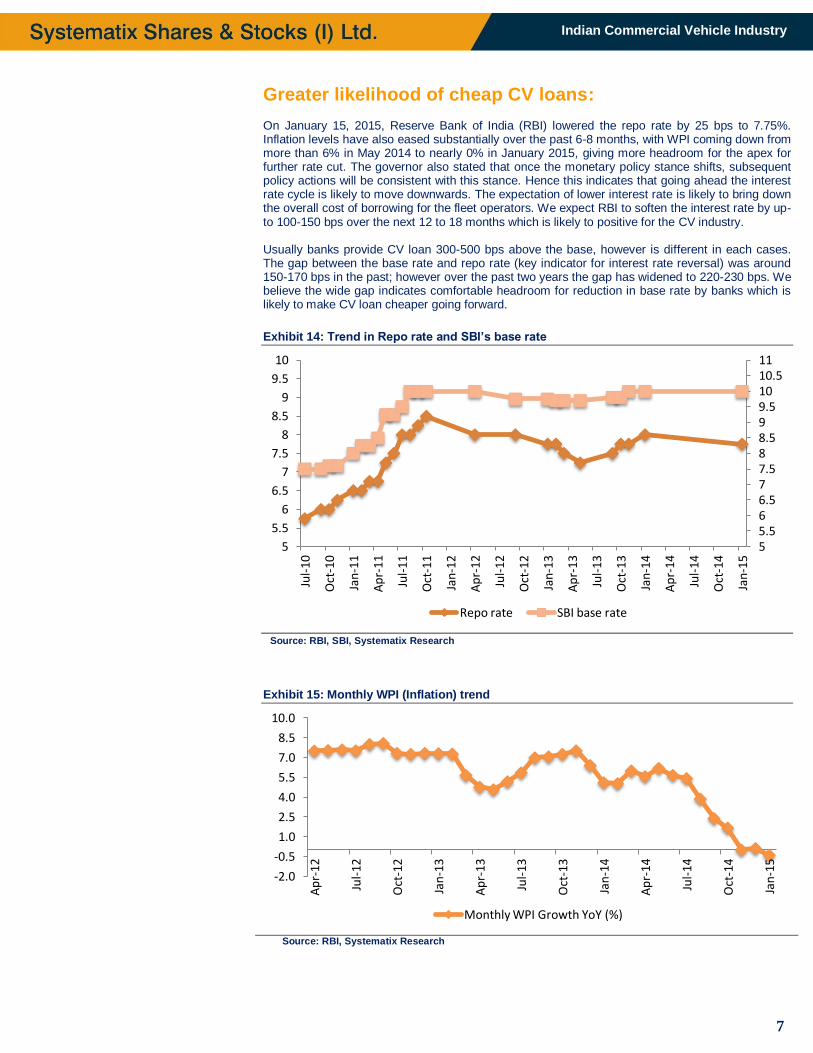
Fleet operators in a much better state: The fleet operating cost and rentals is also likely to come down mainly because of lower diesel prices and softening of interest rates going forward. Over the last 8 months, Brent Crude prices have declined ~46% to $62 per barrel (at five and half year low) resulting into lower fuel cost. Even though the benefit is not fully passed on the prices of petrol and diesel are down nearly 20% each. In addition to falling crude prices, the timings of government deregulating the diesel prices, has further reduced the operating cost for the fleet owners, because fuel accounts for nearly 40%-50% of the operating cost. Further despite the fall in diesel prices, domestic freight rates across the country have not fallen over the last 6-8 months. As per media reports, freight rates from Delhi to Chandigarh (North India), Mumbai (West India) and Kolkata (East India) has increased by 3%, 14% and 2% respectively while the rates have remained unchanged for Chennai (South India). We believe this is positive for the fleet owners which are likely to generate higher cash flows not only from lower cost but also from steady realizations. In the past 24-36 months fleet operators had faced severe headwinds in terms of lower demand resulting into lower utilization, rising operating cost (diesel price), higher interest cost (vehicles bought under finance). Further Reserve Bank of India (RBI) also lowered the interest rate in January 2015 and further stated that subsequent monetary policy actions will be consistent with this stance. This would add profitability and cash flows for fleets operates as they would be in better position for repayments and servicing of their loans.
0.4 0.7
1.4 1.7 1.7
3.2
0.0
0.5
1.0
1.5
2.0
2.5
3.0
3.5
China USA India UK France Japan
Road Density (km / sq km)
100 100 100
80
53.8 53.5
0
20
40
60
80
100
120
UK France USA Japan India China
Share of paved road (%)
6
Indian Commercial Vehicle Industry
Exhibit 10: Trend of Petrol & Diesel price in Mumbai Exhibit 11: Trend of Brent Crude ($/barrel)
Source: Media reports, mypetrolprice, Systematix Research Source: Bloomberg, Systematix Research
Exhibit 12: Freight Rates in India Exhibit 13: Trend in Freight rates in India
Source: Financial express, Systematix Research Source: Financial express, Systematix Research
75.0
85.0
95.0
105.0
115.0
15-D
ec-1
3
15-J
an-1
4
15-F
eb-1
4
15-M
ar-1
4
15-A
pr-
14
15-M
ay-1
4
15-J
un
-14
15-J
ul-
14
15-A
ug-
14
15-S
ep-1
4
15-O
ct-1
4
15-N
ov-
14
15-D
ec-1
4
15-J
an-1
5
15-F
eb-1
5
Fall in Petrol Price (%) Fall in Diesel price (%)
0
20
40
60
80
100
120
140
2-Ja
n-1
4
23-J
an-1
4
13-F
eb-1
4
6-M
ar-1
4
27-M
ar-1
4
17-A
pr-
14
9-M
ay-1
4
30-M
ay-1
4
20-J
un
-14
11-J
ul-
14
1-A
ug-
14
22-A
ug-
14
12-S
ep-1
4
3-O
ct-1
4
24-O
ct-1
4
14-N
ov-
14
5-D
ec-1
4
29-D
ec-1
4
20-J
an-1
5
Brent Crude Prices ($/ barrel)
Month & Year Chandigarh Mumbai Chennai Kolkata
Nov-13 13,000 35,000 81,000 44,000
Dec-13 13,500 35,000 81,500 43,500
Jan-14 13,500 35,000 81,000 43,500
Feb-14 13,500 36,000 81,000 43,500
Mar-14 14,000 37,000 81,000 43,500
Apr-14 14,500 37,000 81,000 44,000
May-14 14,500 37,500 81,000 44,000
Jun-14 15,000 38,000 81,500 45,000
Jul-14 15,000 40,000 81,500 46,000
Aug-14 15,000 41,000 81,500 46,500
Sep-14 15,000 41,500 81,500 46,500
Oct-14 15,000 42,000 81,500 46,500
Nov-14 15,000 44,000 82,000 47,000
Dec-14 15,500 45,000 82,000 47,000
Jan-15 15,500 45,500 82,000 47,000
Feb-15 15,500 45,500 81,500 47,000
Freight Rate from Delhi of Truck (Rs./9 Tonne)
0
50
100
150
200
250
Jan
-13
Mar
-13
May
-13
Jul-
13
Sep
-13
No
v-13
Jan
-14
Mar
-14
May
-14
Jul-
14
Sep
-14
No
v-14
Jan
-15
Chandigarh Mumbai Chennai Kolkata
7
Indian Commercial Vehicle Industry
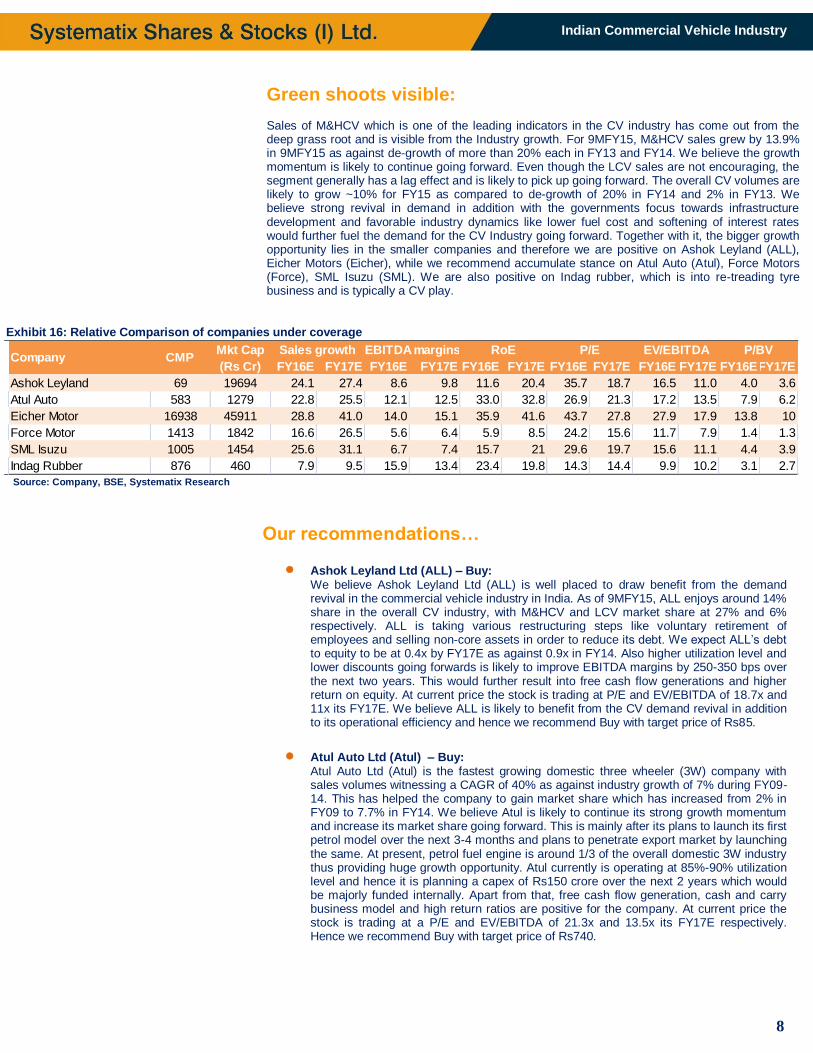
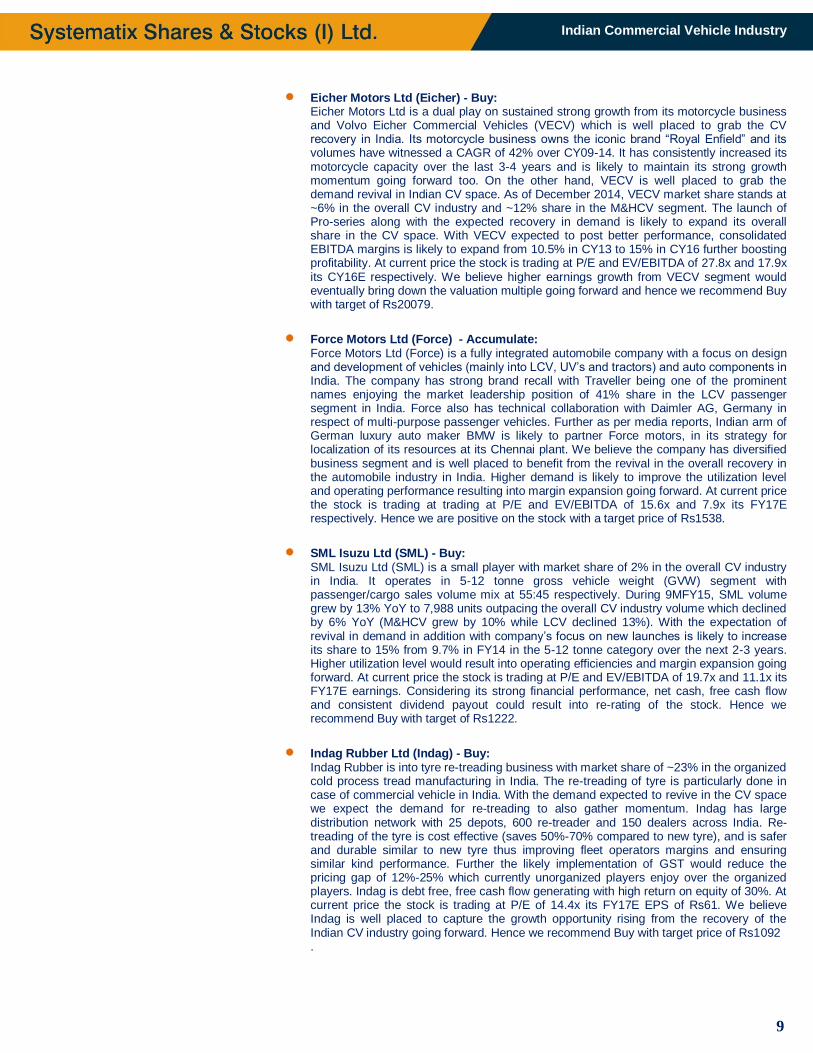
Greater likelihood of cheap CV loans: On January 15, 2015, Reserve Bank of India (RBI) lowered the repo rate by 25 bps to 7.75%. Inflation levels have also eased substantially over the past 6-8 months, with WPI coming down from more than 6% in May 2014 to nearly 0% in January 2015, giving more headroom for the apex for further rate cut. The governor also stated that once the monetary policy stance shifts, subsequent policy actions will be consistent with this stance. Hence this indicates that going ahead the interest rate cycle is likely to move downwards. The expectation of lower interest rate is likely to bring down the overall cost of borrowing for the fleet operators. We expect RBI to soften the interest rate by up-to 100-150 bps over the next 12 to 18 months which is likely to positive for the CV industry. Usually banks provide CV loan 300-500 bps above the base, however is different in each cases. The gap between the base rate and repo rate (key indicator for interest rate reversal) was around 150-170 bps in the past; however over the past two years the gap has widened to 220-230 bps. We believe the wide gap indicates comfortable headroom for reduction in base rate by banks which is likely to make CV loan cheaper going forward.
Exhibit 14: Trend in Repo rate and SBI’s base rate
Source: RBI, SBI, Systematix Research
Exhibit 15: Monthly WPI (Inflation) trend
Source: RBI, Systematix Research
5 5.5 6 6.5 7 7.5 8 8.5 9 9.5 10 10.5 11
5
5.5
6
6.5
7
7.5
8
8.5
9
9.5
10
Jul-
10
Oct
-10
Jan
-11
Ap
r-11
Jul-
11
Oct
-11
Jan
-12
Ap
r-12
Jul-
12
Oct
-12
Jan
-13
Ap
r-13
Jul-
13
Oct
-13
Jan
-14
Ap
r-14
Jul-
14
Oct
-14
Jan
-15
Repo rate SBI base rate
-2.0
-0.5
1.0
2.5
4.0
5.5
7.0
8.5
10.0
Ap
r-12
Jul-
12
Oct
-12
Jan
-13
Ap
r-13
Jul-
13
Oct
-13
Jan
-14
Ap
r-14
Jul-
14
Oct
-14
Jan
-15
Monthly WPI Growth YoY (%)
8
Indian Commercial Vehicle Industry
Green shoots visible: Sales of M&HCV which is one of the leading indicators in the CV industry has come out from the deep grass root and is visible from the Industry growth. For 9MFY15, M&HCV sales grew by 13.9% in 9MFY15 as against de-growth of more than 20% each in FY13 and FY14. We believe the growth momentum is likely to continue going forward. Even though the LCV sales are not encouraging, the segment generally has a lag effect and is likely to pick up going forward. The overall CV volumes are likely to grow ~10% for FY15 as compared to de-growth of 20% in FY14 and 2% in FY13. We believe strong revival in demand in addition with the governments focus towards infrastructure development and favorable industry dynamics like lower fuel cost and softening of interest rates would further fuel the demand for the CV Industry going forward. Together with it, the bigger growth opportunity lies in the smaller companies and therefore we are positive on Ashok Leyland (ALL), Eicher Motors (Eicher), while we recommend accumulate stance on Atul Auto (Atul), Force Motors (Force), SML Isuzu (SML). We are also positive on Indag rubber, which is into re-treading tyre business and is typically a CV play.
Exhibit 16: Relative Comparison of companies under coverage
Source: Company, BSE, Systematix Research
Our recommendations…
Ashok Leyland Ltd (ALL) – Buy: We believe Ashok Leyland Ltd (ALL) is well placed to draw benefit from the demand revival in the commercial vehicle industry in India. As of 9MFY15, ALL enjoys around 14% share in the overall CV industry, with M&HCV and LCV market share at 27% and 6% respectively. ALL is taking various restructuring steps like voluntary retirement of employees and selling non-core assets in order to reduce its debt. We expect ALL’s debt to equity to be at 0.4x by FY17E as against 0.9x in FY14. Also higher utilization level and lower discounts going forwards is likely to improve EBITDA margins by 250-350 bps over the next two years. This would further result into free cash flow generations and higher return on equity. At current price the stock is trading at P/E and EV/EBITDA of 18.7x and 11x its FY17E. We believe ALL is likely to benefit from the CV demand revival in addition to its operational efficiency and hence we recommend Buy with target price of Rs85.
Atul Auto Ltd (Atul) – Buy: Atul Auto Ltd (Atul) is the fastest growing domestic three wheeler (3W) company with sales volumes witnessing a CAGR of 40% as against industry growth of 7% during FY09-14. This has helped the company to gain market share which has increased from 2% in FY09 to 7.7% in FY14. We believe Atul is likely to continue its strong growth momentum and increase its market share going forward. This is mainly after its plans to launch its first petrol model over the next 3-4 months and plans to penetrate export market by launching the same. At present, petrol fuel engine is around 1/3 of the overall domestic 3W industry thus providing huge growth opportunity. Atul currently is operating at 85%-90% utilization level and hence it is planning a capex of Rs150 crore over the next 2 years which would be majorly funded internally. Apart from that, free cash flow generation, cash and carry business model and high return ratios are positive for the company. At current price the stock is trading at a P/E and EV/EBITDA of 21.3x and 13.5x its FY17E respectively. Hence we recommend Buy with target price of Rs740.
FY16E FY17E FY16E FY17E FY16E FY17E FY16E FY17E FY16E FY17E FY16EFY17E
Ashok Leyland 69 19694 24.1 27.4 8.6 9.8 11.6 20.4 35.7 18.7 16.5 11.0 4.0 3.6
Atul Auto 583 1279 22.8 25.5 12.1 12.5 33.0 32.8 26.9 21.3 17.2 13.5 7.9 6.2
Eicher Motor 16938 45911 28.8 41.0 14.0 15.1 35.9 41.6 43.7 27.8 27.9 17.9 13.8 10
Force Motor 1413 1842 16.6 26.5 5.6 6.4 5.9 8.5 24.2 15.6 11.7 7.9 1.4 1.3
SML Isuzu 1005 1454 25.6 31.1 6.7 7.4 15.7 21 29.6 19.7 15.6 11.1 4.4 3.9
Indag Rubber 876 460 7.9 9.5 15.9 13.4 23.4 19.8 14.3 14.4 9.9 10.2 3.1 2.7
P/BVCMP
Mkt Cap
(Rs Cr)Company
Sales growth EBITDA margins RoE P/E EV/EBITDA
9
Indian Commercial Vehicle Industry
Eicher Motors Ltd (Eicher) - Buy: Eicher Motors Ltd is a dual play on sustained strong growth from its motorcycle business and Volvo Eicher Commercial Vehicles (VECV) which is well placed to grab the CV recovery in India. Its motorcycle business owns the iconic brand “Royal Enfield” and its volumes have witnessed a CAGR of 42% over CY09-14. It has consistently increased its motorcycle capacity over the last 3-4 years and is likely to maintain its strong growth momentum going forward too. On the other hand, VECV is well placed to grab the demand revival in Indian CV space. As of December 2014, VECV market share stands at ~6% in the overall CV industry and ~12% share in the M&HCV segment. The launch of Pro-series along with the expected recovery in demand is likely to expand its overall share in the CV space. With VECV expected to post better performance, consolidated EBITDA margins is likely to expand from 10.5% in CY13 to 15% in CY16 further boosting profitability. At current price the stock is trading at P/E and EV/EBITDA of 27.8x and 17.9x its CY16E respectively. We believe higher earnings growth from VECV segment would eventually bring down the valuation multiple going forward and hence we recommend Buy with target of Rs20079.
Force Motors Ltd (Force) - Accumulate: Force Motors Ltd (Force) is a fully integrated automobile company with a focus on design and development of vehicles (mainly into LCV, UV’s and tractors) and auto components in India. The company has strong brand recall with Traveller being one of the prominent names enjoying the market leadership position of 41% share in the LCV passenger segment in India. Force also has technical collaboration with Daimler AG, Germany in respect of multi-purpose passenger vehicles. Further as per media reports, Indian arm of German luxury auto maker BMW is likely to partner Force motors, in its strategy for localization of its resources at its Chennai plant. We believe the company has diversified business segment and is well placed to benefit from the revival in the overall recovery in the automobile industry in India. Higher demand is likely to improve the utilization level and operating performance resulting into margin expansion going forward. At current price the stock is trading at trading at P/E and EV/EBITDA of 15.6x and 7.9x its FY17E respectively. Hence we are positive on the stock with a target price of Rs1538.
SML Isuzu Ltd (SML) - Buy: SML Isuzu Ltd (SML) is a small player with market share of 2% in the overall CV industry in India. It operates in 5-12 tonne gross vehicle weight (GVW) segment with passenger/cargo sales volume mix at 55:45 respectively. During 9MFY15, SML volume grew by 13% YoY to 7,988 units outpacing the overall CV industry volume which declined by 6% YoY (M&HCV grew by 10% while LCV declined 13%). With the expectation of revival in demand in addition with company’s focus on new launches is likely to increase its share to 15% from 9.7% in FY14 in the 5-12 tonne category over the next 2-3 years. Higher utilization level would result into operating efficiencies and margin expansion going forward. At current price the stock is trading at P/E and EV/EBITDA of 19.7x and 11.1x its FY17E earnings. Considering its strong financial performance, net cash, free cash flow and consistent dividend payout could result into re-rating of the stock. Hence we recommend Buy with target of Rs1222.
Indag Rubber Ltd (Indag) - Buy: Indag Rubber is into tyre re-treading business with market share of ~23% in the organized cold process tread manufacturing in India. The re-treading of tyre is particularly done in case of commercial vehicle in India. With the demand expected to revive in the CV space we expect the demand for re-treading to also gather momentum. Indag has large distribution network with 25 depots, 600 re-treader and 150 dealers across India. Re-treading of the tyre is cost effective (saves 50%-70% compared to new tyre), and is safer and durable similar to new tyre thus improving fleet operators margins and ensuring similar kind performance. Further the likely implementation of GST would reduce the pricing gap of 12%-25% which currently unorganized players enjoy over the organized players. Indag is debt free, free cash flow generating with high return on equity of 30%. At current price the stock is trading at P/E of 14.4x its FY17E EPS of Rs61. We believe Indag is well placed to capture the growth opportunity rising from the recovery of the Indian CV industry going forward. Hence we recommend Buy with target price of Rs1092 .
10
Indian Commercial Vehicle Industry
Indian Automobile Industry
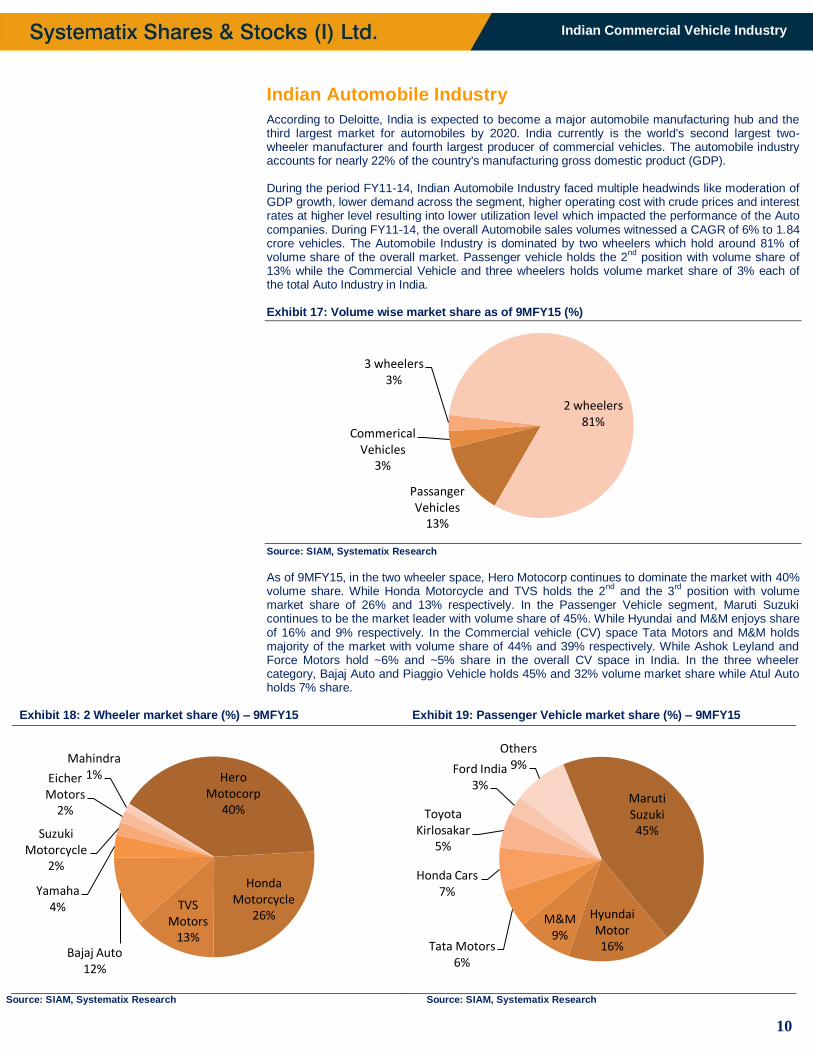
According to Deloitte, India is expected to become a major automobile manufacturing hub and the third largest market for automobiles by 2020. India currently is the world's second largest two-wheeler manufacturer and fourth largest producer of commercial vehicles. The automobile industry accounts for nearly 22% of the country's manufacturing gross domestic product (GDP). During the period FY11-14, Indian Automobile Industry faced multiple headwinds like moderation of GDP growth, lower demand across the segment, higher operating cost with crude prices and interest rates at higher level resulting into lower utilization level which impacted the performance of the Auto companies. During FY11-14, the overall Automobile sales volumes witnessed a CAGR of 6% to 1.84 crore vehicles. The Automobile Industry is dominated by two wheelers which hold around 81% of volume share of the overall market. Passenger vehicle holds the 2
nd position with volume share of
13% while the Commercial Vehicle and three wheelers holds volume market share of 3% each of the total Auto Industry in India. Exhibit 17: Volume wise market share as of 9MFY15 (%)
Source: SIAM, Systematix Research
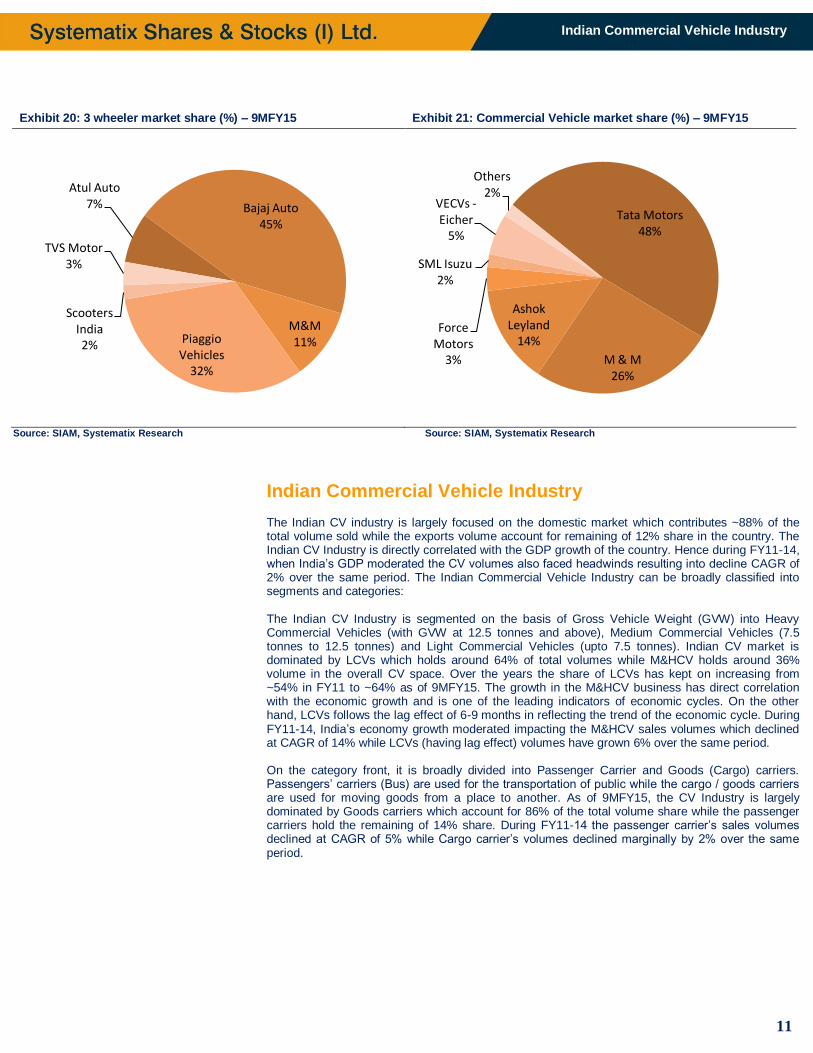
As of 9MFY15, in the two wheeler space, Hero Motocorp continues to dominate the market with 40% volume share. While Honda Motorcycle and TVS holds the 2
nd and the 3
rd position with volume
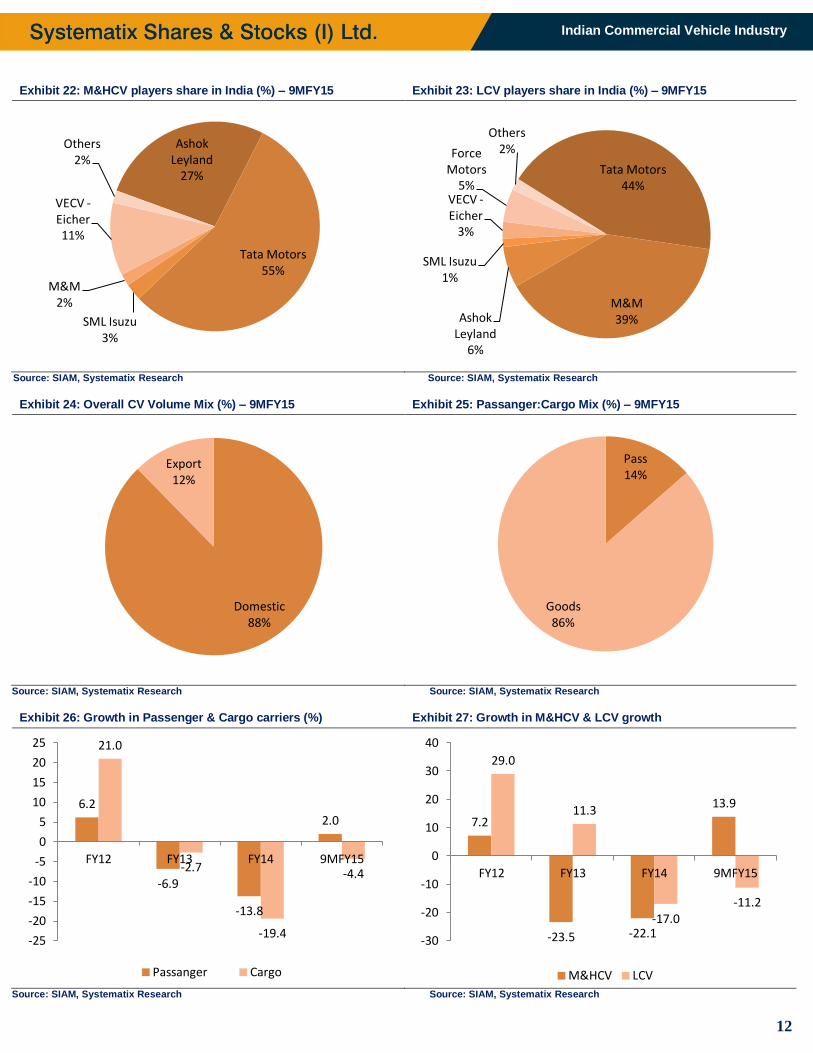
market share of 26% and 13% respectively. In the Passenger Vehicle segment, Maruti Suzuki continues to be the market leader with volume share of 45%. While Hyundai and M&M enjoys share of 16% and 9% respectively. In the Commercial vehicle (CV) space Tata Motors and M&M holds majority of the market with volume share of 44% and 39% respectively. While Ashok Leyland and Force Motors hold ~6% and ~5% share in the overall CV space in India. In the three wheeler category, Bajaj Auto and Piaggio Vehicle holds 45% and 32% volume market share while Atul Auto holds 7% share.
Exhibit 18: 2 Wheeler market share (%) – 9MFY15 Exhibit 19: Passenger Vehicle market share (%) – 9MFY15
Source: SIAM, Systematix Research Source: SIAM, Systematix Research
Passanger Vehicles
13%
Commerical Vehicles
3%
3 wheelers 3%
2 wheelers 81%
Hero Motocorp
40%
Honda Motorcycle
26% TVS
Motors 13%
Bajaj Auto 12%
Yamaha 4%
Suzuki Motorcycle
2%
Eicher Motors
2%
Mahindra 1%
Maruti Suzuki 45%
Hyundai Motor 16%
M&M 9%
Tata Motors 6%
Honda Cars 7%
Toyota Kirlosakar
5%
Ford India 3%
Others 9%
11
Indian Commercial Vehicle Industry
Exhibit 20: 3 wheeler market share (%) – 9MFY15 Exhibit 21: Commercial Vehicle market share (%) – 9MFY15
Source: SIAM, Systematix Research Source: SIAM, Systematix Research
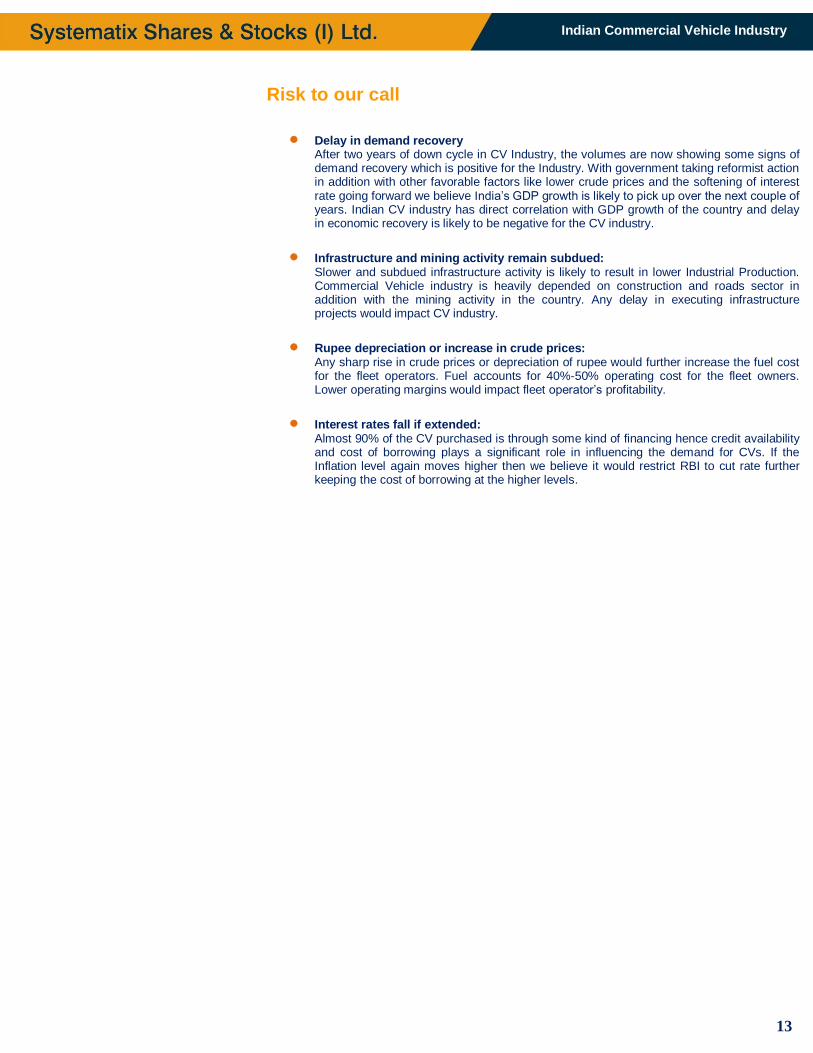
Indian Commercial Vehicle Industry The Indian CV industry is largely focused on the domestic market which contributes ~88% of the total volume sold while the exports volume account for remaining of 12% share in the country. The Indian CV Industry is directly correlated with the GDP growth of the country. Hence during FY11-14, when India’s GDP moderated the CV volumes also faced headwinds resulting into decline CAGR of 2% over the same period. The Indian Commercial Vehicle Industry can be broadly classified into segments and categories: The Indian CV Industry is segmented on the basis of Gross Vehicle Weight (GVW) into Heavy Commercial Vehicles (with GVW at 12.5 tonnes and above), Medium Commercial Vehicles (7.5 tonnes to 12.5 tonnes) and Light Commercial Vehicles (upto 7.5 tonnes). Indian CV market is dominated by LCVs which holds around 64% of total volumes while M&HCV holds around 36% volume in the overall CV space. Over the years the share of LCVs has kept on increasing from ~54% in FY11 to ~64% as of 9MFY15. The growth in the M&HCV business has direct correlation with the economic growth and is one of the leading indicators of economic cycles. On the other hand, LCVs follows the lag effect of 6-9 months in reflecting the trend of the economic cycle. During FY11-14, India’s economy growth moderated impacting the M&HCV sales volumes which declined at CAGR of 14% while LCVs (having lag effect) volumes have grown 6% over the same period. On the category front, it is broadly divided into Passenger Carrier and Goods (Cargo) carriers. Passengers’ carriers (Bus) are used for the transportation of public while the cargo / goods carriers are used for moving goods from a place to another. As of 9MFY15, the CV Industry is largely dominated by Goods carriers which account for 86% of the total volume share while the passenger carriers hold the remaining of 14% share. During FY11-14 the passenger carrier’s sales volumes declined at CAGR of 5% while Cargo carrier’s volumes declined marginally by 2% over the same period.
Atul Auto 7% Bajaj Auto
45%
M&M 11% Piaggio
Vehicles 32%
Scooters India 2%
TVS Motor 3%
Tata Motors 48%
M & M 26%
Ashok Leyland
14% Force
Motors 3%
SML Isuzu 2%
VECVs - Eicher
5%
Others 2%
12
Indian Commercial Vehicle Industry
Exhibit 22: M&HCV players share in India (%) – 9MFY15 Exhibit 23: LCV players share in India (%) – 9MFY15
Source: SIAM, Systematix Research Source: SIAM, Systematix Research
Exhibit 24: Overall CV Volume Mix (%) – 9MFY15 Exhibit 25: Passanger:Cargo Mix (%) – 9MFY15
Source: SIAM, Systematix Research Source: SIAM, Systematix Research
Exhibit 26: Growth in Passenger & Cargo carriers (%) Exhibit 27: Growth in M&HCV & LCV growth
Source: SIAM, Systematix Research Source: SIAM, Systematix Research
Ashok Leyland
27%
Tata Motors 55%
SML Isuzu 3%
M&M 2%
VECV - Eicher 11%
Others 2%
Tata Motors 44%
M&M 39% Ashok
Leyland 6%
SML Isuzu 1%
VECV - Eicher
3%
Force Motors
5%
Others 2%
Domestic 88%
Export 12%
Pass 14%
Goods 86%
6.2
-6.9
-13.8
2.0
21.0
-2.7
-19.4
-4.4
-25
-20
-15
-10
-5
0
5
10
15
20
25
FY12 FY13 FY14 9MFY15
Passanger Cargo
7.2
-23.5 -22.1
13.9
29.0
11.3
-17.0 -11.2
-30
-20
-10
0
10
20
30
40
FY12 FY13 FY14 9MFY15
M&HCV LCV
13
Indian Commercial Vehicle Industry
Risk to our call
Delay in demand recovery After two years of down cycle in CV Industry, the volumes are now showing some signs of demand recovery which is positive for the Industry. With government taking reformist action in addition with other favorable factors like lower crude prices and the softening of interest rate going forward we believe India’s GDP growth is likely to pick up over the next couple of years. Indian CV industry has direct correlation with GDP growth of the country and delay in economic recovery is likely to be negative for the CV industry.
Infrastructure and mining activity remain subdued: Slower and subdued infrastructure activity is likely to result in lower Industrial Production. Commercial Vehicle industry is heavily depended on construction and roads sector in addition with the mining activity in the country. Any delay in executing infrastructure projects would impact CV industry.
Rupee depreciation or increase in crude prices: Any sharp rise in crude prices or depreciation of rupee would further increase the fuel cost for the fleet operators. Fuel accounts for 40%-50% operating cost for the fleet owners. Lower operating margins would impact fleet operator’s profitability.
Interest rates fall if extended: Almost 90% of the CV purchased is through some kind of financing hence credit availability and cost of borrowing plays a significant role in influencing the demand for CVs. If the Inflation level again moves higher then we believe it would restrict RBI to cut rate further keeping the cost of borrowing at the higher levels.
14
Indian Commercial Vehicle Industry
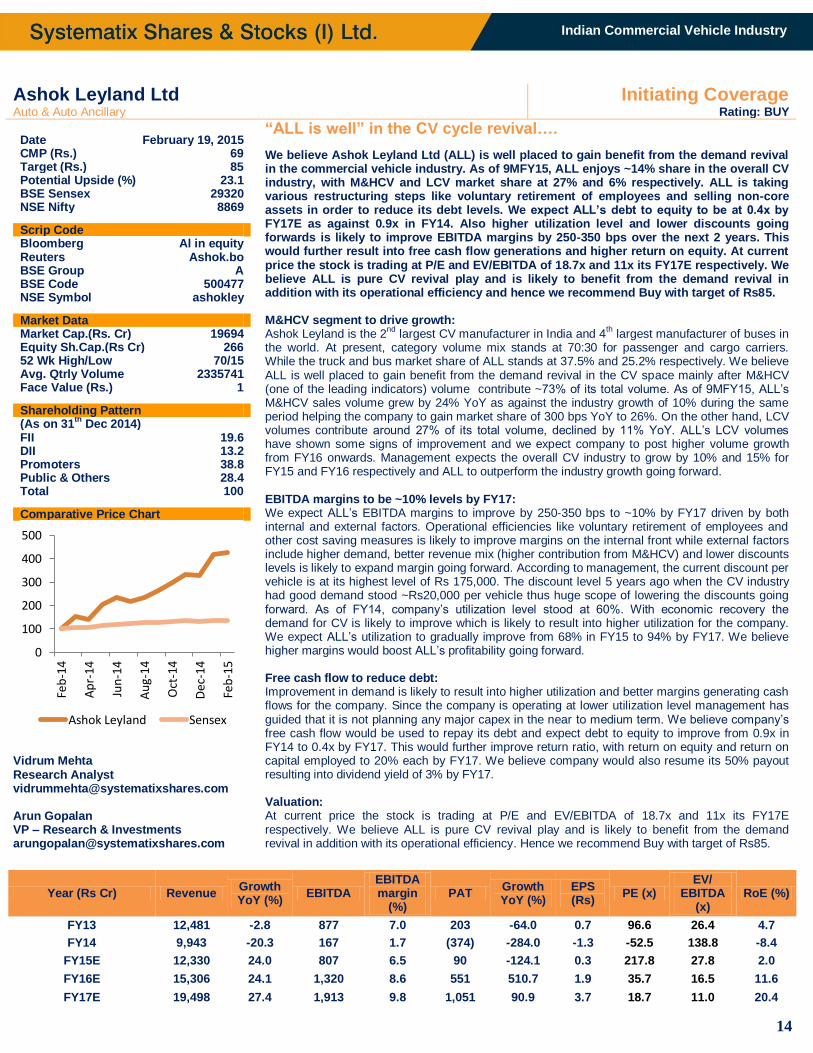
Ashok Leyland Ltd Initiating Coverage Auto & Auto Ancillary Rating: BUY
Date February 19, 2015 CMP (Rs.) 69 Target (Rs.) 85 Potential Upside (%) 23.1 BSE Sensex 29320 NSE Nifty 8869
Scrip Code Bloomberg Al in equity Reuters Ashok.bo BSE Group A BSE Code 500477 NSE Symbol ashokley Market Data Market Cap.(Rs. Cr) 19694 Equity Sh.Cap.(Rs Cr) 266 52 Wk High/Low 70/15 Avg. Qtrly Volume 2335741 Face Value (Rs.) 1 Shareholding Pattern (As on 31
th Dec 2014)
FII 19.6 DII 13.2 Promoters 38.8 Public & Others 28.4 Total 100 Comparative Price Chart
Vidrum Mehta Research Analyst [email protected] Arun Gopalan VP – Research & Investments [email protected]
“ALL is well” in the CV cycle revival….
We believe Ashok Leyland Ltd (ALL) is well placed to gain benefit from the demand revival in the commercial vehicle industry. As of 9MFY15, ALL enjoys ~14% share in the overall CV industry, with M&HCV and LCV market share at 27% and 6% respectively. ALL is taking various restructuring steps like voluntary retirement of employees and selling non-core assets in order to reduce its debt levels. We expect ALL’s debt to equity to be at 0.4x by FY17E as against 0.9x in FY14. Also higher utilization level and lower discounts going forwards is likely to improve EBITDA margins by 250-350 bps over the next 2 years. This would further result into free cash flow generations and higher return on equity. At current price the stock is trading at P/E and EV/EBITDA of 18.7x and 11x its FY17E respectively. We believe ALL is pure CV revival play and is likely to benefit from the demand revival in addition with its operational efficiency and hence we recommend Buy with target of Rs85. M&HCV segment to drive growth: Ashok Leyland is the 2
nd largest CV manufacturer in India and 4
th largest manufacturer of buses in
the world. At present, category volume mix stands at 70:30 for passenger and cargo carriers. While the truck and bus market share of ALL stands at 37.5% and 25.2% respectively. We believe ALL is well placed to gain benefit from the demand revival in the CV space mainly after M&HCV (one of the leading indicators) volume contribute ~73% of its total volume. As of 9MFY15, ALL’s M&HCV sales volume grew by 24% YoY as against the industry growth of 10% during the same period helping the company to gain market share of 300 bps YoY to 26%. On the other hand, LCV volumes contribute around 27% of its total volume, declined by 11% YoY. ALL’s LCV volumes have shown some signs of improvement and we expect company to post higher volume growth from FY16 onwards. Management expects the overall CV industry to grow by 10% and 15% for FY15 and FY16 respectively and ALL to outperform the industry growth going forward. EBITDA margins to be ~10% levels by FY17: We expect ALL’s EBITDA margins to improve by 250-350 bps to ~10% by FY17 driven by both internal and external factors. Operational efficiencies like voluntary retirement of employees and other cost saving measures is likely to improve margins on the internal front while external factors include higher demand, better revenue mix (higher contribution from M&HCV) and lower discounts levels is likely to expand margin going forward. According to management, the current discount per vehicle is at its highest level of Rs 175,000. The discount level 5 years ago when the CV industry had good demand stood ~Rs20,000 per vehicle thus huge scope of lowering the discounts going forward. As of FY14, company’s utilization level stood at 60%. With economic recovery the demand for CV is likely to improve which is likely to result into higher utilization for the company. We expect ALL’s utilization to gradually improve from 68% in FY15 to 94% by FY17. We believe higher margins would boost ALL’s profitability going forward. Free cash flow to reduce debt: Improvement in demand is likely to result into higher utilization and better margins generating cash flows for the company. Since the company is operating at lower utilization level management has guided that it is not planning any major capex in the near to medium term. We believe company’s free cash flow would be used to repay its debt and expect debt to equity to improve from 0.9x in FY14 to 0.4x by FY17. This would further improve return ratio, with return on equity and return on capital employed to 20% each by FY17. We believe company would also resume its 50% payout resulting into dividend yield of 3% by FY17. Valuation: At current price the stock is trading at P/E and EV/EBITDA of 18.7x and 11x its FY17E respectively. We believe ALL is pure CV revival play and is likely to benefit from the demand revival in addition with its operational efficiency. Hence we recommend Buy with target of Rs85.
Year (Rs Cr) Revenue Growth YoY (%)
EBITDA EBITDA margin
(%) PAT
Growth YoY (%)
EPS (Rs)
PE (x) EV/
EBITDA (x)
RoE (%)
FY13 12,481 -2.8 877 7.0 203 -64.0 0.7 96.6 26.4 4.7
FY14 9,943 -20.3 167 1.7 (374) -284.0 -1.3 -52.5 138.8 -8.4
FY15E 12,330 24.0 807 6.5 90 -124.1 0.3 217.8 27.8 2.0
FY16E 15,306 24.1 1,320 8.6 551 510.7 1.9 35.7 16.5 11.6
FY17E 19,498 27.4 1,913 9.8 1,051 90.9 3.7 18.7 11.0 20.4
0
100
200
300
400
500
Feb
-14
Ap
r-14
Jun
-14
Au
g-14
Oct
-14
Dec
-14
Feb
-15
Ashok Leyland Sensex
15
Indian Commercial Vehicle Industry
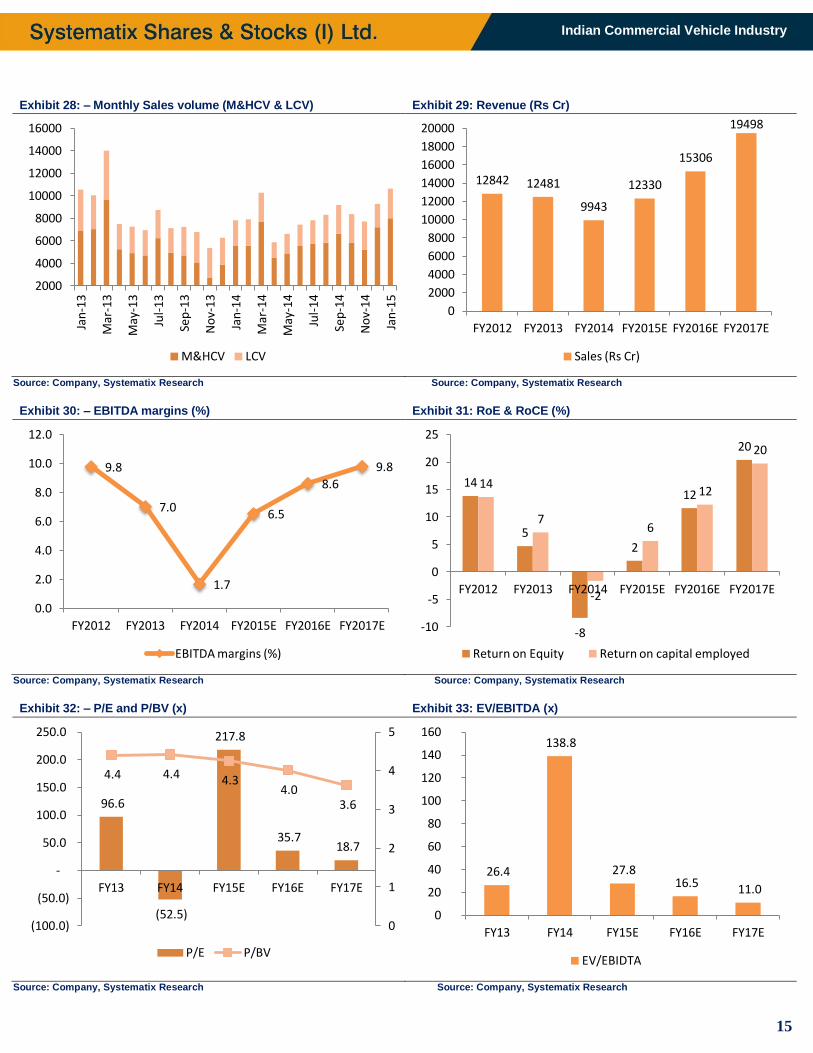
Exhibit 28: – Monthly Sales volume (M&HCV & LCV) Exhibit 29: Revenue (Rs Cr)
Source: Company, Systematix Research Source: Company, Systematix Research
Exhibit 30: – EBITDA margins (%) Exhibit 31: RoE & RoCE (%)
Source: Company, Systematix Research Source: Company, Systematix Research
Exhibit 32: – P/E and P/BV (x) Exhibit 33: EV/EBITDA (x)
Source: Company, Systematix Research Source: Company, Systematix Research
2000
4000
6000
8000
10000
12000
14000
16000
Jan
-13
Mar
-13
May
-13
Jul-
13
Sep
-13
No
v-13
Jan
-14
Mar
-14
May
-14
Jul-
14
Sep
-14
No
v-14
Jan
-15
M&HCV LCV
12842 12481
9943
12330
15306
19498
0
2000
4000
6000
8000
10000
12000
14000
16000
18000
20000
FY2012 FY2013 FY2014 FY2015E FY2016E FY2017E
Sales (Rs Cr)
9.8
7.0
1.7
6.5
8.6
9.8
0.0
2.0
4.0
6.0
8.0
10.0
12.0
FY2012 FY2013 FY2014 FY2015E FY2016E FY2017E
EBITDA margins (%)
14
5
-8
2
12
20
14
7
-2
6
12
20
-10
-5
0
5
10
15
20
25
FY2012 FY2013 FY2014 FY2015E FY2016E FY2017E
Return on Equity Return on capital employed
96.6
(52.5)
217.8
35.7 18.7
4.4 4.4 4.3 4.0
3.6
0
1
2
3
4
5
(100.0)
(50.0)
-
50.0
100.0
150.0
200.0
250.0
FY13 FY14 FY15E FY16E FY17E
P/E P/BV
26.4
138.8
27.8 16.5 11.0
0
20
40
60
80
100
120
140
160
FY13 FY14 FY15E FY16E FY17E
EV/EBIDTA
16
Indian Commercial Vehicle Industry
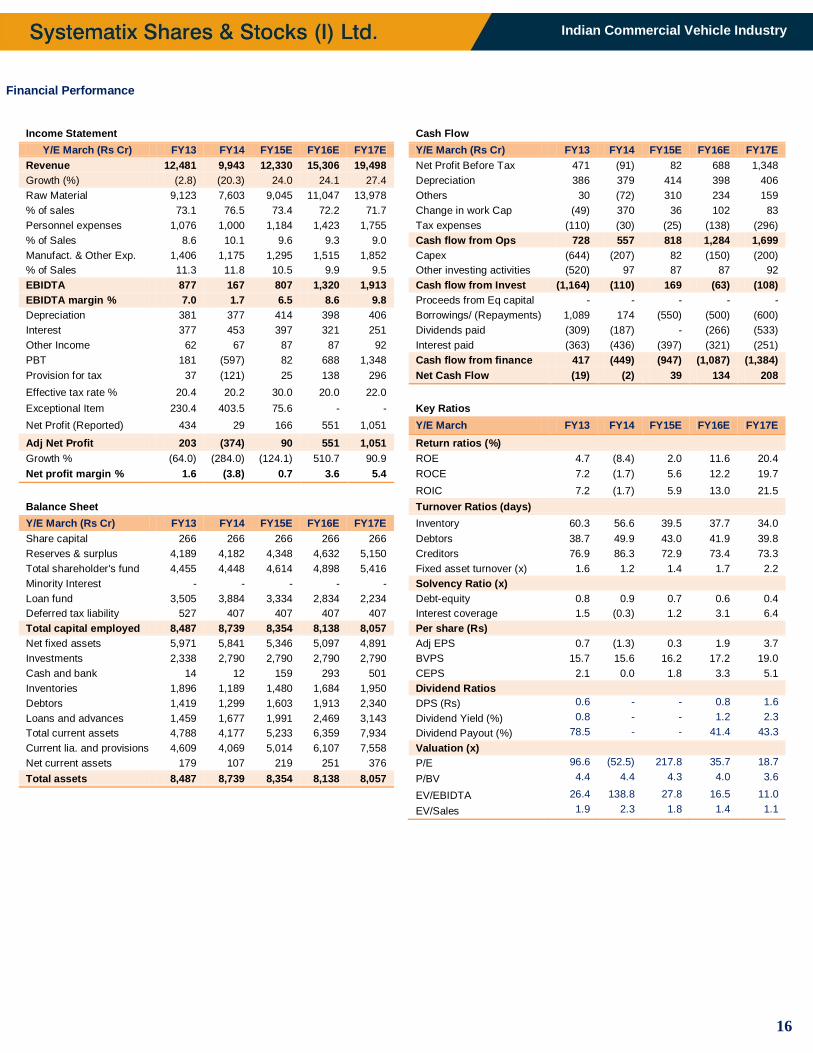
Financial Performance
Income Statement
Cash Flow
Y/E March (Rs Cr) FY13 FY14 FY15E FY16E FY17E
Y/E March (Rs Cr) FY13 FY14 FY15E FY16E FY17E
Revenue 12,481 9,943 12,330 15,306 19,498
Net Profit Before Tax 471 (91) 82 688 1,348
Growth (%) (2.8) (20.3) 24.0 24.1 27.4
Depreciation 386 379 414 398 406
Raw Material 9,123 7,603 9,045 11,047 13,978
Others 30 (72) 310 234 159
% of sales 73.1 76.5 73.4 72.2 71.7
Change in work Cap (49) 370 36 102 83
Personnel expenses 1,076 1,000 1,184 1,423 1,755
Tax expenses (110) (30) (25) (138) (296)
% of Sales 8.6 10.1 9.6 9.3 9.0
Cash flow from Ops 728 557 818 1,284 1,699
Manufact. & Other Exp. 1,406 1,175 1,295 1,515 1,852
Capex (644) (207) 82 (150) (200)
% of Sales 11.3 11.8 10.5 9.9 9.5
Other investing activities (520) 97 87 87 92
EBIDTA 877 167 807 1,320 1,913
Cash flow from Invest (1,164) (110) 169 (63) (108)
EBIDTA margin % 7.0 1.7 6.5 8.6 9.8
Proceeds from Eq capital - - - - -
Depreciation 381 377 414 398 406
Borrowings/ (Repayments) 1,089 174 (550) (500) (600)
Interest 377 453 397 321 251
Dividends paid (309) (187) - (266) (533)
Other Income 62 67 87 87 92
Interest paid (363) (436) (397) (321) (251)
PBT 181 (597) 82 688 1,348
Cash flow from finance 417 (449) (947) (1,087) (1,384)
Provision for tax 37 (121) 25 138 296
Net Cash Flow (19) (2) 39 134 208
Effective tax rate % 20.4 20.2 30.0 20.0 22.0
Exceptional Item 230.4 403.5 75.6 - -
Key Ratios
Net Profit (Reported) 434 29 166 551 1,051
Y/E March FY13 FY14 FY15E FY16E FY17E
Adj Net Profit 203 (374) 90 551 1,051
Return ratios (%)
Growth % (64.0) (284.0) (124.1) 510.7 90.9
ROE 4.7 (8.4) 2.0 11.6 20.4
Net profit margin % 1.6 (3.8) 0.7 3.6 5.4
ROCE 7.2 (1.7) 5.6 12.2 19.7
ROIC 7.2 (1.7) 5.9 13.0 21.5
Balance Sheet
Turnover Ratios (days)
Y/E March (Rs Cr) FY13 FY14 FY15E FY16E FY17E
Inventory 60.3 56.6 39.5 37.7 34.0
Share capital 266 266 266 266 266
Debtors 38.7 49.9 43.0 41.9 39.8
Reserves & surplus 4,189 4,182 4,348 4,632 5,150
Creditors 76.9 86.3 72.9 73.4 73.3
Total shareholder's fund 4,455 4,448 4,614 4,898 5,416
Fixed asset turnover (x) 1.6 1.2 1.4 1.7 2.2
Minority Interest - - - - -
Solvency Ratio (x)
Loan fund 3,505 3,884 3,334 2,834 2,234
Debt-equity 0.8 0.9 0.7 0.6 0.4
Deferred tax liability 527 407 407 407 407
Interest coverage 1.5 (0.3) 1.2 3.1 6.4
Total capital employed 8,487 8,739 8,354 8,138 8,057
Per share (Rs)
Net fixed assets 5,971 5,841 5,346 5,097 4,891
Adj EPS 0.7 (1.3) 0.3 1.9 3.7
Investments 2,338 2,790 2,790 2,790 2,790
BVPS 15.7 15.6 16.2 17.2 19.0
Cash and bank 14 12 159 293 501
CEPS 2.1 0.0 1.8 3.3 5.1
Inventories 1,896 1,189 1,480 1,684 1,950
Dividend Ratios
Debtors 1,419 1,299 1,603 1,913 2,340
DPS (Rs) 0.6 - - 0.8 1.6
Loans and advances 1,459 1,677 1,991 2,469 3,143
Dividend Yield (%) 0.8 - - 1.2 2.3
Total current assets 4,788 4,177 5,233 6,359 7,934
Dividend Payout (%) 78.5 - - 41.4 43.3
Current lia. and provisions 4,609 4,069 5,014 6,107 7,558
Valuation (x)
Net current assets 179 107 219 251 376
P/E 96.6 (52.5) 217.8 35.7 18.7
Total assets 8,487 8,739 8,354 8,138 8,057
P/BV 4.4 4.4 4.3 4.0 3.6
EV/EBIDTA 26.4 138.8 27.8 16.5 11.0
EV/Sales 1.9 2.3 1.8 1.4 1.1
17
Indian Commercial Vehicle Industry
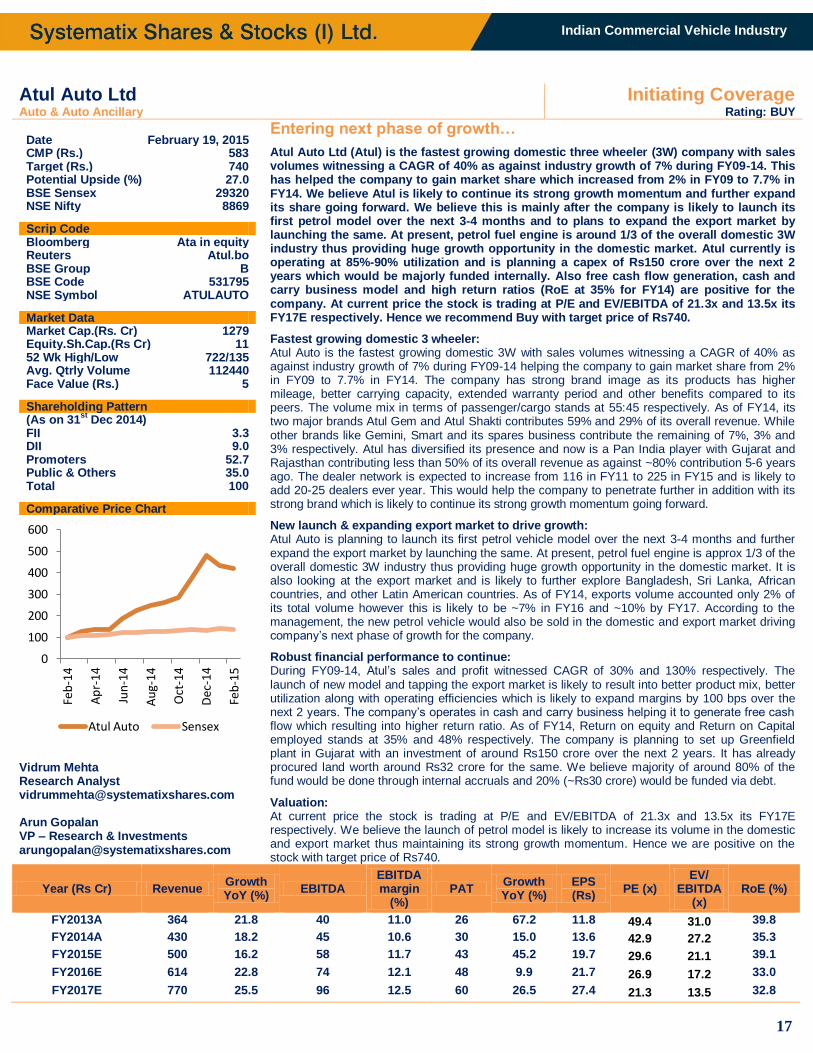
Atul Auto Ltd Initiating Coverage Auto & Auto Ancillary Rating: BUY
Date February 19, 2015 CMP (Rs.) 583 Target (Rs.) 740 Potential Upside (%) 27.0 BSE Sensex 29320 NSE Nifty 8869
Scrip Code Bloomberg Ata in equity Reuters Atul.bo BSE Group B BSE Code 531795 NSE Symbol ATULAUTO Market Data Market Cap.(Rs. Cr) 1279 Equity.Sh.Cap.(Rs Cr) 11 52 Wk High/Low 722/135 Avg. Qtrly Volume 112440 Face Value (Rs.) 5 Shareholding Pattern (As on 31
st Dec 2014)
FII 3.3 DII 9.0 Promoters 52.7 Public & Others 35.0 Total 100 Comparative Price Chart
Vidrum Mehta Research Analyst [email protected] Arun Gopalan VP – Research & Investments [email protected]
Entering next phase of growth…
Atul Auto Ltd (Atul) is the fastest growing domestic three wheeler (3W) company with sales volumes witnessing a CAGR of 40% as against industry growth of 7% during FY09-14. This has helped the company to gain market share which increased from 2% in FY09 to 7.7% in FY14. We believe Atul is likely to continue its strong growth momentum and further expand its share going forward. We believe this is mainly after the company is likely to launch its first petrol model over the next 3-4 months and to plans to expand the export market by launching the same. At present, petrol fuel engine is around 1/3 of the overall domestic 3W industry thus providing huge growth opportunity in the domestic market. Atul currently is operating at 85%-90% utilization and is planning a capex of Rs150 crore over the next 2 years which would be majorly funded internally. Also free cash flow generation, cash and carry business model and high return ratios (RoE at 35% for FY14) are positive for the company. At current price the stock is trading at P/E and EV/EBITDA of 21.3x and 13.5x its FY17E respectively. Hence we recommend Buy with target price of Rs740.
Fastest growing domestic 3 wheeler: Atul Auto is the fastest growing domestic 3W with sales volumes witnessing a CAGR of 40% as against industry growth of 7% during FY09-14 helping the company to gain market share from 2% in FY09 to 7.7% in FY14. The company has strong brand image as its products has higher mileage, better carrying capacity, extended warranty period and other benefits compared to its peers. The volume mix in terms of passenger/cargo stands at 55:45 respectively. As of FY14, its two major brands Atul Gem and Atul Shakti contributes 59% and 29% of its overall revenue. While other brands like Gemini, Smart and its spares business contribute the remaining of 7%, 3% and 3% respectively. Atul has diversified its presence and now is a Pan India player with Gujarat and Rajasthan contributing less than 50% of its overall revenue as against ~80% contribution 5-6 years ago. The dealer network is expected to increase from 116 in FY11 to 225 in FY15 and is likely to add 20-25 dealers ever year. This would help the company to penetrate further in addition with its strong brand which is likely to continue its strong growth momentum going forward.
New launch & expanding export market to drive growth: Atul Auto is planning to launch its first petrol vehicle model over the next 3-4 months and further expand the export market by launching the same. At present, petrol fuel engine is approx 1/3 of the overall domestic 3W industry thus providing huge growth opportunity in the domestic market. It is also looking at the export market and is likely to further explore Bangladesh, Sri Lanka, African countries, and other Latin American countries. As of FY14, exports volume accounted only 2% of its total volume however this is likely to be ~7% in FY16 and ~10% by FY17. According to the management, the new petrol vehicle would also be sold in the domestic and export market driving company’s next phase of growth for the company.
Robust financial performance to continue: During FY09-14, Atul’s sales and profit witnessed CAGR of 30% and 130% respectively. The launch of new model and tapping the export market is likely to result into better product mix, better utilization along with operating efficiencies which is likely to expand margins by 100 bps over the next 2 years. The company’s operates in cash and carry business helping it to generate free cash flow which resulting into higher return ratio. As of FY14, Return on equity and Return on Capital employed stands at 35% and 48% respectively. The company is planning to set up Greenfield plant in Gujarat with an investment of around Rs150 crore over the next 2 years. It has already procured land worth around Rs32 crore for the same. We believe majority of around 80% of the fund would be done through internal accruals and 20% (~Rs30 crore) would be funded via debt.
Valuation: At current price the stock is trading at P/E and EV/EBITDA of 21.3x and 13.5x its FY17E respectively. We believe the launch of petrol model is likely to increase its volume in the domestic and export market thus maintaining its strong growth momentum. Hence we are positive on the stock with target price of Rs740.
Year (Rs Cr) Revenue Growth YoY (%)
EBITDA EBITDA margin
(%) PAT
Growth YoY (%)
EPS (Rs)
PE (x) EV/
EBITDA (x)
RoE (%)
FY2013A 364 21.8 40 11.0 26 67.2 11.8 49.4 31.0 39.8
FY2014A 430 18.2 45 10.6 30 15.0 13.6 42.9 27.2 35.3
FY2015E 500 16.2 58 11.7 43 45.2 19.7 29.6 21.1 39.1
FY2016E 614 22.8 74 12.1 48 9.9 21.7 26.9 17.2 33.0
FY2017E 770 25.5 96 12.5 60 26.5 27.4 21.3 13.5 32.8
0
100
200
300
400
500
600
Feb
-14
Ap
r-14
Jun
-14
Au
g-14
Oct
-14
Dec
-14
Feb
-15
Atul Auto Sensex
18
Indian Commercial Vehicle Industry
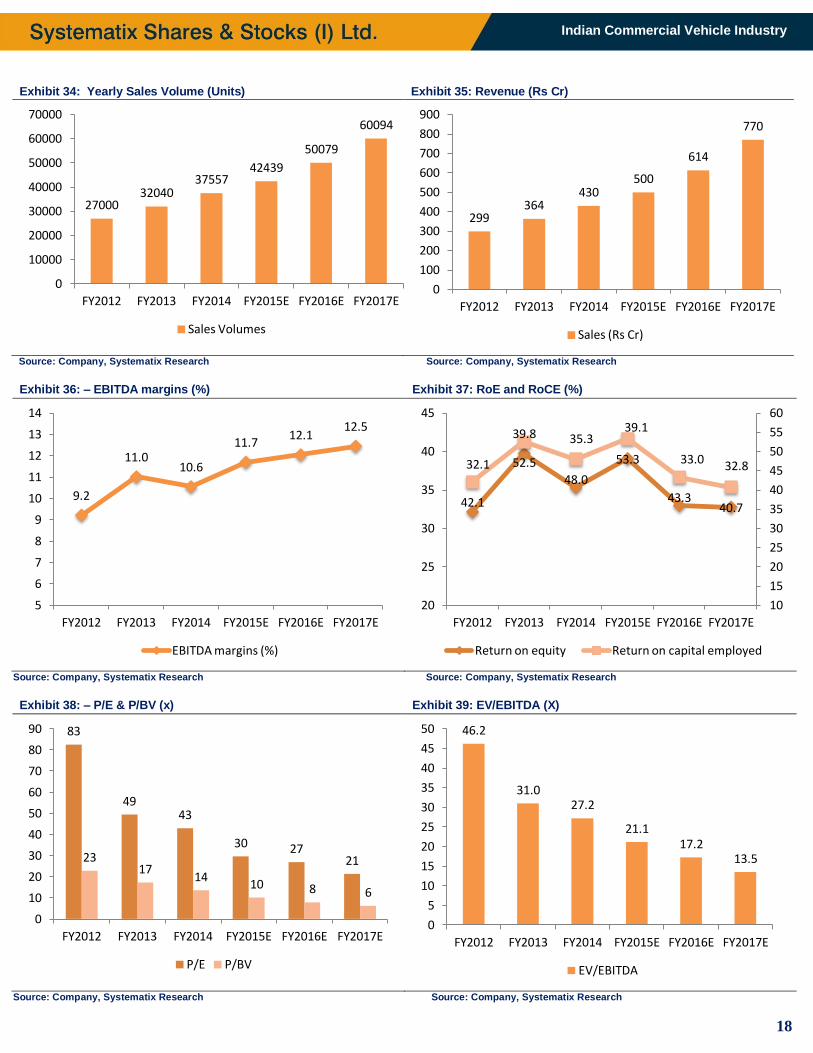
Exhibit 34: Yearly Sales Volume (Units) Exhibit 35: Revenue (Rs Cr)
Source: Company, Systematix Research Source: Company, Systematix Research
Exhibit 36: – EBITDA margins (%) Exhibit 37: RoE and RoCE (%)
Source: Company, Systematix Research Source: Company, Systematix Research
Exhibit 38: – P/E & P/BV (x) Exhibit 39: EV/EBITDA (X)
Source: Company, Systematix Research Source: Company, Systematix Research
27000 32040
37557 42439
50079
60094
0
10000
20000
30000
40000
50000
60000
70000
FY2012 FY2013 FY2014 FY2015E FY2016E FY2017E
Sales Volumes
299 364
430 500
614
770
0
100
200
300
400
500
600
700
800
900
FY2012 FY2013 FY2014 FY2015E FY2016E FY2017E
Sales (Rs Cr)
9.2
11.0 10.6
11.7 12.1
12.5
5
6
7
8
9
10
11
12
13
14
FY2012 FY2013 FY2014 FY2015E FY2016E FY2017E
EBITDA margins (%)
32.1
39.8 35.3 39.1
33.0 32.8
42.1
52.5
48.0
53.3
43.3 40.7
10
15
20
25
30
35
40
45
50
55
60
20
25
30
35
40
45
FY2012 FY2013 FY2014 FY2015E FY2016E FY2017E
Return on equity Return on capital employed
83
49 43
30 27 21 23
17 14
10 8 6
0
10
20
30
40
50
60
70
80
90
FY2012 FY2013 FY2014 FY2015E FY2016E FY2017E
P/E P/BV
46.2
31.0 27.2
21.1 17.2
13.5
0
5
10
15
20
25
30
35
40
45
50
FY2012 FY2013 FY2014 FY2015E FY2016E FY2017E
EV/EBITDA
19
Indian Commercial Vehicle Industry
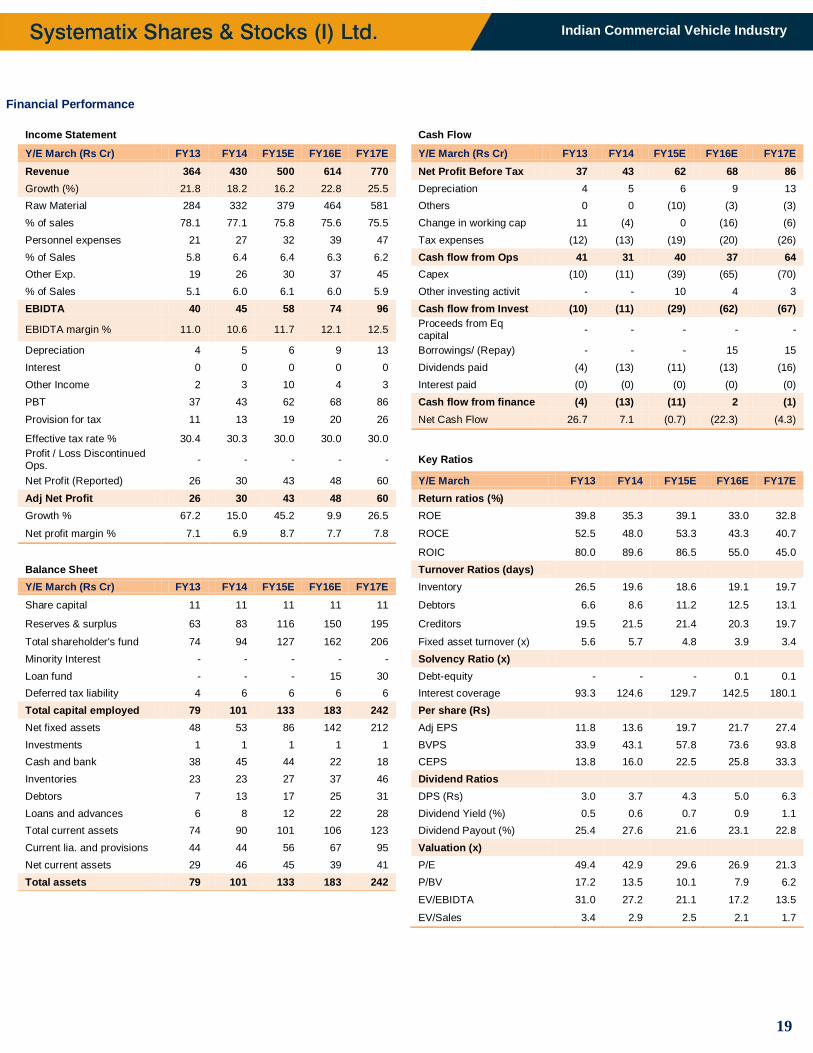
Financial Performance
Income Statement
Cash Flow
Y/E March (Rs Cr) FY13 FY14 FY15E FY16E FY17E
Y/E March (Rs Cr) FY13 FY14 FY15E FY16E FY17E
Revenue 364 430 500 614 770
Net Profit Before Tax 37 43 62 68 86
Growth (%) 21.8 18.2 16.2 22.8 25.5
Depreciation 4 5 6 9 13
Raw Material 284 332 379 464 581
Others 0 0 (10) (3) (3)
% of sales 78.1 77.1 75.8 75.6 75.5
Change in working cap 11 (4) 0 (16) (6)
Personnel expenses 21 27 32 39 47
Tax expenses (12) (13) (19) (20) (26)
% of Sales 5.8 6.4 6.4 6.3 6.2
Cash flow from Ops 41 31 40 37 64
Other Exp. 19 26 30 37 45
Capex (10) (11) (39) (65) (70)
% of Sales 5.1 6.0 6.1 6.0 5.9
Other investing activit - - 10 4 3
EBIDTA 40 45 58 74 96
Cash flow from Invest (10) (11) (29) (62) (67)
EBIDTA margin % 11.0 10.6 11.7 12.1 12.5
Proceeds from Eq capital
- - - - -
Depreciation 4 5 6 9 13
Borrowings/ (Repay) - - - 15 15
Interest 0 0 0 0 0
Dividends paid (4) (13) (11) (13) (16)
Other Income 2 3 10 4 3
Interest paid (0) (0) (0) (0) (0)
PBT 37 43 62 68 86
Cash flow from finance (4) (13) (11) 2 (1)
Provision for tax 11 13 19 20 26
Net Cash Flow 26.7 7.1 (0.7) (22.3) (4.3)
Effective tax rate % 30.4 30.3 30.0 30.0 30.0
Profit / Loss Discontinued Ops.
- - - - -
Key Ratios
Net Profit (Reported) 26 30 43 48 60
Y/E March FY13 FY14 FY15E FY16E FY17E
Adj Net Profit 26 30 43 48 60
Return ratios (%)
Growth % 67.2 15.0 45.2 9.9 26.5
ROE 39.8 35.3 39.1 33.0 32.8
Net profit margin % 7.1 6.9 8.7 7.7 7.8
ROCE 52.5 48.0 53.3 43.3 40.7
ROIC 80.0 89.6 86.5 55.0 45.0
Balance Sheet
Turnover Ratios (days)
Y/E March (Rs Cr) FY13 FY14 FY15E FY16E FY17E
Inventory 26.5 19.6 18.6 19.1 19.7
Share capital 11 11 11 11 11
Debtors 6.6 8.6 11.2 12.5 13.1
Reserves & surplus 63 83 116 150 195
Creditors 19.5 21.5 21.4 20.3 19.7
Total shareholder's fund 74 94 127 162 206
Fixed asset turnover (x) 5.6 5.7 4.8 3.9 3.4
Minority Interest - - - - -
Solvency Ratio (x)
Loan fund - - - 15 30
Debt-equity - - - 0.1 0.1
Deferred tax liability 4 6 6 6 6
Interest coverage 93.3 124.6 129.7 142.5 180.1
Total capital employed 79 101 133 183 242
Per share (Rs)
Net fixed assets 48 53 86 142 212
Adj EPS 11.8 13.6 19.7 21.7 27.4
Investments 1 1 1 1 1
BVPS 33.9 43.1 57.8 73.6 93.8
Cash and bank 38 45 44 22 18
CEPS 13.8 16.0 22.5 25.8 33.3
Inventories 23 23 27 37 46
Dividend Ratios
Debtors 7 13 17 25 31
DPS (Rs) 3.0 3.7 4.3 5.0 6.3
Loans and advances 6 8 12 22 28
Dividend Yield (%) 0.5 0.6 0.7 0.9 1.1
Total current assets 74 90 101 106 123
Dividend Payout (%) 25.4 27.6 21.6 23.1 22.8
Current lia. and provisions 44 44 56 67 95
Valuation (x)
Net current assets 29 46 45 39 41
P/E 49.4 42.9 29.6 26.9 21.3
Total assets 79 101 133 183 242
P/BV 17.2 13.5 10.1 7.9 6.2
EV/EBIDTA 31.0 27.2 21.1 17.2 13.5
EV/Sales 3.4 2.9 2.5 2.1 1.7
20
Indian Commercial Vehicle Industry
Eicher Motors Ltd Initiating Coverage Auto & Auto Ancillary Rating: BUY
Date February 19, 2015 CMP (Rs.) 16938 Target (Rs.) 20079 Potential Upside (%) 18.5 BSE Sensex 29320 NSE Nifty 8869
Scrip Code Bloomberg Eim in equity Reuters Eich.bo BSE Group A BSE Code 505200 NSE Symbol eichermot Market Data Market Cap.(Rs. Cr) 45911 Equity Sh.Cap. (Rs Cr) 27 52 Wk High/Low 16895/4525 Avg. Qtrly Volume 4509 Face Value (Rs.) 10 Shareholding Pattern (As on 31
st Dec 2014)
FII 19.4 DII 4.7 Promoters 55.0 Public & Others 20.9 Total 100 Comparative Price Chart
Vidrum Mehta Research Analyst [email protected] Arun Gopalan VP – Research & Investments [email protected]
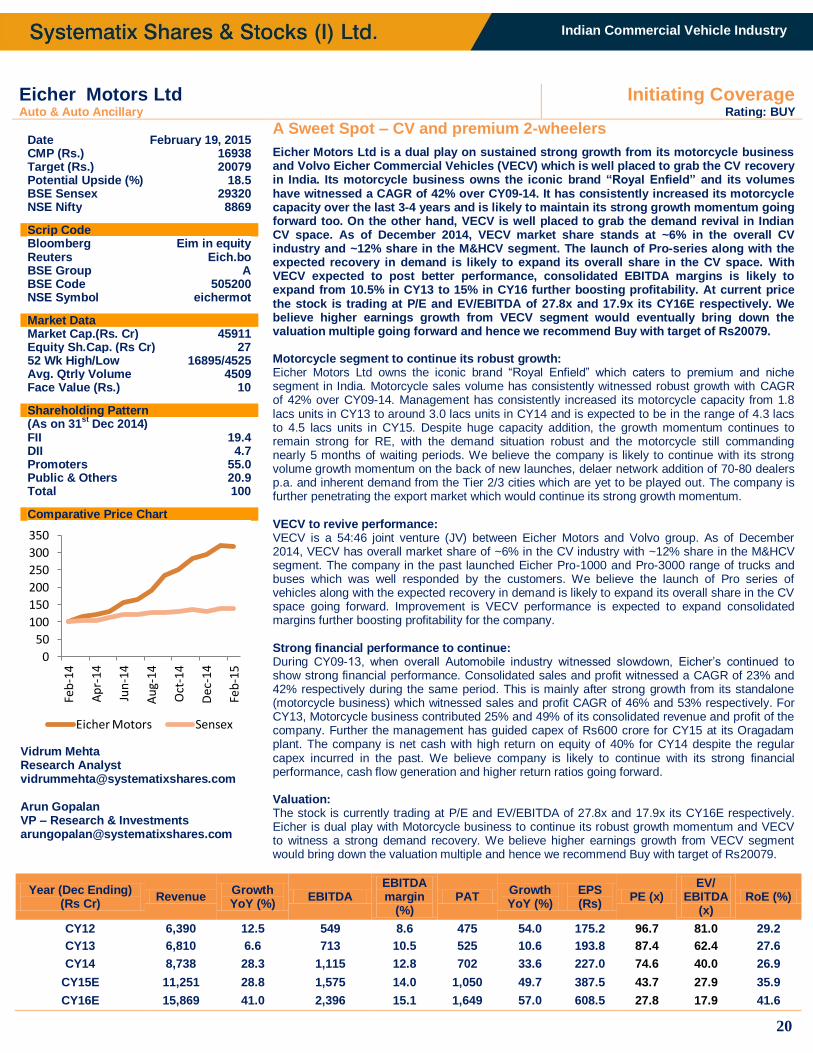
A Sweet Spot – CV and premium 2-wheelers
Eicher Motors Ltd is a dual play on sustained strong growth from its motorcycle business and Volvo Eicher Commercial Vehicles (VECV) which is well placed to grab the CV recovery in India. Its motorcycle business owns the iconic brand “Royal Enfield” and its volumes have witnessed a CAGR of 42% over CY09-14. It has consistently increased its motorcycle capacity over the last 3-4 years and is likely to maintain its strong growth momentum going forward too. On the other hand, VECV is well placed to grab the demand revival in Indian CV space. As of December 2014, VECV market share stands at ~6% in the overall CV industry and ~12% share in the M&HCV segment. The launch of Pro-series along with the expected recovery in demand is likely to expand its overall share in the CV space. With VECV expected to post better performance, consolidated EBITDA margins is likely to expand from 10.5% in CY13 to 15% in CY16 further boosting profitability. At current price the stock is trading at P/E and EV/EBITDA of 27.8x and 17.9x its CY16E respectively. We believe higher earnings growth from VECV segment would eventually bring down the valuation multiple going forward and hence we recommend Buy with target of Rs20079. Motorcycle segment to continue its robust growth: Eicher Motors Ltd owns the iconic brand “Royal Enfield” which caters to premium and niche segment in India. Motorcycle sales volume has consistently witnessed robust growth with CAGR of 42% over CY09-14. Management has consistently increased its motorcycle capacity from 1.8 lacs units in CY13 to around 3.0 lacs units in CY14 and is expected to be in the range of 4.3 lacs to 4.5 lacs units in CY15. Despite huge capacity addition, the growth momentum continues to remain strong for RE, with the demand situation robust and the motorcycle still commanding nearly 5 months of waiting periods. We believe the company is likely to continue with its strong volume growth momentum on the back of new launches, delaer network addition of 70-80 dealers p.a. and inherent demand from the Tier 2/3 cities which are yet to be played out. The company is further penetrating the export market which would continue its strong growth momentum. VECV to revive performance: VECV is a 54:46 joint venture (JV) between Eicher Motors and Volvo group. As of December 2014, VECV has overall market share of ~6% in the CV industry with ~12% share in the M&HCV segment. The company in the past launched Eicher Pro-1000 and Pro-3000 range of trucks and buses which was well responded by the customers. We believe the launch of Pro series of vehicles along with the expected recovery in demand is likely to expand its overall share in the CV space going forward. Improvement is VECV performance is expected to expand consolidated margins further boosting profitability for the company. Strong financial performance to continue: During CY09-13, when overall Automobile industry witnessed slowdown, Eicher’s continued to show strong financial performance. Consolidated sales and profit witnessed a CAGR of 23% and 42% respectively during the same period. This is mainly after strong growth from its standalone (motorcycle business) which witnessed sales and profit CAGR of 46% and 53% respectively. For CY13, Motorcycle business contributed 25% and 49% of its consolidated revenue and profit of the company. Further the management has guided capex of Rs600 crore for CY15 at its Oragadam plant. The company is net cash with high return on equity of 40% for CY14 despite the regular capex incurred in the past. We believe company is likely to continue with its strong financial performance, cash flow generation and higher return ratios going forward. Valuation: The stock is currently trading at P/E and EV/EBITDA of 27.8x and 17.9x its CY16E respectively. Eicher is dual play with Motorcycle business to continue its robust growth momentum and VECV to witness a strong demand recovery. We believe higher earnings growth from VECV segment would bring down the valuation multiple and hence we recommend Buy with target of Rs20079.
Year (Dec Ending) (Rs Cr)
Revenue Growth YoY (%)
EBITDA EBITDA margin
(%) PAT
Growth YoY (%)
EPS (Rs)
PE (x) EV/
EBITDA (x)
RoE (%)
CY12 6,390 12.5 549 8.6 475 54.0 175.2 96.7 81.0 29.2
CY13 6,810 6.6 713 10.5 525 10.6 193.8 87.4 62.4 27.6
CY14 8,738 28.3 1,115 12.8 702 33.6 227.0 74.6 40.0 26.9
CY15E 11,251 28.8 1,575 14.0 1,050 49.7 387.5 43.7 27.9 35.9
CY16E 15,869 41.0 2,396 15.1 1,649 57.0 608.5 27.8 17.9 41.6
0
50
100
150
200
250
300
350
Feb
-14
Ap
r-14
Jun
-14
Au
g-14
Oct
-14
Dec
-14
Feb
-15
Eicher Motors Sensex
21
Indian Commercial Vehicle Industry
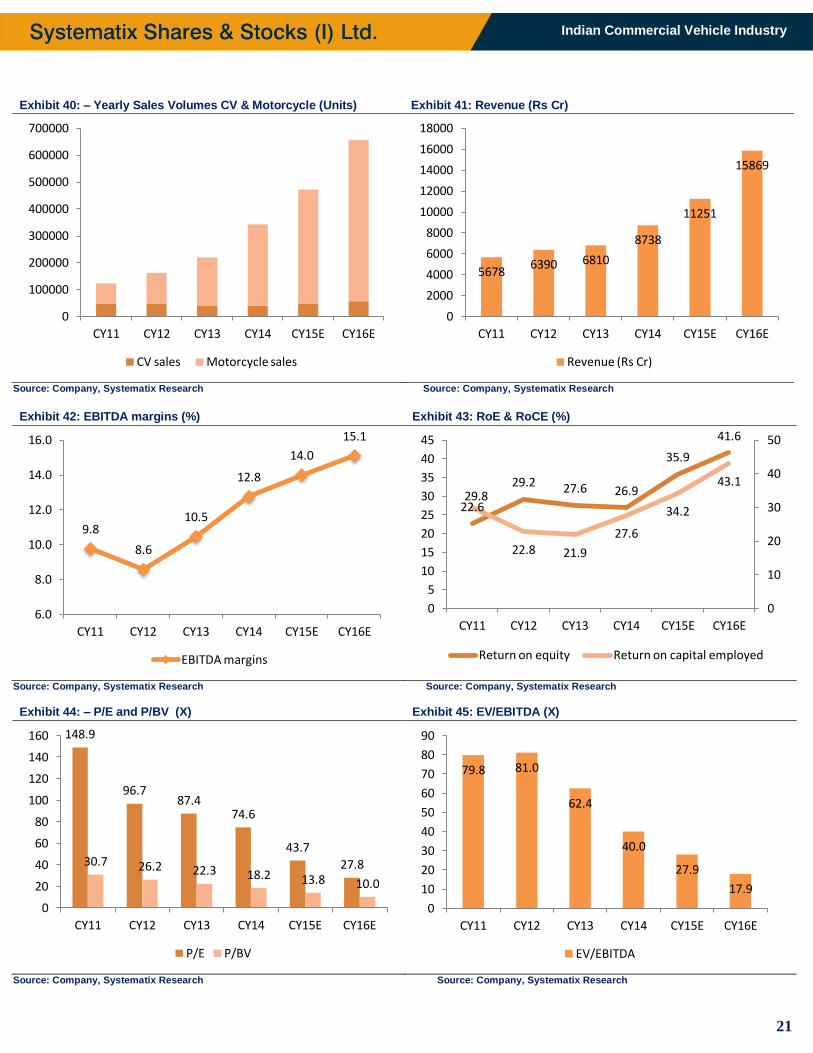
Exhibit 40: – Yearly Sales Volumes CV & Motorcycle (Units) Exhibit 41: Revenue (Rs Cr)
Source: Company, Systematix Research Source: Company, Systematix Research
Exhibit 42: EBITDA margins (%) Exhibit 43: RoE & RoCE (%)
Source: Company, Systematix Research Source: Company, Systematix Research
Exhibit 44: – P/E and P/BV (X) Exhibit 45: EV/EBITDA (X)
Source: Company, Systematix Research Source: Company, Systematix Research
0
100000
200000
300000
400000
500000
600000
700000
CY11 CY12 CY13 CY14 CY15E CY16E
CV sales Motorcycle sales
5678 6390 6810
8738
11251
15869
0
2000
4000
6000
8000
10000
12000
14000
16000
18000
CY11 CY12 CY13 CY14 CY15E CY16E
Revenue (Rs Cr)
9.8
8.6
10.5
12.8
14.0
15.1
6.0
8.0
10.0
12.0
14.0
16.0
CY11 CY12 CY13 CY14 CY15E CY16E
EBITDA margins
22.6
29.2 27.6 26.9
35.9
41.6
29.8
22.8 21.9
27.6
34.2
43.1
0
10
20
30
40
50
0
5
10
15
20
25
30
35
40
45
CY11 CY12 CY13 CY14 CY15E CY16E
Return on equity Return on capital employed
148.9
96.7 87.4
74.6
43.7
27.8 30.7 26.2 22.3 18.2 13.8 10.0
0
20
40
60
80
100
120
140
160
CY11 CY12 CY13 CY14 CY15E CY16E
P/E P/BV
79.8 81.0
62.4
40.0
27.9
17.9
0
10
20
30
40
50
60
70
80
90
CY11 CY12 CY13 CY14 CY15E CY16E
EV/EBITDA
22
Indian Commercial Vehicle Industry
Financial Performance
Income Statement
Cash Flow
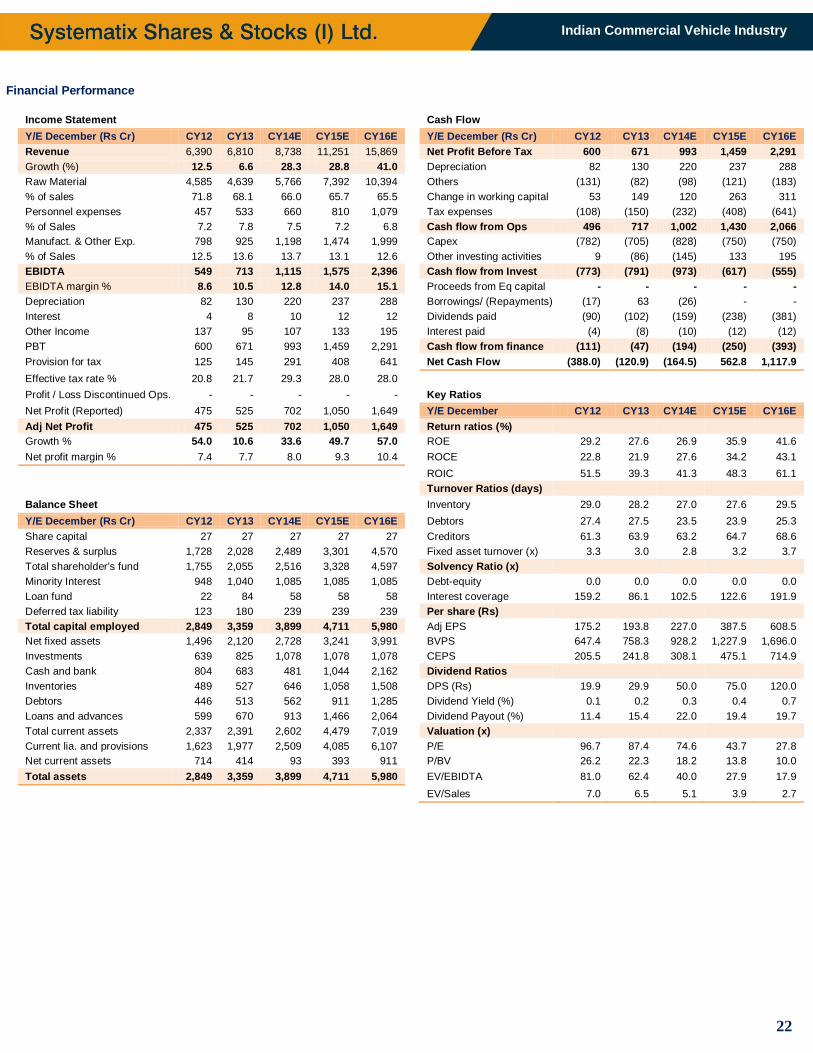
Y/E December (Rs Cr) CY12 CY13 CY14E CY15E CY16E
Y/E December (Rs Cr) CY12 CY13 CY14E CY15E CY16E
Revenue 6,390 6,810 8,738 11,251 15,869
Net Profit Before Tax 600 671 993 1,459 2,291
Growth (%) 12.5 6.6 28.3 28.8 41.0
Depreciation 82 130 220 237 288
Raw Material 4,585 4,639 5,766 7,392 10,394
Others (131) (82) (98) (121) (183)
% of sales 71.8 68.1 66.0 65.7 65.5
Change in working capital 53 149 120 263 311
Personnel expenses 457 533 660 810 1,079
Tax expenses (108) (150) (232) (408) (641)
% of Sales 7.2 7.8 7.5 7.2 6.8
Cash flow from Ops 496 717 1,002 1,430 2,066
Manufact. & Other Exp. 798 925 1,198 1,474 1,999
Capex (782) (705) (828) (750) (750)
% of Sales 12.5 13.6 13.7 13.1 12.6
Other investing activities 9 (86) (145) 133 195
EBIDTA 549 713 1,115 1,575 2,396
Cash flow from Invest (773) (791) (973) (617) (555)
EBIDTA margin % 8.6 10.5 12.8 14.0 15.1
Proceeds from Eq capital - - - - -
Depreciation 82 130 220 237 288
Borrowings/ (Repayments) (17) 63 (26) - -
Interest 4 8 10 12 12
Dividends paid (90) (102) (159) (238) (381)
Other Income 137 95 107 133 195
Interest paid (4) (8) (10) (12) (12)
PBT 600 671 993 1,459 2,291
Cash flow from finance (111) (47) (194) (250) (393)
Provision for tax 125 145 291 408 641
Net Cash Flow (388.0) (120.9) (164.5) 562.8 1,117.9
Effective tax rate % 20.8 21.7 29.3 28.0 28.0
Profit / Loss Discontinued Ops. - - - - -
Key Ratios
Net Profit (Reported) 475 525 702 1,050 1,649
Y/E December CY12 CY13 CY14E CY15E CY16E
Adj Net Profit 475 525 702 1,050 1,649
Return ratios (%)
Growth % 54.0 10.6 33.6 49.7 57.0
ROE 29.2 27.6 26.9 35.9 41.6
Net profit margin % 7.4 7.7 8.0 9.3 10.4
ROCE 22.8 21.9 27.6 34.2 43.1
ROIC 51.5 39.3 41.3 48.3 61.1
Turnover Ratios (days)
Balance Sheet
Inventory 29.0 28.2 27.0 27.6 29.5
Y/E December (Rs Cr) CY12 CY13 CY14E CY15E CY16E
Debtors 27.4 27.5 23.5 23.9 25.3
Share capital 27 27 27 27 27
Creditors 61.3 63.9 63.2 64.7 68.6
Reserves & surplus 1,728 2,028 2,489 3,301 4,570
Fixed asset turnover (x) 3.3 3.0 2.8 3.2 3.7
Total shareholder's fund 1,755 2,055 2,516 3,328 4,597
Solvency Ratio (x)
Minority Interest 948 1,040 1,085 1,085 1,085
Debt-equity 0.0 0.0 0.0 0.0 0.0
Loan fund 22 84 58 58 58
Interest coverage 159.2 86.1 102.5 122.6 191.9
Deferred tax liability 123 180 239 239 239
Per share (Rs)
Total capital employed 2,849 3,359 3,899 4,711 5,980
Adj EPS 175.2 193.8 227.0 387.5 608.5
Net fixed assets 1,496 2,120 2,728 3,241 3,991
BVPS 647.4 758.3 928.2 1,227.9 1,696.0
Investments 639 825 1,078 1,078 1,078
CEPS 205.5 241.8 308.1 475.1 714.9
Cash and bank 804 683 481 1,044 2,162
Dividend Ratios
Inventories 489 527 646 1,058 1,508
DPS (Rs) 19.9 29.9 50.0 75.0 120.0
Debtors 446 513 562 911 1,285
Dividend Yield (%) 0.1 0.2 0.3 0.4 0.7
Loans and advances 599 670 913 1,466 2,064
Dividend Payout (%) 11.4 15.4 22.0 19.4 19.7
Total current assets 2,337 2,391 2,602 4,479 7,019
Valuation (x)
Current lia. and provisions 1,623 1,977 2,509 4,085 6,107
P/E 96.7 87.4 74.6 43.7 27.8
Net current assets 714 414 93 393 911
P/BV 26.2 22.3 18.2 13.8 10.0
Total assets 2,849 3,359 3,899 4,711 5,980
EV/EBIDTA 81.0 62.4 40.0 27.9 17.9
EV/Sales 7.0 6.5 5.1 3.9 2.7
23
Indian Commercial Vehicle Industry
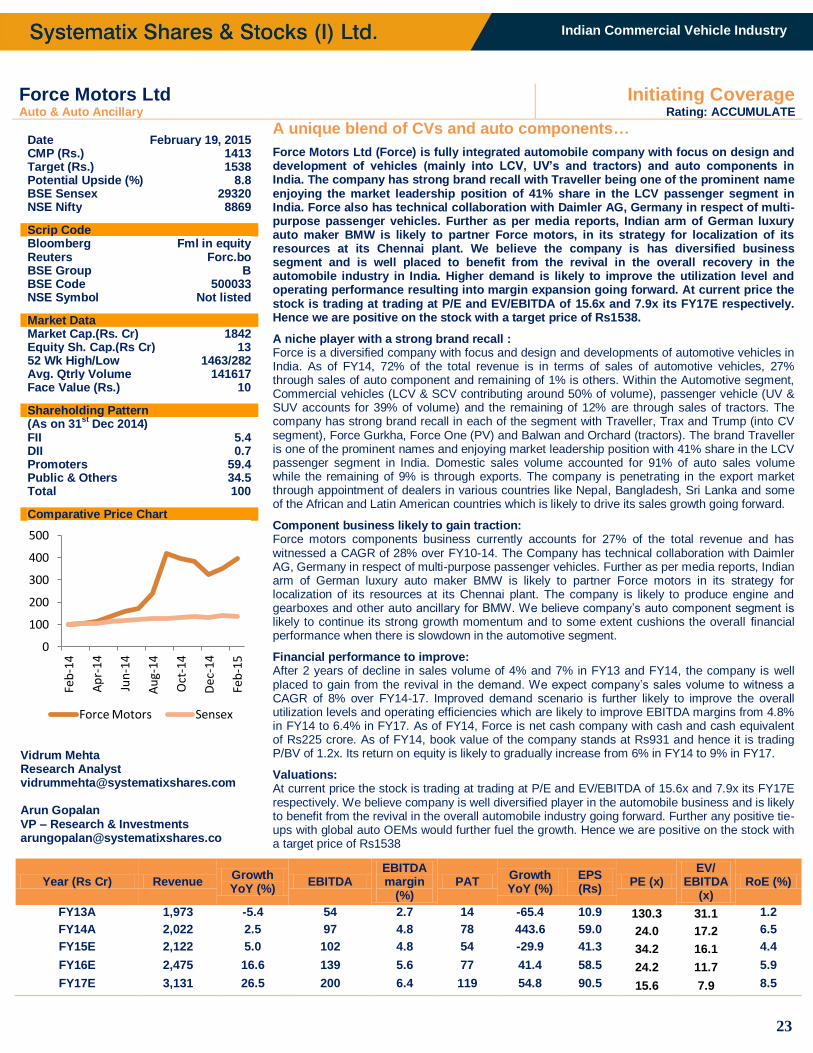
Force Motors Ltd Initiating Coverage Auto & Auto Ancillary Rating: ACCUMULATE
Date February 19, 2015 CMP (Rs.) 1413 Target (Rs.) 1538 Potential Upside (%) 8.8 BSE Sensex 29320 NSE Nifty 8869
Scrip Code Bloomberg Fml in equity Reuters Forc.bo BSE Group B BSE Code 500033 NSE Symbol Not listed Market Data Market Cap.(Rs. Cr) 1842 Equity Sh. Cap.(Rs Cr) 13 52 Wk High/Low 1463/282 Avg. Qtrly Volume 141617 Face Value (Rs.) 10 Shareholding Pattern (As on 31
st Dec 2014)
FII 5.4 DII 0.7 Promoters 59.4 Public & Others 34.5 Total 100 Comparative Price Chart
Vidrum Mehta Research Analyst [email protected] Arun Gopalan VP – Research & Investments [email protected]
A unique blend of CVs and auto components…
Force Motors Ltd (Force) is fully integrated automobile company with focus on design and development of vehicles (mainly into LCV, UV’s and tractors) and auto components in India. The company has strong brand recall with Traveller being one of the prominent name enjoying the market leadership position of 41% share in the LCV passenger segment in India. Force also has technical collaboration with Daimler AG, Germany in respect of multi-purpose passenger vehicles. Further as per media reports, Indian arm of German luxury auto maker BMW is likely to partner Force motors, in its strategy for localization of its resources at its Chennai plant. We believe the company is has diversified business segment and is well placed to benefit from the revival in the overall recovery in the automobile industry in India. Higher demand is likely to improve the utilization level and operating performance resulting into margin expansion going forward. At current price the stock is trading at trading at P/E and EV/EBITDA of 15.6x and 7.9x its FY17E respectively. Hence we are positive on the stock with a target price of Rs1538.
A niche player with a strong brand recall : Force is a diversified company with focus and design and developments of automotive vehicles in India. As of FY14, 72% of the total revenue is in terms of sales of automotive vehicles, 27% through sales of auto component and remaining of 1% is others. Within the Automotive segment, Commercial vehicles (LCV & SCV contributing around 50% of volume), passenger vehicle (UV & SUV accounts for 39% of volume) and the remaining of 12% are through sales of tractors. The company has strong brand recall in each of the segment with Traveller, Trax and Trump (into CV segment), Force Gurkha, Force One (PV) and Balwan and Orchard (tractors). The brand Traveller is one of the prominent names and enjoying market leadership position with 41% share in the LCV passenger segment in India. Domestic sales volume accounted for 91% of auto sales volume while the remaining of 9% is through exports. The company is penetrating in the export market through appointment of dealers in various countries like Nepal, Bangladesh, Sri Lanka and some of the African and Latin American countries which is likely to drive its sales growth going forward.
Component business likely to gain traction: Force motors components business currently accounts for 27% of the total revenue and has witnessed a CAGR of 28% over FY10-14. The Company has technical collaboration with Daimler AG, Germany in respect of multi-purpose passenger vehicles. Further as per media reports, Indian arm of German luxury auto maker BMW is likely to partner Force motors in its strategy for localization of its resources at its Chennai plant. The company is likely to produce engine and gearboxes and other auto ancillary for BMW. We believe company’s auto component segment is likely to continue its strong growth momentum and to some extent cushions the overall financial performance when there is slowdown in the automotive segment.
Financial performance to improve: After 2 years of decline in sales volume of 4% and 7% in FY13 and FY14, the company is well placed to gain from the revival in the demand. We expect company’s sales volume to witness a CAGR of 8% over FY14-17. Improved demand scenario is further likely to improve the overall utilization levels and operating efficiencies which are likely to improve EBITDA margins from 4.8% in FY14 to 6.4% in FY17. As of FY14, Force is net cash company with cash and cash equivalent of Rs225 crore. As of FY14, book value of the company stands at Rs931 and hence it is trading P/BV of 1.2x. Its return on equity is likely to gradually increase from 6% in FY14 to 9% in FY17.
Valuations: At current price the stock is trading at trading at P/E and EV/EBITDA of 15.6x and 7.9x its FY17E respectively. We believe company is well diversified player in the automobile business and is likely to benefit from the revival in the overall automobile industry going forward. Further any positive tie-ups with global auto OEMs would further fuel the growth. Hence we are positive on the stock with a target price of Rs1538
Year (Rs Cr) Revenue Growth YoY (%)
EBITDA EBITDA margin
(%) PAT
Growth YoY (%)
EPS (Rs)
PE (x) EV/
EBITDA (x)
RoE (%)
FY13A 1,973 -5.4 54 2.7 14 -65.4 10.9 130.3 31.1 1.2
FY14A 2,022 2.5 97 4.8 78 443.6 59.0 24.0 17.2 6.5
FY15E 2,122 5.0 102 4.8 54 -29.9 41.3 34.2 16.1 4.4
FY16E 2,475 16.6 139 5.6 77 41.4 58.5 24.2 11.7 5.9
FY17E 3,131 26.5 200 6.4 119 54.8 90.5 15.6 7.9 8.5
0
100
200
300
400
500
Feb
-14
Ap
r-14
Jun
-14
Au
g-14
Oct
-14
Dec
-14
Feb
-15
Force Motors Sensex
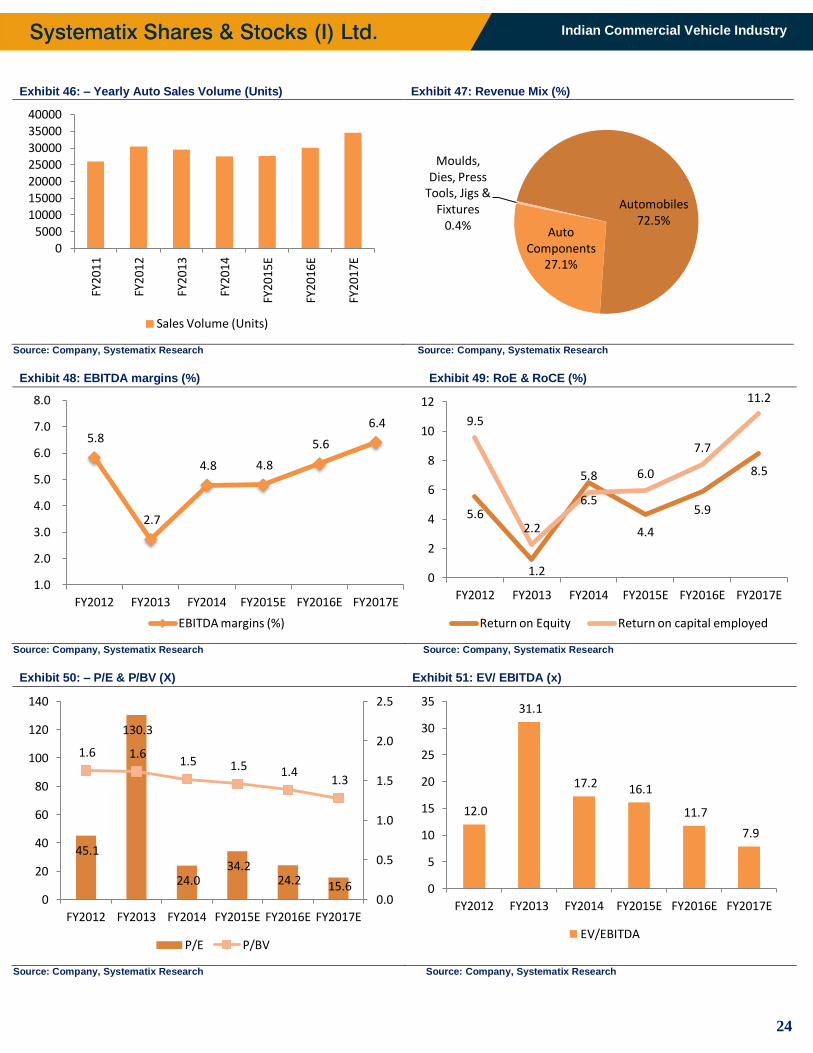
24
Indian Commercial Vehicle Industry
Exhibit 46: – Yearly Auto Sales Volume (Units) Exhibit 47: Revenue Mix (%)
Source: Company, Systematix Research Source: Company, Systematix Research
Exhibit 48: EBITDA margins (%) Exhibit 49: RoE & RoCE (%)
Source: Company, Systematix Research Source: Company, Systematix Research
Exhibit 50: – P/E & P/BV (X) Exhibit 51: EV/ EBITDA (x)
Source: Company, Systematix Research Source: Company, Systematix Research
0 5000
10000 15000
20000 25000 30000 35000 40000
FY20
11
FY20
12
FY20
13
FY20
14
FY20
15E
FY20
16E
FY20
17E
Sales Volume (Units)
Automobiles 72.5%
Auto Components
27.1%
Moulds, Dies, Press
Tools, Jigs & Fixtures
0.4%
5.8
2.7
4.8 4.8
5.6
6.4
1.0
2.0
3.0
4.0
5.0
6.0
7.0
8.0
FY2012 FY2013 FY2014 FY2015E FY2016E FY2017E
EBITDA margins (%)
5.6
1.2
6.5
4.4
5.9
8.5
9.5
2.2
5.8 6.0
7.7
11.2
0
2
4
6
8
10
12
FY2012 FY2013 FY2014 FY2015E FY2016E FY2017E
Return on Equity Return on capital employed
45.1
130.3
24.0 34.2
24.2 15.6
1.6 1.6 1.5 1.5 1.4
1.3
0.0
0.5
1.0
1.5
2.0
2.5
0
20
40
60
80
100
120
140
FY2012 FY2013 FY2014 FY2015E FY2016E FY2017E
P/E P/BV
12.0
31.1
17.2 16.1
11.7
7.9
0
5
10
15
20
25
30
35
FY2012 FY2013 FY2014 FY2015E FY2016E FY2017E
EV/EBITDA
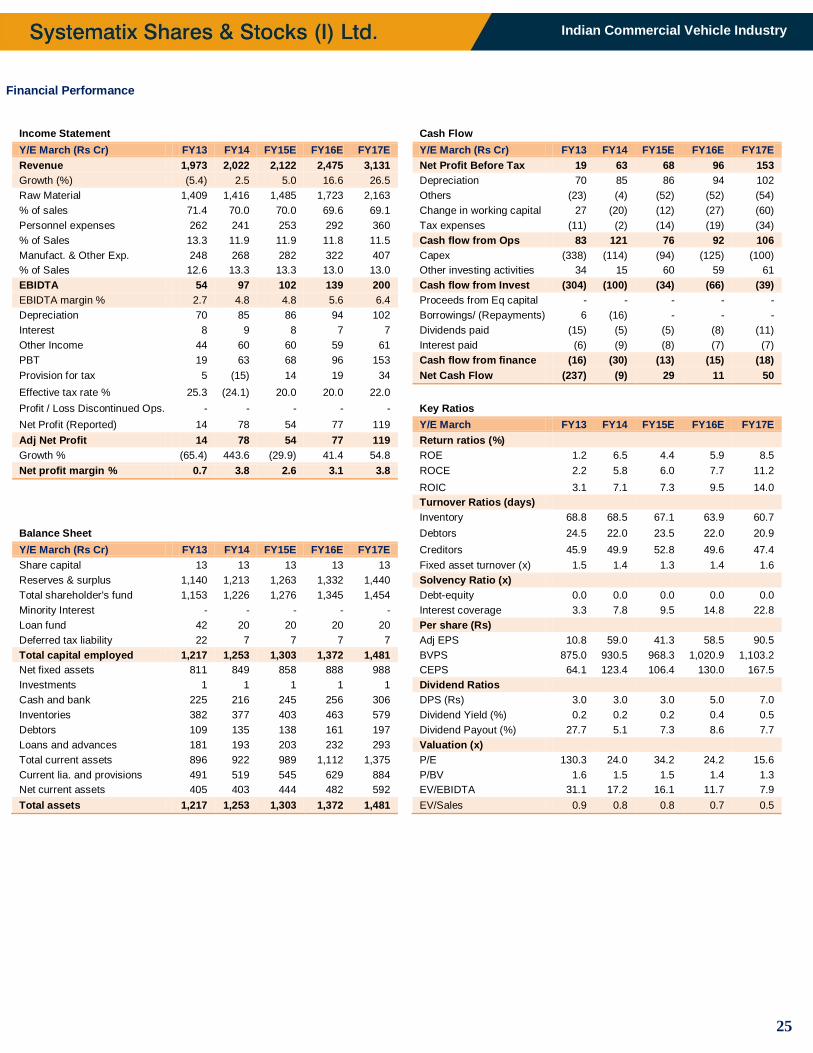
25
Indian Commercial Vehicle Industry
Financial Performance
Income Statement
Cash Flow
Y/E March (Rs Cr) FY13 FY14 FY15E FY16E FY17E
Y/E March (Rs Cr) FY13 FY14 FY15E FY16E FY17E
Revenue 1,973 2,022 2,122 2,475 3,131
Net Profit Before Tax 19 63 68 96 153
Growth (%) (5.4) 2.5 5.0 16.6 26.5
Depreciation 70 85 86 94 102
Raw Material 1,409 1,416 1,485 1,723 2,163
Others (23) (4) (52) (52) (54)
% of sales 71.4 70.0 70.0 69.6 69.1
Change in working capital 27 (20) (12) (27) (60)
Personnel expenses 262 241 253 292 360
Tax expenses (11) (2) (14) (19) (34)
% of Sales 13.3 11.9 11.9 11.8 11.5
Cash flow from Ops 83 121 76 92 106
Manufact. & Other Exp. 248 268 282 322 407
Capex (338) (114) (94) (125) (100)
% of Sales 12.6 13.3 13.3 13.0 13.0
Other investing activities 34 15 60 59 61
EBIDTA 54 97 102 139 200
Cash flow from Invest (304) (100) (34) (66) (39)
EBIDTA margin % 2.7 4.8 4.8 5.6 6.4
Proceeds from Eq capital - - - - -
Depreciation 70 85 86 94 102
Borrowings/ (Repayments) 6 (16) - - -
Interest 8 9 8 7 7
Dividends paid (15) (5) (5) (8) (11)
Other Income 44 60 60 59 61
Interest paid (6) (9) (8) (7) (7)
PBT 19 63 68 96 153
Cash flow from finance (16) (30) (13) (15) (18)
Provision for tax 5 (15) 14 19 34
Net Cash Flow (237) (9) 29 11 50
Effective tax rate % 25.3 (24.1) 20.0 20.0 22.0
Profit / Loss Discontinued Ops. - - - - -
Key Ratios
Net Profit (Reported) 14 78 54 77 119
Y/E March FY13 FY14 FY15E FY16E FY17E
Adj Net Profit 14 78 54 77 119
Return ratios (%)
Growth % (65.4) 443.6 (29.9) 41.4 54.8
ROE 1.2 6.5 4.4 5.9 8.5
Net profit margin % 0.7 3.8 2.6 3.1 3.8
ROCE 2.2 5.8 6.0 7.7 11.2
ROIC 3.1 7.1 7.3 9.5 14.0
Turnover Ratios (days)
Inventory 68.8 68.5 67.1 63.9 60.7
Balance Sheet
Debtors 24.5 22.0 23.5 22.0 20.9
Y/E March (Rs Cr) FY13 FY14 FY15E FY16E FY17E
Creditors 45.9 49.9 52.8 49.6 47.4
Share capital 13 13 13 13 13
Fixed asset turnover (x) 1.5 1.4 1.3 1.4 1.6
Reserves & surplus 1,140 1,213 1,263 1,332 1,440
Solvency Ratio (x)
Total shareholder's fund 1,153 1,226 1,276 1,345 1,454
Debt-equity 0.0 0.0 0.0 0.0 0.0
Minority Interest - - - - -
Interest coverage 3.3 7.8 9.5 14.8 22.8
Loan fund 42 20 20 20 20
Per share (Rs)
Deferred tax liability 22 7 7 7 7
Adj EPS 10.8 59.0 41.3 58.5 90.5
Total capital employed 1,217 1,253 1,303 1,372 1,481
BVPS 875.0 930.5 968.3 1,020.9 1,103.2
Net fixed assets 811 849 858 888 988
CEPS 64.1 123.4 106.4 130.0 167.5
Investments 1 1 1 1 1
Dividend Ratios
Cash and bank 225 216 245 256 306
DPS (Rs) 3.0 3.0 3.0 5.0 7.0
Inventories 382 377 403 463 579
Dividend Yield (%) 0.2 0.2 0.2 0.4 0.5
Debtors 109 135 138 161 197
Dividend Payout (%) 27.7 5.1 7.3 8.6 7.7
Loans and advances 181 193 203 232 293
Valuation (x)
Total current assets 896 922 989 1,112 1,375
P/E 130.3 24.0 34.2 24.2 15.6
Current lia. and provisions 491 519 545 629 884
P/BV 1.6 1.5 1.5 1.4 1.3
Net current assets 405 403 444 482 592
EV/EBIDTA 31.1 17.2 16.1 11.7 7.9
Total assets 1,217 1,253 1,303 1,372 1,481
EV/Sales 0.9 0.8 0.8 0.7 0.5
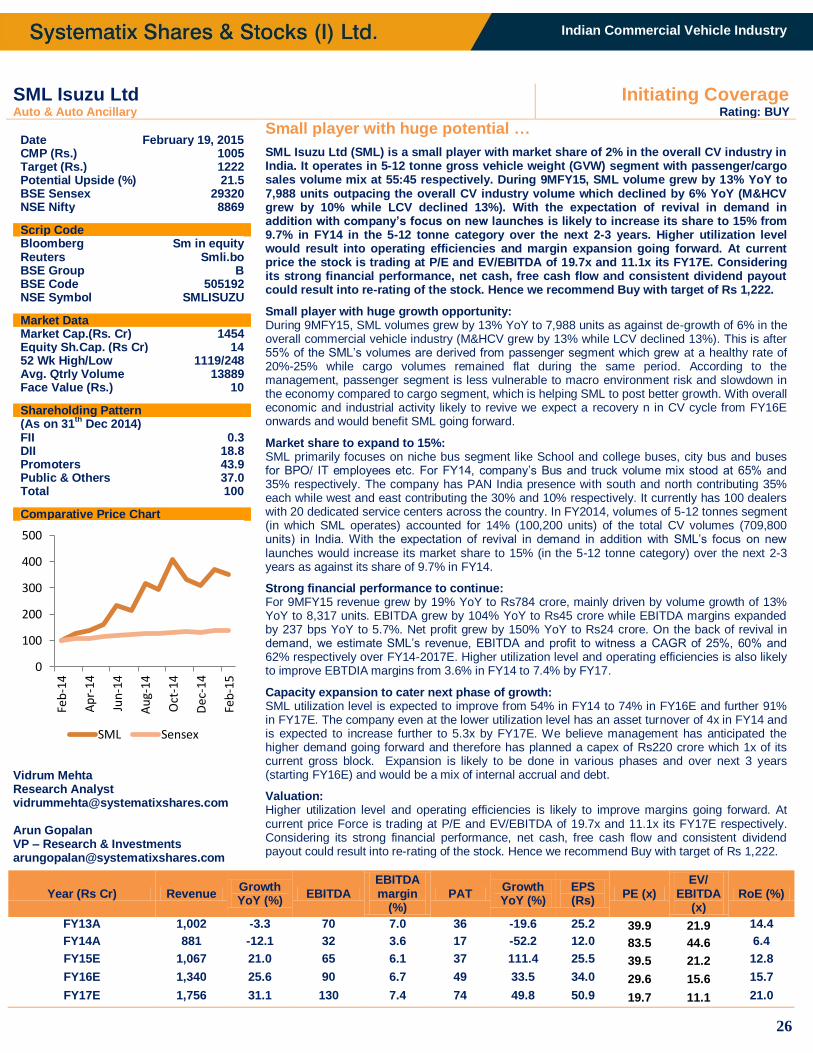
26
Indian Commercial Vehicle Industry
SML Isuzu Ltd Initiating Coverage Auto & Auto Ancillary Rating: BUY
Date February 19, 2015 CMP (Rs.) 1005 Target (Rs.) 1222 Potential Upside (%) 21.5 BSE Sensex 29320 NSE Nifty 8869
Scrip Code Bloomberg Sm in equity Reuters Smli.bo BSE Group B BSE Code 505192 NSE Symbol SMLISUZU Market Data Market Cap.(Rs. Cr) 1454 Equity Sh.Cap. (Rs Cr) 14 52 Wk High/Low 1119/248 Avg. Qtrly Volume 13889 Face Value (Rs.) 10 Shareholding Pattern (As on 31
th Dec 2014)
FII 0.3 DII 18.8 Promoters 43.9 Public & Others 37.0 Total 100 Comparative Price Chart
Vidrum Mehta Research Analyst [email protected] Arun Gopalan VP – Research & Investments [email protected]
Small player with huge potential …
SML Isuzu Ltd (SML) is a small player with market share of 2% in the overall CV industry in India. It operates in 5-12 tonne gross vehicle weight (GVW) segment with passenger/cargo sales volume mix at 55:45 respectively. During 9MFY15, SML volume grew by 13% YoY to 7,988 units outpacing the overall CV industry volume which declined by 6% YoY (M&HCV grew by 10% while LCV declined 13%). With the expectation of revival in demand in addition with company’s focus on new launches is likely to increase its share to 15% from 9.7% in FY14 in the 5-12 tonne category over the next 2-3 years. Higher utilization level would result into operating efficiencies and margin expansion going forward. At current price the stock is trading at P/E and EV/EBITDA of 19.7x and 11.1x its FY17E. Considering its strong financial performance, net cash, free cash flow and consistent dividend payout could result into re-rating of the stock. Hence we recommend Buy with target of Rs 1,222.
Small player with huge growth opportunity: During 9MFY15, SML volumes grew by 13% YoY to 7,988 units as against de-growth of 6% in the overall commercial vehicle industry (M&HCV grew by 13% while LCV declined 13%). This is after 55% of the SML’s volumes are derived from passenger segment which grew at a healthy rate of 20%-25% while cargo volumes remained flat during the same period. According to the management, passenger segment is less vulnerable to macro environment risk and slowdown in the economy compared to cargo segment, which is helping SML to post better growth. With overall economic and industrial activity likely to revive we expect a recovery n in CV cycle from FY16E onwards and would benefit SML going forward.
Market share to expand to 15%: SML primarily focuses on niche bus segment like School and college buses, city bus and buses for BPO/ IT employees etc. For FY14, company’s Bus and truck volume mix stood at 65% and 35% respectively. The company has PAN India presence with south and north contributing 35% each while west and east contributing the 30% and 10% respectively. It currently has 100 dealers with 20 dedicated service centers across the country. In FY2014, volumes of 5-12 tonnes segment (in which SML operates) accounted for 14% (100,200 units) of the total CV volumes (709,800 units) in India. With the expectation of revival in demand in addition with SML’s focus on new launches would increase its market share to 15% (in the 5-12 tonne category) over the next 2-3 years as against its share of 9.7% in FY14.
Strong financial performance to continue: For 9MFY15 revenue grew by 19% YoY to Rs784 crore, mainly driven by volume growth of 13% YoY to 8,317 units. EBITDA grew by 104% YoY to Rs45 crore while EBITDA margins expanded by 237 bps YoY to 5.7%. Net profit grew by 150% YoY to Rs24 crore. On the back of revival in demand, we estimate SML’s revenue, EBITDA and profit to witness a CAGR of 25%, 60% and 62% respectively over FY14-2017E. Higher utilization level and operating efficiencies is also likely to improve EBTDIA margins from 3.6% in FY14 to 7.4% by FY17.
Capacity expansion to cater next phase of growth: SML utilization level is expected to improve from 54% in FY14 to 74% in FY16E and further 91% in FY17E. The company even at the lower utilization level has an asset turnover of 4x in FY14 and is expected to increase further to 5.3x by FY17E. We believe management has anticipated the higher demand going forward and therefore has planned a capex of Rs220 crore which 1x of its current gross block. Expansion is likely to be done in various phases and over next 3 years (starting FY16E) and would be a mix of internal accrual and debt.
Valuation: Higher utilization level and operating efficiencies is likely to improve margins going forward. At current price Force is trading at P/E and EV/EBITDA of 19.7x and 11.1x its FY17E respectively. Considering its strong financial performance, net cash, free cash flow and consistent dividend payout could result into re-rating of the stock. Hence we recommend Buy with target of Rs 1,222.
Year (Rs Cr) Revenue Growth YoY (%)
EBITDA EBITDA margin
(%) PAT
Growth YoY (%)
EPS (Rs)
PE (x) EV/
EBITDA (x)
RoE (%)
FY13A 1,002 -3.3 70 7.0 36 -19.6 25.2 39.9 21.9 14.4
FY14A 881 -12.1 32 3.6 17 -52.2 12.0 83.5 44.6 6.4
FY15E 1,067 21.0 65 6.1 37 111.4 25.5 39.5 21.2 12.8
FY16E 1,340 25.6 90 6.7 49 33.5 34.0 29.6 15.6 15.7
FY17E 1,756 31.1 130 7.4 74 49.8 50.9 19.7 11.1 21.0
0
100
200
300
400
500
Feb
-14
Ap
r-14
Jun
-14
Au
g-14
Oct
-14
Dec
-14
Feb
-15
SML Sensex
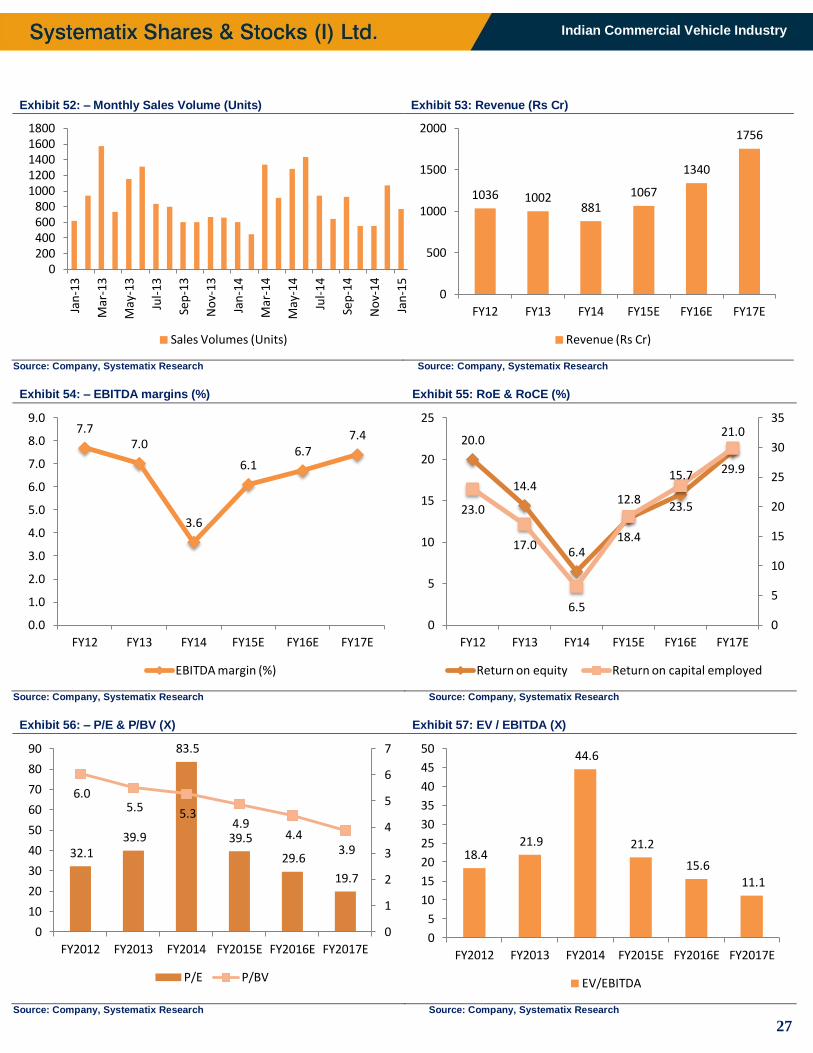
27
Indian Commercial Vehicle Industry
Exhibit 52: – Monthly Sales Volume (Units) Exhibit 53: Revenue (Rs Cr)
Source: Company, Systematix Research Source: Company, Systematix Research
Exhibit 54: – EBITDA margins (%) Exhibit 55: RoE & RoCE (%)
Source: Company, Systematix Research Source: Company, Systematix Research
Exhibit 56: – P/E & P/BV (X) Exhibit 57: EV / EBITDA (X)
Source: Company, Systematix Research Source: Company, Systematix Research
0 200 400 600 800
1000 1200 1400 1600 1800
Jan
-13
Mar
-13
May
-13
Jul-
13
Sep
-13
No
v-13
Jan
-14
Mar
-14
May
-14
Jul-
14
Sep
-14
No
v-14
Jan
-15
Sales Volumes (Units)
1036 1002 881
1067
1340
1756
0
500
1000
1500
2000
FY12 FY13 FY14 FY15E FY16E FY17E
Revenue (Rs Cr)
7.7 7.0
3.6
6.1 6.7
7.4
0.0
1.0
2.0
3.0
4.0
5.0
6.0
7.0
8.0
9.0
FY12 FY13 FY14 FY15E FY16E FY17E
EBITDA margin (%)
20.0
14.4
6.4
12.8
15.7
21.0
23.0
17.0
6.5
18.4
23.5
29.9
0
5
10
15
20
25
30
35
0
5
10
15
20
25
FY12 FY13 FY14 FY15E FY16E FY17E
Return on equity Return on capital employed
32.1 39.9
83.5
39.5
29.6
19.7
6.0 5.5 5.3
4.9 4.4
3.9
0
1
2
3
4
5
6
7
0
10
20
30
40
50
60
70
80
90
FY2012 FY2013 FY2014 FY2015E FY2016E FY2017E
P/E P/BV
18.4 21.9
44.6
21.2
15.6 11.1
0
5
10
15
20
25
30
35
40
45
50
FY2012 FY2013 FY2014 FY2015E FY2016E FY2017E
EV/EBITDA
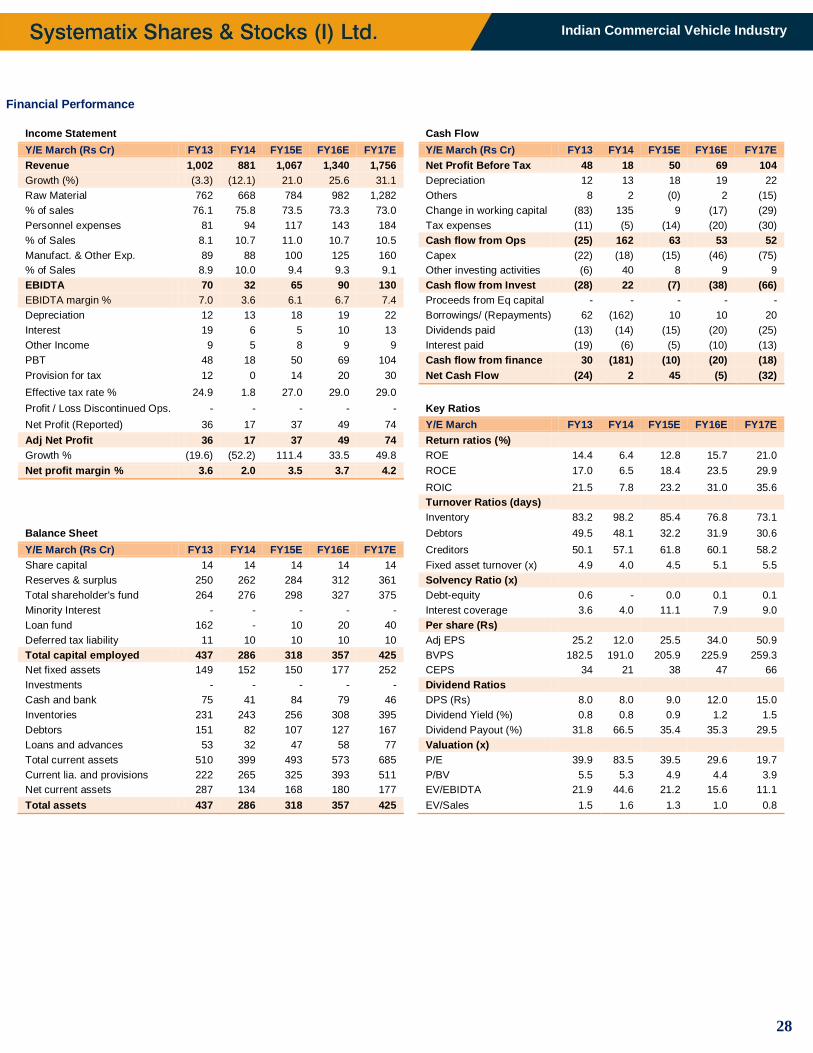
28
Indian Commercial Vehicle Industry
Financial Performance
Income Statement
Cash Flow
Y/E March (Rs Cr) FY13 FY14 FY15E FY16E FY17E
Y/E March (Rs Cr) FY13 FY14 FY15E FY16E FY17E
Revenue 1,002 881 1,067 1,340 1,756
Net Profit Before Tax 48 18 50 69 104
Growth (%) (3.3) (12.1) 21.0 25.6 31.1
Depreciation 12 13 18 19 22
Raw Material 762 668 784 982 1,282
Others 8 2 (0) 2 (15)
% of sales 76.1 75.8 73.5 73.3 73.0
Change in working capital (83) 135 9 (17) (29)
Personnel expenses 81 94 117 143 184
Tax expenses (11) (5) (14) (20) (30)
% of Sales 8.1 10.7 11.0 10.7 10.5
Cash flow from Ops (25) 162 63 53 52
Manufact. & Other Exp. 89 88 100 125 160
Capex (22) (18) (15) (46) (75)
% of Sales 8.9 10.0 9.4 9.3 9.1
Other investing activities (6) 40 8 9 9
EBIDTA 70 32 65 90 130
Cash flow from Invest (28) 22 (7) (38) (66)
EBIDTA margin % 7.0 3.6 6.1 6.7 7.4
Proceeds from Eq capital - - - - -
Depreciation 12 13 18 19 22
Borrowings/ (Repayments) 62 (162) 10 10 20
Interest 19 6 5 10 13
Dividends paid (13) (14) (15) (20) (25)
Other Income 9 5 8 9 9
Interest paid (19) (6) (5) (10) (13)
PBT 48 18 50 69 104
Cash flow from finance 30 (181) (10) (20) (18)
Provision for tax 12 0 14 20 30
Net Cash Flow (24) 2 45 (5) (32)
Effective tax rate % 24.9 1.8 27.0 29.0 29.0
Profit / Loss Discontinued Ops. - - - - -
Key Ratios
Net Profit (Reported) 36 17 37 49 74
Y/E March FY13 FY14 FY15E FY16E FY17E
Adj Net Profit 36 17 37 49 74
Return ratios (%)
Growth % (19.6) (52.2) 111.4 33.5 49.8
ROE 14.4 6.4 12.8 15.7 21.0
Net profit margin % 3.6 2.0 3.5 3.7 4.2
ROCE 17.0 6.5 18.4 23.5 29.9
ROIC 21.5 7.8 23.2 31.0 35.6
Turnover Ratios (days)
Inventory 83.2 98.2 85.4 76.8 73.1
Balance Sheet
Debtors 49.5 48.1 32.2 31.9 30.6
Y/E March (Rs Cr) FY13 FY14 FY15E FY16E FY17E
Creditors 50.1 57.1 61.8 60.1 58.2
Share capital 14 14 14 14 14
Fixed asset turnover (x) 4.9 4.0 4.5 5.1 5.5
Reserves & surplus 250 262 284 312 361
Solvency Ratio (x)
Total shareholder's fund 264 276 298 327 375
Debt-equity 0.6 - 0.0 0.1 0.1
Minority Interest - - - - -
Interest coverage 3.6 4.0 11.1 7.9 9.0
Loan fund 162 - 10 20 40
Per share (Rs)
Deferred tax liability 11 10 10 10 10
Adj EPS 25.2 12.0 25.5 34.0 50.9
Total capital employed 437 286 318 357 425
BVPS 182.5 191.0 205.9 225.9 259.3
Net fixed assets 149 152 150 177 252
CEPS 34 21 38 47 66
Investments - - - - -
Dividend Ratios
Cash and bank 75 41 84 79 46
DPS (Rs) 8.0 8.0 9.0 12.0 15.0
Inventories 231 243 256 308 395
Dividend Yield (%) 0.8 0.8 0.9 1.2 1.5
Debtors 151 82 107 127 167
Dividend Payout (%) 31.8 66.5 35.4 35.3 29.5
Loans and advances 53 32 47 58 77
Valuation (x)
Total current assets 510 399 493 573 685
P/E 39.9 83.5 39.5 29.6 19.7
Current lia. and provisions 222 265 325 393 511
P/BV 5.5 5.3 4.9 4.4 3.9
Net current assets 287 134 168 180 177
EV/EBIDTA 21.9 44.6 21.2 15.6 11.1
Total assets 437 286 318 357 425
EV/Sales 1.5 1.6 1.3 1.0 0.8
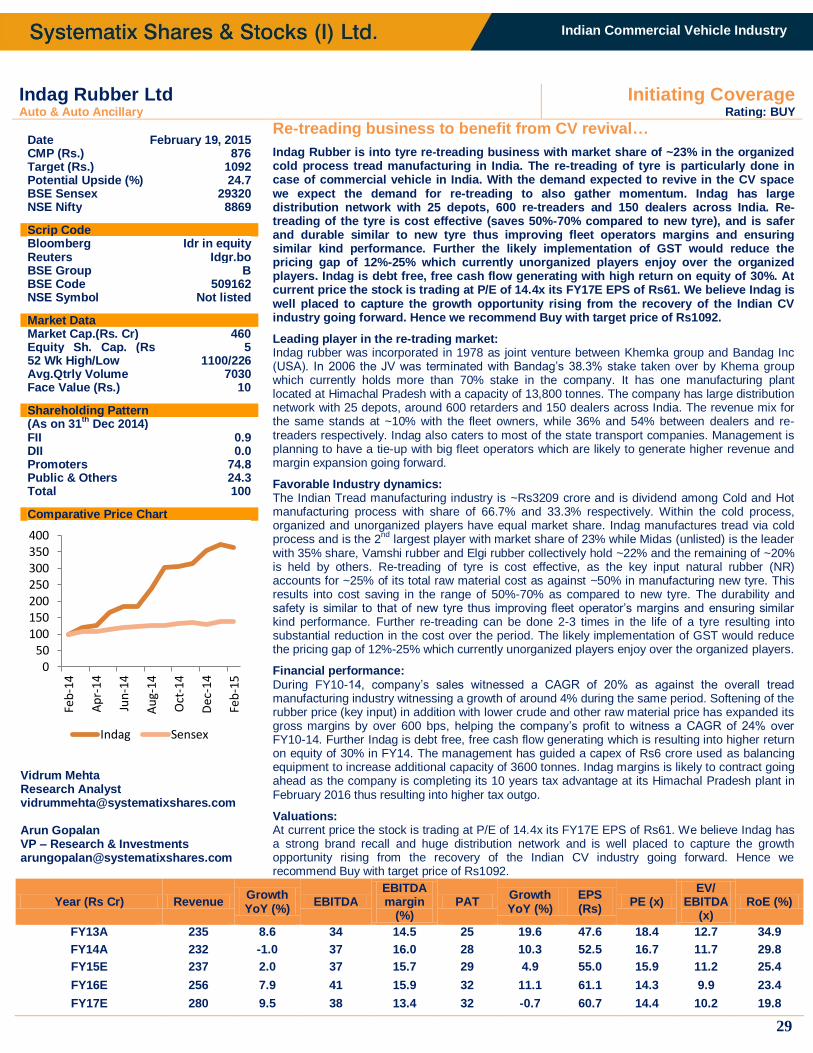
29
Indian Commercial Vehicle Industry
Indag Rubber Ltd Initiating Coverage Auto & Auto Ancillary Rating: BUY
Date February 19, 2015 CMP (Rs.) 876 Target (Rs.) 1092 Potential Upside (%) 24.7 BSE Sensex 29320 NSE Nifty 8869
Scrip Code Bloomberg Idr in equity Reuters Idgr.bo BSE Group B BSE Code 509162 NSE Symbol Not listed Market Data Market Cap.(Rs. Cr) 460 Equity Sh. Cap. (Rs Cr)
5 52 Wk High/Low 1100/226 Avg.Qtrly Volume 7030 Face Value (Rs.) 10 Shareholding Pattern (As on 31
th Dec 2014)
FII 0.9 DII 0.0 Promoters 74.8 Public & Others 24.3 Total 100 Comparative Price Chart
Vidrum Mehta Research Analyst [email protected] Arun Gopalan VP – Research & Investments [email protected]
Re-treading business to benefit from CV revival…
Indag Rubber is into tyre re-treading business with market share of ~23% in the organized cold process tread manufacturing in India. The re-treading of tyre is particularly done in case of commercial vehicle in India. With the demand expected to revive in the CV space we expect the demand for re-treading to also gather momentum. Indag has large distribution network with 25 depots, 600 re-treaders and 150 dealers across India. Re-treading of the tyre is cost effective (saves 50%-70% compared to new tyre), and is safer and durable similar to new tyre thus improving fleet operators margins and ensuring similar kind performance. Further the likely implementation of GST would reduce the pricing gap of 12%-25% which currently unorganized players enjoy over the organized players. Indag is debt free, free cash flow generating with high return on equity of 30%. At current price the stock is trading at P/E of 14.4x its FY17E EPS of Rs61. We believe Indag is well placed to capture the growth opportunity rising from the recovery of the Indian CV industry going forward. Hence we recommend Buy with target price of Rs1092.
Leading player in the re-trading market: Indag rubber was incorporated in 1978 as joint venture between Khemka group and Bandag Inc (USA). In 2006 the JV was terminated with Bandag’s 38.3% stake taken over by Khema group which currently holds more than 70% stake in the company. It has one manufacturing plant located at Himachal Pradesh with a capacity of 13,800 tonnes. The company has large distribution network with 25 depots, around 600 retarders and 150 dealers across India. The revenue mix for the same stands at ~10% with the fleet owners, while 36% and 54% between dealers and re-treaders respectively. Indag also caters to most of the state transport companies. Management is planning to have a tie-up with big fleet operators which are likely to generate higher revenue and margin expansion going forward.
Favorable Industry dynamics: The Indian Tread manufacturing industry is ~Rs3209 crore and is dividend among Cold and Hot manufacturing process with share of 66.7% and 33.3% respectively. Within the cold process, organized and unorganized players have equal market share. Indag manufactures tread via cold process and is the 2
nd largest player with market share of 23% while Midas (unlisted) is the leader
with 35% share, Vamshi rubber and Elgi rubber collectively hold ~22% and the remaining of ~20% is held by others. Re-treading of tyre is cost effective, as the key input natural rubber (NR) accounts for ~25% of its total raw material cost as against ~50% in manufacturing new tyre. This results into cost saving in the range of 50%-70% as compared to new tyre. The durability and safety is similar to that of new tyre thus improving fleet operator’s margins and ensuring similar kind performance. Further re-treading can be done 2-3 times in the life of a tyre resulting into substantial reduction in the cost over the period. The likely implementation of GST would reduce the pricing gap of 12%-25% which currently unorganized players enjoy over the organized players.
Financial performance: During FY10-14, company’s sales witnessed a CAGR of 20% as against the overall tread manufacturing industry witnessing a growth of around 4% during the same period. Softening of the rubber price (key input) in addition with lower crude and other raw material price has expanded its gross margins by over 600 bps, helping the company’s profit to witness a CAGR of 24% over FY10-14. Further Indag is debt free, free cash flow generating which is resulting into higher return on equity of 30% in FY14. The management has guided a capex of Rs6 crore used as balancing equipment to increase additional capacity of 3600 tonnes. Indag margins is likely to contract going ahead as the company is completing its 10 years tax advantage at its Himachal Pradesh plant in February 2016 thus resulting into higher tax outgo.
Valuations: At current price the stock is trading at P/E of 14.4x its FY17E EPS of Rs61. We believe Indag has a strong brand recall and huge distribution network and is well placed to capture the growth opportunity rising from the recovery of the Indian CV industry going forward. Hence we recommend Buy with target price of Rs1092.
Year (Rs Cr) Revenue Growth YoY (%)
EBITDA EBITDA margin
(%) PAT
Growth YoY (%)
EPS (Rs)
PE (x) EV/
EBITDA (x)
RoE (%)
FY13A 235 8.6 34 14.5 25 19.6 47.6 18.4 12.7 34.9
FY14A 232 -1.0 37 16.0 28 10.3 52.5 16.7 11.7 29.8
FY15E 237 2.0 37 15.7 29 4.9 55.0 15.9 11.2 25.4
FY16E 256 7.9 41 15.9 32 11.1 61.1 14.3 9.9 23.4
FY17E 280 9.5 38 13.4 32 -0.7 60.7 14.4 10.2 19.8
0 50
100 150 200 250 300 350 400
Feb
-14
Ap
r-14
Jun
-14
Au
g-14
Oct
-14
Dec
-14
Feb
-15
Indag Sensex
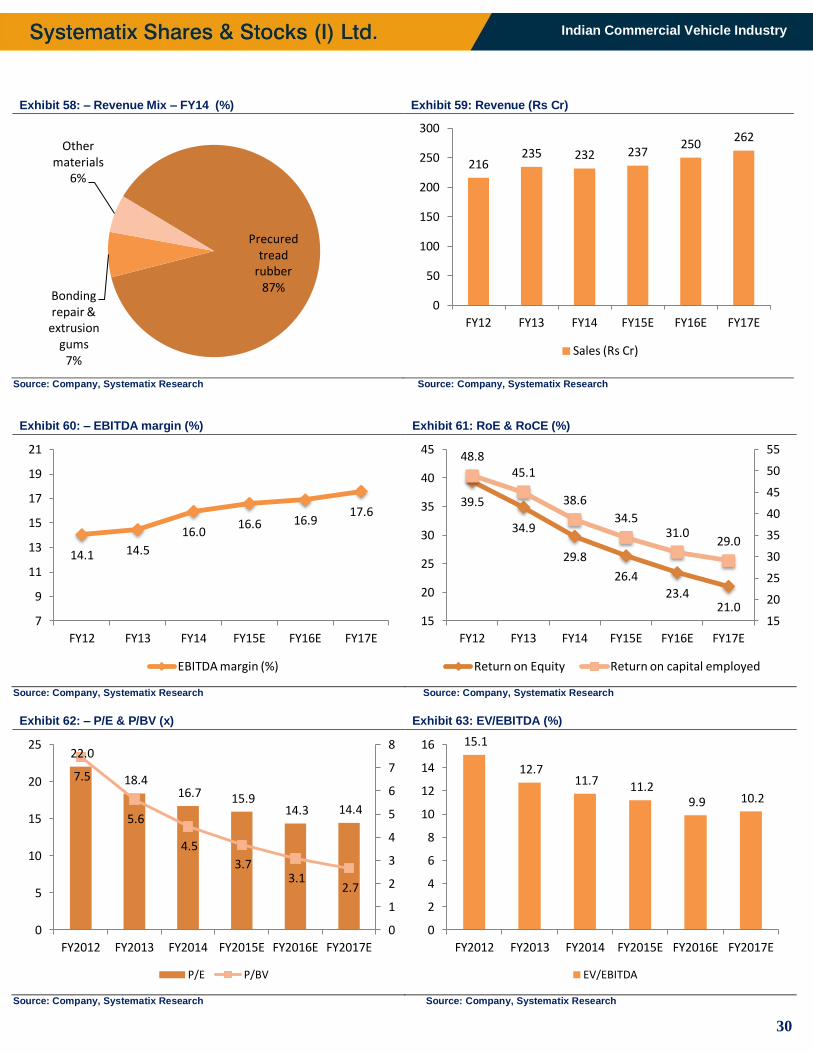
30
Indian Commercial Vehicle Industry
Exhibit 58: – Revenue Mix – FY14 (%) Exhibit 59: Revenue (Rs Cr)
Source: Company, Systematix Research Source: Company, Systematix Research
Exhibit 60: – EBITDA margin (%) Exhibit 61: RoE & RoCE (%)
Source: Company, Systematix Research Source: Company, Systematix Research
Exhibit 62: – P/E & P/BV (x) Exhibit 63: EV/EBITDA (%)
Source: Company, Systematix Research Source: Company, Systematix Research
Precured tread
rubber 87%
Bonding repair &
extrusion gums
7%
Other materials
6% 216
235 232 237 250
262
0
50
100
150
200
250
300
FY12 FY13 FY14 FY15E FY16E FY17E
Sales (Rs Cr)
14.1 14.5
16.0 16.6 16.9
17.6
7
9
11
13
15
17
19
21
FY12 FY13 FY14 FY15E FY16E FY17E
EBITDA margin (%)
39.5
34.9
29.8
26.4
23.4 21.0
48.8 45.1
38.6
34.5 31.0
29.0
15
20
25
30
35
40
45
50
55
15
20
25
30
35
40
45
FY12 FY13 FY14 FY15E FY16E FY17E
Return on Equity Return on capital employed
22.0
18.4 16.7 15.9
14.3 14.4
7.5
5.6
4.5
3.7 3.1
2.7
0
1
2
3
4
5
6
7
8
0
5
10
15
20
25
FY2012 FY2013 FY2014 FY2015E FY2016E FY2017E
P/E P/BV
15.1
12.7 11.7 11.2
9.9 10.2
0
2
4
6
8
10
12
14
16
FY2012 FY2013 FY2014 FY2015E FY2016E FY2017E
EV/EBITDA
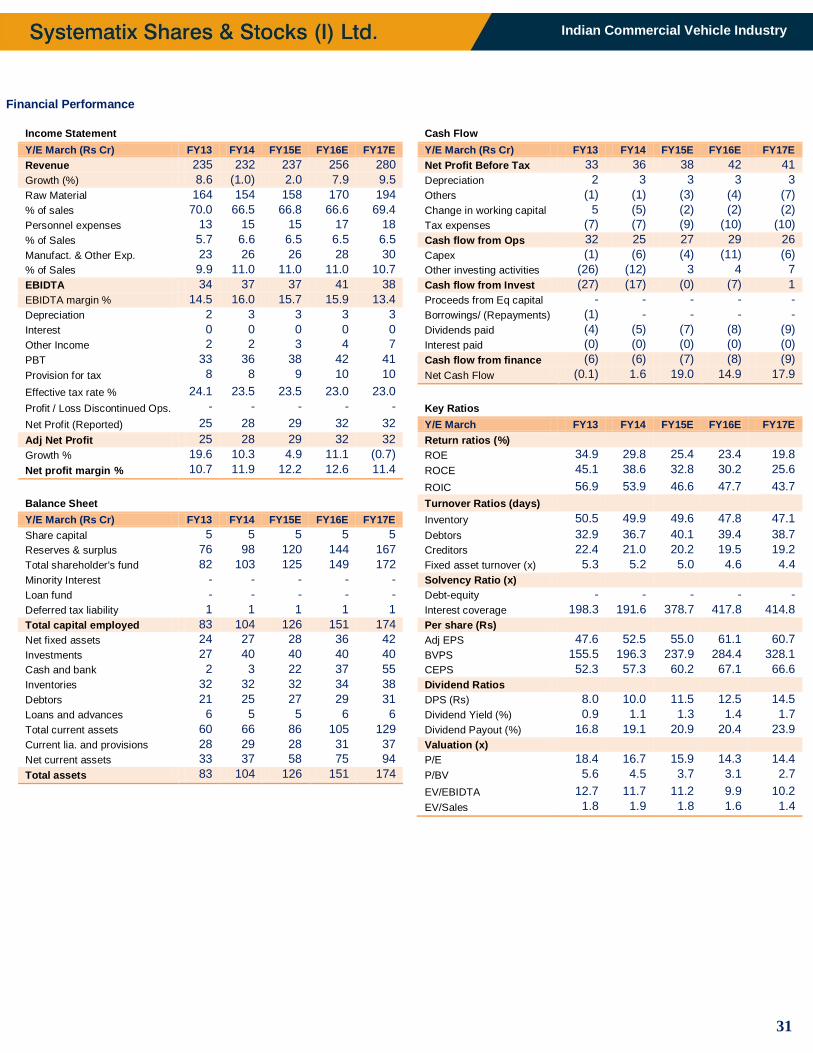
31
Indian Commercial Vehicle Industry
Financial Performance
Income Statement
Cash Flow
Y/E March (Rs Cr) FY13 FY14 FY15E FY16E FY17E
Y/E March (Rs Cr) FY13 FY14 FY15E FY16E FY17E
Revenue 235 232 237 256 280
Net Profit Before Tax 33 36 38 42 41
Growth (%) 8.6 (1.0) 2.0 7.9 9.5
Depreciation 2 3 3 3 3
Raw Material 164 154 158 170 194
Others (1) (1) (3) (4) (7)
% of sales 70.0 66.5 66.8 66.6 69.4
Change in working capital 5 (5) (2) (2) (2)
Personnel expenses 13 15 15 17 18
Tax expenses (7) (7) (9) (10) (10)
% of Sales 5.7 6.6 6.5 6.5 6.5
Cash flow from Ops 32 25 27 29 26
Manufact. & Other Exp. 23 26 26 28 30
Capex (1) (6) (4) (11) (6)
% of Sales 9.9 11.0 11.0 11.0 10.7
Other investing activities (26) (12) 3 4 7
EBIDTA 34 37 37 41 38
Cash flow from Invest (27) (17) (0) (7) 1
EBIDTA margin % 14.5 16.0 15.7 15.9 13.4
Proceeds from Eq capital - - - - -
Depreciation 2 3 3 3 3
Borrowings/ (Repayments) (1) - - - -
Interest 0 0 0 0 0
Dividends paid (4) (5) (7) (8) (9)
Other Income 2 2 3 4 7
Interest paid (0) (0) (0) (0) (0)
PBT 33 36 38 42 41
Cash flow from finance (6) (6) (7) (8) (9)
Provision for tax 8 8 9 10 10
Net Cash Flow (0.1) 1.6 19.0 14.9 17.9
Effective tax rate % 24.1 23.5 23.5 23.0 23.0
Profit / Loss Discontinued Ops. - - - - -
Key Ratios
Net Profit (Reported) 25 28 29 32 32
Y/E March FY13 FY14 FY15E FY16E FY17E
Adj Net Profit 25 28 29 32 32
Return ratios (%)
Growth % 19.6 10.3 4.9 11.1 (0.7)
ROE 34.9 29.8 25.4 23.4 19.8
Net profit margin % 10.7 11.9 12.2 12.6 11.4
ROCE 45.1 38.6 32.8 30.2 25.6
ROIC 56.9 53.9 46.6 47.7 43.7
Balance Sheet
Turnover Ratios (days)
Y/E March (Rs Cr) FY13 FY14 FY15E FY16E FY17E
Inventory 50.5 49.9 49.6 47.8 47.1
Share capital 5 5 5 5 5
Debtors 32.9 36.7 40.1 39.4 38.7
Reserves & surplus 76 98 120 144 167
Creditors 22.4 21.0 20.2 19.5 19.2
Total shareholder's fund 82 103 125 149 172
Fixed asset turnover (x) 5.3 5.2 5.0 4.6 4.4
Minority Interest - - - - -
Solvency Ratio (x)
Loan fund - - - - -
Debt-equity - - - - -
Deferred tax liability 1 1 1 1 1
Interest coverage 198.3 191.6 378.7 417.8 414.8
Total capital employed 83 104 126 151 174
Per share (Rs)
Net fixed assets 24 27 28 36 42
Adj EPS 47.6 52.5 55.0 61.1 60.7
Investments 27 40 40 40 40
BVPS 155.5 196.3 237.9 284.4 328.1
Cash and bank 2 3 22 37 55
CEPS 52.3 57.3 60.2 67.1 66.6
Inventories 32 32 32 34 38
Dividend Ratios
Debtors 21 25 27 29 31
DPS (Rs) 8.0 10.0 11.5 12.5 14.5
Loans and advances 6 5 5 6 6
Dividend Yield (%) 0.9 1.1 1.3 1.4 1.7
Total current assets 60 66 86 105 129
Dividend Payout (%) 16.8 19.1 20.9 20.4 23.9
Current lia. and provisions 28 29 28 31 37
Valuation (x)
Net current assets 33 37 58 75 94
P/E 18.4 16.7 15.9 14.3 14.4
Total assets 83 104 126 151 174
P/BV 5.6 4.5 3.7 3.1 2.7
EV/EBIDTA 12.7 11.7 11.2 9.9 10.2
EV/Sales 1.8 1.9 1.8 1.6 1.4
DISCLOSURES/ APPENDIX
I. ANALYST CERTIFICATION I, Vidrum Mehta, hereby certify (1) that the views expressed in this research report accurately reflect my personal views about any or all o f the subject securities or issuers referred to in this research report, (2) No part of my compensation was, is, or will be directly or indirectly related to the specific recommendations or views expressed in this research report by Systematix Shares & Stocks (I) Limited or its Group/associates companies. (3) has taken reasonable care to achieve and maintain independence and objectivity in making any recommendations.
Disclosure of Interest Statement Response
Analyst holding in the stocks covered in the report Yes
Served as an officer, director or employee No
II. ISSUER SPECIFIC REGULATORY DISCLOSURES, UNLESS SPECIFICALLY MENTIONED IN POINT NO. 9 BELOW:
1. The Research Analyst(s), Systematix Shares & Stocks(I) Limited (SSSIL), Associate of Analyst or his relative does not have any financial interest in the company(ies) covered in this report. 2. The Research Analyst, SSSIL or its associates or relatives of the Research Analyst affiliates collectively do not hold more than 1% of the securities of the company (ies) covered in this report as of the end of
the month immediately preceding the distribution of the research report. 3. The Research Analyst, his associate, his relative and SSSIL do not have any other material conflict of interest at the time of publication of this research report. 4. The Research Analyst, SSSIL and its associates have not received compensation for investment banking or merchant banking or brokerage services or for any other products or services from the
company(ies) covered in this report, in the past twelve months. 5. The Research Analyst, SSSIL or its associates have not managed or co-managed in the previous twelve months, a private or public offering of securities for the company (ies) covered in this report. 6. SSSIL or its associates have not received compensation or other benefits from the company(ies) covered in this report or from any third party, in connection with the research report. 7. The Research Analyst has not served as an Officer, Director or employee of the company (ies) covered in the Research report. 8. The Research Analyst and SSSIL has not been engaged in market making activity for the company(ies) covered in the Research report. 9. Details SSSIL, Research Analyst and its associates pertaining to the companies covered in the Research report:
Sr. No.
Particulars Yes / No.
1 Whether compensation has been received from the company(ies) covered in the Research report in the past 12 months for investment banking transaction by SSSIL No
2 Whether Research Analyst, SSSIL or its associates or relatives of the Research Analyst affiliates collectively hold more than 1% of the company(ies) covered in the Research report No
3 Whether compensation has been received by SSSIL or its associates from the company(ies) covered in the Research report No
4 SSSIL or its affiliates have managed or co-managed in the previous twelve months a private or public offering of securities for the company(ies) covered in the Research report No
5 Research Analyst, his associate, SSSIL or its associates have received compensation for investment banking or merchant banking or brokerage services or for any other products or services from the company(ies) covered in the Research report, in the last twelve month
No
10. There are no material disciplinary action that been taken by any regulatory authority impacting equity research analysis activities. 11. Systematix Shares & Stocks (I) Limited is in a process of seeking registration under SEBI (Research Analyst) Regulations, 2014.
EXPLANATION TO RATINGS: BUY: TP>15%; ACCUMULATE: 5%<TP<15%; HOLD: -5%<TP<5%; REDUCE: -15%<TP<-5%; SELL: TP<-15%
III. DISCLAIMER The information and opinions contained herein have been compiled or arrived at, based upon information obtained in good faith from sources believed to be reliable. Such information has not been independently verified and no guaranty, representation of warranty, express or implied, is made as to its accuracy completeness or correctness.
This document is for information purposes only. This report is based on information that we consider reliable, but we do not represent that it is accurate or complete, and one should exercise due caution while acting on it. Descriptions of any company or companies or their securities mentioned herein are not complete and this document is not, and should not be construed as an offer or solicitation of an offer to buy or sell any securities or other financial instruments. Past performance is not a guide for future performance, future returns are not guaranteed and a loss of original capital may occur. All opinions, projections and estimates constitute the judgment of the author as on the date of the report and these, plus any other information contained in the report, are subject to change without notice. Prices and availability of financial instruments also are subject to change without notice.
This report is not directed to or intended for display, downloading, printing, reproducing or for distribution to or use by, any person or entity that is a citizen or resident or located in any locality, state, country or other jurisdiction where such distribution, publication, reproduction, availability or use would be contrary to law or regulation or what would subject to SSSIL or its affiliates to any registration or licensing requirement within such jurisdiction. If this report is inadvertently send or has reached any individual in such country, especially, USA, the same may be ignored and brought to the attention of the sender. Neither this document nor any copy of it may be taken or transmitted into the United State (to U.S.Persons), Canada, or Japan or distributed, directly or indirectly, in the United States or Canada or distributed or redistributed in Japan or to any resident thereof. Any unauthorized use, duplication, redistribution or disclosure of this report including, but not limited to, redistribution by electronic mail, posting of the report on a website or page, and/or providing to a third party a link , is prohibited by law and will result in prosecution. The information contained in the Report is intended solely for the recipient and may not be further distributed by the recipient to any third party.
SSSIL generally prohibits its analysts, persons reporting to analysts, and members of their households from maintaining a financial interest in the securities or derivatives of any companies that the analysts cover. Additionally, SSSIL generally prohibits its analysts and persons reporting to analysts from serving as an officer, director, or advisory board member of any companies that the analysts cover. Our salespeople, traders, and other professionals or affiliates may provide oral or written market commentary or trading strategies to our clients that reflect opinions that are contrary to the opinions expressed herein. Our proprietary trading and investing businesses may make investment decisions that are inconsistent with the recommendations expressed herein. The views expressed in this research report reflect the personal views of the analyst(s) about the subject securities or issues, and no part of the compensation of the research analyst(s) was, is, or will be directly or indirectly related to the specific recommendations and views expressed by research analyst(s) in this report. The compensation of the analyst who prepared this document is determined exclusively by SSSIL however, compensation may relate to the revenues of the Systematix Group as a whole, of which investment banking, sales and trading are a part. Research analysts and sales persons of SSSIL may provide important inputs to its affiliated company(ies).
Foreign currencies denominated securities, wherever mentioned, are subject to exchange rate fluctuations, which could have an adverse effect on their value or price, or the income derived from them. In addition, investors in securities such as ADRs, the values of which are influenced by foreign currencies effectively assume currency risk.
MUTUAL FUND INVESTMENTS ARE SUBJECT TO MARKET RISKS, READ ALL SCHEME RELATED DOCUMENTS CAREFULLY. SSSIL, its directors, analysts or employees do not take any responsibility, financial or otherwise, of the losses or the damages sustained due to the investments made or any action taken on basis of this report including but not restricted to fluctuation in the prices of shares and bonds, changes in the currency rates, diminution in the NAVs, reduction in the dividend or income, etc.
SSSIL and its affiliates, officers, directors, and employees subject to the information given in the disclosures may: (a) from time to time, have long or short positions in, and buy or sell the securities thereof, of company (ies) mentioned herein or (b) be engaged in any other transaction involving such securities and earn brokerage or other compensation (financial interest) or act as a market maker in the financial instruments of the company (ies) discussed herein or act as advisor or lender / borrower to such company (ies) or have other potential material conflict of interest with respect to any recommendation and related information and opinions. The views expressed are those of the analyst and the Company may or may not subscribe to the views expressed therein.
SSSIL, its affiliates and any third party involved in, or related to, computing or compiling the information hereby expressly disclaim all warranties of originality, accuracy, completeness, merchantability or fitness for a particular purpose with respect to any of this information. Without limiting any of the foregoing, in no event shall SSSIL, any of its affiliates or any third party involved in, or related to, computing or compiling the information have any liability for any damages of any kind. The Company accepts no liability whatsoever for the actions of third parties. The Report may provide the addresses of, or contain hyperlinks to, websites. Except to the extent to which the Report refers to website material of the Company, the Company has not reviewed the linked site. Accessing such website or following such link through the report or the website of the Company shall be at your own risk and the Company shall have no liability arising out of, or in connection with, any such referenced website
SSSIL shall not be liable for any delay or any other interruption which may occur in presenting the data due to any technical glitch to present the data. In no event shall the SSSIL be liable for any damages, including without limitation, direct or indirect, special, incidental, or consequential damages, losses or expenses arising in connection with the data presented by SSSIL through this presentation.
Neither SSSIL, nor any of its other group companies or associates, shall be responsible for any decisions taken on the basis of this report. Investors are advised to consult their Investment and Tax consultants before taking any investment decisions based on this report. Systematix Shares & Stocks (I) Ltd. CIN: U65993TN1995PLC031285 : SEBI Regn. No.: BSE: INB/F011132736 Member Code: 182 | NSE: INB/F/E231132730 Member Code : 11327 | MCX-SX: INB/F261132733 Member Code: 17560 | PMS SEBI Reg No. : INP000002692 | Depository Participant: IN-DP-CDSL-246-2004 | AMFI: ARN No. 64917 Corporate Office Address: A 603-606 , The Capital, BKC, Bandra (E), Mumbai, India - 400051