Embed Size (px)
Citation preview

INDIACHEM GUJARAT 2009
Federation of Indian Chambers of Commerce and Industry
Mr. R K Bhatia (Head - Chemicals & Pharmaceuticals Division, FICCI)
Federation House, 1 Tansen MargNew Delhi-110 001
Tel. : 91-11-23316540 (D)/23357350 (D)EPBX : 91-11-23738760-70 (Extn.395/474)Fax : 91-11-23320714/233721504
E-mail : [email protected]
Ms. Ranjita C Sood (Asst. Director-Chemicals & Pharmaceuticals Division, FICCI)E-mail : [email protected]
Website : www.ficci.com
Pratik Kadakia (Practice Head - Chemical & Energy)E-mail : [email protected]
Abhishek Nigam E-mail : [email protected]
Nirmal, 18th Floor, Nariman PointMumbai-400021
Tel No. : 91-22-66376789Fax No. : 91-22-66376600Website : www.tsmg.com
Federation of Indian Chambers of Commerce and Industry

Disclaimer: All rights reserved. Includes copyrighted material.The same may not be reproduced, distributed, modified or in any manner communicated to any third party except with the written approval of Tata Strategic Management Group.This report is for information purpose only. While due care has been taken during the compilation of this report to ensure that the information is accurate to the best of Tata Strategic Management Group's knowledge and belief, the content is not to be construed in any manner whatsoever as a substitute for professional advice. Tata Strategic Management Group accepts no responsibility for any loss arising from any action taken or not taken by anyone basis this report.

INDIACHEM GUJARAT 2009
Federation of Indian Chambers of Commerce and Industry
Contents
Executive Summary
Introduction
Industry Reports
Thought Notes
About Tata Strategic Management Group
. . . . . . . . . . . . . . . . . . . . . . . . . . . . . . . . . . . . . . . . . . 1
. . . . . . . . . . . . . . . . . . . . . . . . . . . . . . . . . . . . . . . . . . . . . . . 5
. . . . . . . . . . . . . . . . . . . . . . . . . . . . . . . . . . . . . . . . . . . . 9
Agrochemicals . . . . . . . . . . . . . . . . . . . . . . . . . . . . . . . . . . . . . . . 13
Colourants . . . . . . . . . . . . . . . . . . . . . . . . . . . . . . . . . . . . . . . . . . 25
Other Specialty Chemicals . . . . . . . . . . . . . . . . . . . . . . . . . . . . . . 33
Indian Specialty Chemicals: When will growth return? . . . . . . . . 47
Green Chemistry: Building a greener future. . . . . . . . . . . . . . . . . 55
Outlook for personal care ingredients industry:. . . . . . . . . . . . . . 61
An Indian perspective
v
v
v
v
v
v
About (FICCI)

1INDIACHEM GUJARAT 2009
Federation of Indian Chambers of Commerce and Industry
Executive Summary
T
Agrochemicals
his FICCI report on the Indian Specialty Chemical Industry, prepared by Tata
Strategic Management Group, provides an overview of the Agrochemicals,
Colourants and Other Specialty Chemicals industry segments. The report
highlights the market size and growth, demand-supply scenario, trade overview and
market, technological & regulatory trends, ending with a brief future outlook for each
segment.
The Indian Chemical Industry forms the backbone of the industrial and agricultural
development of India and provides building blocks for downstream industries. The
industry has registered a growth of ~10% p.a. over the last few years and is currently
estimated to be around USD 50 billion. Specialty and knowledge chemicals put
together account for about half of the chemical industry and could grow at a higher
rate of ~14%-15% over the next few years.
Over the years, Gujarat has become one of the most preferred locations for industrial
investment in India. Apart from having sound infrastructure facilities, skilled
manpower, excellent domestic and international connectivity and rich natural
resources, what works for Gujarat is a focus on industrial development in the state.
Gujarat has achieved an annual growth rate of 10.5% p.a. over the past five years and
contributes ~16% to the industrial production of the country. The chemical and
petrochemical industry in Gujarat is the fastest growing sector in the State's economy.
Gujarat is the leading producer of major chemicals in the country accounting for
almost half of national production.
As an allied industry of agriculture, which accounts for about one fifth of India's GDP,
the agrochemicals industry is a significant industry for the Indian economy. The Indian
agrochemicals market grew at a rate of 11% from around USD 1.22 billion in 2008 to
an estimated USD 1.36 billion in 2009. With 125 technical grade manufacturers and
800 formulators, India is the fourth largest producer of agrochemicals in the world
after USA, Japan and China. Indian agrochemical exports have shown an impressive
growth in the past few years driven by excess capacity and availability of cheap labor.
Exports account for almost 50% of the industry revenues. Government focus on
achieving food grain self sufficiency coupled with limited farmland availability is
expected to provide a further impetus to the industry.

2 INDIACHEM GUJARAT 2009
Colourants
Other Specialty Chemicals
The Indian dyes and pigments industry valued at ~ USD 3.7 billion dollars is about 7%
of the global market, supplying various dyes and organic pigments to the export
markets like Europe and United States. The slump in global demand and commodity
nature of several products has resulted in margin pressures for industry participants.
Also, there is a growing need for environment friendly products and processes driven
by regulations such as REACH (Registration, Evaluation and Authorization of Chemical
substances).
An innovative approach is required to help the industry overcome the above
challenges. Greater investments in research & development would help improve the
product portfolio focussing on specialty and high performance colourants. Adoption of
green chemistry practices could help the industry reduce its environmental footprint
and ensure continued access to export markets. This integrated approach will enable
the Indian colourants industry to maintain its growth momentum at over 8% p.a. over
the next few years.
Other specialty chemicals primarily consist of APIs (Active Pharmaceutical Ingredients),
paints & coatings chemicals, construction chemicals, polymer additives, water
treatment chemicals and personal care ingredients. API is the biggest segment valued
at ~USD 5 billion and is also the fastest growing at ~ 21% p.a. over the last 4 years
driven largely by CRAMS (Contract Research & Manufacturing Services). Paints &
coatings chemicals segment with a market size of ~USD 1.2 billion in 2008 is another
large segment. Other key segments include water treatment chemicals valued at ~USD
475 million, personal care ingredients valued at ~USD 300 million, construction
chemicals valued at USD 265 million and polymer additives valued at ~ USD 240
million in 2008. All these segments are expected to grow at rates above the chemical
industry average, based on growth in their respective end use industries and evolving
applications.
A separate section containing recent Thought Notes published by Tata Strategic
Management Group has been included. This section provides key insights on
contemporary trends and issues related to select segments of the Indian chemical
industry in general and specialty chemicals in particular.
Introduction

5INDIACHEM GUJARAT 2009
Federation of Indian Chambers of Commerce and Industry
Federation of Indian Chambers of Commerce and Industry
Indian Chemical Industry
The Indian Chemical Industry forms the backbone of the industrial and agricultural
development of India and provides building blocks for downstream industries. The
chemical industry which includes, as per National Industrial Classification, basic
chemicals and its products, petrochemicals, fertilizers, paints and varnishes, gases,
soaps, perfumes and toiletries and pharmaceuticals is one of the most diversified of all
industrial sectors covering thousands of commercial products. The industry has
registered a growth of ~8-10% over the last few years and is currently estimated to be
around USD 50 billion.
The relevance of the chemical industry to the overall manufacturing sector can be
gauged by the fact that 'Basic chemicals and chemical products' account for 14% in
overall Index of Industrial Production (IIP). On an average the chemicals segment has
grown at a higher rate than the overall manufacturing industry. From the trade flow
perspective, exports of chemicals and petrochemicals together accounted for 10.9% of
country's total exports in the latest fiscal year. The corresponding figure for imports is
only 6.7%.
The Indian Chemicals Industry comprises both small and large-scale units. The fiscal
concessions granted to the small sector in mid-eighties led to the establishment of a
large number of units in the Small Scale Industries (SSI) sector. A large number of
MNCs also participate in the industry. In the Chemical Sector, 100 percent FDI is
permissible. Manufacture of most chemical products including organic/ inorganic,
dyestuffs and pesticides is delicensed.
Introduction
Indian Chemical Industry(USD billion)
Source: Tata Strategic Estimates
28
50
2003 2008

6 INDIACHEM GUJARAT 2009
Specialty Chemicals Overview
Specialty chemicals are defined as a "group of relatively high value, low volume
chemicals known for their end use applications and/ or performance enhancing
properties." In contrast to base or commodity chemicals, specialty chemicals are
recognized for 'what they do' and not 'what they are'. It is a highly knowledge driven
industry with raw materials cost as percentage of net sales much lower than for
commodity chemicals. The critical success factors for the industry include
understanding of customer needs and product/ application development to meet the
same at a favourable price-performance ratio.
The specialty chemicals segment including the knowledge chemicals constitutes about
half of the Indian Chemical industry. The specialty chemicals segment caters to a large
number of end use industries including construction, automotive, polymers, personal
care, water treatment, textile, paints and coatings, etc. The knowledge chemicals
segment caters to the key end use industries of pharmaceuticals, agrochemicals and
bio- technology.
The specialty and knowledge chemicals industry combined has been growing at rates
higher than the overall chemical industry and is expected to continue to grow at 14%-
15% p.a. to reach 40 billion USD by 2012. The growth slowdown, demand contraction
and recovery witnessed over the last year or so have not impacted the long-term
growth prospects of the industry.
Industry Report
12
18
40
2002 2006 2012
Indian Specialty & KnowledgeChemicals Industry(USD million)
11%
xx%
CAGR
14%
Source: Tata Strategic Estimates

9INDIACHEM GUJARAT 2009
Federation of Indian Chambers of Commerce and Industry
Industry Report
Gujarat: A Favoured Investment Destination
Chemical Industry in Gujarat
Over the years, Gujarat has become one of the most preferred locations for industrial
investment in India. Gujarat is spearheading Indian march for global economic
superpower status due to its inherent entrepreneurial spirit. Apart from having sound
infrastructure facilities, skilled manpower, excellent domestic and international
connectivity and rich natural resources, what works for Gujarat is a government that
has focused on industrial development in the state. Besides progressive reforms,
annual industrial summits and seminars are conducted to boost industrial
development in the state. These summits offer a perfect platform for business leaders,
investors, corporations, thought leaders, policy and opinion makers to understand and
explore business opportunities with the state of Gujarat. Gujarat has achieved an
annual growth rate of 10.5% over the past five years and contributes ~16% to the
industrial production of the country. As per the Vibrant Gujarat Summit 2009 report,
MOUs worth over USD 250 billion were signed across various industrial sectors.
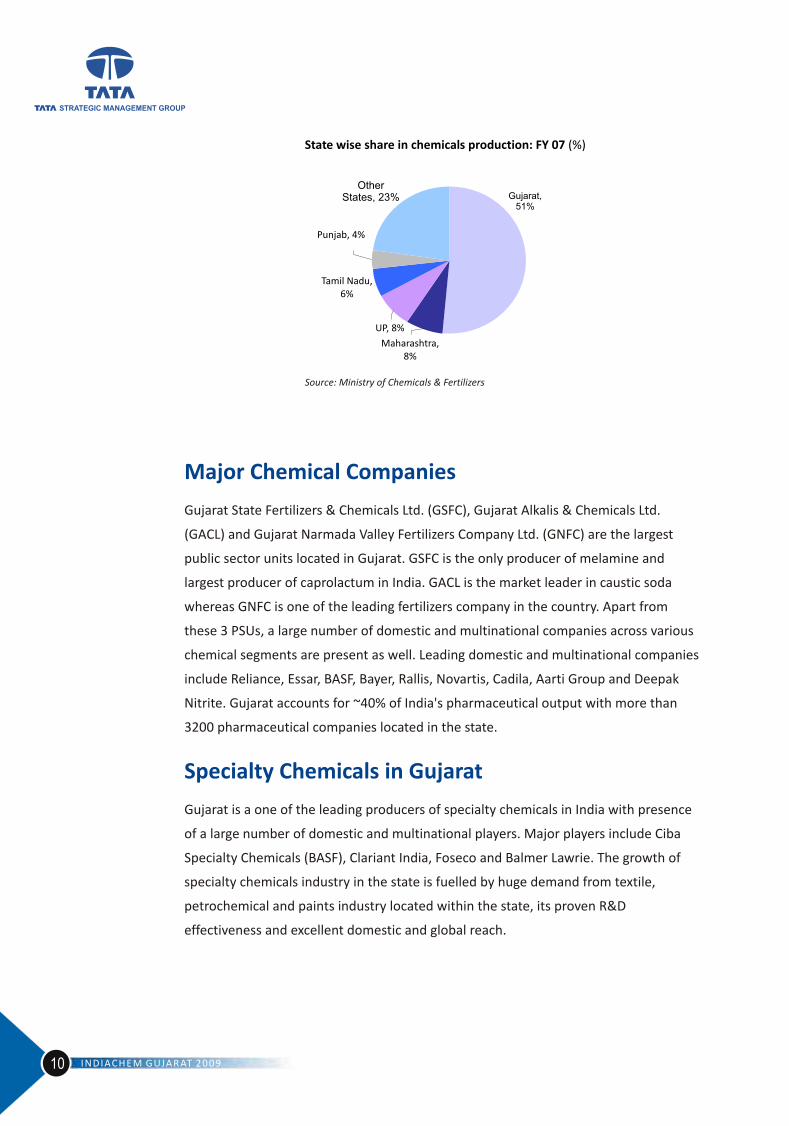
The chemical and petrochemical industry in Gujarat is the fastest growing sector in the
State's economy and Gujarat is the leading producer of major chemicals in the country
with a share of 51% in FY 07. Major chemical industries located in Gujarat include
pharmaceutical, dyestuff, paints, bulk, specialty and fine chemicals. Key characteristics
of the chemical industry in Gujarat include high focus on domestic demand and limited
focus on exports as well as high fragmentation.
100
5040
23
40
Infrastructure Manufacturing InvestmentRegions
UrbanDevelopment
Others
MOUs signed by sector: 2009 (USD billion)
Source: Vibrant Gujarat
Chemicals & Petrochemicals:~ USD 9 billion
Oil & Gas, Power:~ USD 73 billion

9INDIACHEM GUJARAT 2009
Federation of Indian Chambers of Commerce and Industry
Industry Report
Gujarat: A Favoured Investment Destination
Chemical Industry in Gujarat
Over the years, Gujarat has become one of the most preferred locations for industrial
investment in India. Gujarat is spearheading Indian march for global economic
superpower status due to its inherent entrepreneurial spirit. Apart from having sound
infrastructure facilities, skilled manpower, excellent domestic and international
connectivity and rich natural resources, what works for Gujarat is a government that
has focused on industrial development in the state. Besides progressive reforms,
annual industrial summits and seminars are conducted to boost industrial
development in the state. These summits offer a perfect platform for business leaders,
investors, corporations, thought leaders, policy and opinion makers to understand and
explore business opportunities with the state of Gujarat. Gujarat has achieved an
annual growth rate of 10.5% over the past five years and contributes ~16% to the
industrial production of the country. As per the Vibrant Gujarat Summit 2009 report,
MOUs worth over USD 250 billion were signed across various industrial sectors.
The chemical and petrochemical industry in Gujarat is the fastest growing sector in the
State's economy and Gujarat is the leading producer of major chemicals in the country
with a share of 51% in FY 07. Major chemical industries located in Gujarat include
pharmaceutical, dyestuff, paints, bulk, specialty and fine chemicals. Key characteristics
of the chemical industry in Gujarat include high focus on domestic demand and limited
focus on exports as well as high fragmentation.
100
5040
23
40
Infrastructure Manufacturing InvestmentRegions
UrbanDevelopment
Others
MOUs signed by sector: 2009 (USD billion)
Source: Vibrant Gujarat
Chemicals & Petrochemicals:~ USD 9 billion
Oil & Gas, Power:~ USD 73 billion
10 INDIACHEM GUJARAT 2009
Major Chemical Companies
Specialty Chemicals in Gujarat
Gujarat State Fertilizers & Chemicals Ltd. (GSFC), Gujarat Alkalis & Chemicals Ltd.
(GACL) and Gujarat Narmada Valley Fertilizers Company Ltd. (GNFC) are the largest
public sector units located in Gujarat. GSFC is the only producer of melamine and
largest producer of caprolactum in India. GACL is the market leader in caustic soda
whereas GNFC is one of the leading fertilizers company in the country. Apart from
these 3 PSUs, a large number of domestic and multinational companies across various
chemical segments are present as well. Leading domestic and multinational companies
include Reliance, Essar, BASF, Bayer, Rallis, Novartis, Cadila, Aarti Group and Deepak
Nitrite. Gujarat accounts for ~40% of India's pharmaceutical output with more than
3200 pharmaceutical companies located in the state.
Gujarat is a one of the leading producers of specialty chemicals in India with presence
of a large number of domestic and multinational players. Major players include Ciba
Specialty Chemicals (BASF), Clariant India, Foseco and Balmer Lawrie. The growth of
specialty chemicals industry in the state is fuelled by huge demand from textile,
petrochemical and paints industry located within the state, its proven R&D
effectiveness and excellent domestic and global reach.
Punjab, 4%
Tamil Nadu, 6%
OtherStates, 23%
Maharashtra,8%
Gujarat,51%
UP, 8%
State wise share in chemicals production: FY 07 (%)
Source: Ministry of Chemicals & Fertilizers
Agrochemicals

13INDIACHEM GUJARAT 2009
Federation of Indian Chambers of Commerce and Industry
Agrochemicals
Introduction
Global Agrochemicals Industry
Indian Agrochemicals Industry
Agrochemicals or pesticides are chemical substances used to ward off, kill or control
pests, unwanted plants or animals that may harm or damage the crops. Agrochemicals
can be classified into the following key segments:
1. Insecticides
2. Herbicides/ Weedicides
3. Fungicides
4. Bio-pesticides
5. Others (Nematocides, Rodenticides etc.)
Global Agrochemical industry grew at a CAGR of 9.3% from 2003 to reach USD 41.7
billion in 2008.
North America, European Union and Asia Pacific together consume over 75% of the
world's agrochemicals. Globally, herbicides are the largest consumed agrochemical
with a share of 45% followed by insecticides at 33%.
Industry Overview
As an allied industry of agriculture, which accounts for 18.5 percent of India's GDP, the
agrochemicals industry is a significant industry for the Indian economy. The Indian
agrochemicals market grew at a rate of 11% from USD 1.22 billion in 2008 to an
estimated USD 1.36 billion in 2009.
25.8 25.2 26.730.7 31.2 30.4
33.4
41.7
-2.4
6.2
15
1.5-2.5
9.7
25
2001 2002 2003 2004 2005 2006 2007 2008
Market Size % yoy growth
Source : Industry Report
Market Size (USD Bn)
25.8 25.2 26.730.7 31.2 30.4
33.4
41.7
-2.4
6.2
15
1.5-2.5
9.7
25
2001 2002 2003 2004 2005 2006 2007 2008
Market Size % yoy growth
Source : Industry Report
Market Size (USD Bn)
15INDIACHEM GUJARAT 2009
Federation of Indian Chambers of Commerce and Industry
14 INDIACHEM GUJARAT 2009
India is the fourth largest producer of agrochemicals in the world after the United
States, Japan and China. On the other hand India's agrochemicals consumption is one
of the lowest in the world with per hectare consumption of just 0.38 kg compared to
US (4.5 Kg/hectare) and Japan (11 Kg/hectare).
In India, there are about 125 technical grade manufacturers (10 multinationals), 800
formulators, over 145,000 distributors. 60 technical grade pesticides are being
manufactured indigenously.
Technical grade manufacturers sell high purity chemicals in bulk (generally in drums of
200-250 Kgs) to formulators. Formulators, in turn, prepare formulations by adding
inert carriers, solvents, surface active agents, deodorants etc. These formulations are
packed for retail sale and bought by the farmers.
Considering the high dependence upon monsoons, the market for agrochemicals is
expected to grow at a conservative growth rate of 7.5% to reach ~ USD 1.7 billion by
2012. Key market drivers include:
1. Growth in demand for food grains: Increasing population and high emphasis on
achieving food grain self-sufficiency as highlighted in the 2009-10 budget, is
expected to drive growth.
2. Limited farmland availability: Exports are a significant fraction of the Indian
agrochemical output. Available arable land per capita has been reducing globally
and is expected to reduce further.
Indian agriculture has the daunting task of feeding and clothing 16 percent of the
world's population from less than 2 percent of the total landmass. With already 190
million hectares of gross cultivated area, the scope for bringing new areas under
cultivation is severely limited. Thus the pressure is to increase yield per hectare by
increasing usage of agrochemicals
Industry Structure
Growth Forecast & Drivers
3. Growth of horticulture & floriculture: While the Indian floriculture industry has
grown by 50% in last 3 years, Government of India has launched a national
horticulture mission to double production by 2012. Flourishing horticulture &
floriculture industries will need increasing amounts of agrochemicals, especially
fungicides.
Industry Structure
RawMaterialSupplier
TechnicalGrade
Manufacturer
Distributor/Retailer
EndUser
Formulator
0.15
0.27
1998 2015E
Source: Yara Fertilizer Handbook, PotashCorp
World- Available arable land per capita (Hectare)
Fungicides,21%
Herbicides,18%
Biopesticides &Ohers, 8%
Insecticides,53%
Product Shares 2008 (%)
Source: Industry Report, Tata Strategic Estimates
4. Increasing awareness: Government of India estimates suggest that the total value
of crops lost due to non-use of pesticides is around USD 17 billion every year.
Companies are increasing their marketing efforts in order to train farmers about
the right use of agrochemicals in terms of quantity to be used, the right application
methodology and which chemicals to use for which kind of pest problems. With
increased awareness, the use of agrochemicals will also increase.
Key Segments
146
205
300
2002 2007 2012E
Source: Horticulture Commissioner, National Horticulture Mission
Horticultural Production, India (MnTonnes)
C AGR : 7. 5%:

17INDIACHEM GUJARAT 2009
Federation of Indian Chambers of Commerce and Industry
16 INDIACHEM GUJARAT 2009
Insecticides: Insecticides are used to ward off or kill insects. Consumption of
insecticides for cotton has come down to 50% from 63% of total volume after
introduction of BT cotton.
Fungicides: Fungicides are used to control disease attacks on crops. The growing
horticulture market in India owing to the government support has given a boost to
fungicide usage. The market share of fungicides has increased from 17% in 2005 to
21% in 2008.
Herbicides: Herbicides are the fastest growing segment of agrochemicals. Their main
competition is cheap labor which is employed to manually pull out weeds. Sales are
seasonal, owing to the fact that weeds flourish in damp, warm weather and die in cold
spells.
Supply Overview and Trade Flow
The Indian agrochemicals market is characterized by low capacity utilization. The
industry suffers from high inventory (owing to seasonal & irregular demand on
account of monsoons) and long credit periods to farmers, thus making operations
'working capital' intensive.
Stored produceZinc Phosphide
Phosphide, AluminiumOthers
Rice, Tobacco
Maize,Spinosyns, neem-based Bio-pesticides
Rice, Wheat Glyphosate, Isoproturon, 2,4-DHerbicides
Fruits, Vegetables,Rice
MancozebZiram
, Copper Oxychloride,Fungicides
Cotton, Rice Acephate, Cypermethrin
Monocrotophos,Insecticides
Main ApplicationsMajor ProductsSegment
Bio-pesticides: Bio-pesticides are pesticides derived from natural materials like
animals, plants, bacteria and certain minerals. For instance, neem has pesticidal
properties and is used for production of certain bio-pesticides. Currently a small
segment, bio-pesticides market is expected to grow in the future owing to government
support and increasing awareness about use of non-toxic, environment friendly
pesticides.
Others: Plant growth regulators, Nematocides, Rodenticides, Fumigants etc.
Rodenticides and plant growth regulators are the stars of this segment.
Change in Share (% of total)
10%
21%
10%
18%
8%
80%
53%
2000 2007
Insecticides HerbicidesFungicides Biopesticides & others
Source: Industry Report, Tata Strategic Estimates
Installed Capacity and production
148 145 146
82 85 83
2005 2006 2007
Capacity Production
Source: Department of Chemicals, Government of India
The total installed capacity in 2007 was 146,000 MT and total production was 83,430
MT leading to a low capacity utilization of 57%.
The Indian export market has grown from ~ USD 180 million in 1999 to ~ USD 600
million in 2008 with a CAGR of ~ 14% driven by underutilized capacity and shut down
of production capacity in China before Olympics 2008. Key export destinations are
USA, U.K., Russia, France, Netherlands, Belgium, Spain, South Africa, Bangladesh,
Malaysia and Singapore. Imports in the agrochemical sector are around 2.5% in
volume. Imports mainly consist of new generation pesticides and patented molecules.
82.2 84.7 83.4
2.2 2.2 1.8
24.2
33.025.0
60.253.9
60.3
2005 2006 2007
Production Import Export Consumption
Import-Export Overview
(‘000 MT)
Note: Consumption = Production + Import-
Export
Source: Department of Chemicals, Government of India

18 INDIACHEM GUJARAT 2009 19INDIACHEM GUJARAT 2009
Federation of Indian Chambers of Commerce and Industry
Competitive Landscape
With 800 formulators, the Indian agrochemicals market is highly fragmented in nature.
The competition is fierce with large number of organized sector players and a
significant spurious pesticides market. Market entry barriers are low with low start-up
costs. The market has been witnessing mergers and acquisitions with large players
buying out small manufacturers.
Market Trends
Technology Trends
The market is gradually moving towards environmentally safe options. This may lead
to increasing R&D in Biopesticides segment. The Government of India is promoting
research on the use of alternative and safe pesticides using neem seeds. The
Department of Chemicals has initiated a nationwide programme for “Development
and production of neem products as Environment Friendly Pesticides” with financial
assistance from United Nations Development Programme (UNDP).
Large market players are focusing on brand building by conducting awareness camps
for farmers and providing complete solutions. Strategic alliances with other players,
backward integration and increased marketing efforts are the key trends in the
agrochemicals industry.
On the technology front, increased R&D is expected for development of new
molecules and low dosage, high potency molecules.
New segments like Seed treatment chemicals, Bio-pesticides and Semiochemicals will
see technological advancements.
Brief Profile of key companies
21 manufacturing sites – 9 in India with licensed capacity of 91,000 onnes for pesticides and 41,000 Tonnes for pesticide intermediates
Production Capacity
Integration of Advanta with UPL to realize acquisition synergies
Future Plans
Acquisition of Advanta BV, Netherlands (2006), Cerexagri, France (2007)
Key Alliances
Key Brands
Sales (FY 2009)
Market Segments
Player
Insecticide –Viraat
Herbicide –Devrinol, Orrja
Fungicide –Saafe, Zeemil
Rs. 2100 Crores (Crop protection)
Crop Protection, Industrial & Specialty Chemicals, Seeds
United Phosphorous Ltd. (UPL)
Production facilities at Thane, Himatnagarand Ankleshwar with combined capacity of 6300 Tons for Active ingredients and 7650 Tons for powder formulations and 10,000 KL for liquid formulations
Production Capacity
R&D focus on environmentally safe products
Fungicides - Fluopyram, Bixafen and Isotianilscheduled for launch in 2010 and 2011, three other candidates at an advanced stage of development
Future Plans
R&D alliance with GVK Biosciences for active ingredients
Key Alliances
Key Brands
Sales (FY 2009)
Market Segments
Player
Fungicide –Antracol, Folicur
Insecticide –Confidor, Calypso
Herbicide –Atlantis, Topstar
Rs. 1482 Crores
Crop Protection, Non-agricultural pest management, Plant & seeds biotechnology
Bayer CropScience Ltd.
Factories at Akola, Ankleshwar, Lote, Turbhe, Patancheru with production capacity of 10,000 MTPA for technical grades and 30,000 Tons/Litres for formulations
Production Capacity
Eight new molecules under R&D
Plans to become Global supplier for Active Ingredients (AI). Target of cumulative sales of Rs. 1000 Crores from AI in the next 5 years. New AI plant in Dahej to be ready by June 2010
Future Plans
Marketing alliances with FMC, Dupont, Syngenta, Bayer, Nihon Nohayaku
Key Alliances
Key Brands
Sales (FY 2009)
Market Segments
Player
Fungicide –Contaf, Contaf Plus, Master
Insecticide –Rogor, Daksh, Tata Mida
Herbicide –Fateh, Tata Metri
Domestic: Rs. 541.7 Crores,
Export: Rs 295 Crores
Pesticides, Plant Nutrients, Seeds, Leather Chemicals
Rallis India Ltd.
20 INDIACHEM GUJARAT 2009 21INDIACHEM GUJARAT 2009
Federation of Indian Chambers of Commerce and Industry
Regulatory Trends
Outlook
Key Opportunities
The Indian crop protection industry is regulated by the Insecticide Act, 1968 and
Insecticide Rules, 1971. While the Insecticide Act focuses on regulating manufacture,
sale, distribution, use and import of pesticides, the Insecticide Rules deal with
registration procedure.
The Indian Patent Act 2005, brought agrochemical products under patent protection,
thus making the Indian market attractive for International companies with regards to
intellectual property protection. It also provided Indian companies an opportunity to
explore new molecule development options and make R&D a strategic component.
However, patent registration does not ensure monopoly in the Indian market for more
than 3 years owing to lax regulatory control and counterfeit chemical manufacturers.
The future prospects of the agrochemicals industry look promising in the near term
on account of the increasing need to protect farm produce from pests, increasing
awareness amongst farmers and India's export competency. Further the growing
varieties of various pests, diseases, and their growing resistance to various pesticides
will keep the demand for new products going. The agrochemical space offers enough
scope for growth for both innovators as well as generic players.
1. Scope for increase in usage: Since just about 35-40% of the total farmland is under
crop protection, there is a significant unserved market to tap into. By conducting
special training programmes for farmers regarding the need to use agrochemicals,
Indian companies can hope to increase pesticide consumption.
2. Excess capacity: The excess production capacity is a perfect opportunity to
increase exports by utilizing India's low cost producer status.
3. Patent expiry: Agrochemicals are protected by patents to encourage innovation.
Between 2009 and 2014 many molecules are likely to go off patent throwing the
market open for generic players. The estimated total likely viable opportunity
through patent expiry is over USD 3 billion.
Key Challenges
1. R&D: R&D to develop a new agrochemical molecule takes an average of 9 years
and USD 180 million. Indian companies will find it difficult to build such R&D
capabilities and still compete on cost and maintain margins.
2. GM Seed threat: Genetically modified seeds possess self-immunity towards
natural adversaries. This can be a potential threat to the business of agrochemicals.
Best example of such an introduction in the Indian market is "BT Cotton", which
resulted in a decline in the consumption of agrochemicals by cotton crop. However,
there have been few reports of BT Cotton being unable to develop immunity
towards new type of pests.
3. Need for efficient distribution system: The number of end users is large and
widespread. High penetration and effective distribution is essential to ensure
product availability. Also, generally the retailer is the only point of contact with
the end user and hence has the most influence on the purchase decision.
However, the retailer in not likely to possess the technological knowledge about
the chemicals and will be unable to assist the farmer in identifying the problem
and offer the right solution. Lately, Agrochemical companies have been directly
dealing with retailers by cutting the distributor from the value chain thereby
reducing distribution costs and offering competitive prices to farmers. Direct
contact with retailers also enables the companies to train them in the correct use
and application of the products.
4. Government support for safer alternatives (IPM) & rising demand for organic
farming: Government is aggressively promoting Integrated Pest Management
(IPM) and zero budget farming. National Center for Integrated Pest Management
has been working since 1988 with the mission to promote adoption of IPM
Technologies to reduce the environmental and public health hazards due to
excessive reliance on chemical pesticides. NGOs are educating farmers about the
advantages of bio-pesticides. With increasing demand for organic food, farmers in
certain states like Karnataka have reduced chemical usage and have adopted
organic farming. Agrochemical companies will have to tackle the rising
environmental awareness and concern about the negative impacts of pesticide
usage.
5. Excise Duty: While seeds and fertilizers are exempt from excise duty, pesticides
attract excise duty at 8%. The PMFAI had requested a reduction in excise duty to
4% in the 2009 budget but failed to get the same.

22 INDIACHEM GUJARAT 2009
6. Counterfeit Products: Presence of a flourishing counterfeit market with spurious
products eats into the margins of the organized sector. The spurious pesticides
market size in India is estimated to be USD 233 million in 2009. There is no
provision in the Indian Insecticide Act to deal with counterfeit pesticides.
Threats like genetically modified seeds, Integrated Pest Management, organic farming
etc. can be turned into opportunities if the industry re-orients itself such that its
product offering includes a broader range of agri-inputs instead of only agrochemicals.

INDIACHEM GUJARAT 2009 25INDIACHEM GUJARAT 2009
Federation of Indian Chambers of Commerce and Industry
Colourants
Introduction
The colourant industry is a major component of the global chemical industry. A
colourant has the property of causing a change in the colour of the substrate.
Colourants(USD 28 Bn)
Dyes(USD 7.7 Bn)
Pigments(USD 20.3 Bn)
Organic(USD 5.6 Bn)
Inorganic(USD 14.7 Bn)
Global markets for dyes & pigments
Source: Chemical Weekly
The global colourants market is roughly estimated at ~ USD 28 billion excluding an
additional USD 7 billion of dye intermediates.
According to the US International Trade Commission, dyes are broadly classified based
on their usage/ technology as shown in the chart below.
Reactive,26%
Disperse,21%
Direct, 11%
Vat, 11%
Others,31%
Dyes by usage (% volume)
Source: Industry reports
Pigments are broadly classified as organic and inorganic. The global pigment industry is
estimated at ~7.4 million tons including white pigment such as Titanium Dioxide (TiO2)
and carbon black which is used as a black colourant.

26 INDIACHEM GUJARAT 2009 27INDIACHEM GUJARAT 2009
Federation of Indian Chambers of Commerce and Industry
Pigments (7.4)
Titanium Dioxide(4.7)
Carbon Black(0.8)
Iron Oxide (1.3)
Other Inorganic(0.2)
Colour Organic & Special Effect (0.4)
Azo-Red(0.08)
Diarylide-Yellow(0.08)
Phthalocyanine-Blue,Green (0.08)
Performance & Special Effect(0.11)
HPP (0.05)
Metal Effect (0.04)
Pearlescent(0.02)
Global pigments market(Mn tons)
Source: Chemical Weekly
Colour & Special Effect(1.9)
Due to a large demand base in Asian countries, availability of cheaper manpower and
less stringent environmental norms there has been a gradual shift in production, with
Asia now accounting for more than 40% of the global supply.
Regional production of dyestuffs(% volume)
Asia, 42%
US, 24%
Others, 12%
Europe, 22%
Source: Industry reports
Industry overview
India accounts for ~7% of the global share of the dyestuffs industry and produces
~150,000 tons. The Indian dyestuff industry is highly fragmented and characterised by
a large number of players in the unorganized sector. Around 1000 units fall under the
small scale industry category and only about 50 are large organized units. These units
are mainly present in the western states of Gujarat and Maharashtra, with Gujarat
accounting for almost 80% of capacity.
In India the dyes industry supplies the majority of its production, almost 80%, to the
textile industry. The balance is consumed by the paper and leather industry. Also,
these dyestuffs are exported to Europe, South East Asia and Taiwan to cater to the
textile industries in these countries.
Printing inks and coatings account for greater than 70% of consumption of pigments.
Titanium dioxide is a major raw material used in the manufacture of paints. The
domestic production of TiO2 in India is ~60,000 tons. The requirement of pigments for
the growing domestic ink and coating market is estimated at greater than USD 20
million each and the requirements of these sectors are helping to drive the demand
for pigments.
Pigments by end use (% volume)
Plastics,10%
Others, 9%
Inks, 47%Textiles,10%
Coatings,24%
Source: Industry reports
Inks, 47%
There are a wide variety of dyestuffs being manufactured in the country. However,
almost 80% of these are commodities and face intense pricing pressures reducing the
margins of the industry.
The per-capita consumption of dyestuffs at ~50 gms is much lower than the world
average of over 400 gms demonstrating a largely untapped domestic market. India has
largely been an exporting country and has emerged as a global supplier of reactive,
acid, vat and direct dyes accounting for ~10% of world trade.
India has grown significantly as a producer and exporter of organic pigments,
particularly phthalocyanine blue, green and some high performance pigments. India is
amongst the largest sources of coloured organic pigments, competing with China for a
dominant share of the export market.
Within India, the major players in the pigments industry are Sudarshan Chemicals and
Clariant India while in the dyestuff industry companies such as are Atul, Clariant India,
Dystar, Ciba (BASF) and IDI are large players present in the organized sector.
Fiscal policies and excise concessions led to a high level of fragmentation in the Indian
dyestuffs market. However, a gradual reduction in the excise duties has resulted in a
more balanced pricing differential between the organized and unorganized sectors.
The organised sector, with a better product range, technology and marketing reach,
Supply Overview

28 INDIACHEM GUJARAT 2009 29INDIACHEM GUJARAT 2009
Federation of Indian Chambers of Commerce and Industry
was able to increase its market share. Further bans on certain dyestuffs from the
European markets and stricter local pollution norms have forced many in the
unorganized sector to exit resulting in increase in the share of the organized players.
Total Indian capacity for organic pigments in India is estimated at about 50,000 tpa.
Major producers include Meghmani Organics, Clariant India, Sudarshan Chemicals,
Pidilite Industries, Heubach Colours, e.t.c.
There are also niche markets in India for special effect pigments such as metallic and
pearlescent. These pigments are usually imported into the Indian market, with
Sudarshan chemicals being the only domestic manufacturer. Though the volume for
these pigments would be very small as compared to other pigment segments, they
usually command a premium for the design appeal that they provide to the final
product such as automotive coatings and packaging goods.
There has been a strong growth in the dyestuff industry during the last decade. Export
opportunities created by the closure of several units in countries like the USA and
Europe due to enforcement of strict pollution control norms, has resulted in a spurt of
capacity building in India. However, the financial crisis in 2008 has resulted in a
demand slump, worldwide over-capacity and has resulted in further margin pressures
on the dyestuff industry.
As per global reports, the world demand for dyes and organic pigments is forecast to
increase 3.9 percent per year to USD16.2 billion in 2013. In volume terms, demand will
grow 3.5 percent annually to 2.3 million metric tons. This growth will have a direct
bearing on the domestic production of dyes and organic pigments since a large
proportion of production is exported.
Growth Forecast & Drivers
India colourants market (USD Bn)
3.7
5.1
2008-09 2012-13P
~8%
Source: Industry reports, Tata Strategic analysis
Due to a greater use of polyester and cotton-based fabrics, there has been a shift
towards reactive dyes, used in cotton-based fabrics, and disperse dyes, used in
polyester. The demand for reactive and disperse dyes is expected to grow fastest due
to this continued demand.
The textile industry will remain the largest consumer of dyestuffs; however growth will
be driven by markets such as printing inks, paints and plastics. These segments will
also increase the consumption of high performance pigments helping improve
profitability. However, the gains will be restrained due to the commodity nature of the
products and intense competition. At around 8% growth, the Indian colourants
industry (including pigments, dyes and dye intermediates) is likely to reach ~ USD 5.1
billion by 2012-13 and is expected to capture 10-12% of the global market.
Industry Trends
Regulatory
• Stricter domestic environmental laws
• Compliance to REACH regulations
Market
• Global overcapacity
• Customer requirements of environment friendly and high performance products
Technology
• Colour solution approach to counter commoditization
Source: Tata Strategic analysis
Trends in dyes and pigments industry
Market Trends
Regulatory Trends
The global capacity of dyestuffs has exceeded the demand resulting in an oversupply
scenario. Due to the lack of export demand, the prices of the colourants had dropped
by roughly 20%. It is expected that consumer preference for environmentally friendly
products and high performance dyes and organic pigments will help improve overall
value of the market.
Local environmental regulations in Europe and United States coupled with the low cost
of manufacturing had resulted in the initial growth of the Indian dyestuff industry.
Regulations such as REACH (Registration, Evaluation, Authorization and Restriction of
Chemical substances), which have been designed with the objective of protecting

30 INDIACHEM GUJARAT 2009
human health and environment from the hazards of chemicals, require that apparel
and apparel chemical exporters to EU provide their buyers with information regarding
the substance used in manufacturing. The processors and manufacturers have to
undergo a process of registration, evaluation and authorization under this legislation.
The suppliers have to ensure that their products are free of 15 SVHCs (Substances of
very high concern) as given in the REACH authorization list.
Exporters who are not able to provide such information are losing their market share
and this is resulting in the closure of small establishments and helping increase the
share of the organized players.
Since majority of dyestuffs are commodities there is not much product differentiation
and duplication of products is easy. To counter the same, global manufacturers are
investing in Research and Development to improve the specialty end of their portfolio.
There is also a trend towards providing colour solutions rather than just a colourant.
Collaborations with equipment manufacturers are being undertaken to provide
integrated solutions to customers.
The Indian dyestuff industry is facing challenges due to reduced export demand
growth and decreasing profitability. The industry needs to place more emphasis on
innovation. Greater focus on research & development is required to improve the
product portfolio and build better quality and high performance colourants. There is a
need to adopt green chemistry practices to improve the environment friendliness of
the products and the processes, thereby ensuring access to export markets and
compliance to local regulations.
Such a holistic approach will ensure that the Indian dyes and pigments industry is able
to overcome the challenges and convert them to opportunities, resulting in profitable
growth.
Technological Trends
Future Outlook
Other Specialty Chemicals

01 33INDIACHEM GUJARAT 2009
Federation of Indian Chambers of Commerce and Industry
Other Specialty Chemicals
Introduction
Market Overview
Other specialty chemicals serve a wide variety of end use industries ranging from
pharmaceutical to construction. These chemicals can be categorized into the following
key segments:
1. APIs (Active Pharmaceutical Ingredients)
2. Paints & Coatings Chemicals
3. Water Treatment Chemicals
4. Personal Care Ingredients
5. Construction Chemicals
6. Polymer Additives
APIs are the key ingredients for making a drug. The API market in India stands at ~ USD
5 billion in 2008. This segment has achieved a CAGR of 21% in the period from 2004-
08. Approximately 90% of the total APIs manufactured in India are exported to Europe,
USA and Japan. APIs account for approximately 55% of the CRAMS market in India, the
rest being accounted by dosages and intermediates.
APIs (Active Pharmaceutical Ingredients)
API Exports from India: 2008 (% of total)
Semi regulated
54%
Generics39%
Innovators7%
Regulated46%
Total: 4.3 billion
Source: Tata Strategic Estimates
Anti diabetic, anti inflammatory and anti infective drugs make up bulk of the Indian API
exports. Growing segments include lipid regulators, ace inhibitors and anti depressants.

34 INDIACHEM GUJARAT 2009 35INDIACHEM GUJARAT 2009
Federation of Indian Chambers of Commerce and Industry
Industry Overview
l
l
Growth Forecast & Drivers
l
l
l
API manufacturing companies can be categorized into 2 broad segments:
Generic drug companies with predominant focus on export of APIs and bulk drugs
CRAMS specialized companies
Both the segments have established players but contract manufacturers enjoy better
margins than generic API exporters. Major players in the contract manufacturing
segment include Dishman, Divis, Jubilant, NPIL and Shasun. Lupin, Aurbindo Pharma,
Ranbaxy, Dr. Reddy's and Matrix Laboratories are the major generic API exporters.
Indian players have used acquisitions to build capabilities in the high value segments.
Nicholas Pharma's acquisition of UK based Avecia, Dishman's acquisition of
Switzerland based Carbogen Amcis and Jubilant's acquisition of US based Hollister
Stier are some of the noteworthy acquisitions made by domestic companies in the
recent past.
The market for APIs is expected to grow at a CAGR of 22% to reach ~ USD 11 billion in
2012. Key growth drivers include:
Margin pressures of global players leading to increased outsourcing and focus on
contract manufacturing
Supply base of APIs shifting from Europe to emerging countries like India and China
due to low cost advantage
Export to generic players constitute the biggest segment but export to Innovators
is expected to grow at a faster rate
Market, Technology and Regulatory Trends
Future Outlook
Market Overview
l
l
l
Buyer power is high and supplier power is limited due to buyer's focus on lowest
possible costs and more than 1000 Indian companies competing in manufacturing.
This is further augmented by huge competition from Chinese manufacturers.
Insufficient barriers to entry exist in generics whereas barriers to entry are tough in
innovator drugs with adherence to strict and costly international certification norms,
strong chemistry & process knowledge and presence of numerous IPR norms. However
increasing number of Indian companies are focusing on IP creation and protection and
setting up world class manufacturing facilities to meet innovators demand. Divestment
by European companies has resulted in significant number of acquisitions by Indian
companies in the recent past. Lower market valuations together with exchange rate
fluctuations pose considerable threat to Indian API manufacturers.
The market for API manufacturing in India will grow tremendously due to high demand
from US and European drug makers. Though competition from Chinese companies is
huge, Indian companies have an edge due to stricter confirmation to manufacturing
norms. Lack of time adherence and absence of service oriented business model are
some of the weaknesses that companies have to overcome to generate better
margins. Efficient and experienced R&D and process development team will help to
overcome the above.
In 2008, the Indian paints and varnishes industry was worth ~ USD 3 billion with the
organized sector accounting for 65-70% of the market. The top three players, Asian
paints, Kansai Nerolac and Berger paints, have a combined market share of ~ 70%. The
market can be divided into two broad segments, decorative paints which account for
75% of the market and industrial paints which make up the remaining market.
The paints and coatings chemicals market achieved a 14% CAGR in the period from
2004-08 to reach USD 1.2 billion in 2008. Chemicals used are primarily of three types:
Binders like epoxy and polyurethane which determine properties like durability,
adhesion and finish
Pigments which offer desired color to the paint
Other additives like emulsifiers, mold releasing agents and stabilizers which
enhance paint quality
Paints & Coatings Chemicals
Market size (USD billion)
2.3
5
11
2004 2008 2012
21%
xx%
22%
Source: Tata Strategic Estimates
CAGR

36 INDIACHEM GUJARAT 2009 37INDIACHEM GUJARAT 2009
Federation of Indian Chambers of Commerce and Industry
Industry Overview
l
l
The industry is highly competitive with significant participation from unorganized
players. Major organized players include Rhodia Chemicals India Ltd., Rohm & Haas
India Pvt. Ltd., Ciba India Ltd., E.I. DuPont India Pvt. Ltd., Bayer Material Science Pvt.
Ltd. and BASF Coatings India Ltd.
Growth Forecast & Drivers
The market for paints and coatings additives is expected to grow at a CAGR of 12% to
reach ~ USD 1.9 billion in 2012. Key growth drivers include:
Low per capita paint consumption of about 0.5 kg p.a. when compared to 22 kg
p.a. in developed countries
Increasing demand for paints due to growth in the automotive and construction
sector
Market size (USD billion)
700
1,200
1,900
2004 2008 2012
14%
33%
12%
Source: Tata Strategic Estimates
CAGR
Market, Technology and Regulatory Trends
The market is extremely competitive with the presence of a large number of domestic
and multinational players. Low margins can be increased through educating the
unorganized paint manufacturers on the quality and quantity of chemicals to be used
in their formulations. Cheaper imports from China are also proving a threat to
domestic manufacturers.
The recent Government ban on use of lead and cadmium compounds is increasingly
impacting the industry and these compounds are being replaced with suitable
alternatives.
Future Outlook
Market Overview
The market is expected to grow towards environment friendly chemicals due to
imposition of stricter norms as per international standards. Players who are able to
modify their product portfolio accordingly shall have a competitive edge over others.
Water treatment chemicals are used for a wide range of industrial and in process
applications such as reducing effluent toxicity, control Biological Oxygen Demand &
Chemical Oxygen Demand and disinfecting water for potable purpose. The Indian
water treatment chemicals market achieved an 8% CAGR in the period from 2004-08
to reach ~ USD 475 million in 2008. Coagulants and flocculants form the largest
segment with ~ 40% market share followed by biocides and disinfectants with ~ 17%
market share. The customer base is widespread across diverse industries ranging from
large power plants, refineries and fertilizer factories to pharmaceuticals, food and
beverages, electronic and automobile companies.
Water Treatment Chemicals
Others, 30%
pHAdjusters,
5%
Biocides &Disinfectants
18%
Coagulants&
Flocculants,40%
DefoamingAgents, 7%
Product share: 2008 (% of total)
Total:
Source: Industry Report, Tata Strategic Estimates
Total: USD 475 million
Industry Overview
The Indian water treatment chemicals market is highly competitive, and participants
include private companies, MNCs, as well as joint ventures. Around 60 percent of the
market is dominated by the organized sector, largely multinationals and large-scale
domestic companies like Nalco Chemicals India Ltd., Thermax Limited and Ion
Exchange (India) Ltd. These companies have a diverse product portfolio and a strong
distribution network to cater to the Indian market.

38 INDIACHEM GUJARAT 2009 39INDIACHEM GUJARAT 2009
Federation of Indian Chambers of Commerce and Industry
Growth Forecast & Drivers
l
l
l
The market for water treatment chemicals is expected to grow at a CAGR of 9% to
reach ~ USD 675 million in 2012. Key market drivers include:
Rapid industrialization leading to huge demand for effluent treatment
Stricter effluent norms coupled with greater awareness about environmental
conservation have necessitated efficient industrial water treatment
Awareness among end users about recycling water, and cost effectiveness of
recycling water in the long term
8%350
475
680
2004 2008 2012
9%
XX% CAGRMarket size (USD billion)
Source: Tata Strategic Estimates
Personal Care Ingredients
Market Overview
l
l
l
l
l
l
Industry Overview
Growth Forecast & Drivers
The Indian personal care industry was worth ~ USD 6 billion in 2008. It can be sub
divided into hair care, skin care, oral care and fragrances with skin care as the fastest
growing segment. The Indian personal care ingredients market can be divided into
active and inactive ingredients. The personal care ingredients market has grown at ~
10% p.a. in the period from 2004-08 to reach USD 300-350 million in 2008. Wash
products like soaps and shower gels account for half of the consumption in this
segment. Other key product categories for specialty chemicals applications include
hair oil, shampoo & conditioner, talc, deodorants & fairness creams. Currently the
main active ingredients being used in the Indian personal care market are:
Skin lightening agents
Moisturizers and humectants
Antimicrobials
Conditioning agents
Anti-dandruff agents
Other active ingredients include products used for anti-aging such as Vitamins A, C
and E, ingredients for antiperspirants and exfoliating ingredients such as Alpha and
Beta Hydroxy Acids.
The market is extremely competitive with more than 1500 manufacturers of personal
care ingredients in India. The market is dominated by small and medium scale
domestic companies which account for more than 50% of the market. Major domestic
players include Vivimed laboratories, Sami Labs and Givaudan. These companies,
however, are not able to cater to the export market due to lack of investment and
inability to meet international regulations. Multinational companies account for about
35% of the market but are strengthening their presence in the country. BASF India
Ltd., Ciba Specialty Chemicals and Clariant Chemicals are the leading multinational
players in India.
The market for active personal care ingredients has a potential to grow at 15% p.a. to
reach ~ USD 525 million in 2012. Key growth drivers include:
Market, Technology and Regulatory Trends
Future Outlook
The market for water treatment chemicals has seen a shift from the traditional
products to technically more advanced products. For example, traditional products like
alum are being replaced by coagulants and flocculants. In the corrosion and scale
inhibitor market there is an ongoing shift from the traditionally used heavy metal
based products to the ones which have better environmental profiles.
Manufacturers are increasingly producing patented formulations with exclusive rights
that offer customized solutions in a particular market.
The market is expected to grow in light of stricter Government regulations in industrial
and institutional domains. However, saturation has reached the Indian market in terms
of product offerings. Innovative products catering to niche applications are likely to
help market participants sustain their competitive edge.

40 INDIACHEM GUJARAT 2009 41INDIACHEM GUJARAT 2009
Federation of Indian Chambers of Commerce and Industry
l
l
l
Growth in the personal care industry due to huge demand from the consumers.
Brands are being increasingly popularized by promoting the active ingredient being
used in production
Rising consumer awareness through media campaigns and health experts
Huge export potential due to India's vast experience in producing natural products
200
300
525
2004 2008 2012
10%
xx%
15%
CAGRMarket size (USD billion)
Source: Tata Strategic Estimates
Market, Technology and Regulatory Trends
Future Outlook
The market is highly competitive with a large number of domestic and multinational
companies as a result of which the supplier loyalty is low with manufacturers switching
suppliers based on cost benefit and value addition.
There is limited investment in research and development of new ingredients and the
problem is further accentuated with requirement of customized ingredients for
different regions in India. This has resulted in India becoming a raw material sourcing
hub for multinational corporations. Another problem faced by the industry is the
limited lifetime of active ingredients in formulations as they are biodegradable.
Imposition of stringent regulation in disclosing the ingredient composition to the
consumer is expected to increase sales of personal care ingredient manufacturers.
Companies which are able to innovate and come out with value added products will
have a competitive edge in the market. This requires considerable investment in
research and development of new ingredients with special focus on increasing the
lifetime of the ingredient. There is a growing demand of natural ingredients based
products from export market and Indian expertise in such products can be used to tap
the same. Increased investment and conformation to export regulations are required
to achieve this.
Construction Chemicals
Market Overview
The Indian construction chemicals market constitutes a variety of products ranging
from admixtures to sealants to flooring chemicals. This segment has achieved a CAGR
of 16% in the period from 2005-08 to reach ~ USD 265 million in 2008. However, the
market is still very small when compared to other global markets like the United States
which was estimated at ~ USD 7 billion in 2008. Admixtures form the biggest segment
with 34% share followed by flooring chemicals with 16% share.
Miscellaneo31%
us,
Repair andRehabilitation
9% Flooring,
16%
Admixtures,34%
Waterproofi10%
ng,
Total: USD 265 million
Source: Industry Report, Tata Strategic Estimates
Product share: 2008 (% of total)
Industry Overview
The Indian construction chemicals market is fairly organized but fragmented in product
type and application areas. The top 20 organized players account for ~ 70% of the
market; the rest being accounted by small and unorganized players. Fosroc & BASF SE
are the leading players in the Indian construction chemicals market.
SWC, 5%
PidiliteIndustriesLtd., 6%
Others, 50% Sika India,13%
Fosroc, 14%
BASF SE,12%
Total:
Source: Tata Strategic Estimates
Total: USD 265 million
Market share: 2008 (% of total)
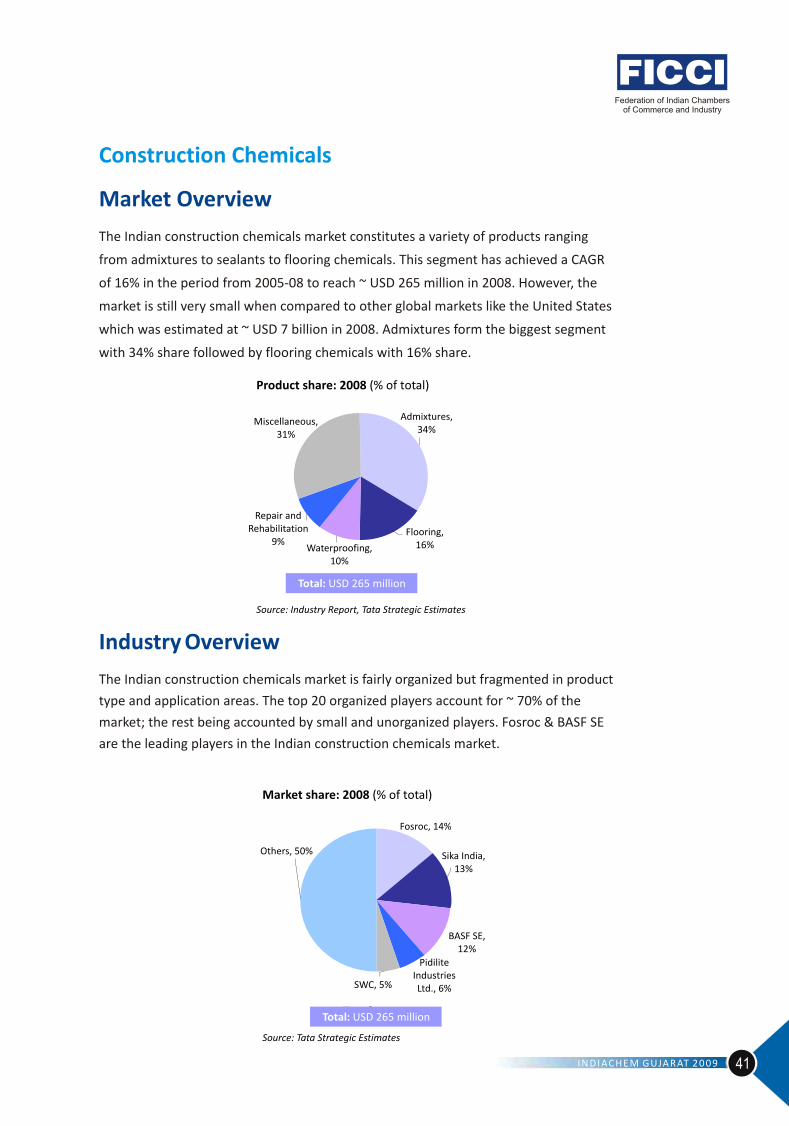

42 INDIACHEM GUJARAT 2009 43INDIACHEM GUJARAT 2009
Federation of Indian Chambers of Commerce and Industry
Growth Forecast & Drivers
l
l
l
The market for construction chemicals is expected to grow at a CAGR of 13% to reach ~
USD 425 million in 2012. The demand will remain flat in 2009 but is expected to pick
up considerably in 2010. Key market drivers include:
Growth in construction activities due to increased Government spending specially
in rural areas
100% Foreign Direct Investment (FDI) in Real Estate to boost construction activities
Increased product awareness and compliance with international manufacturing
standards
xx%
13%
170
265
425
2005 2008 2012
Market size (USD billion)
Source: Industry Report, Tata Strategic Estimates
16%
CAGR
Market, Technology and Regulatory Trends
Future Outlook
The construction chemical industry faces intense competition from traditional
products like sand and tar. However, due to increased product awareness and
compliance with international standards, construction chemicals are slowly capturing
the Indian market.
Due to lack of entry barriers, competition is high and a lot of low value products are
being sold in the market. Domestic companies have easy access to foreign technology
and are hence able to compete with multinational players. Margins are lowered
because most contractors prefer low cost chemicals to reduce the construction cost.
High value products have limited demand from premium construction houses. Exports
are limited and have to comply with REACH regulation.
Construction chemicals market has a huge growth potential due to the construction
and manufacturing boom in India. High price sensitivity is the key challenge being
faced by the industry. Following are the critical success factors for growth in the
market:
l
l
Market Overview
Product innovation and diversification
Creating product awareness
Polmer additives are specialty chemicals added to the base polymer to enhance
certain properties or improve processing and account for roughly 10% of the
manufacturing cost. The Indian polymer additives market has achieved a CAGR of 10%
in the period from 2004-08 to reach ~ USD 235 million in 2008. Plasticizers form the
largest segment with 43% market share followed by heat stabilizers with 21% market
share. In terms of end use industry perspective, PVC consumes the maximum amount
of additives accounting for 40% of the total market followed by polyolefins with 20%.
Polymer Additives
Antioxidants,8%
FlameRetardants,
5%
Others, 19%
HeatStabilizers,
21%
LightStabilizers,
4%
Total: USD 235million
Plasticizers,43%
Product share: 2008 (% of total)
Source: Industry Report, Tata Strategic Estimates
Industry Overview
The organized segment has approximately 30 players and is dominated by
multinational companies like Ciba India Ltd., Clariant Chemicals India Ltd., BASF,
LANXESS India Private Ltd., Baerlocher India Ltd., Akzo Nobel Chemicals (India) Limited
and Rohm & Haas India Pvt. Ltd. Major domestic players include KLJ Group, Fine
Organics and Vision Organics Limited. KLJ Group and Baerlocher India are the market
leaders in plasticizers and heat stabilizers, respectively. Ciba is the market leader in
flame retardants, light stabilizers, and antioxidants.

44 INDIACHEM GUJARAT 2009
Growth Forecast & Drivers
l
l
The market for polymer additives is expected to grow at a CAGR of 11% to reach ~ USD
360 million in 2012. Key market drivers include:
Growth in plastic demand due to increased usage in packaging, construction and
automotive sectors
Replacement of wood, metal and glass by plastic across various applications
165
240
360
2004 2008 2012
10%
xx%
11%
Market size (USD billion) CAGR
Source: Tata Strategic Estimates
Market, Technology and Regulatory Trends
Future Outlook
Increasing demand for environment friendly additives by domestic market together
with regulations such as REACH on exports is forcing players to adopt environment
friendly manufacturing route. With rising consumer awareness, players switching to
oleochemical route have a competitive advantage over others.
The present market is characterized by falling prices and low profit margins due to
overcapacity of major manufacturers, reduction in import tariffs and dollar
devaluation. Strict regulation on additive use in plastics is expected to drive demand
and increase sales.
Development of environment friendly additives is a major challenge being faced by the
industry. Companies that are able to modify their product portfolio accordingly shall
have a competitive advantage over others. The problem of overcapacity is likely to be
addressed either by certain players exiting the market or via mergers and acquisitions.
Thought Notes

Indian Specialty Chemicals:
When will growth return?Triggered by the economic downturn- slowdowns in key end use industries and
inventory adjustments across the supply chain have impacted the growth momentum of the Indian specialty chemicals industry. A revival of domestic
demand and competitiveness as a global supply base should enable India to establish itself as an emerging specialty chemicals hub. The big question is when
will the revival happen? Pratik Kadakia, Abhishek Nigam and Ashwin Rao of Tata Strategic offer a perspective on this and on what companies should do in
the interim to their advantage.

49INDIACHEM GUJARAT 2009
Federation of Indian Chambers of Commerce and Industry
Indian specialty chemicals in 2006-07: An unfolding
growth story
Slowdown in end-use industries
Slowdown in the Indian chemicals industry
The Indian specialty chemicals industry estimated at ~ USD 18 billion (including
knowledge chemicals) in 2006-07 was an unfolding growth story. While the growth in
developed markets of US, Europe and Japan had stagnated, the Indian specialty
chemicals market continued to grow and was projected to double over the next five
years.
So what has changed in the past one year or so? The economic slowdown has
adversely affected the growth of several industries across the world. The Indian
chemicals industry in general and the specialty chemicals segment in particular, have
been no different. In this article we explore whether the economic slowdown has
fundamentally changed the script of the growth story or the Indian specialty chemistry
industry would continue to chart its growth path.
The demand for specialty chemicals industry is driven by a wide range of end-use
industries. While some of these such as pharmaceuticals, pesticides and water
treatment have felt the tremors of the global slowdown to a lesser extent; others like
textile, construction, automobile and personal care segments have suffered a
significant loss in growth momentum (Refer Exhibit 1). Housing market slowdown,
stalling of infrastructure projects, reduction in discretionary expenses and weakened
demand from export markets have adversely affected the growth rates of the relevant
end-use industries. This has directly impacted the growth of the Indian specialty
chemicals industry.
The economic slowdown has no doubt impacted the growth of the overall Indian
chemical industry in the short term. Analysis of the financial performance (revenue
and profitability) of various chemical companies in India shows that different segments
have been impacted differently by the current slowdown (Refer Exhibit 2). From the
base chemicals perspective, organic and petrochemical companies have fared
relatively poorly as compared to inorganic chemicals, while within specialty chemicals,
agrochemical companies have fared relatively better than other segments.
The growth rate started to slow down by end of 2007, with the first contraction in
chemicals production reported in Sep 2008. The next six months continued to witness
sub-zero/ near-zero growth due to demand slowdown and inventory reduction. There
were also concerns of dumping of several products by countries with huge
overcapacities like China. All these factors along with a sharp drop in crude oil prices
resulted in a

50 INDIACHEM GUJARAT 2009 51INDIACHEM GUJARAT 2009
Federation of Indian Chambers of Commerce and Industry
15
9
17
14
11
15
14
20
10
7
12
6
7
10
9
12
Personal Care
Paper
Leather
Automobiles
Paints
Glass
Construction
Textiles
Exhibit 1: End Use Industry (EUI) growth projections (%)
High - moderate (Housing/ automotive slow down)
Severe (Exports affected)
Low - moderate
High - moderate (Cut on discretionary expenses)
Severe (Cut on discretionary expenses, high interest rates, carsexpensive liability, some respite due to launch of small cars)
High - moderate (Housing/ automotive slow down)
High - moderate (Housing slow down, infrastructure projects stalled)
Severe (Exports constitute 40 - 50%; badly affected)
Impact of slowdown
Pre-downturnDue to slowdown © Tata Strategic Management Group
30
16
9
25
4
-4
6
22
-4
15
23
-18
-172
79
108
-15
26
35
42
Base chemicals (% change)
-4
19
-1
18
-15
0
14
19
-40
106TataChemicals
RIL(Petrochem.)
GACL
GNFC
KanoriaChemicals
Specialty chemicals (% change)
-20
BASF India
Clariant India*
Bayer Cropscience
Rallis
Excel Crop Care
Pidilite
AkzoNobel(ICI Paints)
SI Group
Jubilant
Organosys(Ind. & Perf. products)
Ion exchange (chemicals)
Ino
rga
nic
Organ
ic &Petro
chem
ical
Agro
chem
ica l
Co
nstru
ction
Exhibit 2: Company financial performance (Standalone/ India operations)
* Calendar year reportingOperating Income
% change (FY09 over FY08)
EBIT
© Tata Strategic Management GroupSource: Capitaline, Company annual reports
6
0
-
ations)
Exhibit 3 : Fall in chemicalprices in Q4 2008 (% decrease)
Source: Analyst reports, Industry news©Tata Strategic Management Group
98
51
34
40
SulphuricAcid
AceticAcid
Benzene
Plasticizer
The growth rate started to slow down by end of 2007, with the first contraction in
chemicals production reported in Sep 2008. The next six months continued to witness
sub-zero/ near-zero growth due to demand slowdown and inventory reduction. There
were also concerns of dumping of several products by countries with huge
overcapacities like China. All these factors along with a sharp drop in crude oil prices
resulted in a price crash of several chemicals and petrochemicals in the last quarter of
2008 (Refer Exhibit 3). Base chemicals witnessed 33-50% price erosion during the
same period. This compounded the already existing credit crunch resulting in a draw
down of inventory by chemical users. Drop in demand forced several manufacturers to
cut production across the industry (Refer Exhibit 4).
Exhibit 4 : Plant production cutslReliance Industries Ltd
Lower operating rates due to production cuts at Patalganga facility in Q3 Fy’09n Fiber intermediate at 91%
nPolyester plants at 81%lAsian Paints
Chemical plant closed for a period of amonth
lBASF IndiaProduction cuts in plants catering toautomobile, construction and textilessector
Companies utilized this period to drive performance improvement initiatives to
minimize the impact on the bottom-line. For example, the petrochemicals business
segment of Reliance Industries Ltd. reported higher EBIT in Q1 FY 2010, than in Q1 FY
2009 despite lower quarterly revenues.

52 INDIACHEM GUJARAT 2009 53INDIACHEM GUJARAT 2009
Federation of Indian Chambers of Commerce and Industry
Fundamental drivers for growth remain robust
Opportunity to review and refocus
The exact nature of the growth recovery would vary for different chemicals and be
dependant on larger macroeconomic variables like impact of monsoons on Indian GDP
growth. However the two most significant growth drivers of Indian specialty chemicals
industry remain robust: the huge unrealized potential of the domestic market
(reflected in the very low per capita consumption of chemicals and their end products)
and the preferred global competitive supply base (due to advantages in several areas
including human resources, operational excellence and feedstock) (Refer Exhibit 5).
Huge unrealized potential of domestic market
Per capita consumption of several chemicals and related consumer products is low in
India, far below the world average. Even at revised GDP growth rate projections of ~7%
p.a., the Indian domestic market offers a vast untapped potential. Rise in per capita
income will fuel the demand for better quality and higher performance products
leading to increased demand for specialty chemicals.
Preferred destination as a supply base
Besides being a large market, India is also establishing itself as a reliable and cost
effective manufacturer of specialty chemicals. The erstwhile cost advantage of China
with respect to India in manufacturing is narrowing. Besides providing access to a rich
pool of knowledge workers, India also provides a robust legal and regulatory
framework for research based development, not to mention a better intellectual
property protection environment. Also, India has a vast bio-resource potential to
support the global trend of using sustainable agri-based feedstock and is providing the
infrastructure for research in evolving areas such as green chemistry.
The fundamentals of the Indian growth story continue to remain; however the
economic slowdown has shifted the timelines of the demand trajectory. The growth
slowdown and subsequent demand contraction in 2008-09 has been sudden and steep
but the first signs of revival are there to be seen. The Index of Industrial Production
(IIP) has turned positive after months of de-growth. The six core infrastructure
industries grew 6.5 % in June 2009 with cement showing a strong performance,
Source: A Scenario for the Chemicals Industry in EU, Sep 2007; Arthur D. Little Benelux
Federchimica ,
28
15
7.0
0.6
3.0
0.5
0.05
0.2
0.2
Paper
Dyestuff
Adhesives
Detergents
Paint
Per capita consumption: (kg)
World Avg.India
Brazil & China
Asia average
61
22
4 7 4
95
Swit
zerl
and
Ital
y
Pola
nd
Ind
ia
Ch
ina
(Co
asta
l)
Ch
ina
(In
lan
d)
Unit labor costs $/person/yr)
across countries (’000
India has advantages in labor costs, R&Dcapability & skilled human resource
Exhibit 5
14
25
5.0Polymers
© Tata Strategic Management Group
-4.7
5.6 6.1
2.6
6.6
10.4
4
-3.7
14.7
7
12.8
5.3
Jun-08 Jun-09
Crude Oil Petroleumproducts
Coal Electricity Cement FinishedSteel
Exhibit 6: Revival of core infrastructure industries
© Tata Strategic Management Group Source : Economic Times, July 24,09
highlighting the upsurge in construction activity. Similarly, growth in coal and
electricity sectors is an indicator of rising energy demand which correlates to
acceleration of the overall economic activity (Refer Exhibit 6).
The key question is: when will growth return to pre-crisis levels? The worst may be
behind us. For example, BASF India in its recently declared financial results for Q1 FY
2010 reported sales turnover, operating profit and net profit higher than not only the
last quarter but better than any of the last 4 quarters. A slow up-turn could see the
demand reach pre-crisis levels by mid 2010 subject to overall GDP growth projections
holding firm. The growth could return to earlier projected levels of ~15% p.a. driven
largely by strong domestic end-use industries growth and some revival in the global
markets (Refer Exhibit 7).

54 INDIACHEM GUJARAT 2009
201020072002
Inv. slowdown adj/demand
Demand(NOT TO SCALE)
Time -year end
(NOT TO SCALE)
Pre-growth projection
CAGR: 15-17%
downturn
2012
~4- quartersprojection-shift
8
Opportunity to reviewstrategy and build
capability
Past growth curveCAGR: 11-12%
Preslowdown
Post recovery
20092008
Exhibit 7: Specialty chemicals growth projections INDICATIVE
Post-downturngrowth curve CAGR: ~15%
Slowdown, demandcontraction & recovery
© Tata Strategic Management Group
The current economic slowdown has provided an opportunity to specialty chemical
companies in India to review their strategic direction and strengthen capabilities
required to cater to the unique requirements of the domestic market. Companies that
invest to increase their competitiveness and work towards innovative solutions to
meet specific customer needs would be best positioned to reap benefits when high
growth returns for the Indian specialty chemicals industry which may not be too far
into the future.
Green Chemistry: Building a greener future
Going green will no longer be a matter of choice but will become a strategic imperative for Indian chemical companies, say Pratik Kadakia,
Abhishek Nigam and Ashwin Rao of Tata Strategic Management Group

57INDIACHEM GUJARAT 2009
Federation of Indian Chambers of Commerce and Industry
Green chemistry gained popularity in the 1990s when Paul Anastas and John Warner
popularised it through their 12 tenets. Today, it is acknowledged as a science based,
economically driven approach to environmental protection and sustainable
development. In their efforts to ensure sustainability, companies around the world are
increasingly looking at reducing waste generation and energy usage while attempting
to manufacture chemical products from renewable feedstock.
In India, chemical companies are fast making progress to lower the industry's
environmental footprint by adopting green chemistry strategies that reduce emissions,
improve sustainability and promote the eco-credentials of manufactured products and
processes (see Box). This trend is being fuelled not only by a growing awareness
among Indian consumers of the environment and mankind's impact on it, but also by
the rise of a wealthy Indian middle class with a much greater spending power than in
the past (Figure 1).
Growing environmental consciousness has resulted in an increasing demand for green
products and processes, such as green buildings. Greening a building adds 3-8%
additional cost over a conventional building; however, the payback is less than three
years due to savings in operational expenses. Over 300 such buildings have been
constructed in India and it is expected that over 700 more will have been built by
2010, ensuring a demand for green building materials such as high performance glass,
low VOC paints and fly ash blocks.1
New legislation, such as Europe's Evaluation, Authorisation and Restriction of
Chemicals (REACH) regulations, has also affected the way that chemical companies do
business around the world, including in India. About 15% of India's chemical exports,
roughly US$500m, are to the EU, a sizable market that is difficult to ignore. Many
Indian manufacturers compete on cost basis for exports, a business model that
traditionally provides little incentive for rigorous risk assessment of chemicals.2
However, companies that take steps to ensure sustainability and go green will have
unrestricted access to markets, boost their reputation and gain a competitive
advantage in the marketplace. REACH and other stringent regulations expected in the
future are spurring investments in green technology.
The Indian ‘green’ story (( Box)))
l
l
l
l
l
The Indian textile industry, one of the biggest consumers of chemicals, has recently adopted microbial de - colourisation and degradation procedures, and begun exploring biodiversity for natural dyes and developing eco-friendly methodology for synthetic dyes.8
Hindustan Petroleum Corporation Limited (HPCL), a public sector refiner, has stated its intent to bring to market green lubricants developed from renewable feedstock.
DuPont, as part of its R&D strategy, has set up a knowledge centre in India focusing on areas like green technologies for refinery processes.9
Gujarat Narmada Fertilizers Company Ltd, a public sector firm, GNFC, a public sector company, has developed and implemented an Environment Management System (EMS) for its fertilisers, , chemicals and supporting services at Gujarat. Due to EMS, the firm has reduced its energy, water and lube oil consumption and increased its revenue from scrap sale due to better segregation.
Tata Chemicals has established an Innovation Centre to focus on green technologies in emerging areas such as nano-technology, fermentation and bio-fuels. The centre plays a dual role, greening existing businesses by researchingbiochemical processes that are more environment- friendly and energy efficient and developing new green products.

58 INDIACHEM GUJARAT 2009 59INDIACHEM GUJARAT 2009
Federation of Indian Chambers of Commerce and Industry
Bioresource potential
The growing biorenewables sector, meanwhile, also presents new and potentially
lucrative opportunities for chemical companies in India. According to business
research and consulting firm Frost & Sullivan, the global bio-renewable chemicals
market was worth an estimated US$1.63 billion in 2007 - 08, and is expected to
increase to US$5 billion by 2015. Bio-refineries that make both fuels and chemicals
from crop plants are expected to replace conventional petro-chemical plants in the not
too distant future, while recent biosyntheses of widely used industrial solvents, such
as methyl ethyl ketone, increase the possibility of replacing oil-based derivatives in
processes and products.3 Carbohydrates, fatty acids and fatty alcohols from oil crops 4
are also being used to generate biosurfactants with the help of microbial enzymes.
Figure1: The Indian income pyramid
Source: National Council of Applied Economic Research, India (NCAER)/ Tata Strategic analysis
132,250
Deprived
Number of Households in ’000 (In 2005-06 Prices)
Aspirers
Seekers
Strivers
Near rich
Clear rich
Sheer rich
Super rich
3,212
13,813
53,276
114,394
6,173
22,268
75,304
78,446
11,647
35,290
102,830
4,937
2,373
1,037
2,369
613
375
1,122
454
103
53
141
255
27.7 %
25.0 %
22.9 %
20.3 %
17.5 %
12.4 %
8.6 %
-6.3%
CAGR2005 2014 -
Total 204,283
221,945
236,506 50
2005-6 2009-10E 2013-14E
Annual Income‘000 USD
>242
120 242
48 120
24 48
12 24
4.8 12
2.2 4.8
<2.2
1 USD = INR
resources and raw materials, as well as access to a large pool of consumers. Besides
being in a position to bring green products to the market quickly and enjoying a first
mover advantage, they could also leverage these gains in other markets.
The initial success of green chemistry in India is also attributed to the role played by
other stakeholders, including government and research organisations, in helping to
foster the uptake and development of green technologies. The green chemistry
programme started by the Department of Science and Technology in 2004 supports
industry-led research and training in the form of workshops. Currently, the department
supports research in several fields, including ionic liquids, non-hazardous bromination
and degradable polymer composites, packaging plastics and bio-surfactants.
While large companies may have the wherewithal to undertake research on their own,
small & medium enterprises (SMEs) need more support. Organisations such as the
Gujarat Cleaner Production Centre (GCPC) recognise this need, and in association with
United Nations Industrial Development Organization (UNIDO) identify and provide
consulting services for SME projects in the green chemistry space.
Several companies, meanwhile, have also tied up with academic institutions, such as
Mumbai University's Institute of Chemical Technology, and research organisations, like
the National Chemical Laboratory, Pune. As a result, active research is being conducted
in areas that include the oxidation of alcohols to carbonyl compounds, green synthesis
of amides from nitriles and making ionic liquids more effective for promoting organic
reactions.
Indian 'enviropreneurs', (entrepreneurs with business models built on addressing
environmental concerns, profitably), are providing a wide range of solutions in the
areas of yield improvement and solvent recycling to minimise waste. Also, special
environment funds are looking to invest in green technologies, especially in enzymatic
production routes and biopolymers.
Company CEOs need to place their bets today on whether they will lead the way in
adopting green chemistry and create a competitive advantage or be a participant in a
crowded space in the future. Leading the green charge successfully will require
companies to devise innovative approaches to deliver economic, environmental and
social benefits.
A case in point is Dow Corning, which started 'Materials Conversion' to recover value
from waste, scrap and off-specification silicone materials - those materials that cannot
be reused in their original form - by converting them to usable products. In this way,
the company both protected the environment by keeping materials out of landfills and 7incinerators and met customer needs in new and existing applications.
Other stakeholders
Competitive advantage
India ranks as the second largest country in the world, with approximately 170 million 5hectares of arable land, and is home to a vast bio-resource potential. National
laboratories, academic institutes and industry are actively pursuing bio-diesel, bio-
ethanol, bio-surfactants, bio-polymers and bio-pharmaceuticals. Sugar mill companies,
such as Mumbai-based Godavari Biorefineries, headquartered in Mumbai, have also
started manufacturing products from renewable resources, forming an entire value-
chain right from sugarcane through sugar to other value-added products like power,
ethanol, chemicals and bio-fertilisers. Meanwhile, grants, such as the US$11 million a
year grants fund of the Indian Council of Scientific and Industrial Research (CSIR), is 6
also helping to promote further development in the bio-renewables domain.
While the concern over the use of land for food, versus non-foods is not yet resolved,
bio-renewables advances nevertheless have the potential to create a significant impact
in India, as well as to alter the sourcing landscape. Companies that invest in R&D in the
region will have a competitive advantage, both in terms of availability of qualified

60 INDIACHEM GUJARAT 2009
Companies need to have a comprehensive and well thought out plan for achieving
sustainability and green objectives. A three-point agenda for Indian companies to
accelerate their journey to go green could be:
1. Build sustainability goals into vision statements, with clear objectives cascading
down to market facing goals. These could take the form of clearly defined revenue
targets for green products - manufactured from renewable feedstock or fully
recyclable products - and operational goals, such as a reduction in the firm's
carbon footprint.
2. Communicate and demonstrate top management support for green initiatives. This
is necessary for innovation to flourish, which is a key enabler in the path to go
green. It will also help the management resist short-term pressures from derailing
long-term strategic intent.
3. Undertake a life-cycle assessment of existing products and look for opportunities
to introduce green products/ services, based on an understanding of current and
evolving customer needs. This could throw up areas within the supply chain that
are environmentally deficient and most probably economically inefficient.
Companies could initially face cost and scalability issues for green technologies and
products. However, a clear roadmap with prioritised actions will help to achieve their
triple bottom line and realise the benefits of green chemistry long before competition
steps in. Companies that understand the market, regulatory and technology trends
have the potential to alter the landscape of the Indian chemical industry and will be in
a better position to take advantage of the opportunities and establish a strong
foothold.
References
1. The Economic Times, Sep 22 2008, 'Eco-friendly 'green buildings' catching on in
India'.
2. ChemicalWatch, Aug 14 2007, 'REACH awareness 'top priority' for Indian firms'.
3. ICIS Chemical Business, 'Are chemical producers engaged in the drive to use green
chemicals?', 11 May 2009.
4. MISTRA website, 'Greenchem - speciality chemicals from renewable resources'.
5. UN Food and Agricultural Organization, 2004 World Almanac.
6. Presentation at 5th Sustainable Chemistry Stakeholders Meeting, 8 Mar 2007,
'Sustainable chemistry and biotechnology activities in India'.
7. Dow Corning Sustainability 2004 and 2006 Summary Report and 'Materials
Conversion' webpage.
8. M. Kidwai, 'Green chemistry in India,' IUPAC, 2001
9. Business Standard, 24 Nov 2008, 'DuPont knowledge centre to focus on green
tech'.
Outlook for personal care ingredients industry:
An Indian perspectiveThe Indian personal care ingredients (PCI) industry has taken rapid strides in the last
few years, as more and more personal care products (PCP) incorporate specialty ingredients in their formulation. However, a comparison with per capita consumption of
PCP in China reflects the largely untapped nature of the Indian market. Favorable demographic factors and increasing beauty consciousness indicate high future demand
for personal care products and specifically for active ingredients. Key trends, including nanotechnology and green chemistry besides others, will influence the strategies of
PCP and consequently PCI players. The eventual winners would be those who ensure better value offerings to meet the needs of the Indian consumer say Pratik Kadakia,
Abhishek Nigam and Ashwin Rao of Tata Strategic Management Group

63INDIACHEM GUJARAT 2009
Federation of Indian Chambers of Commerce and Industry
Chemicals & personal care
Indian personal care products market
From soaps and shampoos in the morning to overnight repair face creams, from
sunscreen products in summers to moisturising lotions in winters; personal care
products literally touch our daily lives. The personal care products we use are in some
measure the signature of our lifestyles and standards of living.
The awareness about ubiquitous personal care products is perhaps matched only by
the total ignorance or misinformation about the chemicals that make these products
what they are. From the metallic salts of fatty acids used to make the common bath
soaps to the high end cosmoceuticals that combine the beauty related properties of
cosmetics with the functional benefits of pharmaceuticals, chemicals (whether derived
from natural or synthetic sources) are an integral part of personal care products.
Specialty chemicals are widely used in personal care products as active ingredients in
the form of emollients, foaming agents, and stabilizers. Their performance
characteristics like thickening, foaming, imparting smoothness and conditioning are
the key functionalities sought in several personal care products. Before we delve into
the personal care ingredients (PCI) industry, let us present an overview of the Indian
personal care products (PCP) market and its key trends.
The personal care products (PCP) market in India is estimated to be worth ~USD 4
billion p.a. Personal hygiene products (including bath and shower products,
deodorants etc.), hair care, skin care, colour cosmetics and fragrances are the key
segments of the personal care market (Refer Fig 1).
46%
31%
16%
6%1%
Bath & shower products HaircareSkincare Colour CosmeticsFragrances
Source: Morgan Stanley Report
© Tata Strategic Management Group
Fig 1: Segmental breakup of personal care market
Each of these segments exhibits its unique trends and growth patterns. For example,
the largest segment of personal hygiene products, largely dominated by bar soaps has
grown at ~5% p.a. over the last five years. In comparison, the second largest segment,
hair care products has seen a much higher growth of ~9-10% p.a. during the same
period.

64 INDIACHEM GUJARAT 2009 65INDIACHEM GUJARAT 2009
Federation of Indian Chambers of Commerce and Industry
The skin care market is relatively smaller and is growing at a relatively high rate while
moving away from basic creams and moisturizers to specialized products such as anti-
wrinkle and dark circle removing creams. For example, the anti-ageing segment,
though only 2% of the skin care market has been growing at a rate of greater than 90%
p.a. over the last few years.
Key trends and growth drivers in India
As in other parts of the world, the driving force behind personal care products has
evolved considerably in India. Starting from purely health notions and moving on to
fitness, the current trend is towards well-being coupled with beauty. In an effort to
adapt to these changes, the industry has moved from basic products such as soaps,
shampoos and hair oils to functional products such as cold creams and now to
specialized products such as sun block lotions, body exfoliating creams and skin
whitening & anti-ageing products.
The sizable Indian population base with rising disposable income offers the personal
care industry a burgeoning middle class to market a large variety of consumer
products. As compared to China, India has a fairly similar personal disposable income
per household and a growing population of women in the 25-44 age group, the key
consumer segment (Refer Fig 2).
Fig 2: Demographics & Economic Drivers, India vs China
Source: EIU, CIA world fact book
© Tata Strategic Management Group
1,339
219
4,363
1,166
178
4,429
2008 India
2008 China
1,365
217
7,307
1,221
191
6,250
2012P India
2012P China
Population(Mn)
Femalepopulation 25 to
44 yearsMn
Personal disposableincome perhousehold
(USD)
However, China spends almost 10 times as much on skin care, 6 times as much on
cosmetics and more than 2 times on hair care on a per capita basis (Refer Fig 3). These
figures indicate the huge unrealized potential of the Indian market especially for select
PCP segments.
Several social, market and industry trends signal the possibility of Indian personal care
industry realizing this huge potential in the near future. Increasing urbanization, rising
participation of women in urban work force and growing importance of looks and
personal grooming not only for personal but professional reasons are some of the key
social drivers. Market trends like spread of organized retail to Tier II cities,
development of non-traditional segments like men's cosmetics (with products like hair
gels and fairness creams) and development of a wide range of products at different
price points are all factors which could contribute to the growth of the domestic
personal care market. Industry trends like increasing competition with entry of large
MNCs, increased brand building and customer awareness initiatives by companies are
accelerating growth. Subject to sustained overall GDP growth rates of ~8-9% p.a., the
overall Indian personal care market has the potential to grow at 15%-16% p.a. (much
higher rates for select segments like colour cosmetics, skin care and deodorants) and
thereby double to ~USD 8 billion by 2012-13.
The changing face of the personal care products market is perhaps best reflected in
the corresponding developments in the personal care ingredients industry. Specialty
chemical manufacturers supplying to personal care are adopting 'green chemistry'
principles to better meet consumer demand for natural and safer products and
increasingly stringent regulatory requirements. This includes both product changes
featuring higher proportion of natural ingredients as raw materials and a move to
'greener' production processes based on better energy conservation, safer solvents
and minimization of waste generation.
Advances in the area of nanotechnology are helping researchers create breakthroughs
in biotechnology thereby enabling greater usage of natural ingredients in PCI industry.
Nano-scaled encapsulation techniques are being used to develop better systems to
deliver the active ingredient to the intended target area. Also, strong demand for
multi-functional products such as silicones with improved sensory characteristics and
surfactants with anti-oxidant and anti-inflammatory properties is being witnessed.
The Indian personal care ingredients market is currently estimated at ~USD 300-350
million. The relatively higher price sensitivity of the Indian personal care market has
traditionally limited the role of high value personal care ingredients. This has also
contributed to lower R&D spends and fewer innovations by the Indian personal care
product formulation companies, few of which are backward integrated in the personal
Personal care ingredients: Key global trends
Personal care ingredients in India
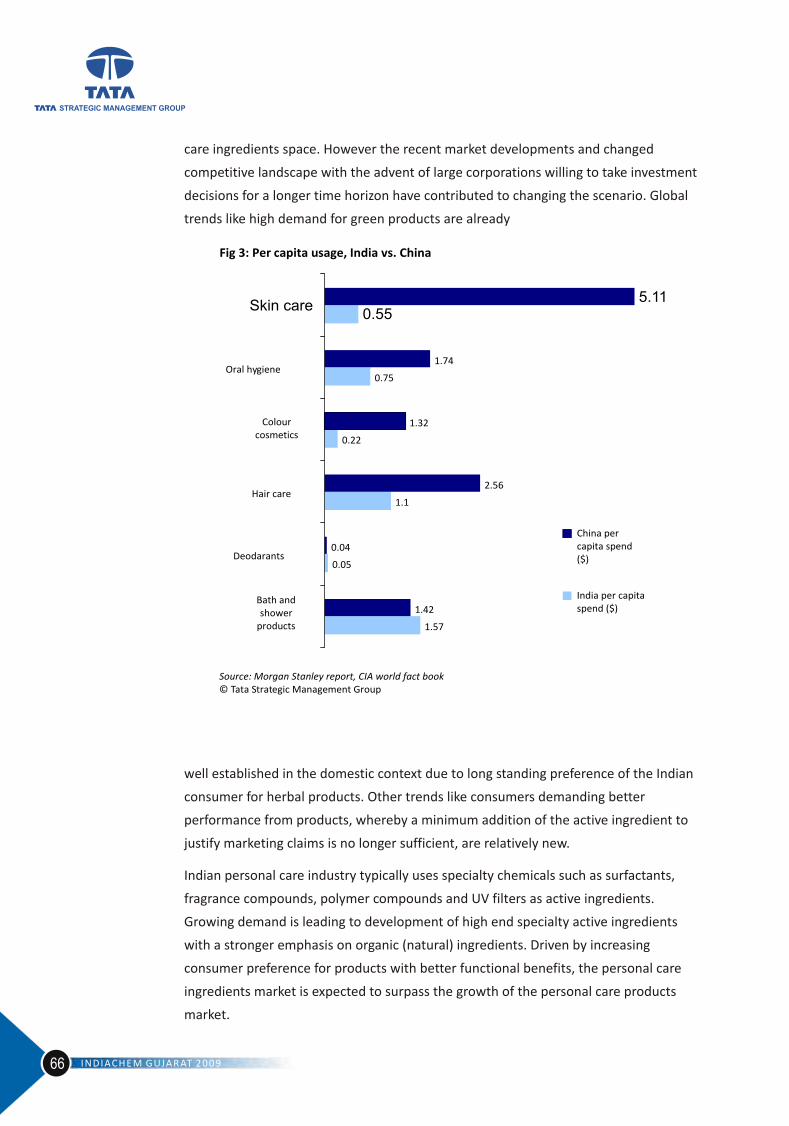
66 INDIACHEM GUJARAT 2009 67INDIACHEM GUJARAT 2009
Federation of Indian Chambers of Commerce and Industry
care ingredients space. However the recent market developments and changed
competitive landscape with the advent of large corporations willing to take investment
decisions for a longer time horizon have contributed to changing the scenario. Global
trends like high demand for green products are already
Fig 3: Per capita usage, India vs. China
1.57
0.05
1.1
0.22
0.75
0.55
1.42
0.04
2.56
1.32
1.74
5.11
Bath andshower
products
Deodarants
Hair care
Colourcosmetics
Oral hygiene
Skin care
Source: Morgan Stanley report, CIA world fact book© Tata Strategic Management Group
China percapita spend($)
India per capitaspend ($)
well established in the domestic context due to long standing preference of the Indian
consumer for herbal products. Other trends like consumers demanding better
performance from products, whereby a minimum addition of the active ingredient to
justify marketing claims is no longer sufficient, are relatively new.
Indian personal care industry typically uses specialty chemicals such as surfactants,
fragrance compounds, polymer compounds and UV filters as active ingredients.
Growing demand is leading to development of high end specialty active ingredients
with a stronger emphasis on organic (natural) ingredients. Driven by increasing
consumer preference for products with better functional benefits, the personal care
ingredients market is expected to surpass the growth of the personal care products
market.
Way ahead for personal care industry in India
What do all these trends mean for the Indian personal care industry in general and
individual companies in particular? The PCP industry needs to self regulate to ensure
performance claims made in product advertisements are commensurate with benefits
delivered to consumers. The outlook of more stringent regulation governing usage of
active ingredients in personal care products implies the need to strengthen testing
capabilities to ensure adequate product safety especially for PCI players. Also, the
surging demand for green products calls for better product and application R&D
capabilities to use natural ingredients more effectively.
Multinational players with international brands have a strong presence in the Indian
formulation segment. Local brands too are gaining a foothold in the market by
innovatively developing value offerings to meet the unique needs of the Indian
consumer. Going ahead, it will be important to develop R&D capabilities to further
customize products for Indian consumers, create greater awareness among the
burgeoning middle class and ensure effective distribution reach to service them. The
companies that are able to develop a judicious mix of the above will be the eventual
winners.
The time is ripe to review one's strategy and come up with innovative approaches to
help realize the full potential of the Indian personal care sector, where the ingredients
market is likely to double in the next four years.
68 INDIACHEM GUJARAT 2009 69INDIACHEM GUJARAT 2009
Federation of Indian Chambers of Commerce and Industry
Tata Strategic Management Group is a leading management consulting firm in South
Asia. Set up in 1991, Tata Strategic has completed over 500 engagements with more
than 100 Clients across countries and industry sectors, addressing the business
concerns of the top management. We enhance client value by providing creative
strategy advice, developing innovative solutions and partnering effective
implementation.
About Tata Strategic Management Group
BusinessOptimization
Business Portfolio ReviewCompetitive & Growth Strategy, Country/India Entry Strategy
Business Due Diligence for M&A; Turnaround Strategy
StrategyFormulation
OrganizationEffectiveness
Design of Organization Structure & RolesPerformance & Talent Management
Capability Assessment & Development
PerformanceImprovement
Integrated Cost Reduction, Profit enhancementLogistics, Channel & Supply Chain Design
Business Process Improvement; Rightsizing
Input Cost OptimizationMarket Share improvement, Spend Optimization
Business Risk Management
ContactPratik Kadakia (Practice Head-Chemical & Energy)email: [email protected] [email protected]
Co-AuthorsAshwin RaoManjula SinghSiddhartha Gondal
Tata Strategic Management GroupNirmal, 18th Floor, Nariman PointMumbai-400021
Tel no. : 91-22-Fax no. : 91-22-66376600Website: www.tsmg.com
66376789
Established in 1927, FICCI is the largest and oldest apex business organisation in India.
Its history is closely interwoven with India's struggle for independence and its
subsequent emergence as one of the most rapidly growing economies globally. FICCI
plays a leading role in policy debates that are at the forefront of social, economic and
political change. Through its 400 professionals, FICCI is active in 38 sectors of the
economy. FICCI's stand on policy issues is sought out by think tanks, governments and
academia. Its publications are widely read for their in-depth research and policy
prescriptions. FICCI has joint business councils with 79 countries around the world.
A non-government, not-for-profit organisation, FICCI has direct membership from the
private as well as public sectors, including SMEs and MNCs. As an apex chamber, over
350 chambers of commerce and industry are our members; thus FICCI is the voice of
India's business and industry.
FICCI works closely with the government on policy issues, enhancing efficiency,
competitiveness and expanding business opportunities for industry through a range of
specialised services and global linkages. It also provides a platform for sector specific
consensus building and networking. Partnerships with over 350 chambers from across
the country carry forward our initiatives in inclusive development, which encompass
health, education, livelihood, governance, skill development, etc.
With 8 offices in India, overseas offices in the UK, USA, Singapore, etc. and institutional
partnerships with 211 counterpart organisations, FICCI serves as the first port of call
for Indian industry and the international business community.
About Commerce and Industry (FICCI)
Federation of Indian Chambers of
Mr. R K Bhatia (Head-
Federation House, 1 Tansen Marg, New Delhi-110 001Tel. : 91-11-23316540 (D)/23357350 (D)EPBX : 91-11-23738760-70 (Extn.395/474)Fax : 91-11-23320714/233721504
Chemicals & Pharmaceuticals Division, FICCI)
E-mail : [email protected]
(Assistant Director-Chemicals & Pharmaceuticals Division, FICCI)
E-mail : [email protected] Ms. Ranjita C Sood
Federation of Indian Chambers of Commerce and Industry

INDIACHEM GUJARAT 2009
Federation of Indian Chambers of Commerce and Industry
Mr. R K Bhatia (Head - Chemicals & Pharmaceuticals Division, FICCI)
Federation House, 1 Tansen MargNew Delhi-110 001
Tel. : 91-11-23316540 (D)/23357350 (D)EPBX : 91-11-23738760-70 (Extn.395/474)Fax : 91-11-23320714/233721504
E-mail : [email protected]
Ms. Ranjita C Sood (Asst. Director-Chemicals & Pharmaceuticals Division, FICCI)E-mail : [email protected]
Website : www.ficci.com
Pratik Kadakia (Practice Head - Chemical & Energy)E-mail : [email protected]
Abhishek Nigam E-mail : [email protected]
Nirmal, 18th Floor, Nariman PointMumbai-400021
Tel No. : 91-22-66376789Fax No. : 91-22-66376600Website : www.tsmg.com
Federation of Indian Chambers of Commerce and Industry