Embed Size (px)
Citation preview

1
India Cycle and Trend -J.J. Boillot 1
India: the Business cycle
and the Trendin a global perspective,
a European vision
Jean-Joseph Boillot Economist, co-founder of the EIEBG
India Cycle and Trend -J.J. Boillot 2
I- Is India entering a period of moderation or a cyclicalturnaround, and if so, what kind of landing can be expected?
1.1- Since the 1980s the global economy business cycles
2
India Cycle and Trend -J.J. Boillot 3
1.2- What single out the Indian business cycle after 2002,overheating or accelerating trend?
India Cycle and Trend -J.J. Boillot 4
1.3- Growth and Inflation in Indiathe two components: external and internal
3
India Cycle and Trend -J.J. Boillot 5
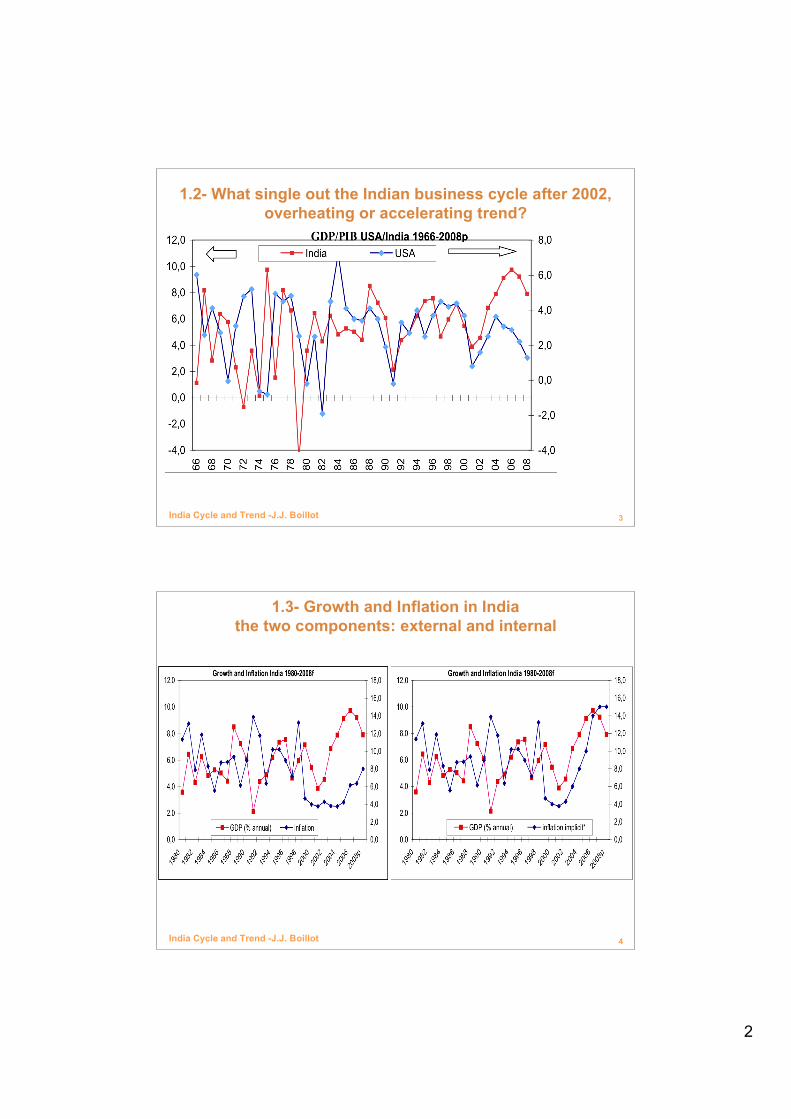
1.4- Overheating since 2006 as supported by JP Morgan
Monetary policy: Taylor rule prescriptions for policy rate changes from 4Q06eop to 2Q08eop
Potential Growth1
Average GDP
growth2
Change in output gap3
Change in core
inflation4
Change inTaylor rule5
Change in actualpolicy
rate6 Difference
(i) (ii)
(iii)=1.5*[(ii)-(i)] (iv) (v)=0.5*(iii)+1.5*(iv) (vi)
(vii)=(vi)-(v)
Emerging 6,0 7,3 1,9 1,2 2,8 0,7 -2,1
Latin America 3,8 4,7 1,3 0,4 1,2 0,2 -1,0
Brazil 3,5 5,4 2,8 0,1 1,5 -1,0 -2,5
Chile 4,8 4,5 -0,5 1,8 2,5 1,5 -1,0
Colombia 5,0 7,2 3,4 0,9 3,0 2,3 -0,7
Mexico 3,5 3,3 -0,3 0,4 0,4 0,7 0,3
Peru 7,0 9,2 3,3 0,4 2,3 1,3 -1,0
CEEMEA 5,5 6,2 1,0 1,6 2,9 1,1 -1,8
Czech Republic 4,6 6,1 2,3 3,3 6,1 1,3 -4,8
Hungary 3,0 1,5 -2,2 0,4 -0,6 0,5 1,1
Poland 5,5 6,5 1,5 1,6 3,1 2,0 -1,1
Russia 6,5 8,2 2,5 2,1 4,4 1,3 -3,2
Slovak Republic 6,0 9,6 5,4 0,4 3,3 -0,5 -3,8
South Africa 4,5 4,8 0,4 2,5 4,0 3,0 -1,0
Turkey7 5,5 4,2 -1,9 -0,2 -1,2 -1,3 0,0
Emerging Asia 7,1 8,7 2,4 1,4 3,4 0,8 -2,6
China 9,0 11,4 3,6 1,2 3,6 1,4 -2,3
India7 7,5 9,0 2,3 3,3 6,0 1,3 -4,8
Indonesia7 5,0 6,3 1,9 2,3 4,4 -1,3 -5,6
Korea 4,5 5,0 0,8 1,1 2,0 0,5 -1,5
Malaysia7 5,5 6,4 1,4 0,8 1,8 0,0 -1,8
Philippines 4,5 6,2 2,5 0,4 1,8 -2,3 -4,0
Taiwan 4,5 5,6 1,6 0,4 1,4 0,9 -0,5
Thailand 5,0 5,1 0,1 -0,6 -0,9 -1,8 -0,9
source: JP Morgan July 2008, Economic Research
India Cycle and Trend -J.J. Boillot 6
1.5- Reinforcing the forecast of a cyclical adjustment forthe period 2008-2015

4
India Cycle and Trend -J.J. Boillot 7
1.5- (2) Which fits well the previous Business Cycle
India Cycle and Trend -J.J. Boillot 8
1.5- (3)and shoudl lead to a stock market shockSensex updated october 2008

5
India Cycle and Trend -J.J. Boillot 9
I- Some conclusions
1/ There is not much doubt that the Indian economy was overheating by arather large margin since mid-2006 due to the combination of a very largeoverliquidity on the world economy, the new attraction of India as a fastgrowing economy and a huge untapped market.Just for 2007, inflows of foreign capital has been on the magnitude of almost 10% of theGDP and the credit growth have clearly overshoot till the peak of the expansionary orlaxist monetary policy in July 2007.
2/ But overheating and expansion phases are not that problematic in itself. LikeGreenspan put it but also the late A.O. Hirschman, they triggered economicforces which nobody can foresee and unleash expectations which act as aformidable driver of economic growth in terms of consumption and investment.“Imbalances growth” is quite often better than no growth or “artificially balanced growth”since it triggers forward and backward linkages which can restaure the required balanceslike only crowded roads tell you where are the shortages.
3/ So the major issue as Suman Bery put it is how to manage the cycle on theshort run and create the conditions to respond to the new constraints whichappeared during the boom.
India Cycle and Trend -J.J. Boillot 10
II- India 2025: Beyond growth, the ``Great Transformation``
GOLDMAN SACHS 03: WILSON Dominic, PURUSHOTHAMAN Roopa :Dreaming with BRICs: the path to 2050, Global Economics paper n° 99
GOLDMAN SACHS 07: India's Rising Growth Potential, Global EconomicsPaper No:152, January 22, 2007
Rodrick Dany and Subramanian Arvind (2004), « Why India Can Grow at 7Percent a Year or More: Projections and Reflections », IMF Working Paper
CEPII - Sandra PONCET, The Long Term Growth Prospects of the WorldEconomy : Horizon 2050, Document de travail CEPII, N° 2006-16 octobre 2006
Banque Mondiale, Global Economic Prospect 2007
And also: Deutsche Bank, PriceWaterCoopers, CLSA, McKinzey…..
Some available studies

6
India Cycle and Trend -J.J. Boillot 11
2.1- What could be the India 2025 GDPStandart economic model
All models use a Cobb-Douglas fonction ofProduction :•Y= GDP
•K = capital
•L= labor
•A= Technical Progress or Total Factor Productivity (TFP).
But :
1/ Specifications in the models are quite different
2/ Parameters also
)1( !! "= LKAY
India Cycle and Trend -J.J. Boillot 12
Puzzling results!
%
GDP TFP Capital Labor Edu I/GDP
CEPII (2050) 4,5 2,2 4,7 0,7 in PGF 20%
GS03 (2050) 5,7/7,4 4,6 1,9 in PGF 22%
GS07 (2020) 8,4 3,2 7,8 1,8 2 29%
(2020-50) 8,2 2,2 7,9 0,6 1,4 29%
Rodrick (2025) 6,7 2,5 8,3 1,9 sc +1pt 39%
BM (2030) 4,9
Annual rate of Growth
7
India Cycle and Trend -J.J. Boillot 13
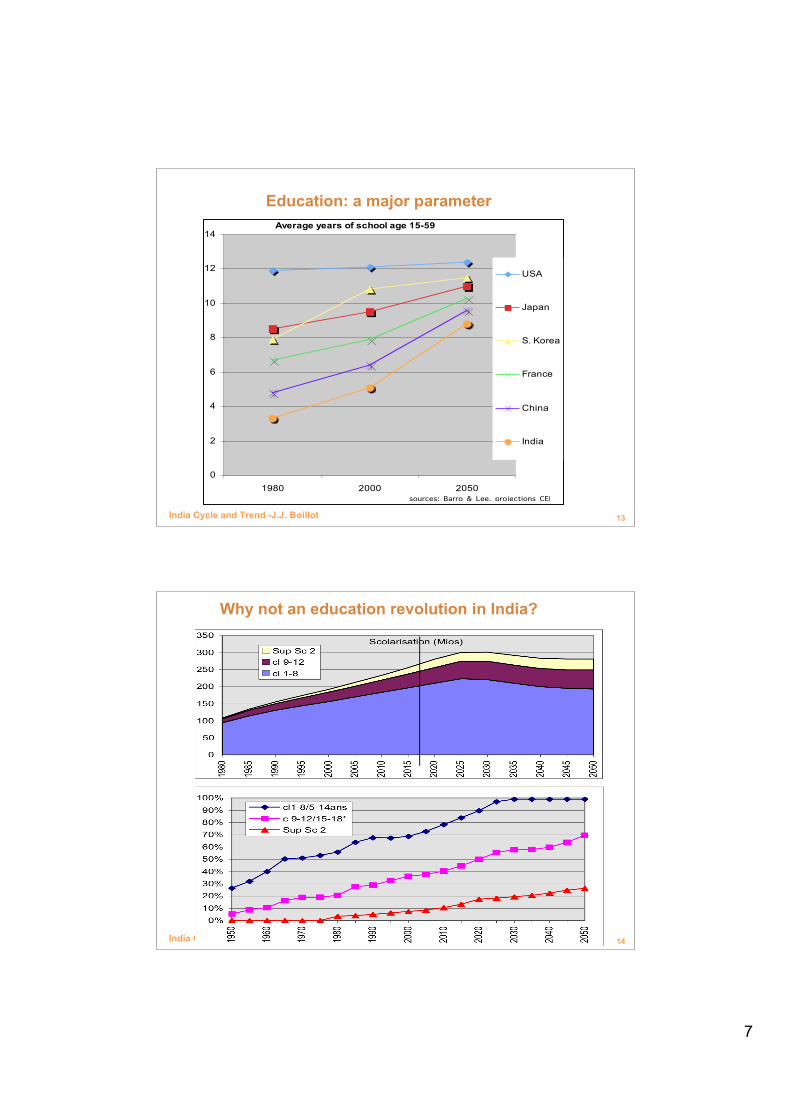
Education: a major parameter
0
2
4
6
8
10
12
14
1980 2000 2050
USA
Japan
S. Korea
France
China
India
Average years of school age 15-59
sources: Barro & Lee, projections CEPII
India Cycle and Trend -J.J. Boillot 14
Why not an education revolution in India?

8
India Cycle and Trend -J.J. Boillot 15
A 1st paradox of the « India laggard »
0
1 000
2 000
3 000
4 000
5 000
6 000
7 000
8 000
9 000
USA China India
2000 2050
Estimates of the total stock of human capital (M shcool years equiv.)
computed by JJ Boillot from Barro & Cepii
India Cycle and Trend -J.J. Boillot 16
Comparative results
GDP US China Japan Germany India India* France Brazil Monde
2005 11 100 2 300 5 190 1 840 671 671 1 400 615 36 294
2025 19 287 8 287 7 113 2 692 1 890 2 772 1 833 605 60 902
GDP/capita
2005 37 222 1 748 40 563 22 169 608 608 22 951 3 366 5 614
2025 55 091 5 749 58 486 33 647 1 354 1 986 29 097 2 644 7 704
Population Mios
2005 298 1 316 128 83 1 103 1 103 61 187 6 465
2025 350 1 441 122 80 1 395 1 395 63 229 7 905
GDP% World USA China Japan Germany India India* France Brazil Monde
2005 30,6% 6,3% 14,3% 5,1% 1,8% 1,8% 3,9% 1,7% 100%
2025 31,7% 13,6% 11,7% 4,4% 3,1% 4,6% 3,0% 1,0% 100%
GDP/capita USA=100
2005 100% 5% 109% 60% 2% 2% 62% 9% 15%
2025 100% 10% 106% 61% 2% 4% 53% 5% 14%
Pop % Monde
2005 5% 20% 2% 1% 17% 17% 1% 3% 100%
2025 4% 18% 2% 1% 18% 18% 1% 3% 100%
Croiss. val/an 2,8 6,6 1,6 1,9 5,3 7,4 1,4 -0,1
Projection 2025 in Bn USD (current US $ and current relative prices base 2000)
9
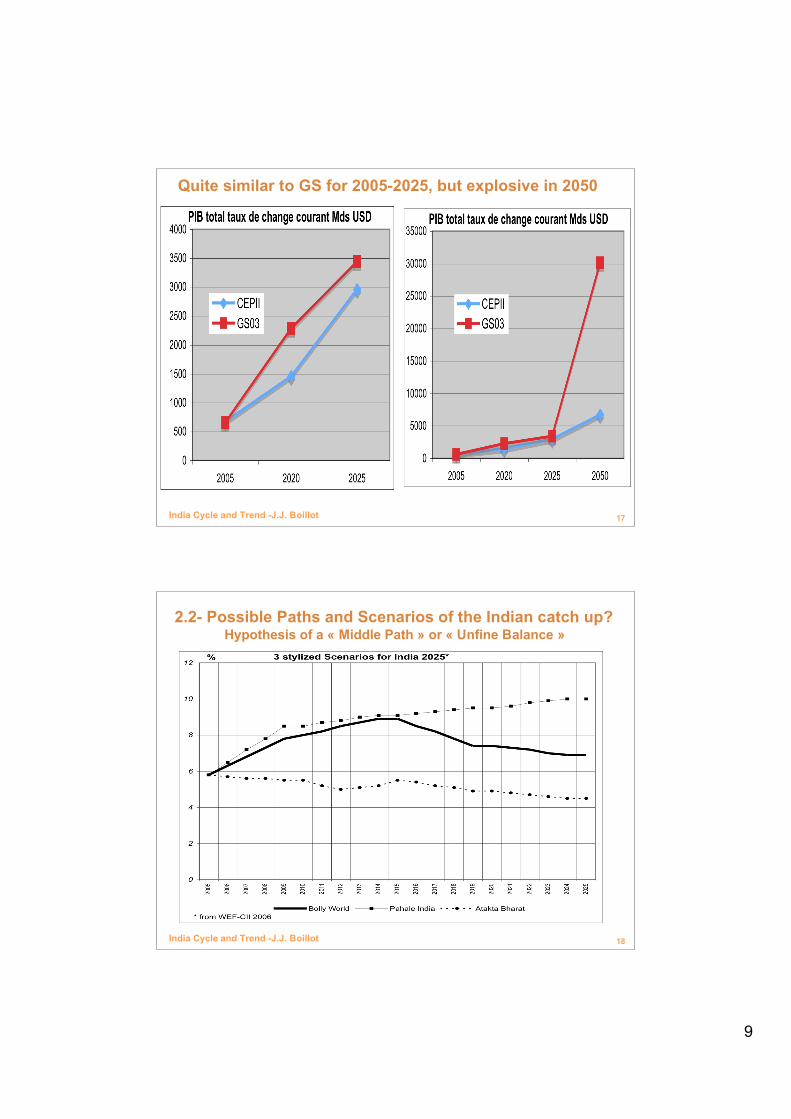
India Cycle and Trend -J.J. Boillot 17
Quite similar to GS for 2005-2025, but explosive in 2050
India Cycle and Trend -J.J. Boillot 18
2.2- Possible Paths and Scenarios of the Indian catch up?Hypothesis of a « Middle Path » or « Unfine Balance »

10
India Cycle and Trend -J.J. Boillot 19
2.3- What economic power for India in 2025?Not so macroeconomically
0
10 000
20 000
30 000
40 000
50 000
60 000
70 000
US
China
Japan
Germany
India
India*
France
Brazil
2005
2025
GDP/capita 2025 at current price and exchange rate in USD
0
5 000
10 000
15 000
20 000
25 000
US
China
Japan
Germany
India
India*
France
Brazil
2005
2025
GDP 2025 at current price and exchange rate Bn$
India Cycle and Trend -J.J. Boillot 20
Comparative Value at the world level can be tracked by: share in the world current GDP & International Trade
Reste du
Monde
Inde
Chindia
Chine
0%
5%
10%
15%
20%
25%
30%
35%
USA
China
Japan
Germany
India
India*
France
Brazil
2005 2025
Share in the World GDP at current exchange rate
* 2nd scenario India GS value + CEPII exchange rate valorisation
Share of the World Trade in 2025

11
India Cycle and Trend -J.J. Boillot 21
And a more Multipolar World in GDP and Population
0
1 000
2 000
3 000
4 000
5 000
6 000
7 000
8 000
9 000
2005 2015 2025
Africa
Latin America
Middle East
India
Other Asia
China
Eastern Europe
FSU
OECD Pacif ic
OECD Europe
OECD North
America
World Population in Billion
0
10 000
20 000
30 000
40 000
50 000
60 000
70 000
80 000
90 000
100 000
2005 2015 2025
Africa
Latin America
Middle East
India
Other Asia
China
Eastern Europe
FSU
OECD Pacif ic
OECD Europe
OECD North
America
GDP Trillion USD PPP
India Cycle and Trend -J.J. Boillot 22
2.3- (2) But in some sectors domestically …

12
India Cycle and Trend -J.J. Boillot 23
2.3- (3a) and Take care of New Comers in Human capitalthe strange story of rising India replacing China
% World population 1950-2050
India Cycle and Trend -J.J. Boillot 24
2.3- (3b) … more so with the 15-24 age group
13
India Cycle and Trend -J.J. Boillot 25
Even shortly before 2025
India Cycle and Trend -J.J. Boillot 26
2.3 (4)- Much more importantly, India is getting into its« Great Transformation »
1/ Paradox : global picture moving only gradually and nevertheless impressionof a huge take-off
3/ Small relative change indicates large transformations coming. Yes, 1 millionYoung Professionals weight as much as 200 million farmers!
4/ The Size effect of India (as for China) makes small relative change hugepotential impact on the world stage, ie : 1/3 of the coming global young laborforce in 2025
2/ Characterize the « Big Transformations » historically experienced by mostdevelopped countries (see France of la Belle époque in 1900)

14
India Cycle and Trend -J.J. Boillot 27
1/ Transformation of the GDP StructureThe silent révolution of services pulling industrialisation, urbanisation,education, feminisation and globalisation of India
0%
25%
50%
75%
100%
1950
1990
2005
2015
2025
Services
IndustryAgriculture
GDP at current prices %
0%
25%
50%
75%
100%
1950
1990
2005
2015
2025
Services
IndustryAgriculture
Structure of the Labor Force %
India Cycle and Trend -J.J. Boillot 28
2/ The huge Employment TransformationHalf of the jobs will be New (wage class) and the number of farmers
will remain stable only apparently
0
100
200
300
400
500
600
700
800
2005 2010 2015 2020 2025
9. Social services
8. Finance & Real
estate
7. Transport &
communication
6. Trade & Hotel-
restaurant
5. Construction
4. Electricity, Gas &
Water
3. Manufacture
2. Mines & Carriers
1. Agriculture
Sectoral Employement in India around 2015 (million workers)
source: Planning Commission 2004

15
India Cycle and Trend -J.J. Boillot 29
3/ Youth RevolutionThe Peak of 2025. Not only economy but social values
India Cycle and Trend -J.J. Boillot 30
The Turning Point of 2025: window is closing!

16
India Cycle and Trend -J.J. Boillot 31
4/ FeminisationOn serait en 2025 proche du niveau chinois (45% de la PA)
India Cycle and Trend -J.J. Boillot 32
5/ UrbanisationThe Paradox of the double Rise: conflicting or vertuous trend?
0%
5%
10%
15%
20%
25%
30%
35%
40%
1951 1961 1971 1981 1991 2001 2026
0
100
200
300
400
500
600
700
800
900
1000
Urbans %
Rurals in Mios
Relative Share of Urbans and numbers of Rurals (million)
Source : Twenty First Century, India op.cité

17
India Cycle and Trend -J.J. Boillot 33
6/ RetailThe retail revolution and the 150 cities target (source: Technopak)
India Cycle and Trend -J.J. Boillot 34
18
India Cycle and Trend -J.J. Boillot 35
India Cycle and Trend -J.J. Boillot 36
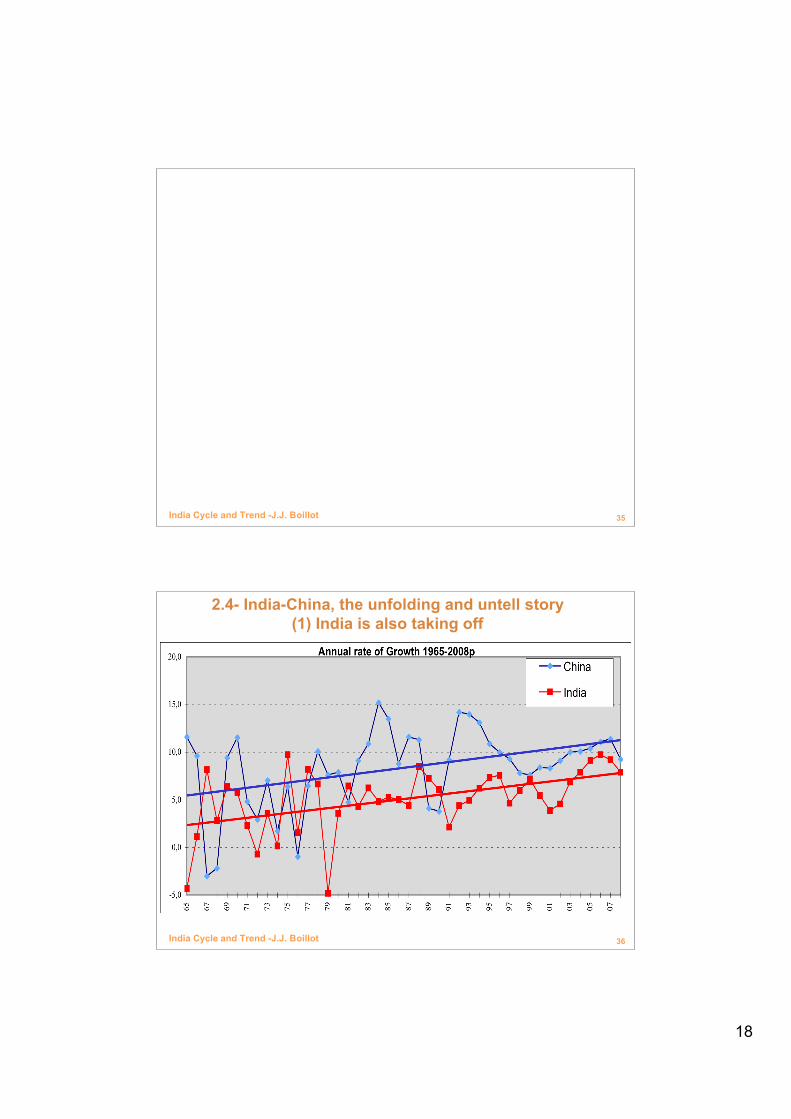
2.4- India-China, the unfolding and untell story(1) India is also taking off

19
India Cycle and Trend -J.J. Boillot 37
2.4- (2) … But small differences make big gap!
PIB indien et chinois base 1 en 1960
1
6
11
16
21
26
31
36
41
46
51
60
65
70
75
80
85
90
95 0 5
10
15
Chine Inde
India Cycle and Trend -J.J. Boillot 38
… even if time could play in favor of India in the long run
CHINA: annual rate of growth totaland active population
-1,5
-1,0
-0,5
0,0
0,5
1,0
1,5
2,0
2,5
3,0
3,5
1950-55 1960-65 1970-75 1980-85 1990-95 2000-05 2010-15 2020-25 2030-35 2040-45
Total Pop
old 15-59
: INDIA: annual rate of growth total
and active population
1950-55 1960-65 1970-75 1980-85 1990-95 2000-05 2010-15 2020-25 2030-35 2040-45
-0,5
0,0
0,5
1,0
1,5
2,0
2,5
3,0Total Pop
old15-59

20
India Cycle and Trend -J.J. Boillot 39
… but demographic transition is not economic transition still China much ahead in term of urban working population
0,0
0,1
0,2
0,3
0,4
0,5
0,6
0,7
0,8
0,9
1,01990
1995
2000
2005
2010
2015
2020
2025
Mds d
e p
ers
onnes
Inde 15-59 ans Chine 15-59 ans
Inde Emplois urbains Chine Emplois Urbains
India Cycle and Trend -J.J. Boillot 40
2.4- (3a) Difficult to buy the CHINDIA story …
21
India Cycle and Trend -J.J. Boillot 41
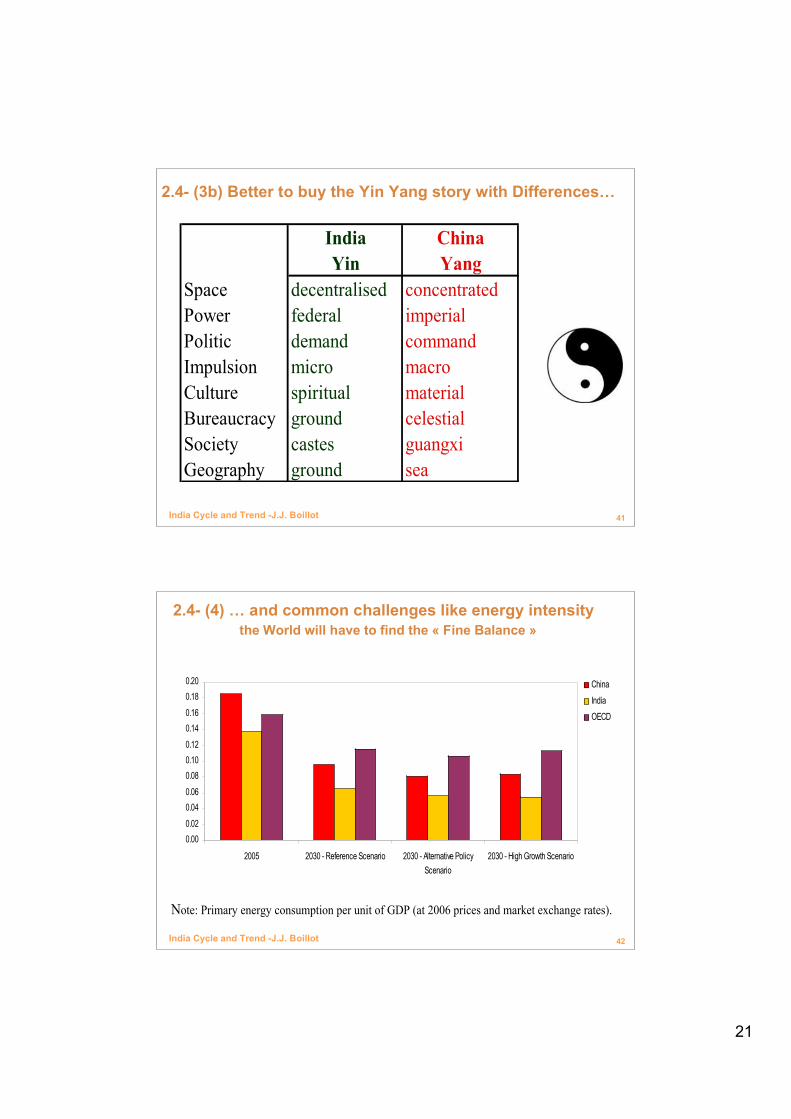
2.4- (3b) Better to buy the Yin Yang story with Differences…
India China
Yin Yang
Space decentralised concentrated
Power federal imperial
Politic demand command
Impulsion micro macro
Culture spiritual material
Bureaucracy ground celestial
Society castes guangxi
Geography ground sea
India Cycle and Trend -J.J. Boillot 42
2.4- (4) … and common challenges like energy intensity the World will have to find the « Fine Balance »
0.00
0.02
0.04
0.06
0.08
0.10
0.12
0.14
0.16
0.18
0.20
2005 2030 - Reference Scenario 2030 - Alternative Policy
Scenario
2030 - High Growth Scenario
China
India
OECD
Note: Primary energy consumption per unit of GDP (at 2006 prices and market exchange rates).