Embed Size (px)
Citation preview

1
Environmental Systems Products Holdings Inc.
Presented to ARAI on March 18th/19th, 2004Dr. Donald Stedman, Niranjan Vescio, Gary Full

2
Agenda
Instrumentation – Gary FullRSD Gas Calculations – Dr. StedmanSummary Statistics – Dr. Stedman2-Wheeler Improvement – Gary FullOther Discussion - All

3
RSD4000 Technology Device Measurement Overview
Presented by Gary Full
4
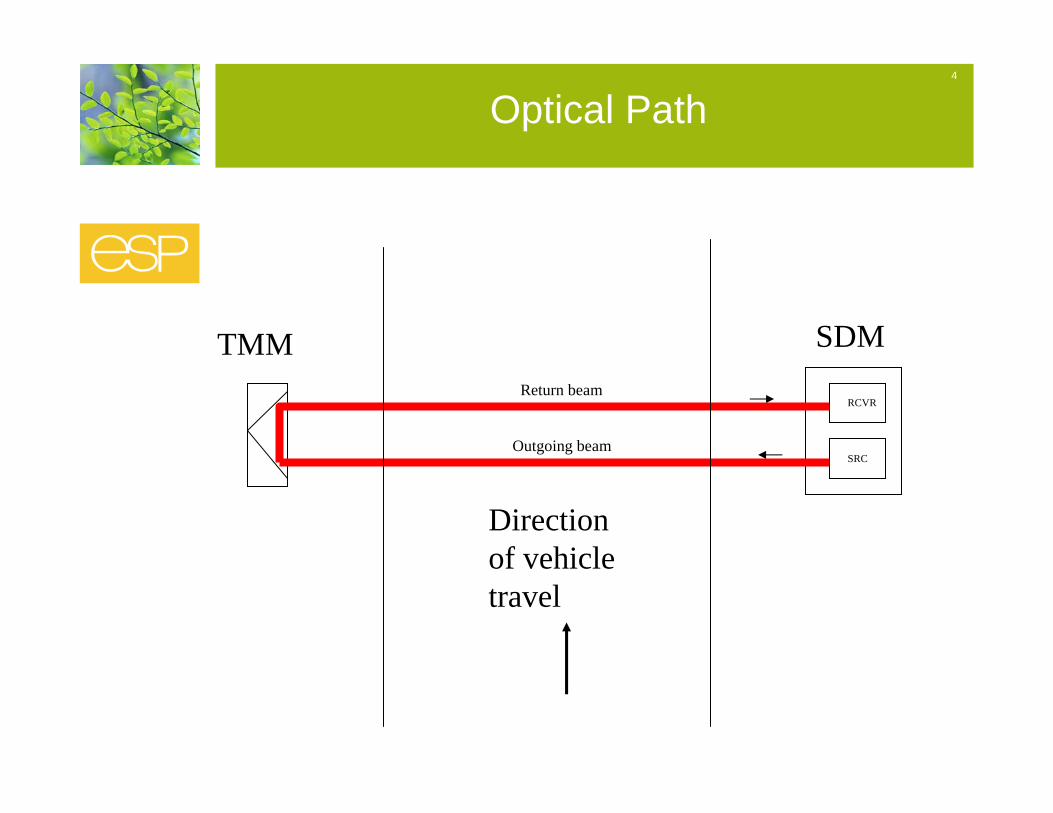
Optical Path
RCVR
SRC
SDMTMM
Direction of vehicle travel
Outgoing beam
Return beam
5
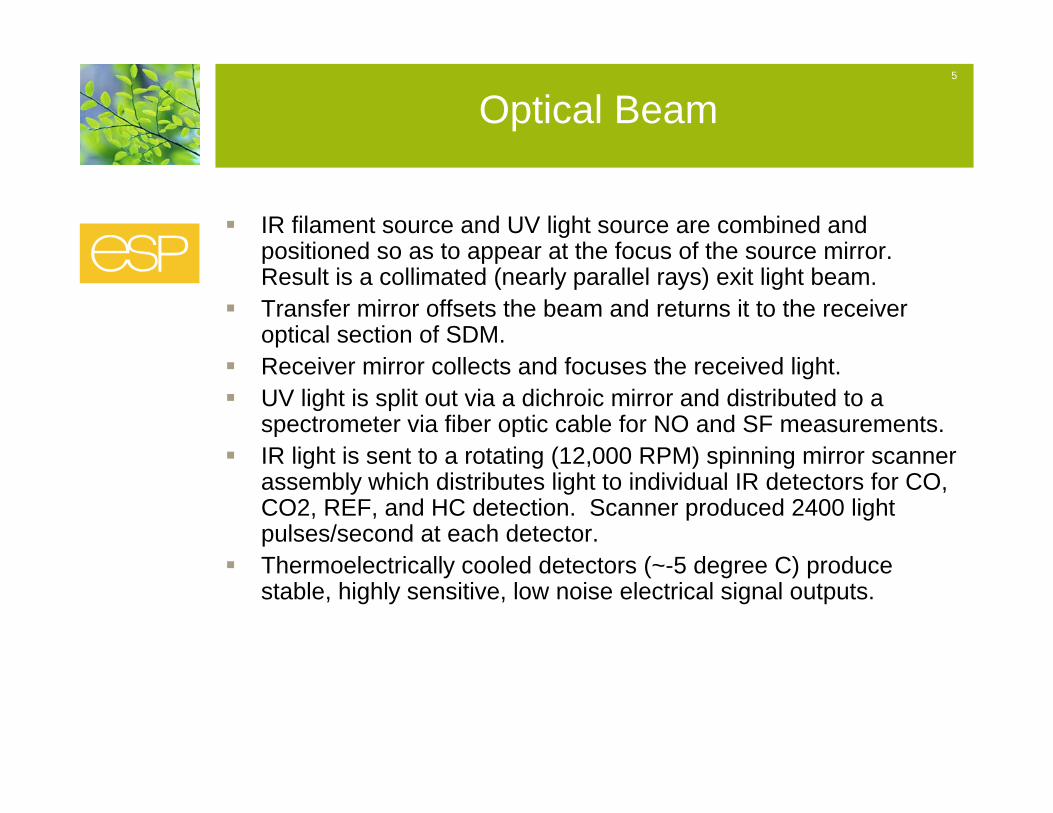
Optical Beam
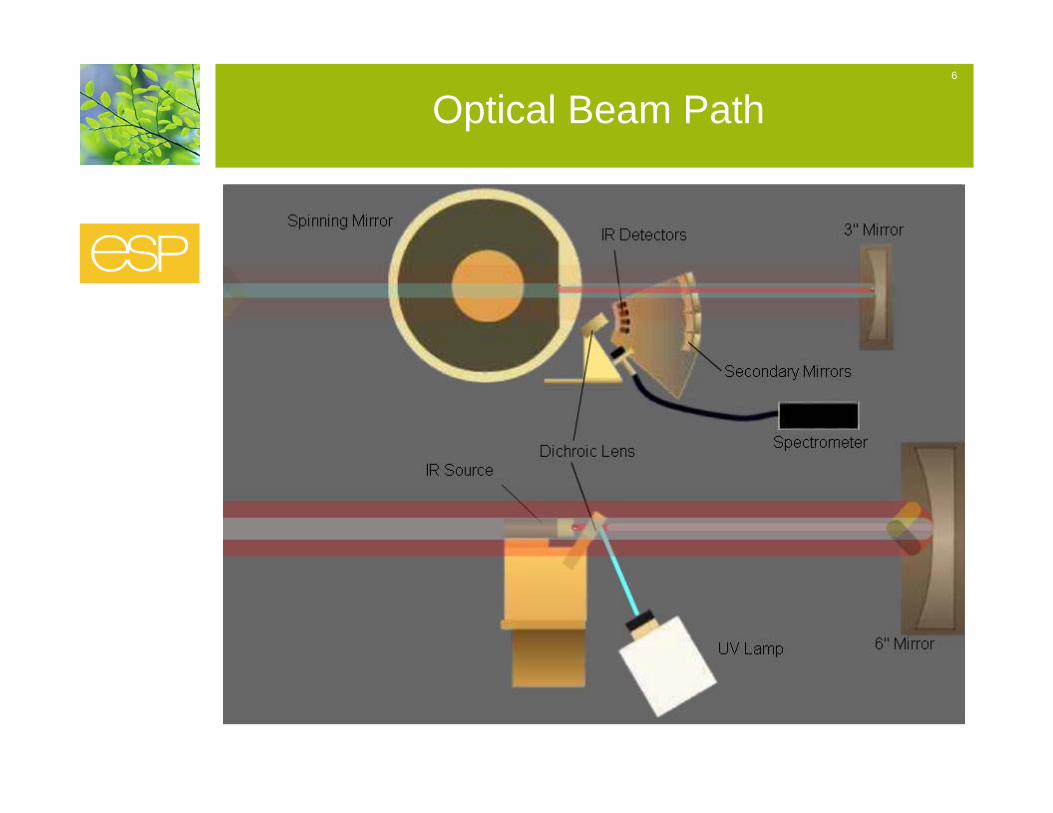
IR filament source and UV light source are combined and positioned so as to appear at the focus of the source mirror. Result is a collimated (nearly parallel rays) exit light beam.Transfer mirror offsets the beam and returns it to the receiver optical section of SDM.Receiver mirror collects and focuses the received light.UV light is split out via a dichroic mirror and distributed to aspectrometer via fiber optic cable for NO and SF measurements.IR light is sent to a rotating (12,000 RPM) spinning mirror scanner assembly which distributes light to individual IR detectors for CO, CO2, REF, and HC detection. Scanner produced 2400 light pulses/second at each detector.Thermoelectrically cooled detectors (~-5 degree C) produce stable, highly sensitive, low noise electrical signal outputs.
6
Optical Beam Path
7
Signal Conditioning/Firmware
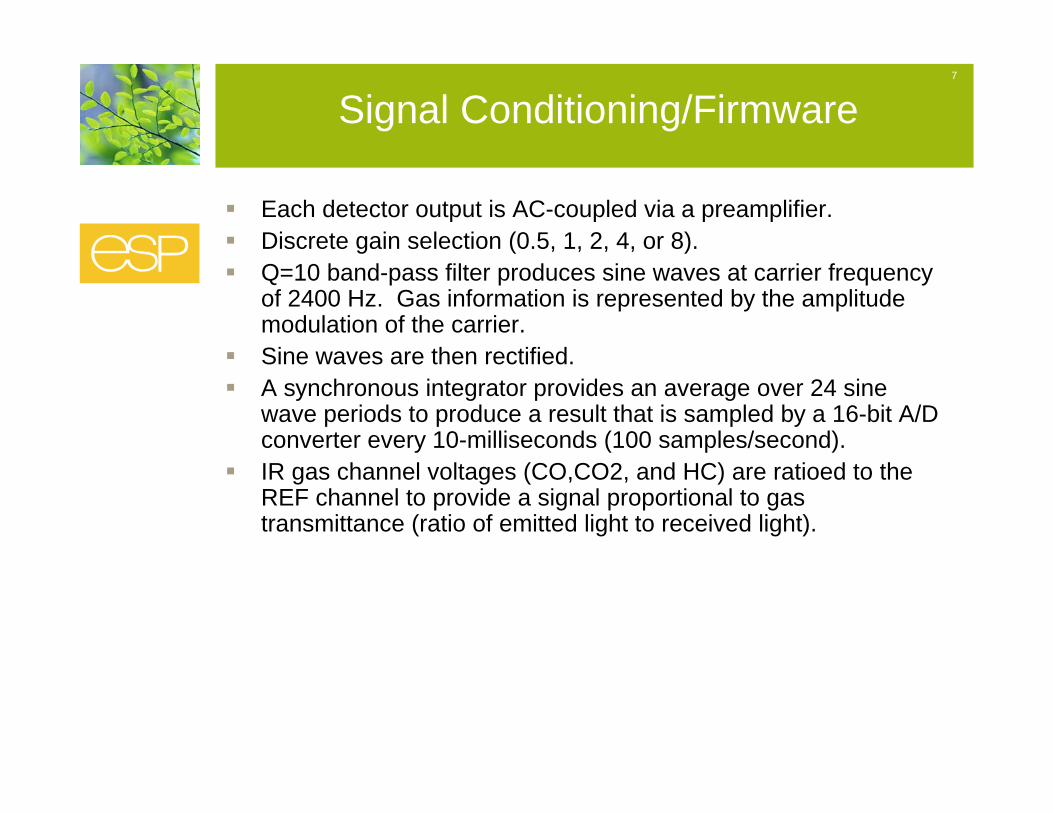
Each detector output is AC-coupled via a preamplifier.Discrete gain selection (0.5, 1, 2, 4, or 8).Q=10 band-pass filter produces sine waves at carrier frequency of 2400 Hz. Gas information is represented by the amplitude modulation of the carrier.Sine waves are then rectified.A synchronous integrator provides an average over 24 sine wave periods to produce a result that is sampled by a 16-bit A/D converter every 10-milliseconds (100 samples/second).IR gas channel voltages (CO,CO2, and HC) are ratioed to the REF channel to provide a signal proportional to gas transmittance (ratio of emitted light to received light).
8
Gas Measurement Processing
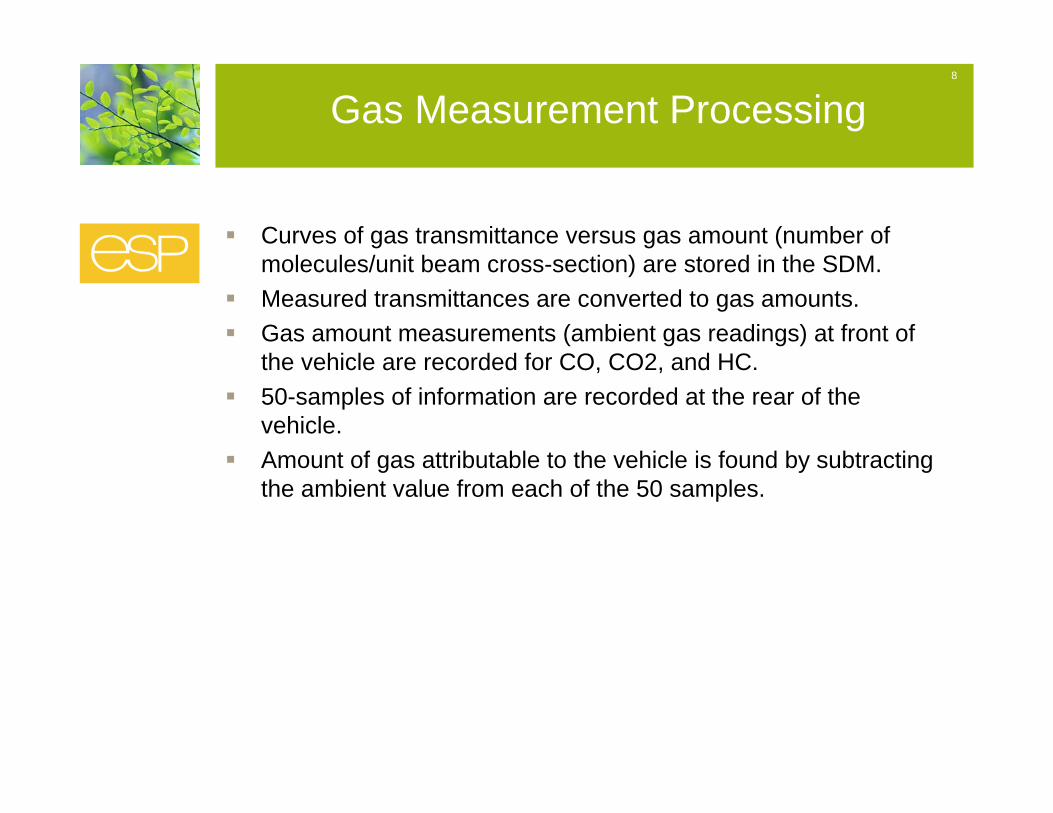
Curves of gas transmittance versus gas amount (number of molecules/unit beam cross-section) are stored in the SDM.Measured transmittances are converted to gas amounts.Gas amount measurements (ambient gas readings) at front of the vehicle are recorded for CO, CO2, and HC.50-samples of information are recorded at the rear of the vehicle.Amount of gas attributable to the vehicle is found by subtracting the ambient value from each of the 50 samples.
9
0.2 0.25 0.3 0.35 0.4 0.45 0.5 0.55 0.6 0.65 0.7 0.75 0.8 0.8550
0
50
100
150
200
250
300
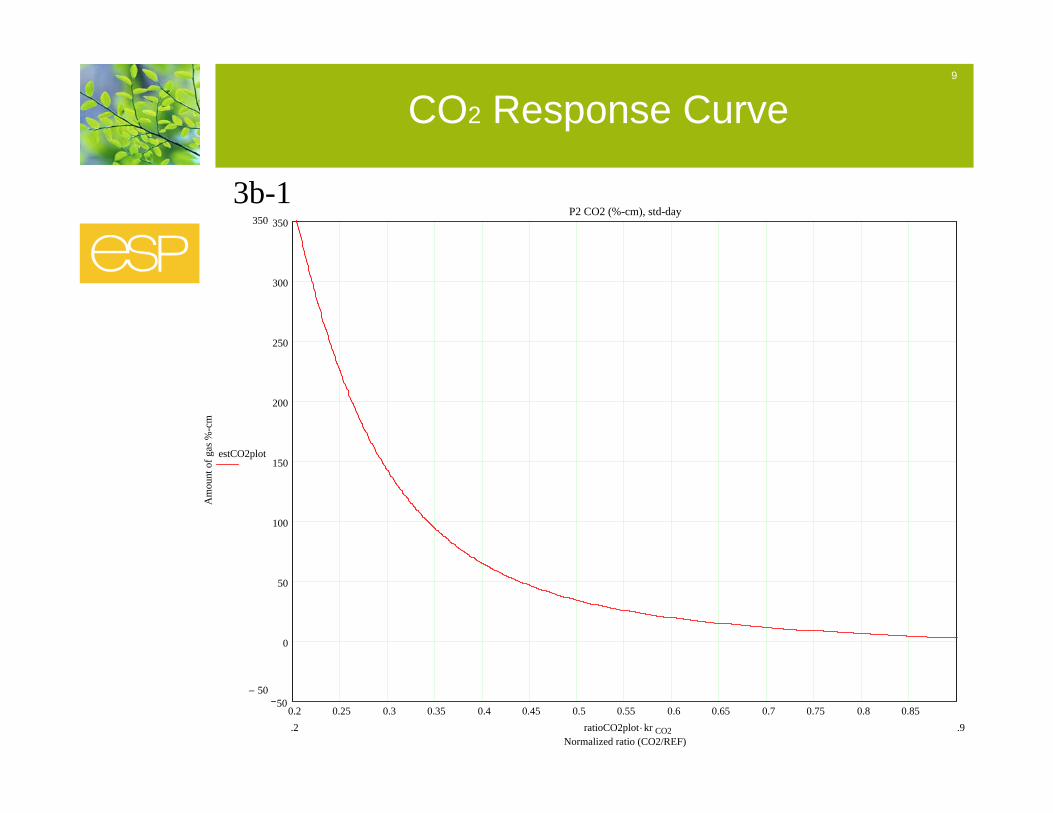
350P2 CO2 (%-cm), std-day
Normalized ratio (CO2/REF)
Am
ount
of g
as %
-cm
350
50−
estCO2plot
.9.2 ratioCO2plot kr CO2⋅
3b-1
CO2 Response Curve
10
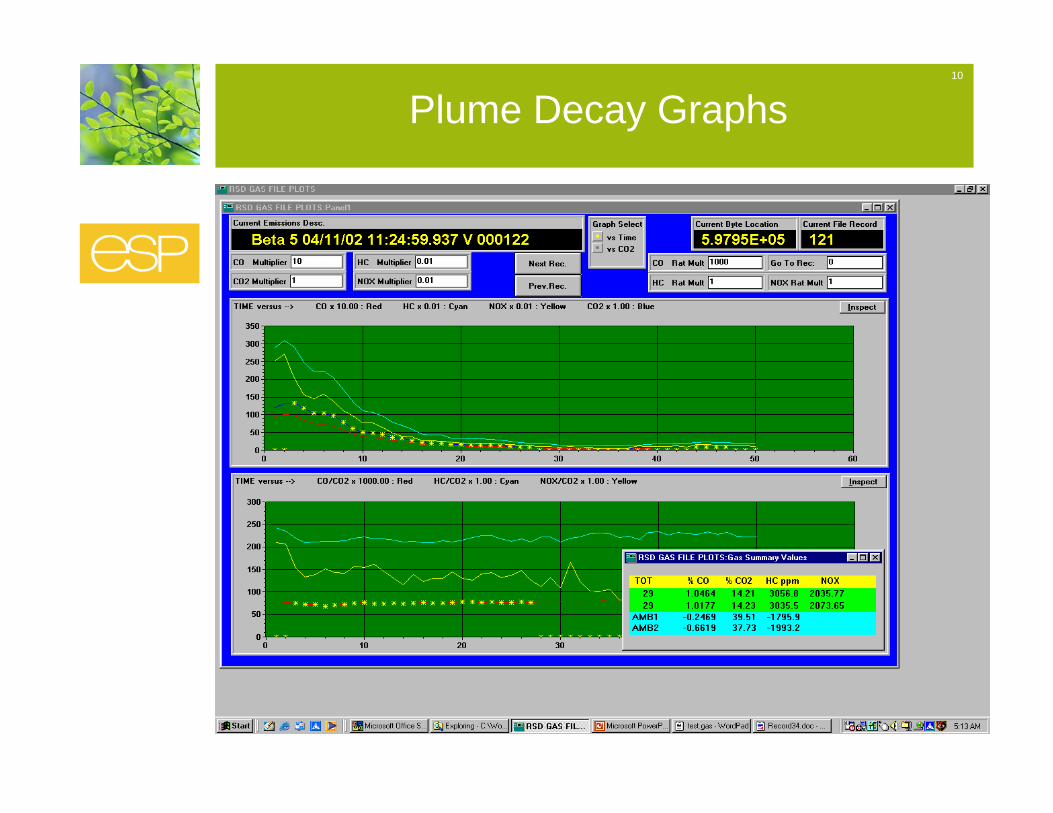
Plume Decay Graphs
11
Gas Measurement Processing continued
Aggregate gas ratios (a single value for the possible 50 point sets) are calculated for CO/CO2, HC/CO2, and NO/CO2. The aggregate values are least squares linear regression fits of thegas value array with respect to the CO2 array. E.g. CO array versus CO2 array. For the aggregate slope calculations we reject data points immediately before and after beam blocks/unblocks, and where the sum of the gas amounts are below a threshold.We consider a gas measurement “valid” if there are at least 5-points available in the slope calculation – “invalid” otherwise.
12
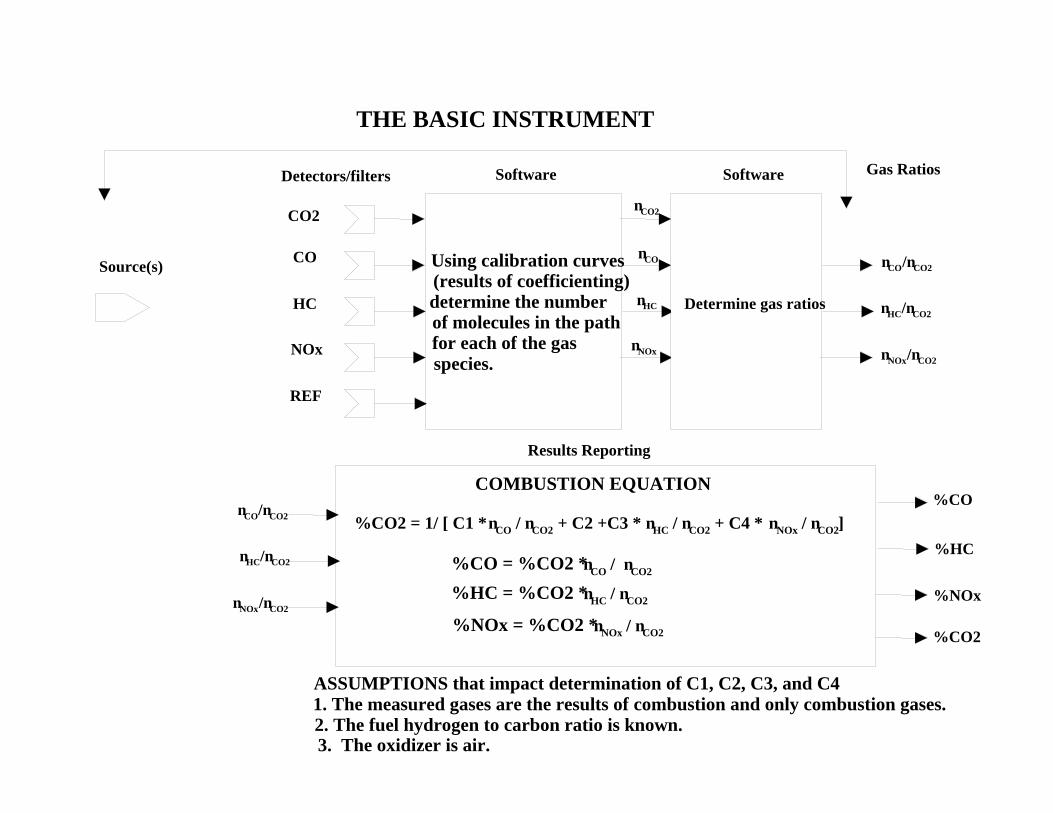
Source(s)
Detectors/filters
CO2
CO
HC
NOx
REF
Using calibration curves(results of coefficienting)determine the numberof molecules in the pathfor each of the gas species.
nCO2
nCO
nHC
nNOx
Determine gas ratios
nCO/nCO2
nHC/nCO2
nNOx/nCO2
THE BASIC INSTRUMENT
Software Software Gas Ratios
Results Reporting
nCO/nCO2
nHC/nCO2
nNOx/nCO2
%CO
%CO2
%HC
%NOx
COMBUSTION EQUATION
%CO2 = 1/ [ C1 * nCO / nCO2 + C2 +C3 * nHC / nCO2 + C4 * nNOx / nCO2]
%CO = %CO2 * nCO / nCO2
%HC = %CO2 * nHC / nCO2
%NOx = %CO2 * nNOx / nCO2
ASSUMPTIONS that impact determination of C1, C2, C3, and C41. The measured gases are the results of combustion and only combustion gases.2. The fuel hydrogen to carbon ratio is known.3. The oxidizer is air.
13
Gas Measurement Processing continued
We also report “stoichiometric” (meaning the concentration that would be measured by a tail pipe probe if there were no excess air in the exhaust beyond what is needed for combustion) gas concentrations. These gas concentrations are the result of combustion chemistry where the basic assumptions are that the aggregate carbon to hydrogen content of the fuel is known and that air is the oxidizer in the combustion process.
14
Other RSD Subsystems/Options
Speed/accelerationVehicle/license plate pictureWeather measurementGPS for time base as well as positionWireless communications links- 300 meters- Cellular links
PC storage and transfer media“Smart” Signs / motorist displays

15
RSD Calculations
Presented by Dr. Donald Stedman
16
On-road Results from Denver
Sept 2003
Slides prepared by Donald H. Stedman, March 18, 2004 for ESPwww.feat.biochem.du.edu
17
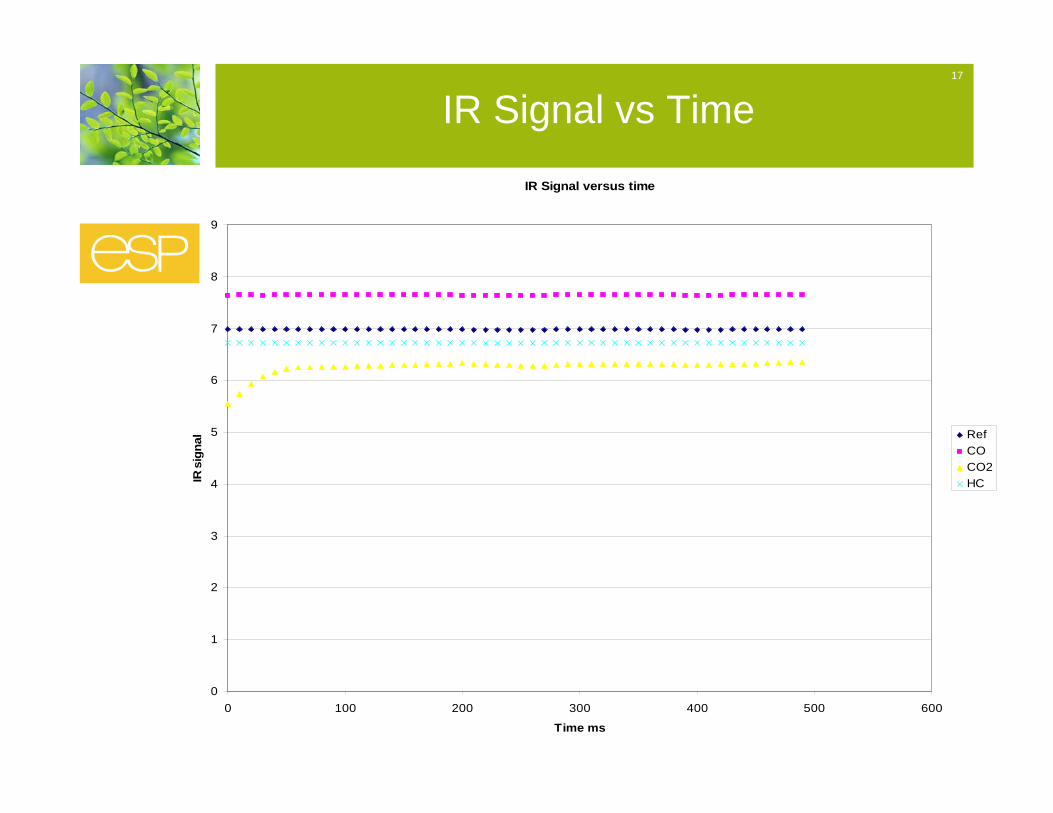
IR Signal versus time
0
1
2
3
4
5
6
7
8
9
0 100 200 300 400 500 600
Time ms
IR s
igna
l RefCOCO2HC
IR Signal vs Time
18
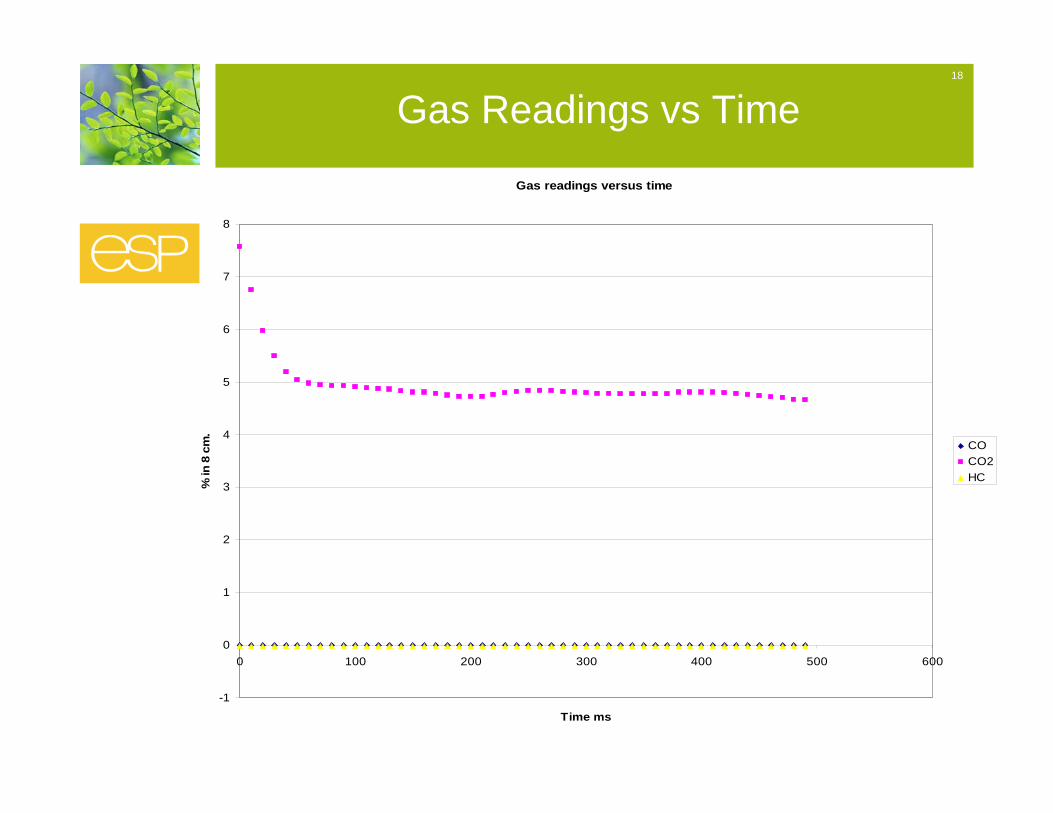
Gas readings versus time
-1
0
1
2
3
4
5
6
7
8
0 100 200 300 400 500 600
Time ms
% in
8 c
m.
COCO2HC
Gas Readings vs Time

19
CO versus CO2
-0.1
-0.08
-0.06
-0.04
-0.02
0
0.02
0.04
0.06
0.08
0.1
0 1 2 3 4 5 6 7 8
CO2
CO
CO vs CO2
20
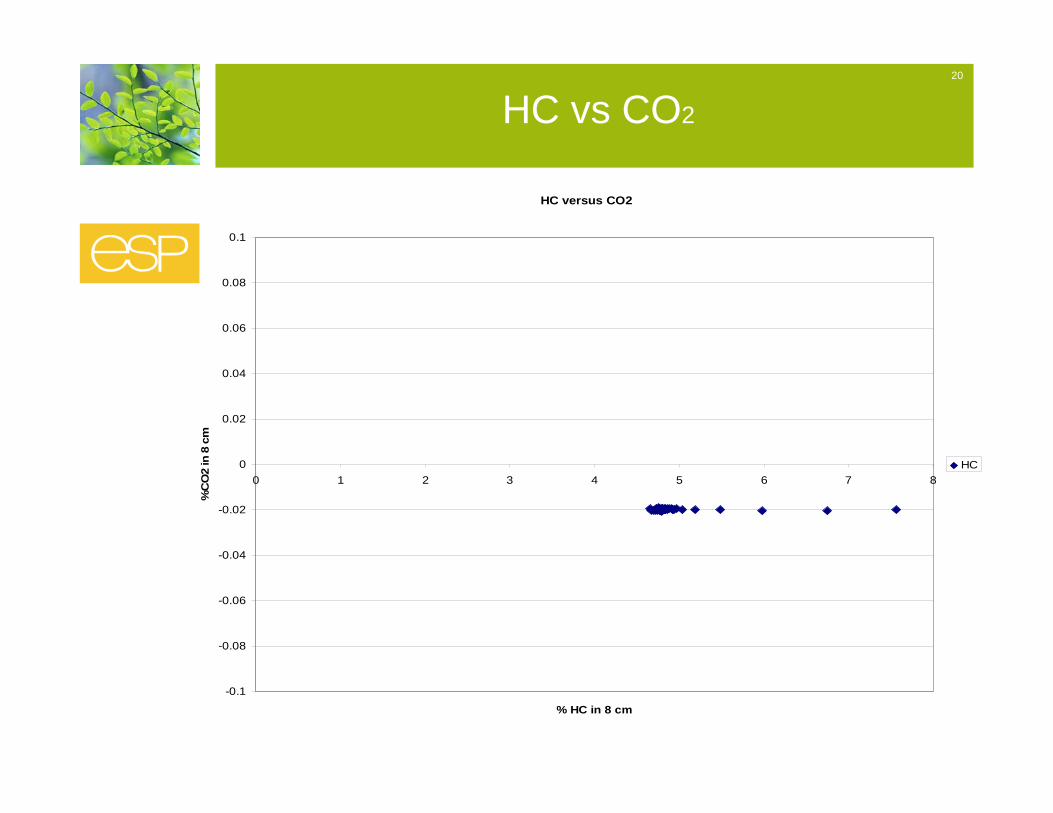
HC versus CO2
-0.1
-0.08
-0.06
-0.04
-0.02
0
0.02
0.04
0.06
0.08
0.1
0 1 2 3 4 5 6 7 8
% HC in 8 cm
%C
O2
in 8
cm
HC
HC vs CO2
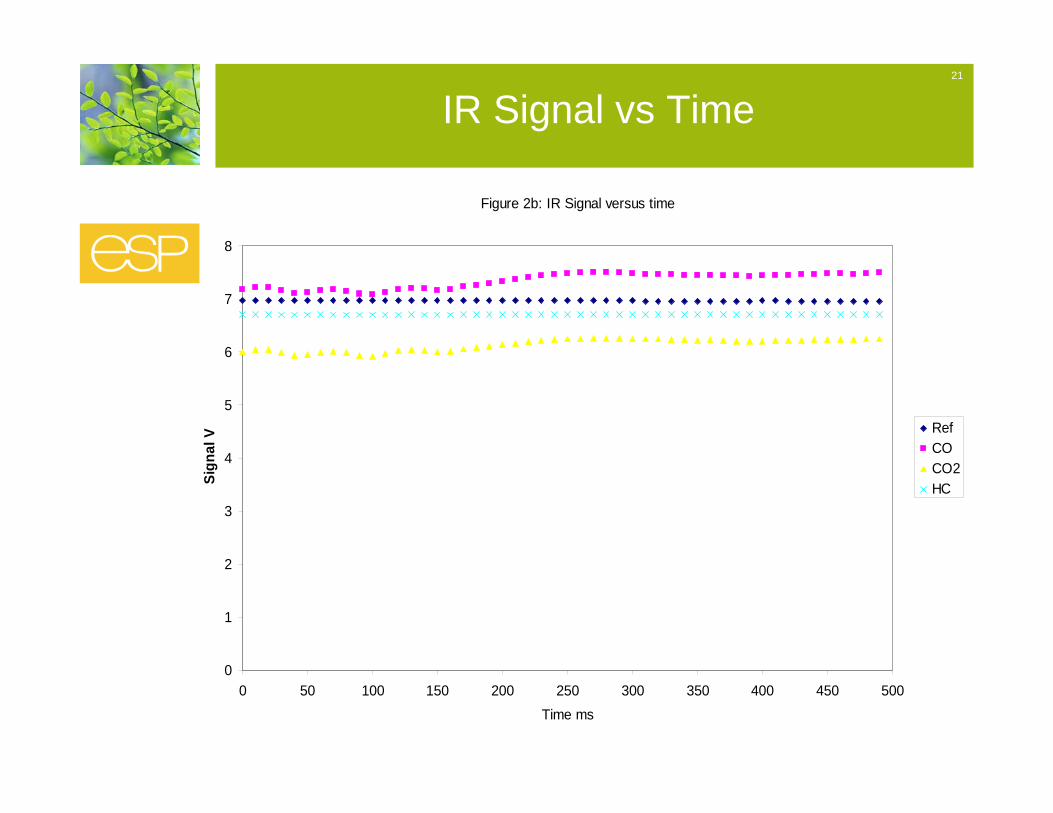
21
Figure 2b: IR Signal versus time
0
1
2
3
4
5
6
7
8
0 50 100 150 200 250 300 350 400 450 500Time ms
Sig
nal V
RefCOCO2HC
IR Signal vs Time
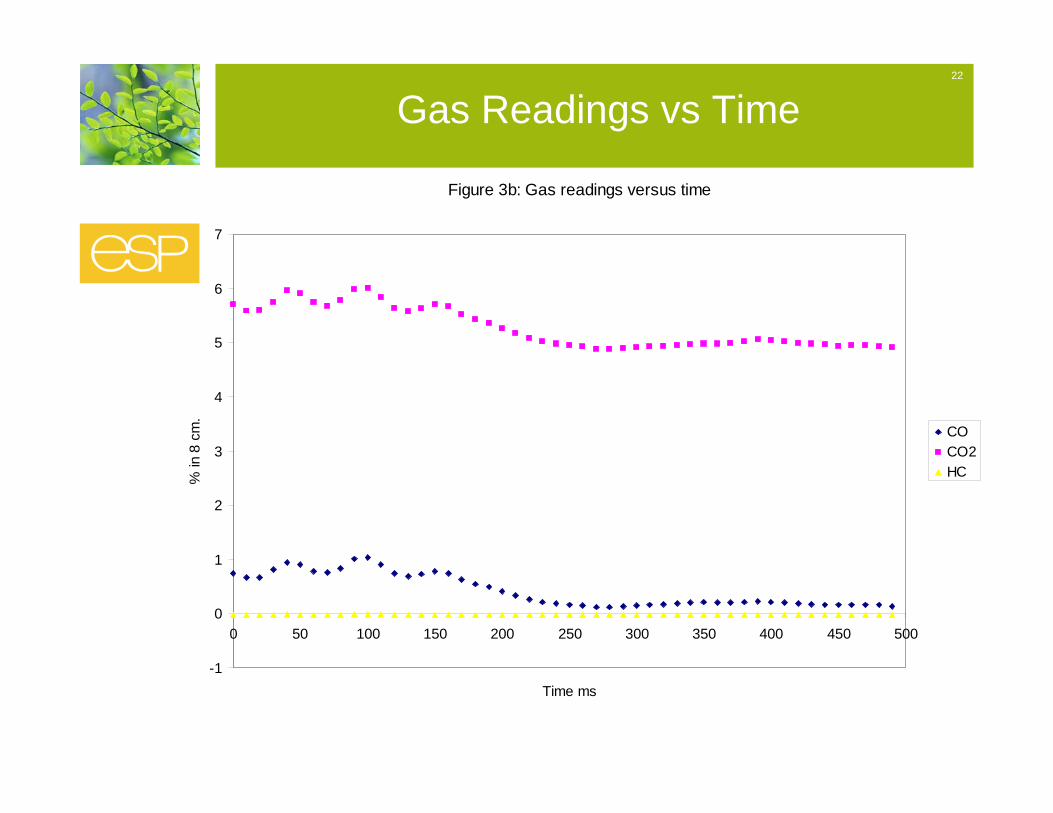
22
Figure 3b: Gas readings versus time
-1
0
1
2
3
4
5
6
7
0 50 100 150 200 250 300 350 400 450 500
Time ms
% in
8 c
m.
COCO2HC
Gas Readings vs Time
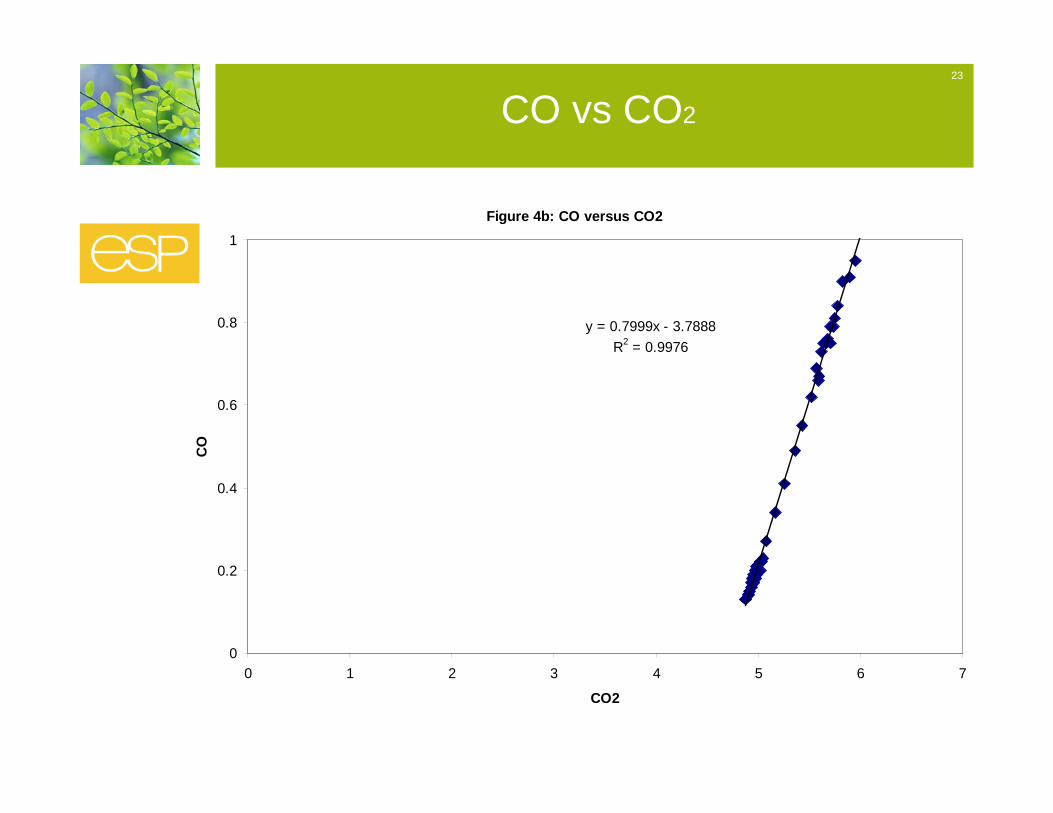
23
Figure 4b: CO versus CO2
y = 0.7999x - 3.7888R2 = 0.9976
0
0.2
0.4
0.6
0.8
1
0 1 2 3 4 5 6 7
CO2
CO
CO vs CO2
24
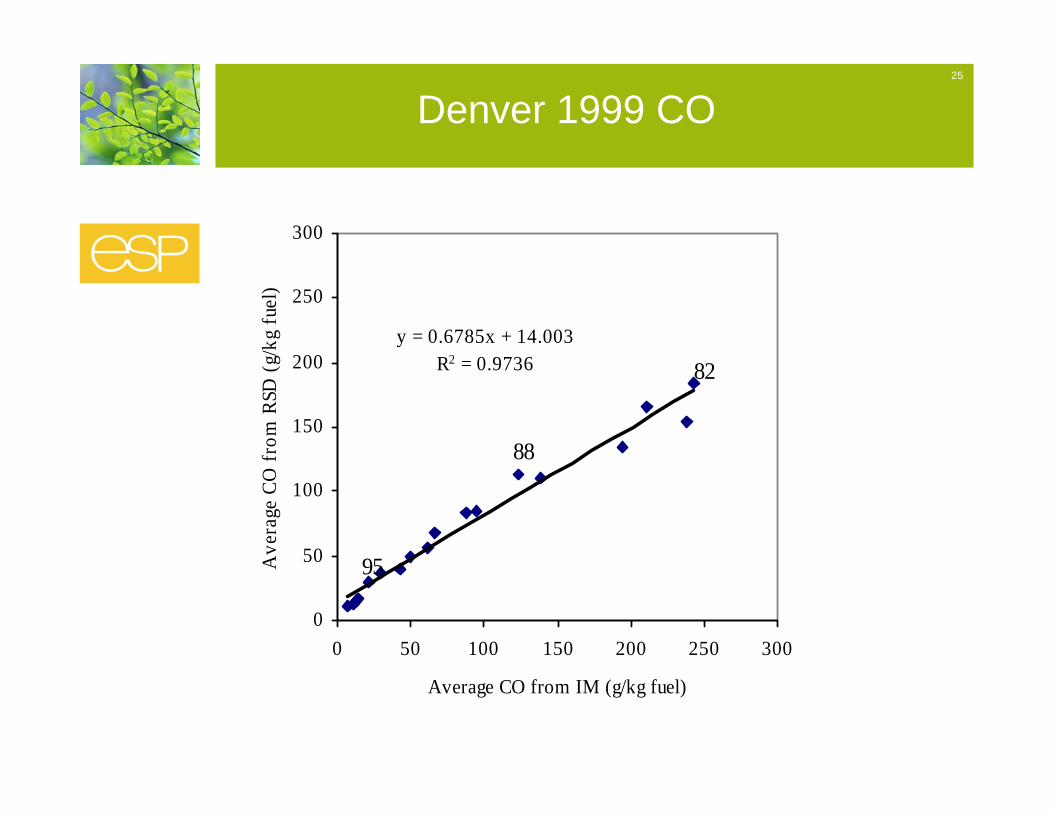
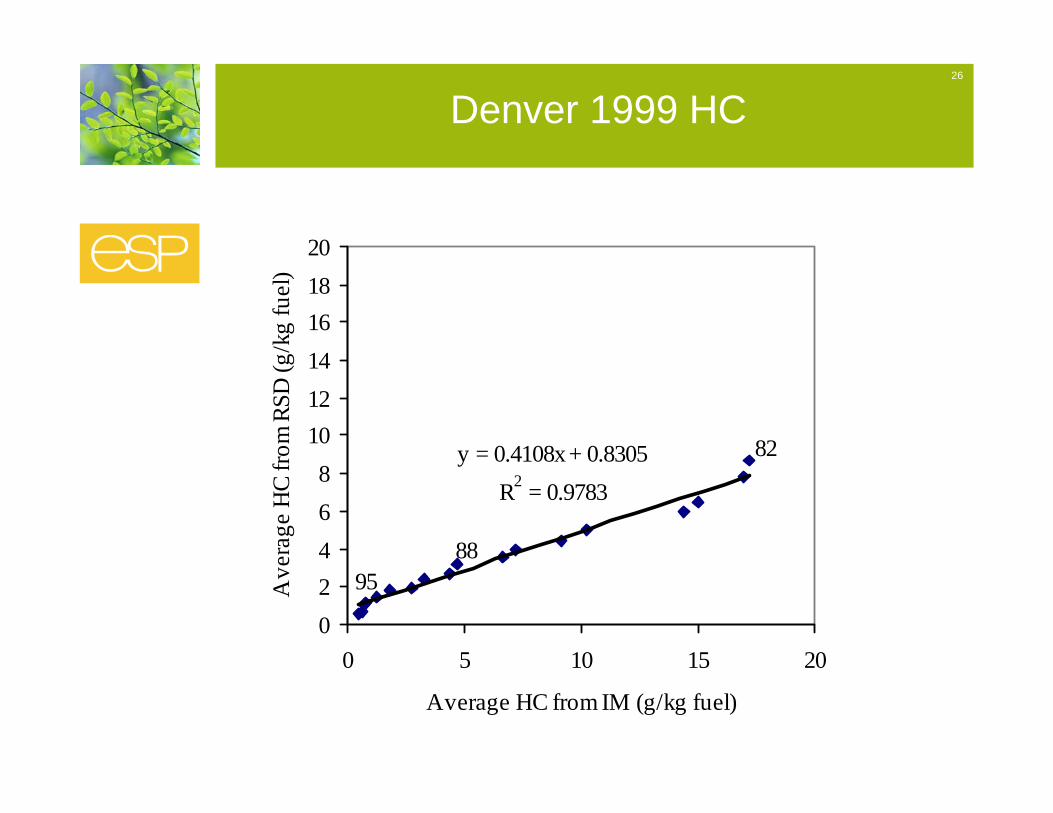
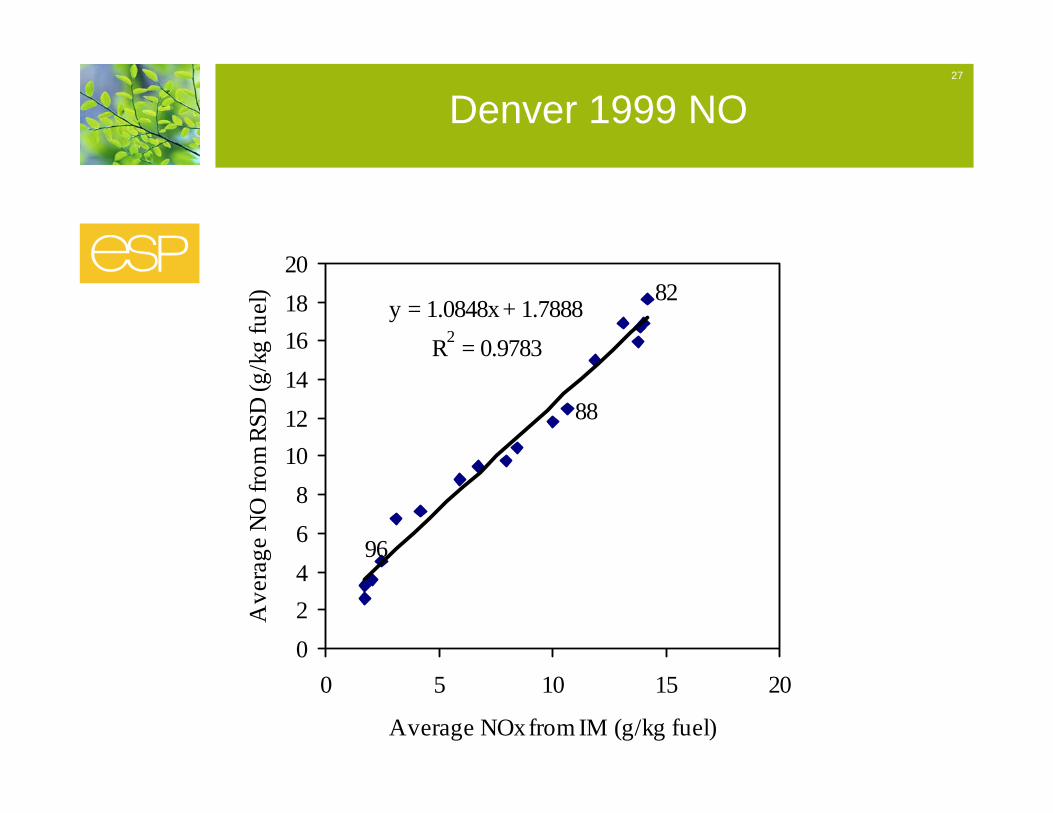
Proof that the on-road readings are correct
Excellent Correlation by MY to IM240, published and repeated in Chicago and Phoenix and other years.
25
Denver 1999 CO
y = 0.6785x + 14.003R2 = 0.9736
0
50
100
150
200
250
300
0 50 100 150 200 250 300
Average CO from IM (g/kg fuel)
Ave
rage
CO
from
RSD
(g/k
g fu
el)
82
88
95
26
Denver 1999 HC
y = 0.4108x + 0.8305R2 = 0.9783
02468
101214161820
0 5 10 15 20
Average HC from IM (g/kg fuel)
Ave
rage
HC
from
RSD
(g/k
g fu
el)
82
8895
27
Denver 1999 NO
y = 1.0848x + 1.7888R2 = 0.9783
02468
101214161820
0 5 10 15 20
Average NOx from IM (g/kg fuel)
Ave
rage
NO
from
RSD
(g/k
g fu
el) 82
88
96
28
Proof from Roadside Pullovers
Using a single remote sensor to pull over on-road high emitters, BAR found 83%-88% ASM failure rates on CO or HC or NO depending on the remote sensing cut point chosen.
At a 10,000 vehicle per day site, a very high cut point (top 1%)will fail 100 vehicles per day!
California Bureau of Automotive Repair, “Remote Sensing Device high emitter identification with confirmatory roadside inspection” Final Report 2001-06.
29
A few broken vehicles cause most of the emissions.
RSD is ideal for emissions inventory and to identify broken vehicles
30
Repeatability
Low emitters with good air/fuel ratio control have very repeatable emissions regardless of the test method.High emitters with poor air/fuel ratio control have very erratic emissions regardless of the test method."Motor Vehicle Emissions Variability", G.A. Bishop, D.H. Stedman, L. Ashbaugh, J. Air Waste Manage. Assoc., 46:667-675, 1996.
31
Gra
ms/
mile
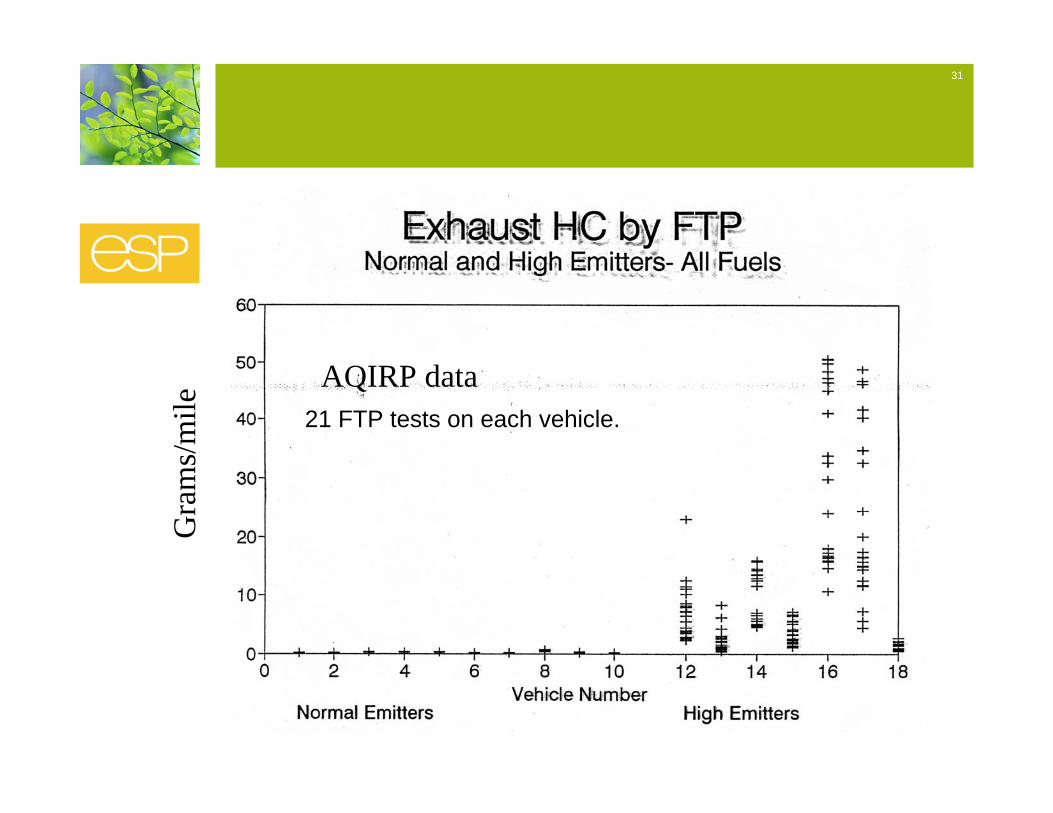
AQIRP data21 FTP tests on each vehicle.
32
Hit rates
Exact validity criteria for University of Denver data see CRC reports on our web site www.feat.biochem.du.eduHit-rate depends upon the exhaust plume magnitude (vehicle load, speed and engine size and measurement site) and software conservatism. With good sites we routinely observe a hit rate >96% on automobiles.With the folded optical beam system we observe >95% hit rate for 95 cc motorcycles.

33
Data analysis from India
Presented by Dr. Donald Stedman
34
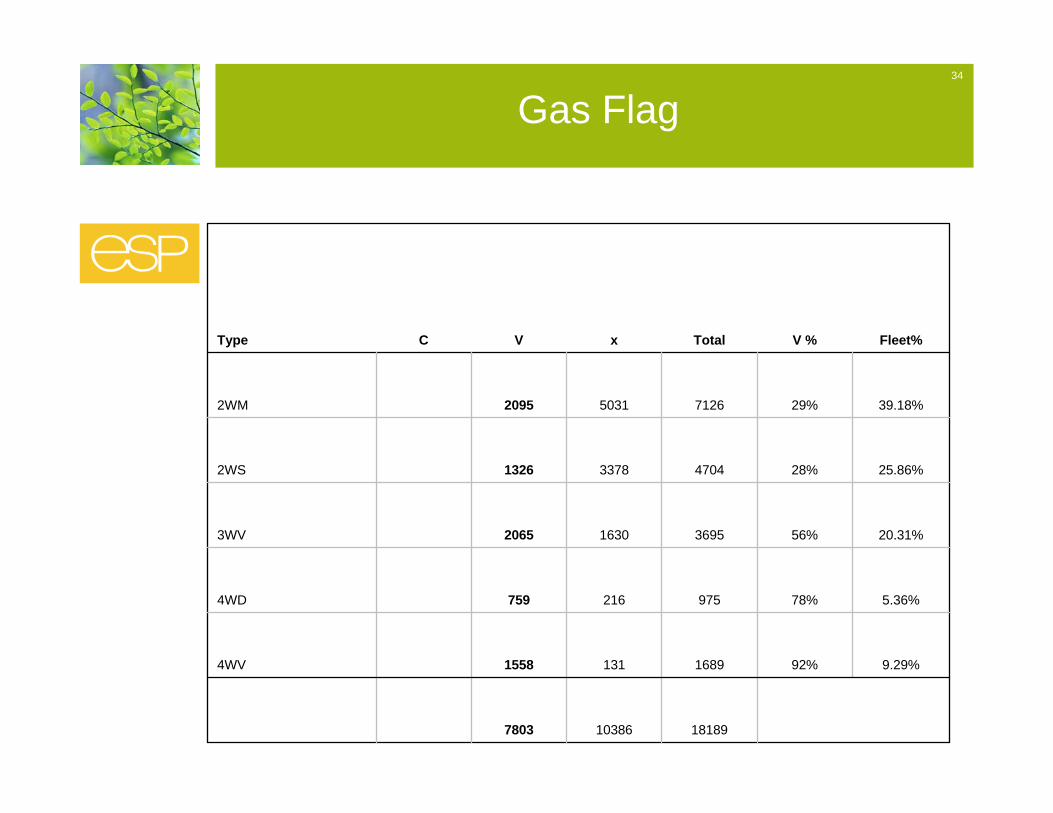
Gas Flag
18189103867803
9.29%92%168913115584WV
5.36%78%9752167594WD
20.31%56%3695163020653WV
25.86%28%4704337813262WS
39.18%29%7126503120952WM
Fleet%V %TotalxVCType
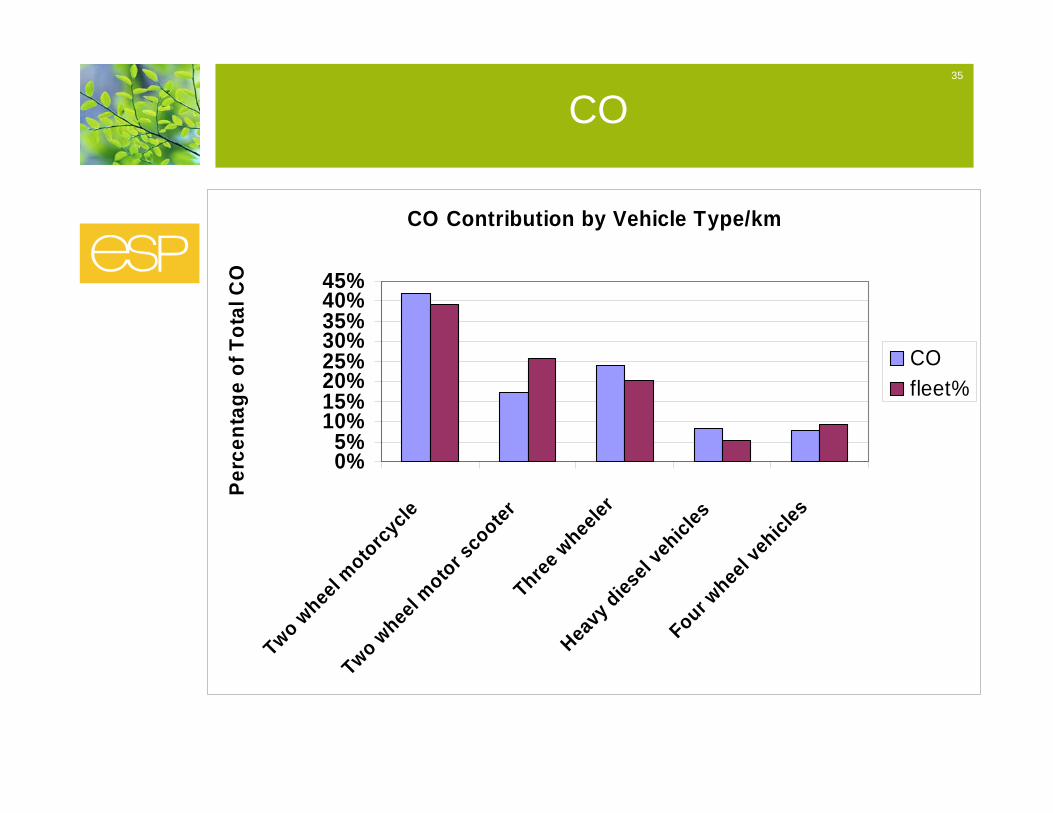
35
CO Contribution by Vehicle Type/km
0%5%
10%15%20%25%30%35%40%45%
Two whee
l motorcycle
Two wheel m
otor scooter
Three wheeler
Heavy diesel vehicles
Four wheel v
ehiclesPe
rcen
tage
of T
otal
CO
COfleet%
CO
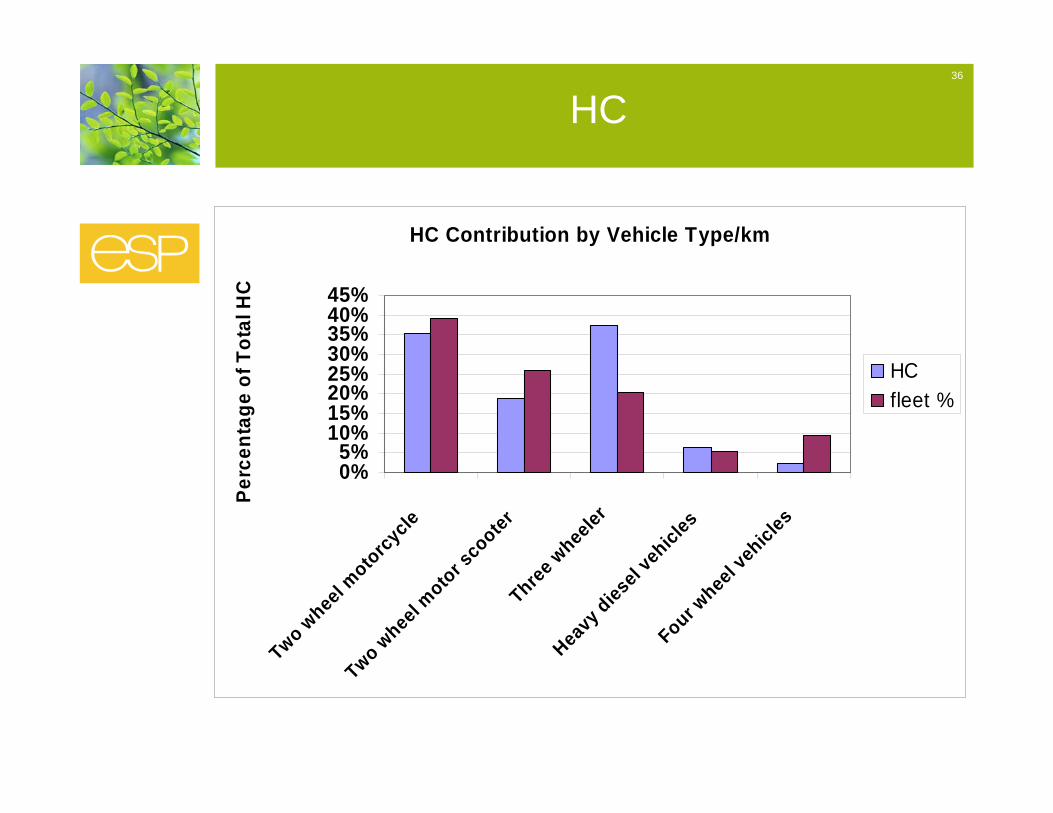
36
HC Contribution by Vehicle Type/km
0%5%
10%15%20%25%30%35%40%45%
Two wheel m
otorcycle
Two wheel m
otor scooter
Three wheeler
Heavy diesel vehicles
Four wheel v
ehiclesPe
rcen
tage
of T
otal
HC
HCfleet %
HC
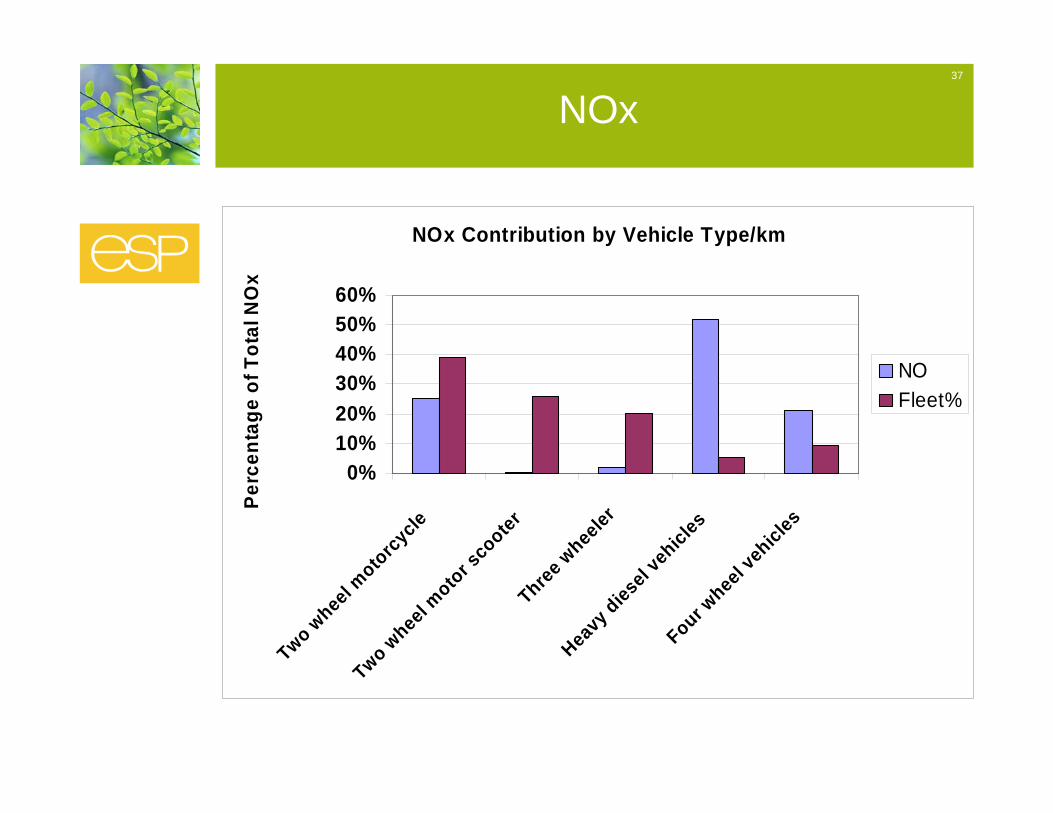
37
NOx Contribution by Vehicle Type/km
0%10%20%30%40%50%60%
Two wheel m
otorcycle
Two wheel m
otor scooter
Three wheeler
Heavy diesel vehicles
Four wheel v
ehiclesPe
rcen
tage
of T
otal
NO
x
NOFleet%
NOx
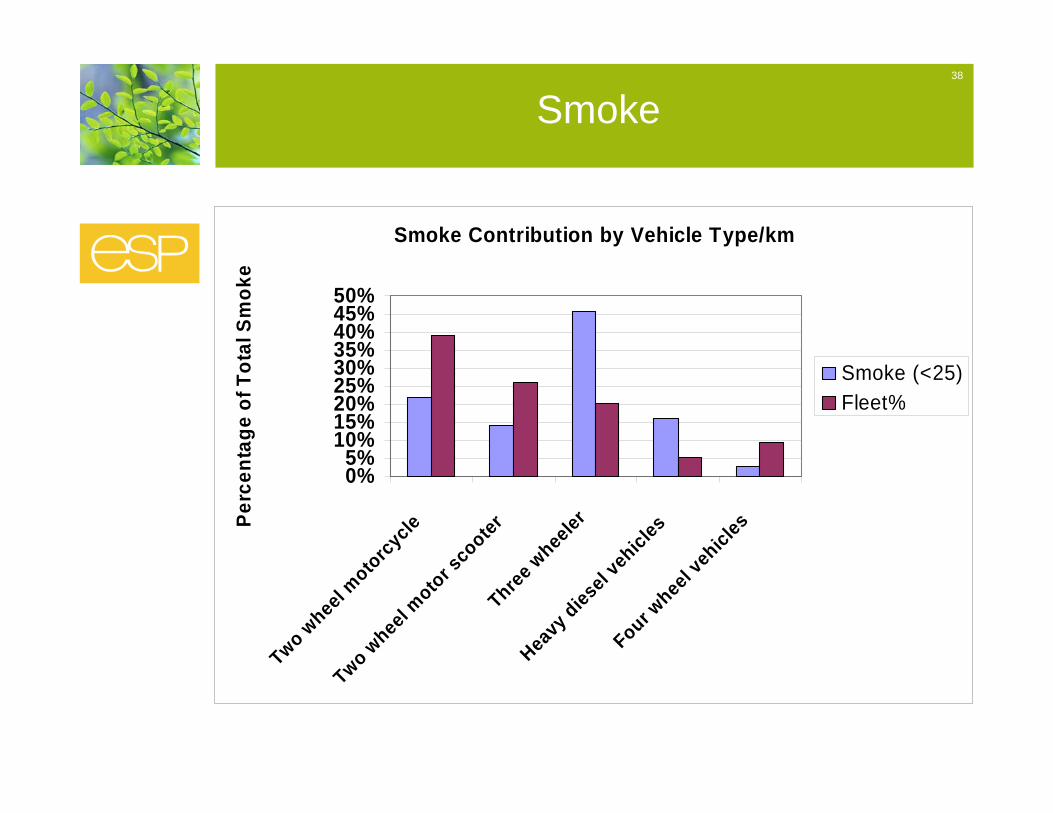
38
Smoke Contribution by Vehicle Type/km
0%5%
10%15%20%25%30%35%40%45%50%
Two wheel m
otorcycle
Two wheel m
otor scooter
Three wheeler
Heavy diesel vehicles
Four wheel v
ehiclesPerc
enta
ge o
f Tot
al S
mok
e
Smoke (<25)Fleet%
Smoke
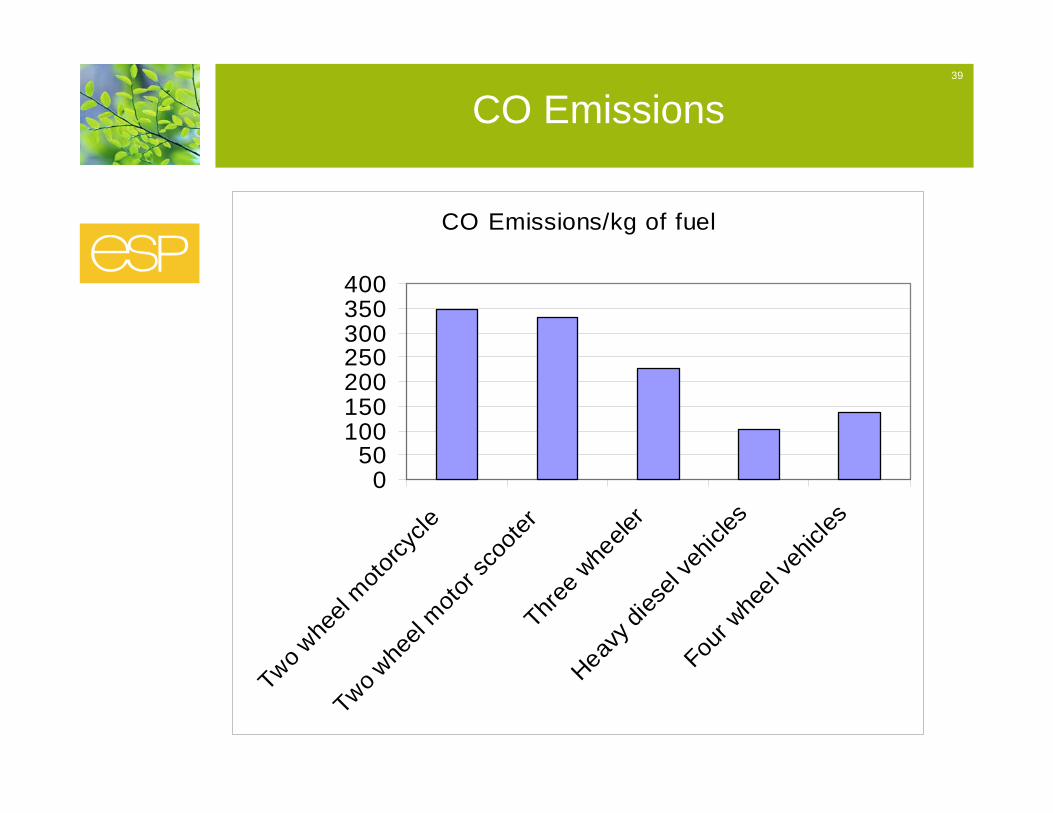
39
CO Emissions/kg of fuel
050
100150200250300350400
Two whe
el moto
rcycle
Two whe
el moto
r sco
oter
Three
whe
eler
Heavy d
iesel
vehic
les
Four w
heel v
ehicl
es
CO Emissions
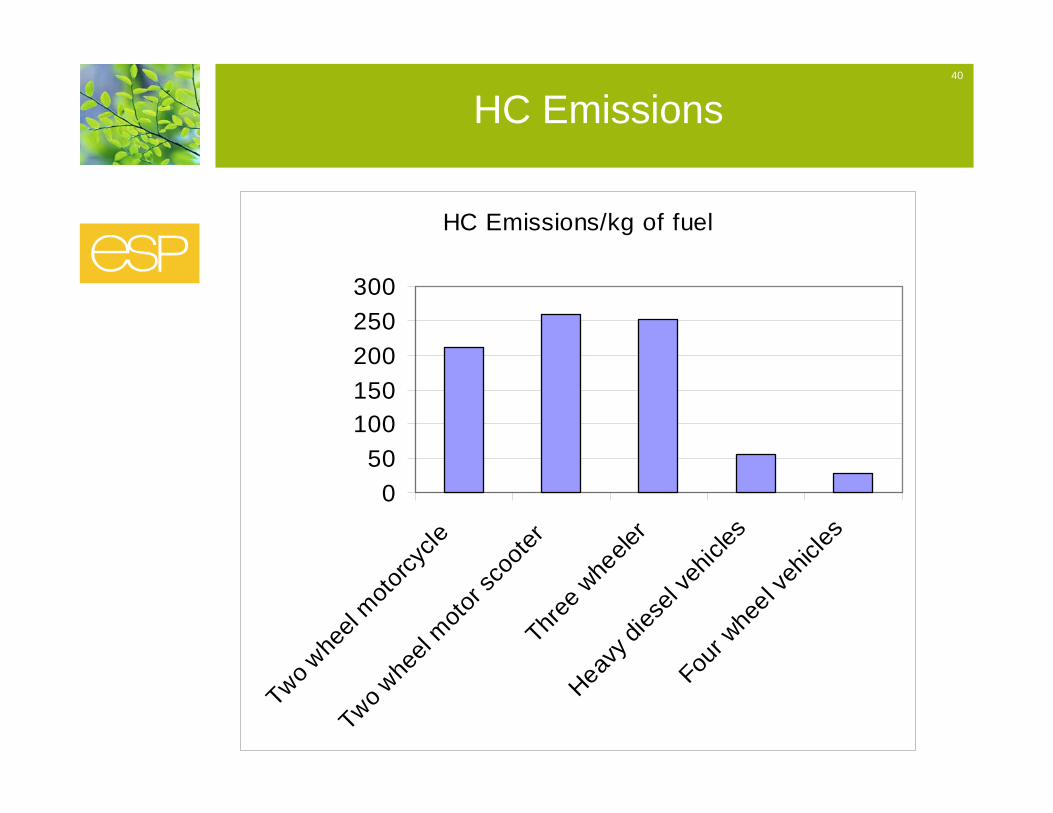
40
HC Emissions/kg of fuel
050
100150200250300
Two whe
el moto
rcycle
Two whe
el moto
r sco
oter
Three w
heele
r
Heavy d
iesel
vehic
les
Four w
heel v
ehicl
es
HC Emissions
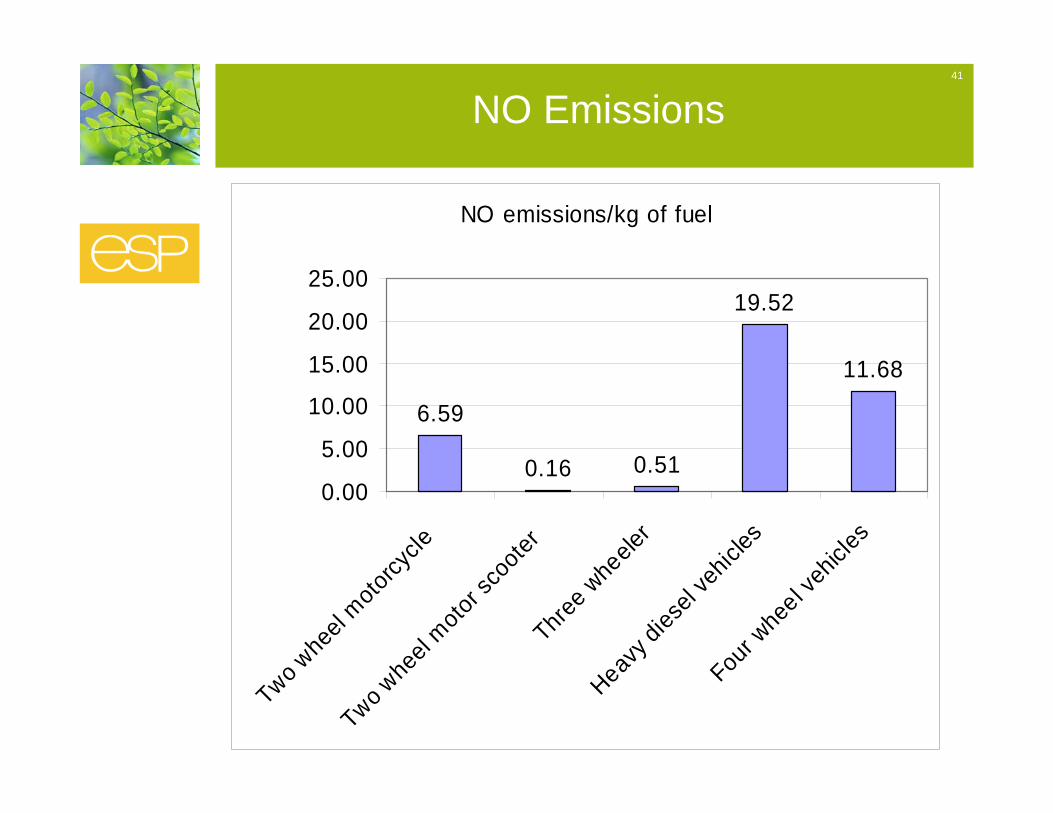
41
NO emissions/kg of fuel
6.59
0.16 0.51
19.52
11.68
0.00
5.00
10.00
15.00
20.00
25.00
Two whe
el moto
rcycle
Two whe
el moto
r sco
oter
Three w
heele
r
Heavy d
iesel
vehic
lesFou
r whe
el veh
icles
NO Emissions
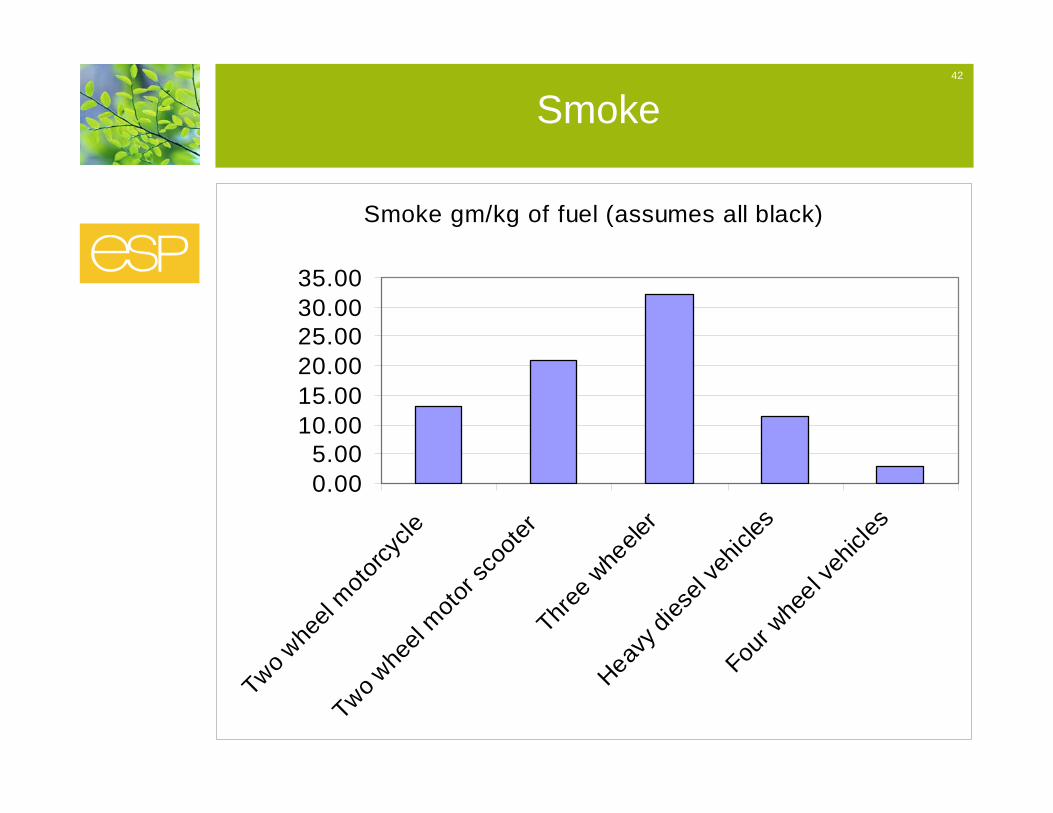
42
Smoke gm/kg of fuel (assumes all black)
0.005.00
10.0015.0020.0025.0030.0035.00
Two whe
el moto
rcycle
Two whe
el moto
r sco
oter
Three w
heele
r
Heavy d
iesel
vehic
lesFou
r whe
el veh
icles
Smoke
43
Improvements Necessary for Improved 2-wheeler measurement
Presented by Gary Full
44
1. Traffic Diversion
2-wheeler and 3-wheeler traffic must be diverted to a single file lane in which measurement equipment can be deployed.
45
2. Equipment Modification
Present technology equipment must be operable for measurements for path lengths of 3 to 5 meters.Present equipment is calibrated for measurement path lengths of 5 to 10 meters.
46
3. Loading Mechanism
Suggest that a portable ramp be deployed at the measurement station. 0.3 meter rise over a 3-meter length. Similar ramp down.
47
4. Multiple Analyzers
Two analyzers may be required deployed at two different heights to assure plume intersection with measurement beams.
48
Other Discussion
CutpointsCorrelations